Article

Energy Stored in Above-Ground Biomass Fractions and Model Trees of the Main Coniferous Woody Plants

1
Forest Research Institute, National Forest Centre, 960 01 Zvolen, Slovakia
2
Institute of Forest Ecology, Slovak Academy of Sciences, 960 53 Zvolen, Slovakia
3
Institute of Landscape Architecture, Slovak University of Agriculture in Nitra, 949 76 Nitra, Slovakia
*
Author to whom correspondence should be addressed.
Sustainability 2021, 13(22), 12686; https://doi.org/10.3390/su132212686
Submission received: 5 October 2021 / Revised: 12 November 2021 / Accepted: 12 November 2021 / Published: 16 November 2021
(This article belongs to the Topic Actions for Bioenergy and Biofuels: A Sustainable Shift)

Abstract

:
The paper considers energy stored in above-ground biomass fractions and in model trees of the main coniferous woody plants (Picea abies (L.) H. Karst., Abies alba Mill., Pinus sylvestris (L.), Larix decidua Mill.), sampled in 22 forest stands selected in different parts of Slovakia. A total of 43 trees were felled, of which there were 12 spruces, 11 firs, 10 pines, and 10 larches. Gross and net calorific values were determined in samples of wood, bark, small-wood, twigs, and needles. Our results show that these values significantly depend on the tree species, biomass fractions, and sampling point on the tree. The energy stored in the model trees calculated on the basis of volume production taken from yield tables increases as follows: spruce < fir < pine < larch. Combustion of tree biomass releases an aliquot amount of a greenhouse gas—CO2, as well as an important plant nutrient, nitrogen—into the atmosphere. The obtained data must be taken into account in the case of the economic utilization of energy stored in the fractions of above-ground tree biomass and in whole trees. The achieved data can be used to assess forest ecosystems in terms of the flow of solar energy, its accumulation in the various components of tree biomass, and the risk of biomass combustion in relation to the release of greenhouse gases.

1. Introduction

The country and its soil are considered highly important but limited resources both in Europe and worldwide, and are currently facing pressure from anthropogenic increases in greenhouse gases in the atmosphere of terrestrial ecosystems, climate change, and a loss of biodiversity. Landscape and soil management should therefore include environmental monitoring and measures aimed at reducing the release of industrial pollutants into the air, the gradual interconnection of green spaces to reduce landscape fragmentation, or expanding protected areas to preserve natural diversity.
A lack of multi-dimensional data is one of the major gaps which limits the knowledge and assessment possibilities of European forests. Nowadays, the most extensive and complete data on European forest statuses are provided by the National Forest Inventories, which provide information about the extent of forest resources and their composition and structure [1]. Forest inventory methods are the primary tools used to assess the current state and development of forests over time [2]. On the other hand, long-term experimental plots provide information on forest stand dynamics, which cannot be derived from forest inventories or small temporary plots [3]. By measuring the remaining as well as the removed stand, the survey of long-term experiments provides the total production at a given site, which is most relevant for examining the relationship between site conditions and stand productivity on one hand and between stand density and productivity on the other.
The assessment of above-ground biomass stocks in the coniferous forests of inland northwest USA is important both for the inventory of wood, bioenergy, and carbon, as well as for wildfire risk determination [4]. The use of bioenergy is increasing rapidly due to the need to reduce greenhouse gas emissions [5]. According to the above authors, tree biomass is characterized not only by its mechanical, physical, and chemical properties, but also by its energy content, which accumulates in the process of photosynthetic assimilation, and which can be released later. In the case of its wider use for energy purposes, it is necessary to know the energy content of both whole trees and their individual parts. The energy of the trees can be determined directly by the destruction method, by means of which the fresh and dry mass of the biomass fractions of individual trees is determined first, and then their calorific value.
The calorific value of plants is an important parameter for evaluating and indexing material cycles and energy conversion in forest ecosystems [6]. The effective heating value of wood correlates best with the lignin content, of inner bark with carbohydrates, and outer bark with carbohydrates and the extractives soluble in alkaline solvents [7]. A similar determination through the content of chemical elements C, H, N and S is reported by [8]. The determination of the heating value might be used thus as an indicator of the cellulose content of coniferous wood.
The most abundant data on biomass properties are found achieved in research on wood density which is usually associated with wood mechanical properties. Based on many literary sources, such a correlation has been derived for 103 tree species [9]. The lowest density is of soft deciduous species, followed by conifers and hard deciduous species. Some authors report that the density of wood varies not only with tree species but also with the vertical or radial position of the wood on the tree trunk and in the tree crown [10,11]. Wood density also depends on the width of tree rings [12,13], the proportion of spring and summer wood, and the tree age [14,15]. The density of wood of branches with bark is significantly higher than that of stem wood [16]. For more accurate calculations of the weight of the whole tree, however, in addition to its volume, it is necessary to know the density of all its components, specifically the density of the round-wood, its bark, and branches [17].
Partial data can also be found for the calorific value of individual biomass fractions. Data have been published on the calorific values of the stem wood, branches, and roots of the bark of spruce and beech trees [18], the calorific value of wood and cones of four coniferous trees [19], as well as on the relationship of the calorific value of fir wood and the width of the annual rings [20]. A very detailed study of the heating values of seven tree species was conducted in Finland [21].
Due to the high laboriousness of the method of destruction, it is not possible to process larger and more representative experimental material when researching the energy accumulated in the tree species of forest stands. It is therefore more accessible and efficient to build on existing knowledge on the amount of tree biomass, which is expressed in volume units in forestry. The generally known models of forest tree volume tables exist in the form of mathematical functions and simulate the volume of above-ground biomass of not only whole trees, but also their main parts, such as wood, bark, and branches with bark [22]. Therefore, they can be used effectively in the conversion about biomass volume to dry weight and subsequently to the energy reserve of the tree. For this purpose, it is necessary to know not only the calorific value of tree biomass, preferably according to its basic fractions, but also the density of tree biomass fractions.
Renewable energies are essential parts of the energy revolution in which the goal is to replace energy production from fossil fuels with those from renewable sources. There is a view that many of the available resources are not fully utilized (for example, the correct use of forest biomass, organic residues from agriculture, forestry or landscaping or residues from the animal breeding sector). In that sense, biomaterials are essential renewables which require changes in attitudes, visions, strategies, and activities, based on the principles of resource sharing [23].
However, studies pertaining to the utilization of forest biomass as a replacement energy source for fossil fuels are lacking. Forest biomass meets sustainability criteria and has significant potential for CO2 sequestration. Therefore, the effort to increase the forest cover of the country and of hectare wood stocks significantly contributes to increasing carbon stocks and sustainability of terrestrial ecosystems. This approach is essential if, by a concerted effort, we want to contribute to stop the process of destabilizing natural ecosystems and, consequently, of society due to climate change.
The aim of this study is to obtain data usable in the economic use of solar energy stored in the fractions of aboveground tree biomass, as well as in whole trees and forest stands of four main coniferous woody plants (spruce, fir, pine and larch) based on gross calorific values and basic densities of aboveground fractions of wood, bark, small-wood, twigs, needles, and volume production of forest stands. We hypothesize that the energy content of the biomass of coniferous woody species depends mainly on: (1) tree species, (2) the biomass fraction, (3) the density of the biomass fraction, (4) the sampling point on the tree, and (5) the tree developmental stage.
The obtained knowledge can be useful in assessing the flow of solar energy in forest ecosystems, the risks of accidental and deliberate forest fires, the burning of fossil fuels, climate change, and the possibility to achieve local and global carbon neutrality.

2. Materials and Methods

2.1. Data Collection and Sampling

The experimental material was obtained in 22 forest stands located in the Slovak territory (Figure 1), which covers a large part of the Western Carpathians. Most of the forest stands are located in central Slovakia, with others in western and eastern Slovakia. The growth conditions of sampled coniferous stands are provided in Table 1.
The forest stands situated at an altitude of 165–1070 m a.s.l. consist of the Norway spruce (Picea abies (L.) H.Karst.), Silver fir (Abies alba Mill.), Scots pine (Pinus sylvestris (L.)) and European larch (Larix decidua Mill.) (Table 2). The stands are on slopes of 25–60%, with the exception of most pine forests located on the plain. The production level of these stands is expressed by the site index, which is in the range of 24–42. This index represents the mean height of trees (m) that the stand would reach at the age of 100 years.
A total of 43 trees were felled in these stands, of which there were 12 spruces, 11 firs, 10 pines, and 10 larches (Table 2). A higher amount of spruce and fir trees were felled due to their higher representation in the forests of Slovakia. Based on their diameter, height and age, the majority of trees had the parameters of mature trees. The stands in which the trees were cut down are located at various exposures with a slope of 25–60%. Only in the case of pines did most plots have zero inclination.
The following samples were taken from each tree: three circular cut-outs (one from the trunk foot, another from the middle of the trunk, and a third from the middle part of the tree crown) divided into a wood and bark fraction (as there was not enough bark volume on the circular cut-outs, another bark was sampled from neighbouring places on the trunk); about 20–25 cm long cuttings thinner than 7 cm of small-wood (with bark) from the central part of the crown and twigs overgrown with green needles divided into needles and twigs after drying. The small-wood fraction was taken from the main (primary) branches that grow up directly from the trunk of the tree.
A total of 9 samples were taken from each tree (3 of wood, 3 of bark and another 3 of small-wood, twigs, and needles). The only exception was larch, from which no twigs and needles were taken. A total of 367 biomass samples were taken from 43 coniferous trees (129 from trunk bark, 129 from trunk wood, 43 from small-wood, 33 from twigs and 33 from needles).

2.2. Data Processing and Analysis

For calorimetric determination, bark, wood, small-wood, twigs, and needle samples were taken from 5 trees of each woody plant (spruce, fir, pine and larch). Samples smaller than 30 mm were dried at 103 ± 2 °C and ground using an SM 100 cutting mill (Retsch) with bottom sieves with 2 mm square holes and a circular filter to a size of approximately <1 mm at 1450 rpm for 5 min.
Gross calorific value was determined using an IKA C-4000 calorimeter (program C-402). Two determinations were performed on each sample with an accuracy of up to 120 J [26]. The elements C, H, N, and S necessary to calculate the net calorific value have been determined using CNS Flash EA 1112 from Thermo Finnigan. Two determinations per sample were performed to the C, H, N and to the S [27,28]. Oxygen content was obtained by subtracting the sum of the percentages of C, H, N, S, and ash from 100% [29]. Ash content was determined gravimetrically by combustion of samples in an electric muffle furnace at 500 °C in triplicate [30].

2.3. Statistical Analysis

The variability of the calorific value of basic biomass fractions within each of the examined species of coniferous woody plants and within each of the basic biomass fractions taken from different coniferous woody plants was evaluated using the program Statistica 9 (StatSoft, 2008). A one-way ANOVA test followed by a Fisher-LSD test was used to detect significant differences between observed characteristics. In the analysis of variance of the calorific values the tree species (spruce, fir, pine, larch) and the biomass fractions (bark, wood, small-wood, twigs, and needles) were used as factors. Results were expressed as mean ± standard deviation (SD). Differences between means were considered significant when they occurred at p < 0.05.

2.4. Calculation Procedures

The energy stored in the above-ground biomass of the mean trees of the studied coniferous species was calculated on the basis of the measured calorific values, tables of model volumes of trees [22], as well as the model density values for bark, wood, and small-wood [31]. Mathematical models of classical tree volume tables show the volume of whole trees v (m3) in relation to their diameters DBH (cm), heights h (m) and main components (round-wood with or without bark, bark, and small-wood). The volume tables do not contain twigs and needles. Therefore, their dry weight values, which depend on tree diameter and height, were taken from [32]. According to this source, for example, the fresh weight of needles for trees with a DBH of 40 cm and a height of 30 m is approximately 90 kg in the case of spruce, and 35 kg in the case of pine. The dry weight is approximately 42% of the fresh weight of spruce and pine. Spruce models were also taken for fir. The energy reserves of the trees at different stages of their development were then calculated according to the following formula:
CH DBH , h = v i · ρ i · CH i + m 0 · CH twne · 10 3
where: CH(DBH, h)—the energy reserve of the tree (GJ tree−1);
vi—the volume of i-th fraction (stem wood, stem bark, small-wood) taken over from the volume tables [22] (m3);
ρi—basic density of the i-th fraction taken from [31] (kg m−3);
CHi—the calorific value of the i-th fraction (MJ kg−1);
m0—the dry matter weight of the twigs and needles taken from [32] (kg);
CHtwne—the calorific value of the twigs and needles (MJ kg−1).
The dry weight of the above-ground biomass of the model trees at different stages of their development was calculated using equation (1), from which the items CHi and CHtwne representing the combustion heat were omitted. The same equation was also used for the calculation of dry weight of aboveground biomass of adult model trees (DBH 60 cm, h. 30 m).

3. Results

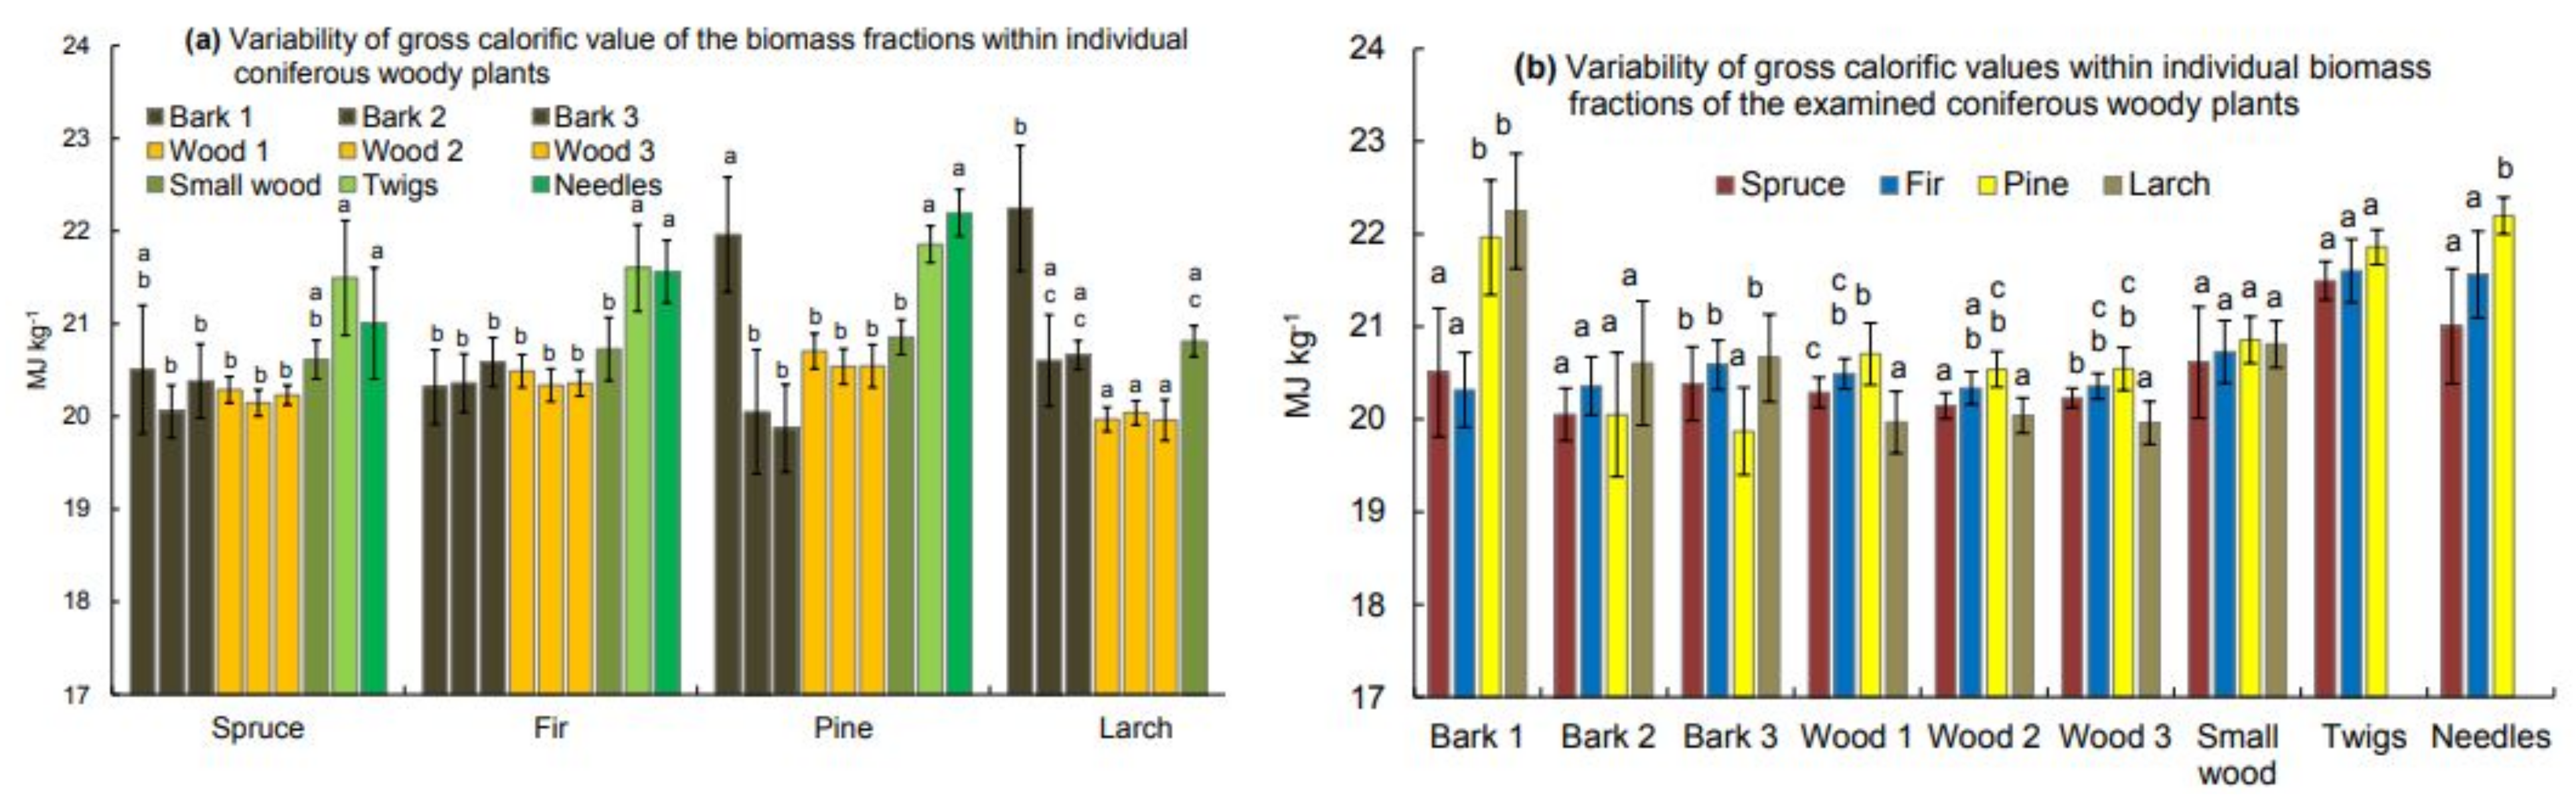
3.1. Gross Calorific Values of Biomass Fractions of Examined Woody Plants

The variability of the gross calorific values of the biomass fractions within individual coniferous woody plants is shown in Figure 2a. In the case of spruce, the lowest values were found in bark and wood taken from the middle part of the trunk and the highest in bark and wood taken from the base of the trunk. In general, however, spruce bark and wood have similar gross calorific values. The same can be said for the bark and wood fractions of fir. The gross calorific values of wood fractions taken from different parts of the tree trunk do not differ significantly. Larch wood has the lowest values. The values found for small-wood are slightly higher, but they are also very similar to each other. There is a significantly higher concentration of energy in the bark of pine and larch taken from the foot of the trunk, as well as in the twigs and needles of all examined woody plants. In contrast, the energy values of bark taken from the middle and crown part of pine trunk were the lowest of all woody plants.
The coefficients of variation of the gross calorific value of spruce and fir wood were in the range 0.5–0.9%, and in the range of 0.7–1.6% for pine and larch. The coefficients of variation of the gross calorific value of small-wood (0.8–1.7%) are very close to the trunk wood. In the case of bark (0.8–3.4%), the highest coefficients are approximately twice as high, especially in the bark of pine and larch. The coefficients of variations of twigs and needles range from 0.9 to 2.9%, these values being closer to the values found in the bark than in the wood.
The variability of gross calorific values within individual biomass fractions of the examined coniferous woody plants is shown in Figure 2b. The gross calorific values of bark taken from the foot of pine and larch trunks are significantly higher compared to the values of the equivalent spruce and fir bark. On the other hand, in the case of bark taken from the middle of the trunks and crowns of trees, the differences in the values of different woody plants were relatively small. The only exception was the significantly lower value of bark taken from the pine crown. Larch wood has the lowest gross calorific value regardless of the sampling point on the tree. Spruce wood has a slightly higher value, and the highest value was found for pine wood. Significant differences were found between the gross calorific values of pine wood compared to larch wood and spruce wood 1 and 2, and larch wood compared to spruce wood and fir wood 1 and 3. The gross calorific values of the small-wood of the examined woody plants did not differ much and were only slightly higher compared to the values found in the wood fractions. The gross calorific value of the needles increased markedly from spruce to pine, but the differences were not significant.
The variability of gross calorific values of the biomass fractions within individual woody plants is given in Table 3a. It can be seen that the gross calorific values of the spruce bark and wood, and the bark, wood and small-wood of fir and pine differ significantly from the values of twigs and needles. On the other hand, the gross calorific value of spruce small-wood is not significantly different from the values of the other spruce fractions. In the case of larch, the values of the bark and small-wood fractions are similar and significantly different from the values of the wood fraction.
The variability of gross calorific values within individual biomass fractions of investigated woody plants is provided in Table 3b. Twigs and needles have the highest values, and the lowest were found for wood. The values of spruce and fir bark are similar and significantly lower compared to the values of pine and especially larch bark. The same can be said for the wood fraction, with the exception of larch wood, which, on the other hand, has the absolute lowest energy value. The differences in values found for the small-wood and twig fractions of examined woody plants are not very large. The gross calorific values of spruce and fir needles are also similar, but significantly lower compared to the value of pine needles.
The coefficients of variation are in the range of 1–4%. Twigs, needles and small-wood have lower variability, and bark of larch and pine trees a higher one. It can be seen that wood with bark, and the twigs with needles of spruce and fir trees belong to the same set of the average calorific values. Pine wood and bark and the small-wood of all four species of conifers also have similar calorific values. The variability of calorific values is relatively small. The coefficients of variation are in the range of 1–4%. Twigs, needles and small-wood have lower variability and the bark of larch and pine a higher one. The significantly different gross calorific value was in the bark of larch trees.

3.2. Net Calorific Values of Biomass Fractions of Examined Woody Plants

An important indicator of biomass energy content is the net calorific value, which depends on the elemental composition, moisture content and ash content. The ultimate analysis of soft-wood species is generally 51% carbon, 42% oxygen, 6.3% hydrogen, 0.1% nitrogen and 0.02% sulphur. In hardwood, the C content is 49%, O 44%, H 6.2%, N 0.1%, and S 0.02% [29]. The differences are mainly due to different carbon content (main energy source) and different ash content (not combustible material). The net calorific values of basic biomass fractions of examined coniferous woody plants are in provided in Table 4.
The net calorific values depend on the content of biogenic elements (C, O, H, N) as well as S and ash in tree biomass. The most represented element was C (from 47.48% for larch wood to 53.35% for pine needles) followed by O (from 35.96% for pine needles to 46.42% for larch bark), H (from 5.87% for larch wood to 6.34% for pine twigs), N (from 0.08% for larch wood to 1.55% for pine needles) and S (from 0.02% for fir and pine bark to 0.13% for spruce and pine needles). The highest content of O, N and S was in twigs and needles, H in small-wood, twigs, or needles, while the content of C did not show any regularity. The highest ash content was in the needles of fir and spruce (3.50–4.42%), the lowest was always in the bark of examined woody plants (0.12–0.40%).
The net calorific values of examined woody plants range from a minimum of 18.078–20.527 MJ kg−1 to a maximum of 18.848–22.207 MJ kg−1 (Table 4). The highest values were found in twigs and needles. Average calorific values ranged from 18.843 to 21.157 MJ kg−1 and their variability was relatively low. The coefficient of variation ranged between 0.70–4.45% and reached the maximum values in the case of the bark fraction of the examined woody plants. The calorific values of the bark and wood of spruce, fir and pine trees are very similar. Significant differences occurred only in the case of larch. However, these values differed significantly from those found in small-wood, twigs, and needle fractions. Calorific values of small-wood fractions of spruce and pine significantly differ from all other fractions.

3.3. Dry Weight of Above-Ground Biomass Fractions of Model Trees

The dry weight and percentage of biomass fractions of the model trees of examined woody plants are given in Table 5. The proportion of the bark fraction reaches 4.8–16%, of wood 76–84%, of small-wood 5.5–8.2%, of twigs 0.2–2.5%, and of needles 2.6–5.5%. Larch and fir bark have the highest share, pine bark the lowest. Pine, on the other hand, has the largest share of the wood and small-wood fractions. Spruce, in turn, has the largest proportion of twigs and needles. The dry weight of larch and pine is the same and at the same time the absolute highest, and the weight of spruce is the lowest.
The dry weight of the above-ground biomass of the model trees of examined woody plants shown in Figure 3 is the sum of the dry weights of all fractions of their biomass, excluding larch twigs and needles.
The dry weight of larch biomass is highest, and of spruce lowest. This fact is mainly due to a higher basic density of larch wood by approximately 35% compared to spruce wood. The energy reserves of trees growing at medium-quality sites are significantly lower and the lowest are in the case of trees growing at the worst sites. At these sites, pine has the highest dry weight, while the order of weight of other species does not change.
The reliability of the determination of the energy stored in the tree depends on the variability of gross calorific values, basic densities, and volume of tree biomass fractions. However, it must be said that the relative proportion of tree biomass fractions will be the decisive factor in this case. Small trees have a significant share of small-wood, but large trees have a significant share of trunk wood. This is of crucial importance, as the wood of the trunk has the largest share, but also the lowest variability of calorific value.

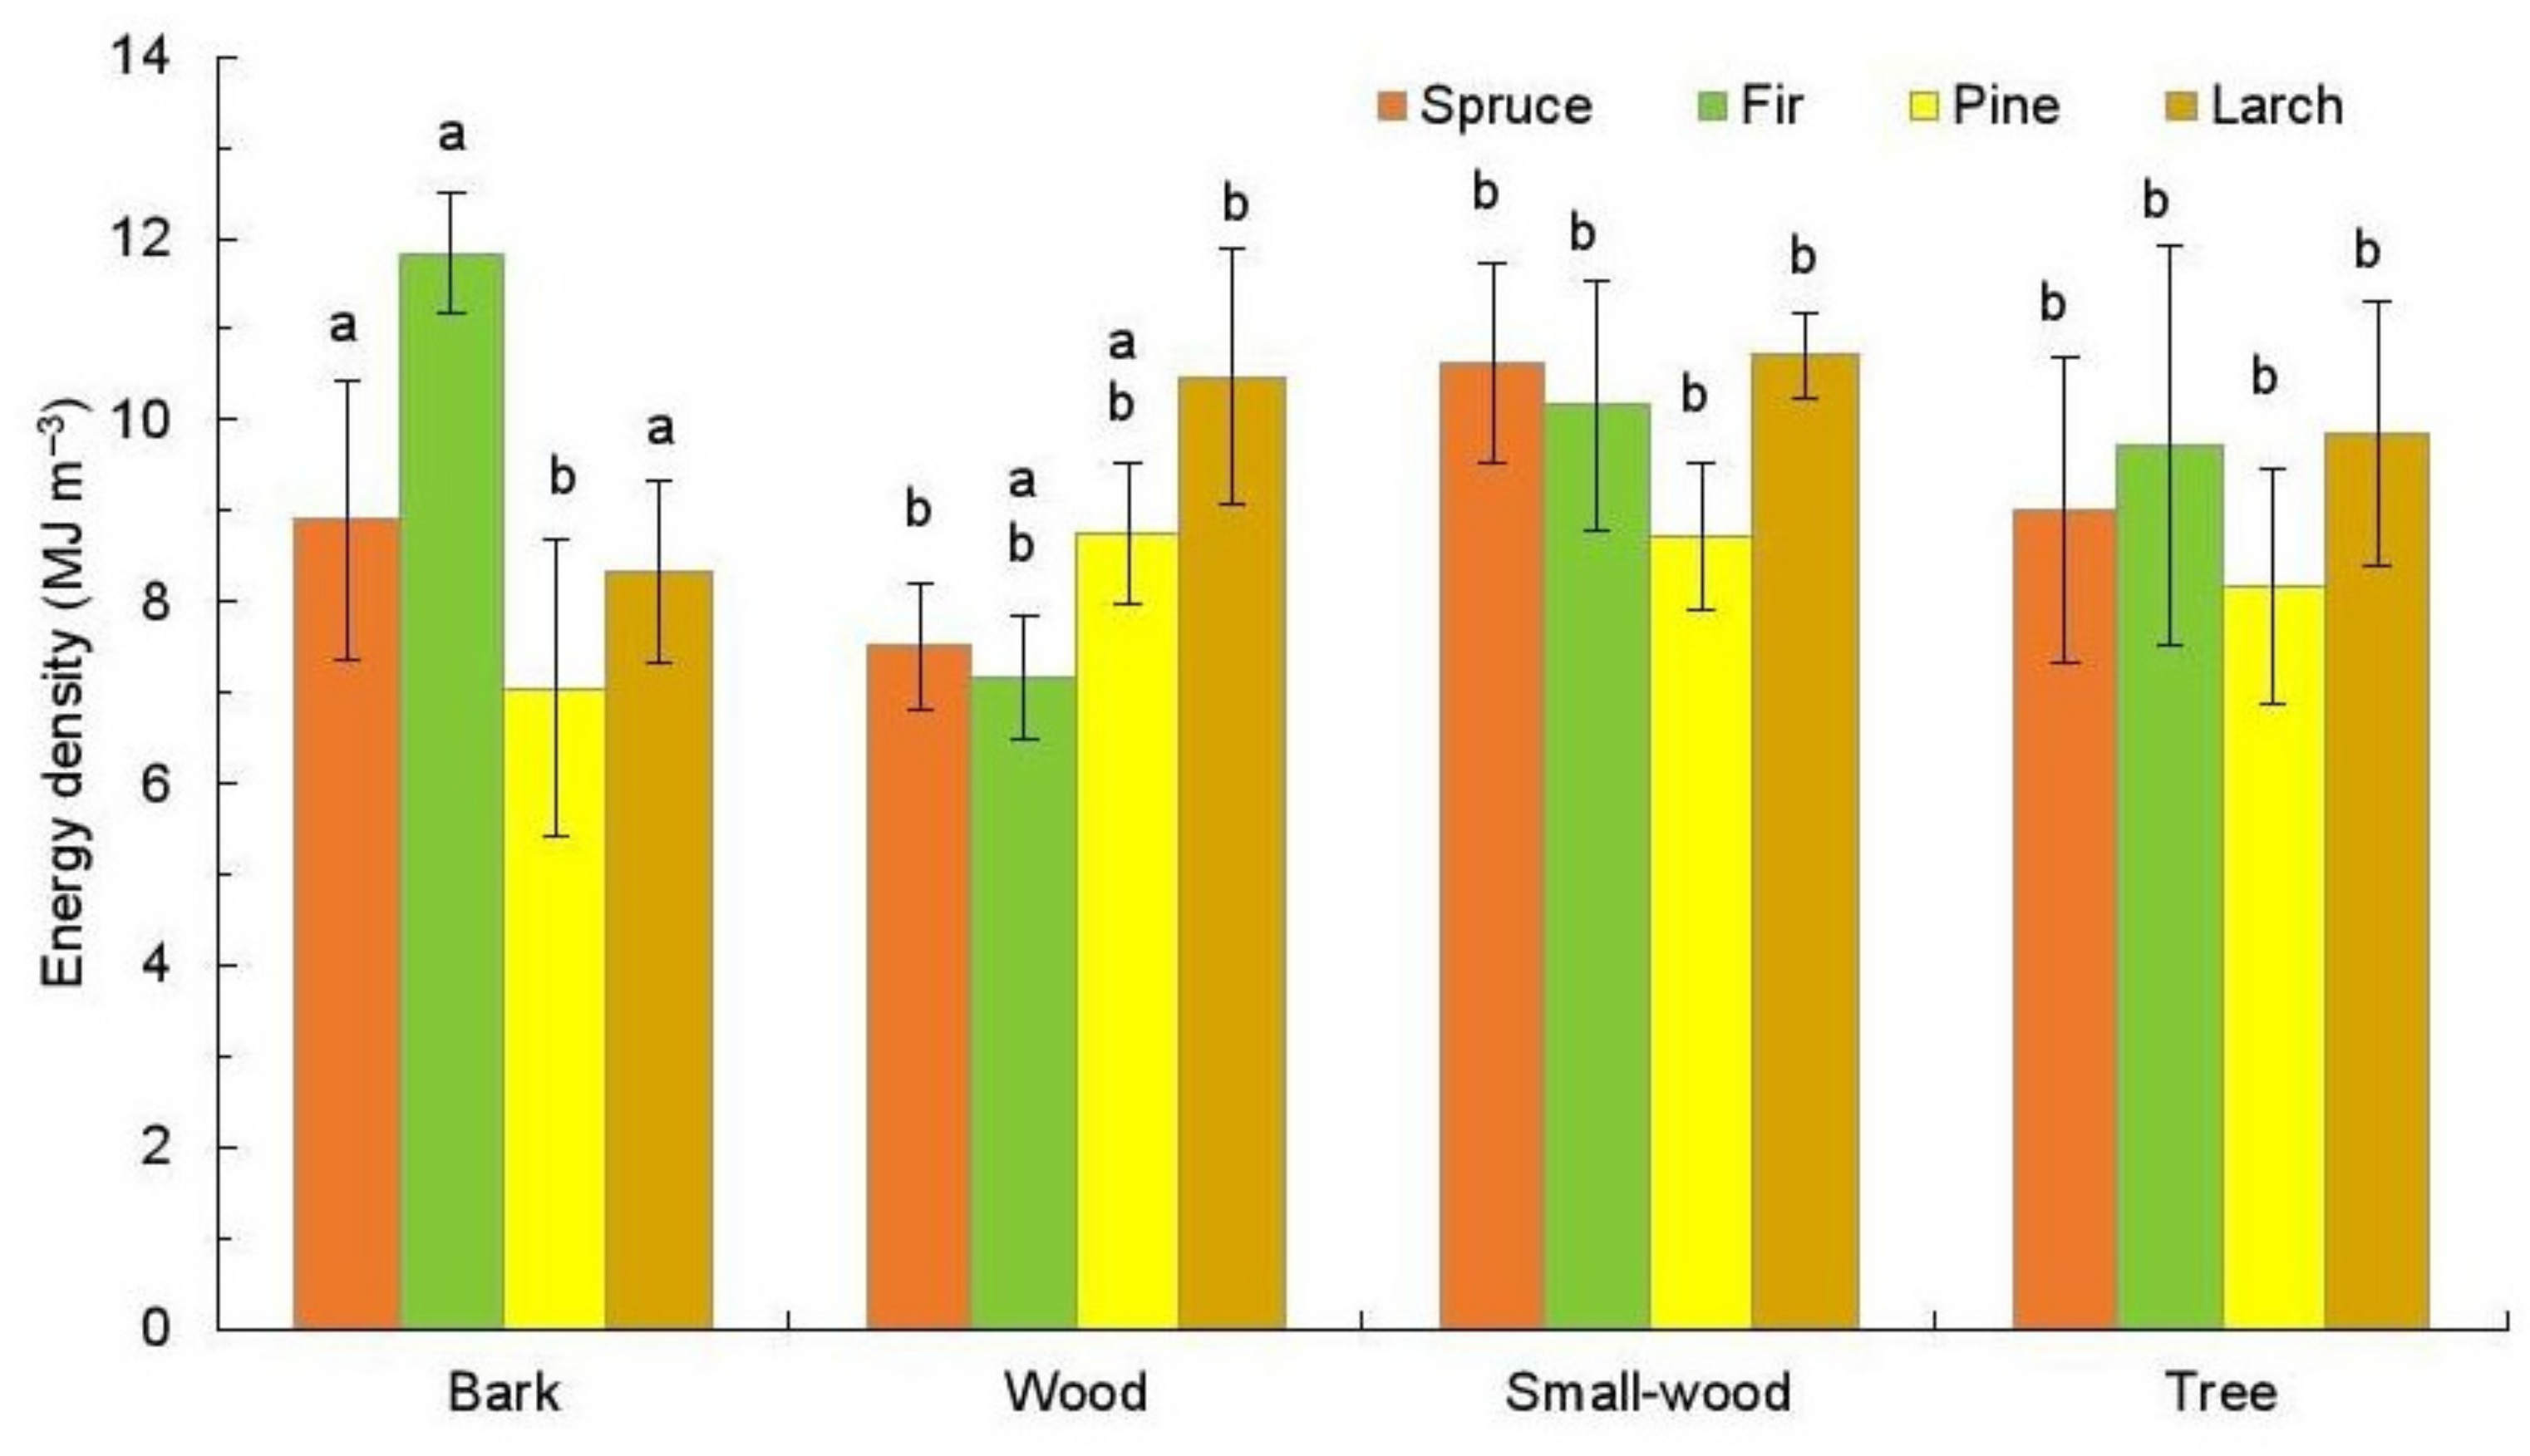
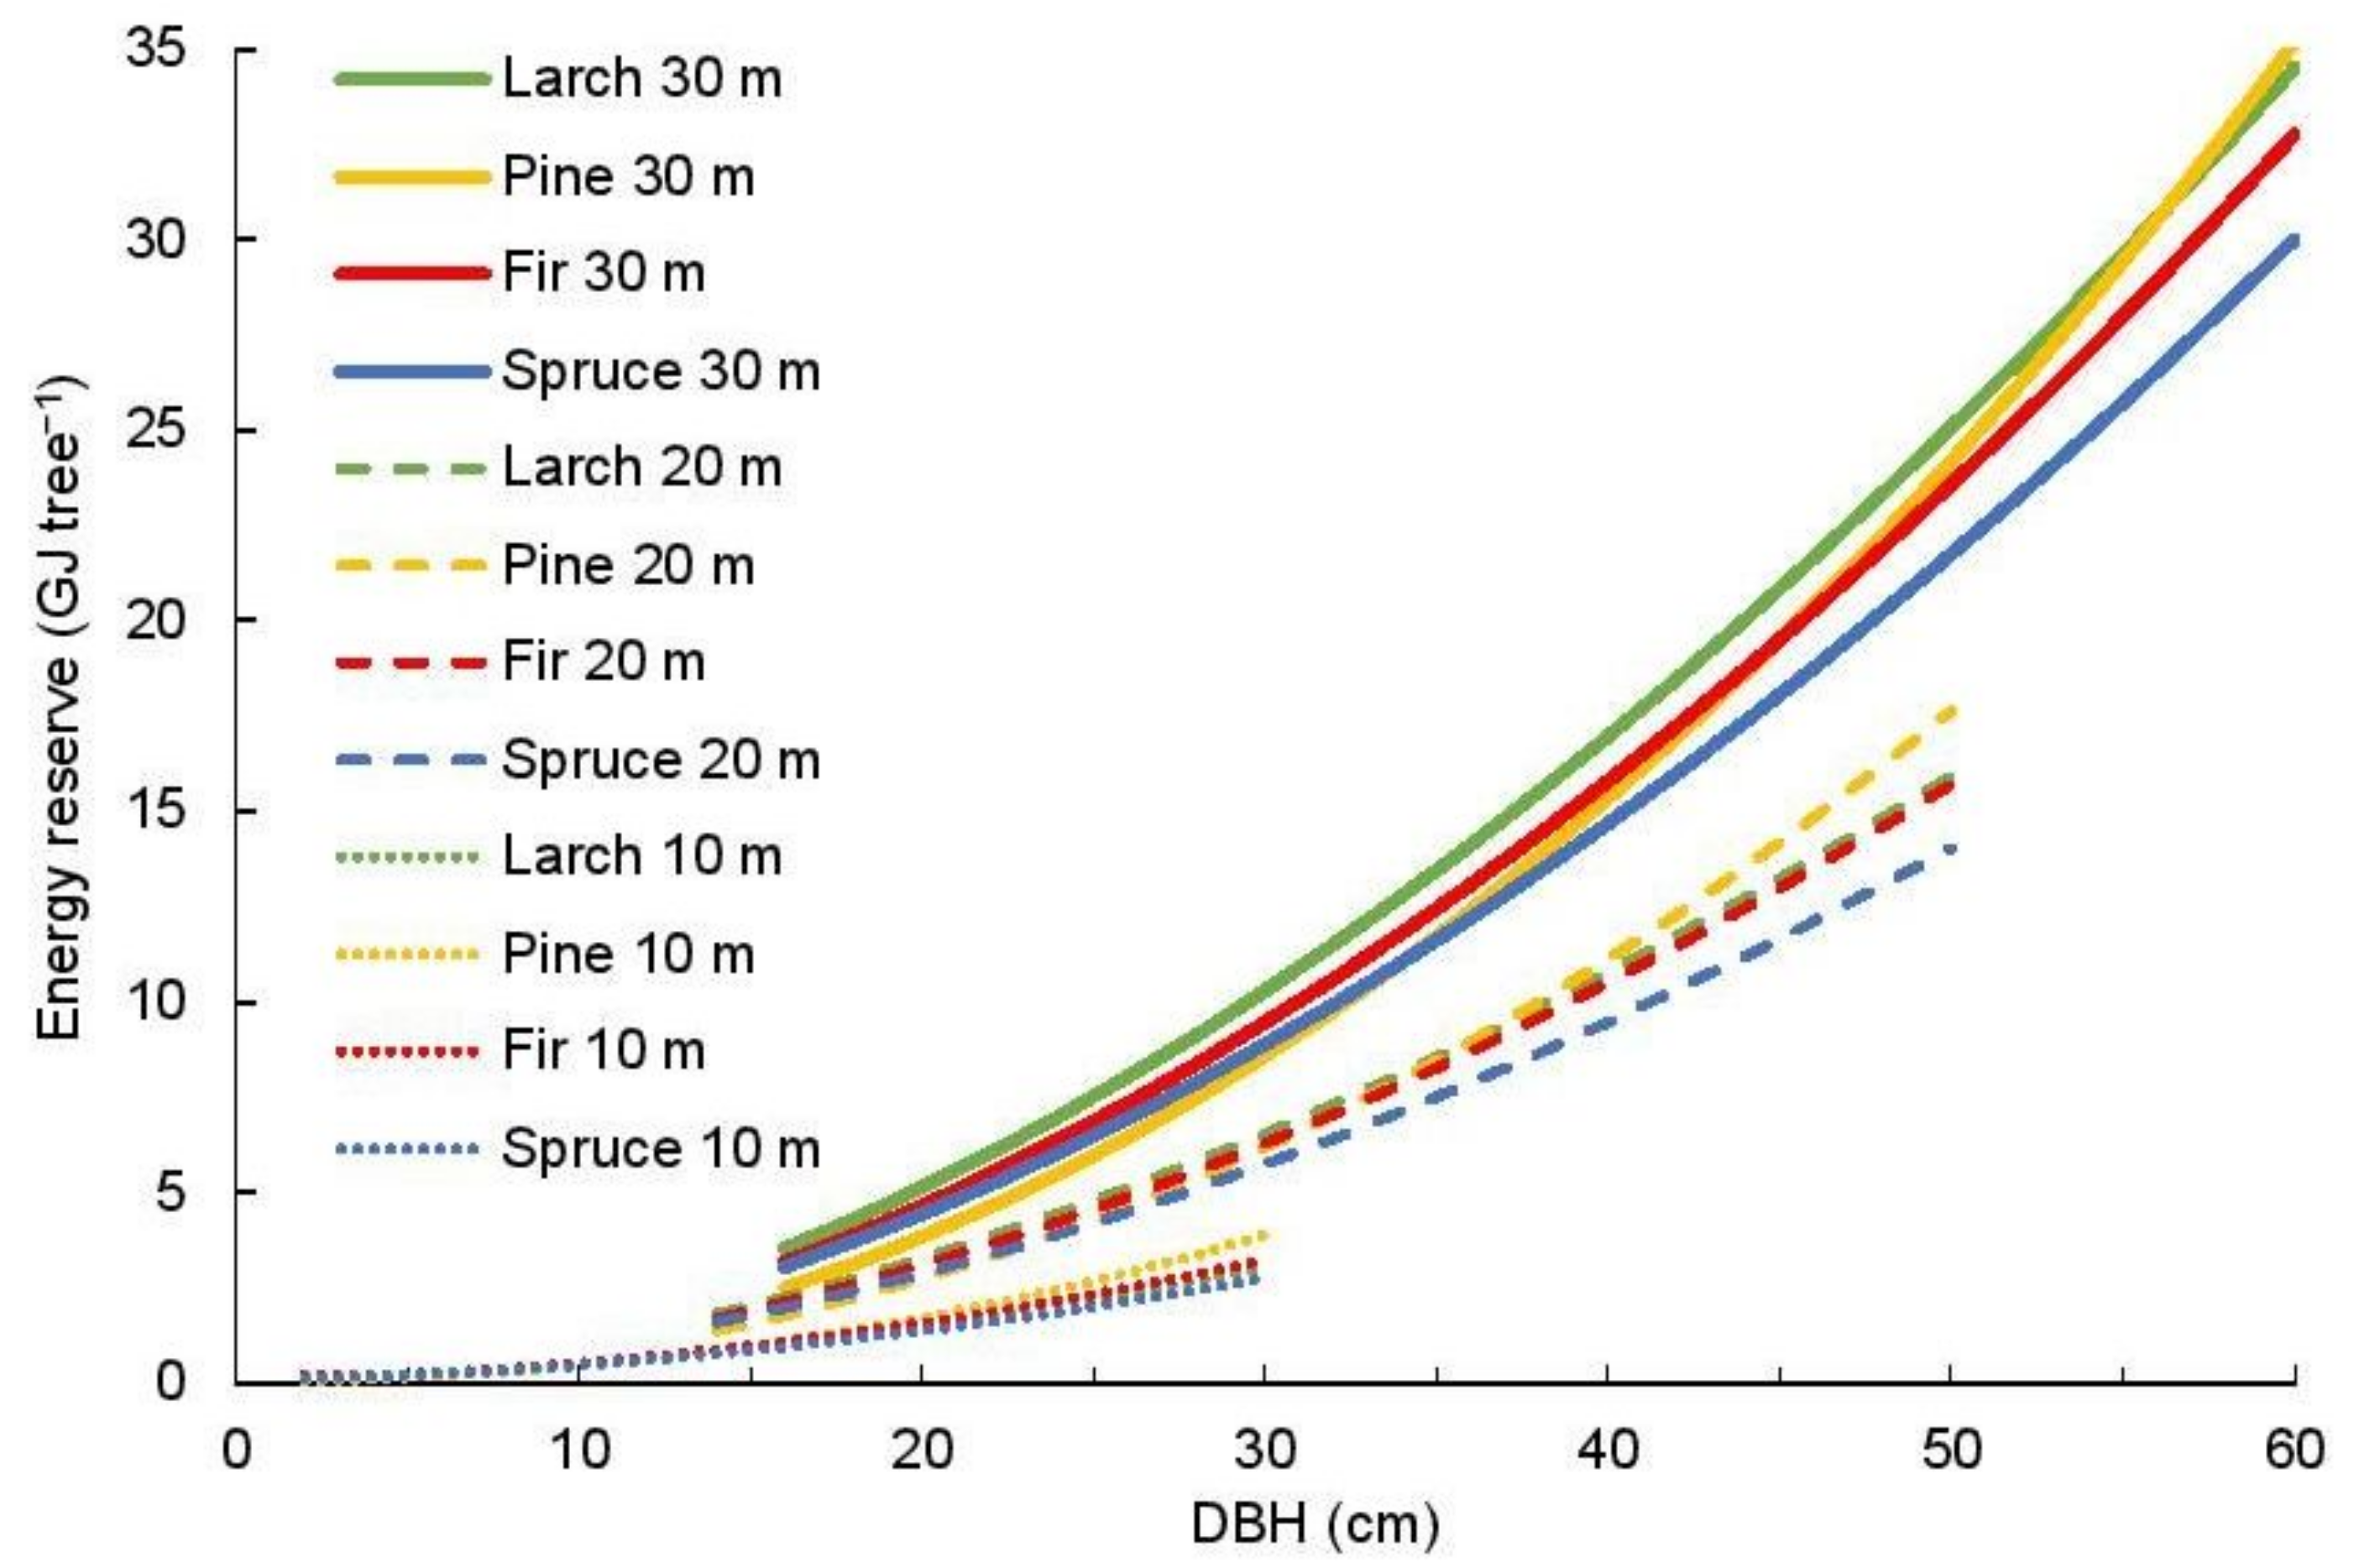
3.4. Energy Density of Above-Ground Biomass Fractions and of Model Trees

The energy density of the biomass fractions depends on their basic density and gross calorific value. Figure 4 shows the energy density of the basic biomass fractions and of the model trees of examined woody plants.
The average energy density of the above-ground biomass of pine is 8.18 GJ m−3, spruce 9.01 GJ m−3, fir and larch 9.73 and 9.84 GJ m−3, and for all examined woody plants is approximately 9.19 GJ m−3. The highest energy density was found in fir bark (almost 11.84 GJ m−3), the lowest in pine bark (7.05 GJ m−3) and fir wood (7.18 GJ m−3). On the other hand, the energy density of larch wood and small-wood of spruce, fir and larch reaches 10.16–10.72 GJ m−3. Higher energy density found in whole trees of fir and larch was due to the higher energy density of bark and small-wood (fir), and wood and small-wood (larch).
The energy reserves of above-ground biomass fractions and of model trees of examined woody plants are shown in Table 6. The energy reserve of pine bark is the lowest and that of larch bark the highest. The most energy is stored in wood fraction and small-wood fraction of pine, the least in the wood fraction and the small-wood fraction of spruce, and in twigs and needles of pine. The energy reserve of the model trees of examined woody plants ranges from about 30 GJ for spruce to 34–35 GJ for larch and pine.
The energy reserves of the examined woody plants are shown in Figure 5. The highest energy reserve is again in larch (similar to dry weight) and the lowest in fir and spruce. Since the differences in the calorific values of the basic biomass fractions of studied woody plants are not large, we can conclude that the higher energy content of larch trees may be caused by their higher oven-dry weight compared to other tree species.
The energy reserves of the examined woody plants are shown in Figure 5. The highest energy reserve is again in larch (similar to dry weight) and the lowest in fir and spruce. Since the differences in the calorific values of the basic biomass fractions of studied woody plants are not large, we can conclude that higher energy content of larch trees may be caused by their higher oven-dry weight compared to other tree species.
The carbon accumulated during photosynthesis forms a substantial part of the dry weight of the tree (Table 7). At C 12 and O 16 atomic weights, CO2 has a molecular weight of 44. It is thus 3.67 times heavier than carbon. With an average C content of 50.62–51.96%, the biomass of model trees (DBH 60 cm, h 30 m) of the studied woody plants contains from 744 kg C (spruce) to 867 kg C (pine).
Combustion of this biomass releases 2731–3182 kg of CO2 into the atmosphere, which is generally considered to be a significant greenhouse gas. At a density of 300 trees per 1 ha, 223–260 t C is accumulated in the tree biomass, the combustion of which releases 819–955 t CO2 into the air. At the same time, 21 to 47 kg of ash is produced. The highest proportion of ash is in spruce and pine wood (40.5–42.2 kg), the lowest in larch wood (18.8 kg). Nitrogen and sulfur are equally important for a living tree. By the burning of model trees there would be released from 1.99 kg N (larch) to 3.56 kg N (spruce, fir) into the air. Most N would be released from wood and needles. There is also most S in wood and needles. Its content in model trees varies from 0.49 kg (larch) to 1.26 kg (pine).

4. Discussion

The combustion heat values obtained in the present study are similar to those reported by other authors. The lowest combustion heat was found in wood and bark of all tree species, except for larch bark. The highest values were accumulated in the bark of larch and in needles of spruce, fir, and pine. Published calorific values for spruce biomass fractions are as follows (MJ kg−1): stem wood 19.048–19.083, stem bark 18.803–19.621, whole stem 19.022–19.161, wood of branches 19.432–20.052, bark of branches 19.870–20.390, crown (branches) 19.772–20.108, foliage 19.224–19.298, and whole tree 19.286–19.478 [7]. The calorific values determined by the author for the pine biomass fractions were slightly higher (MJ kg−1): stem wood 19.308–19.392, stem bark 19.529–19.981, whole stem 19.333–19.479, wood of branches 19.796–20.839, bark of branches 20.668–21.629, crown (branches) 20.234–20.873, foliage 20.800–20.950, and whole tree 19.525–19.763. The differences in the calorific values between different parts of the tree can be greater than the differences between species. Bark generally has a higher calorific value due to the high concentration of extractives and lignin. There is a large difference in the basic density between tree species and tree parts, and this difference results in differences in the heating value per unit volume. For example, the Norway spruce branches have considerably higher densities than the stem wood, whereas the bark in general has a lower density compared to the stem wood of Norway spruce and Scots pine [33].
The values that we found for spruce wood and bark (20.338 ± 318 kJ g−1) are near the lower end of the range for wood in stems, branches and roots (20.36–20.79 kJ g−1) and for bark (20.34–21.14 kJ g−1), as reported in [34]. On the other hand, the values reported by this author for needles and fine roots (20.74–20.79 kJ g−1) were slightly lower compared to our results (21.416 ± 537 kJ g−1 for needles and twigs). Other authors [35,36,37,38] determined calorific value for spruce wood in the range of 18.8–20.5 MJ kg−1. In the middle of this range are the average calorific values of the various stumps and root fractions of Norway spruce (19.0 and 19.3 kJ g−1) as reported by [38].
The gross calorific values of 20.08 ± 0.87 MJ kg−1 for Norway spruce, 20.79 ± 0.61 MJ kg−1 for the silver fir, 19.04 ± 0.70 MJ kg−1 for Scots pine, and 20.37 ± 0.48 MJ kg−1 for European larch are reported by [19]. The values reported for spruce and larch are only slightly higher, and those for fir and pine lower compared to our results. The calorific value of dry matter for European conifer species is 20.45 kJ g−1 [38].
As noted above, the gross calorific value of 19.04 ± 0.70 MJ kg−1 is reported for Scots pine [19]. Several authors determined calorific value for pine wood in the range of 19.2–21.2 MJ kg−1 [35,36,37,38,39]. These values are consistent with our results (20.612 ± 801 kJ g−1). The average calorific value of a pine cone is in the range of 17.81–19.86 MJ kg−1, but empty cones have a significantly higher calorific value and heat of combustion than the wood of spruce, larch and fir [40]. In the case of pine, cones and wood did not differ significantly. The calorific value of a pine cone was 18.78 MJ kg−1 and of pine needles 20.14 MJ kg−1 [41]. The last of the values is considerably lower compared to our findings (22.196 ± 253 kJ g−1 pine needles). For samples from the Pinus taeda stem the average combustion temperature was 20.0 MJ kg−1 and the variation range was 19.3 to 21.7 MJ kg−1 [42].
Closer to our results are the values for Pinus massoniana needles found by [43]. This author found the following ash-free calorific values in organs of Masson pines in order from the largest to the smallest: foliage (23.55 kJ g−1), branches (22.25 kJ g−1), stem bark (21.71 kJ g−1), stem wood (21.35 kJ g−1), and root (21.52 kJ g−1). All of these values are slightly higher than our results. The mean ash-free calorific value of a whole tree of Masson pine was 21.74 kJ g−1 [6]. The calorific value decreased in the following order: foliage > branch > stem bark > root > stem wood. This value increased from the top to the lower sections of the trunk. Mean calorific values of above-ground parts were significantly higher than those of belowground parts (roots).
The determined values of combustion heat are comparable also with the values found for conifers in North America [44]. The bark of nine principal commercial timber species of the Northern Rocky Mountains (Thuja plicata, Abies grandis, Larix occidentalis, Pinta monticola, Picea engelmannii, Pinus contorta, Tsuga heterophylla, Pseudotauga mensiesii, and Pinus ponderosa) had the highest average heating value and the lowest foliage level. The principal exception was Thuja plicata, wherein foliage had the highest average heating values and bark had the lowest. For bark, the average heating values ranged from the low of 20.16 MJ kg−1 for Thuja plicata to a high of 25.23 MJ kg−1 for Pseudotauga mensiesii (for all species, including all determinations, it was 22.01MJ kg−1). The range of average values for the twigs was from 20.26 MJ kg−1 for Thuja plicata to 23.32 MJ kg−1 for Pinus ponderosa (overall the average value was 21.48 MJ kg−1). For foliage, the average values ranged from 20.24 MJ kg−1 for Larix occidentalis to 22.40 MJ kg−1 for Thuja plicata (overall the average value was 21.67 MJ kg−1). These values do not differ much from our findings.
In the case of spruce, the energy reserve was affected by the density of the wood, if appropriate also the resin content. The calorific value of the resin is considerable and reaches a value of up to 36.87 kJ g−1 [34]. The heating value of liquid resin collected from mechanically injured southern pine trees reaches up to 34.0–37.8 MJ kg−1 [42]. This author found unusually high calorific values in the resin wood from the mature stumps of the ancient Pinus palustris. The average heat of combustion for samples from Pinus taeda stem wood was 20.0 MJ kg−1, and the range of variation from 19.3 to 21.7 MJ kg−1. Since conifers usually contain more lignin and resin than hardwoods, they tend to have slightly higher heating values per unit mass of stem wood.
For the same reason, in conifers the heating values are higher in foliage and branches than in stem wood, whereas in hardwoods the lignin content and heating value are slightly lower in branch wood [45]. The outer bark of birch wood also has an unusually high calorific value, which significantly exceeds, for example, the calorific value of the inner bark and needles [42]. In this case, however, this was due to the high suberin content.
The above data explain the higher content of the calorific value in spruce, fir, pine, and larch biomass compared to other, mainly deciduous, tree species. Trees have a stronger assimilation ability than shrubs and herbs, due to the greater leaf density and access to light [6]. Tree species are richer in energy than herbaceous species, and, in general, the energy content depends directly on the carbon content in each substance [46]. The higher fixed carbon content of a biomass feedstock, the higher the heating value [47]. Among the plant substances, the highest energy content is lignin (26.4 kJ g−1), lipids (38.9 kJ g−1) and terpenes (up to 46.9 kJ g−1).
The calorific value of tree biomass also depends on the content of other non-woody substances. These special structures accumulate high calorific components, such as fats and proteins, which increase calorific content of biomass to some extent [48,49]. Conifer species contain wax which is even higher in calories than in fats and proteins [50].

5. Conclusions

Forest biomass is currently one of the important sources of renewable energy. The indicator of its amount is the gross and net calorific value, which depends mainly on the content of biogenic elements, moisture, and ash. The stated values, together with the values of the basic density and biomass volume taken from the yield tables, make it possible to determine both the energy density of the above-ground biomass fractions and the energy reserves of model trees and whole stands.
From the woody plants examined in this work, larch wood has the absolute lowest gross calorific value, with slightly higher values in spruce, fir and pine wood, and the highest values in larch bark and in twigs and needles of other tree species. The dry weights of larch and pine are the same and the absolute highest, and of spruce the lowest. The average energy density of the above-ground biomass of the examined woody plants decreases as follows: pine > spruce > fir > larch. The highest value was found for fir bark and the lowest for pine bark. With the same dimensions of model trees, spruce has the lowest energy reserve and larch and pine have the highest, similar to dry weight.
In this work, we focused mainly on the study of energy accumulated in above-ground fractions of four main woody plants forming the basis of coniferous stands in Slovakia. The data obtained can be useful both in planning the economic use of energy stored in the above-ground fractions of tree biomass, as well as in whole trees and stands. They can also be used in the evaluation of forest ecosystems in terms of solar energy flow, its accumulation in the individual components of tree biomass, and the risks of forest fires. Belowground biomass has not been studied in this work, so in the future it will be necessary to also focus on this issue in order to evaluate the whole cycle of storage and release of solar energy in coniferous forest ecosystems.

Author Contributions

Conceptualization, J.K. and R.P.; methodology, J.K., M.K., J.M. and R.P.; software, R.P. and M.K.; validation, J.K., R.P. and M.P.; formal analysis, M.P., D.K. and M.R.; investigation, R.P., J.M. and M.K.; resources, R.P., M.K., and M.R.; data curation, J.K. and I.P.; writing—original draft preparation, R.P.; writing—review and editing, J.K. and I.P.; visualization, J.K., M.K., M.P. and I.P.; supervision, J.K.; project administration, D.K., I.P. and J.M.; funding acquisition, R.P., M.R., M.P. and M.K. All authors have read and agreed to the published version of the manuscript.

Funding

This research was funded by the Slovak Research and Development Agency (under the contract no. APVV-16-0344 and APVV-20-0326), the Scientific Grant Agency of the Ministry of Education of Slovak Republic and Slovak Academy of Sciences (project VEGA no. 2/0009/21) and the Cultural and Educational Grant Agency of the Ministry of Education, Science, Research and Sport of the Slovak Republic (project KEGA 021SPU-4/2019).

Institutional Review Board Statement

Not applicable.

Informed Consent Statement

Not applicable.

Data Availability Statement

Not applicable.

Conflicts of Interest

The authors declare no conflict of interest.

References

  1. Galluzzi, M.; Giannetti, F.; Puletti, N.; Canullo, R.; Rocchini, D.; Bastrup-Birk, A.; Chirici, G. A plot-level exploratory analysis of European forest based on the results from the BioSoil Forest Biodiversity project. Eur. J. For. Res. 2019, 138, 831–845. [Google Scholar] [CrossRef]
  2. Hill, A.; Buddenbaum, H.; Mandallaz, D. Combining canopy height and tree species map information for large-scale timber volume estimations under strong heterogeneity of auxiliary data and variable sample plot sizes. Eur. J. For. Res. 2018, 137, 489–505. [Google Scholar] [CrossRef] [Green Version]
  3. Pretzsch, H.; Del Río, M.; Biber, P.; Arcangeli, C.; Bielak, K.; Brang, P.; Dudzińska, M.; Forrester, D.I.; Klädtke, J.; Kohnle, U.; et al. Maintenance of long-term experiments for unique insights into forest growth dynamics and trends: Review and perspectives. Eur. J. For. Res. 2019, 138, 165–185. [Google Scholar] [CrossRef] [Green Version]
  4. Affleck, D.L.R. Above-ground biomass equations for the predominant conifer species of the Inland Northwest USA. For. Ecol. Manag. 2019, 432, 179–188. [Google Scholar] [CrossRef]
  5. Hytönen, J. Biomass, nutrient content and energy yield of short-rotation hybrid aspen (P. tremula × P. tremuloides) coppice. For. Ecol. Manag. 2018, 413, 21–31. [Google Scholar] [CrossRef]
  6. Zeng, W.S.; Tang, S.Z.; Xiao, Q.H. Calorific values and ash contents of different parts of Masson pine trees in southern China. J. For. Res. 2014, 25, 779–786. [Google Scholar] [CrossRef]
  7. Nurmi, J. Heating values of the above ground biomass of small-sized trees. Acta For. Fenn. 1993, 236, 1–30. [Google Scholar] [CrossRef] [Green Version]
  8. Dzurenda, L.; Pňakovič, Ľ. The influence of the combustion temperature of the non-volatile combustible wood matter of de-ciduous trees upon ash production and its properties. Acta Fac. Xylol. 2016, 58, 95–104. [Google Scholar]
  9. Niemz, P.; Sonderegger, W. Untersuchungen zur Korrelation ausgewählter Holzeigenschaften untereinander und mit der Rohdichte unter Verwendung von 103 Holzarten [Investigations on the correlation of selected wood properties with each other and with the bulk density using 103 species of woody plants]. Schweiz. Z. Forstwes. 2003, 154, 489–493. [Google Scholar]
  10. Husch, B.; Beers, T.W.; Kershaw, J.A. Forest Mensuration, 4th ed.; John Wiley & Sons: New York, NY, USA, 2003; 447p. [Google Scholar]
  11. Repola, J. Models for vertical wood density of Scots pine, Norway spruce and birch stems, and their application to determine average wood density. Silva Fenn. 2006, 40, 673–685. [Google Scholar] [CrossRef] [Green Version]
  12. Petty, J.A.; Macmillan, D.C.; Steward, C.M. Variation of density and Growth Ring Width in Stems of Sitka and Norway Spruce. Forestry 1990, 63, 39–49. [Google Scholar] [CrossRef]
  13. Vavrčík, H.; Gryc, V. Analysis of the annual ring structure and wood density relations in English oak and Sessile oak. Wood Res 2012, 57, 573–580. [Google Scholar]
  14. Wimmer, R. Beziehungen zwischen Jahrringparametern und Rohdichte von Kiefernholz [Relationships between tree ring parameters and density of pine wood]. Holzforsch. Holzverwert. 1991, 43, 79–82. [Google Scholar]
  15. Fabisiak, E.; Drogoszewski, B.; Kocjan, H.; Marcinkowska, A.; Molinski, W.; Roszyk, E. Selected physical properties of larch wood (Larix decidua Mill.) from plantation. For. Wood Technol. 2003, 53, 90–95. [Google Scholar]
  16. Gryc, V.; Horáček, P.; Šlezingerová, J.; Vavrčík, H. Basic density of spruce wood with bark. and bark of branches in locations in the Czech Republic. Wood Res 2011, 56, 23–32. [Google Scholar]
  17. Petráš, R.; Mecko, J.; Neuschlová, E. Density of basic components of above-ground biomass of poplar clones. Wood Res 2010, 55, 113–122. [Google Scholar]
  18. Pretzsch, H. Forest Dynamics Growth and Yield. From Measurement to Model; Springer: Berlin/Heidelberg, Germany, 2009; 664p. [Google Scholar]
  19. Aniszewska, M.; Gendek, A.; Zychowicz, W. Analysis of selected physical properties of conifer cones with relevance to energy production efficiency. Forests 2018, 9, 405. [Google Scholar] [CrossRef] [Green Version]
  20. Wasik, R.; Michalec, K. Comparative analysis of the calorific value of giant fir timber (Abies grandis Lindl.) from various stands in southern Poland. Acta Sci. Pol.—Silvarum Colendarum Ratio Ind. Lignaria 2012, 11, 65–76. [Google Scholar]
  21. Nurmi, J. Heating values of mature trees. Acta For. Fenn. 1997, 256, 1–28. [Google Scholar] [CrossRef] [Green Version]
  22. Petráš, R.; Pajtík, J. Sústava česko-slovenských objemových tabuliek drevín [System of Czech-Slovak volume tables of woody plants]. For. J. 1991, 37, 49–56. [Google Scholar]
  23. D’Adamo, I.; Morone, P.; Huisingh, D. Bioenergy: A Sustainable Shift. Energies 2021, 14, 5661. [Google Scholar] [CrossRef]
  24. Zlatník, A. Přehled Slovenských Lesů Podle Skupin Lesních Typů [Overview of Slovak Forests by Groups of Forest Types]; VŠZ: Brno, Czechoslovakia, 1959; 195p. [Google Scholar]
  25. Zlatník, A. Přehled skupin typů geobiocénů původně lesních a křovinných [Overview of groups of types of geobiocoenes originally forest and shrubby in the C.S.S.R.]. Zprávy Geogr. úst. ČSAV Brno 1976, 13, 55–64. [Google Scholar]
  26. STN EN ISO 18125. Solid Biofuels—Determination of Calorific Value. Office for Standardization; Vestník ÚNMS SR 10/17; Metrology and Testing of the Slovak Republic: Bratislava, Slovakia, 2017; 56p. [Google Scholar]
  27. STN EN ISO 16948. Solid Biofuels—Determination of Total Content of Carbon, Hydrogen and Nitrogen; Vestník ÚNMS SR 10/15; Office for Standardization, Metrology and Testing of the Slovak Republic: Bratislava, Slovakia, 2016; 9p. [Google Scholar]
  28. STN EN ISO 16994. Solid Biofuels—Determination of Total Content of Sulfur and Chlorine; Vestník ÚNMS SR. č. 11/16; Office for Standardization, Metrology and Testing of the Slovak Republic: Bratislava, Slovakia, 2016; 11p. [Google Scholar]
  29. Telmo, C.; Lousada, J.; Moreira, N. Proximate analysis, backwards stepwise regression between gross calorific value, ultimate and chemical analysis of wood. Bioresour. Technol. 2010, 101, 3808–3815. [Google Scholar] [CrossRef] [PubMed]
  30. STN EN ISO 18122. Solid Biofuels— Determination of Ash Content; Vestník ÚNMS SR11/16; Office for Standardization, Metrology and Testing of the Slovak Republic: Bratislava, Slovakia, 2016; 6p. [Google Scholar]
  31. Petráš, R.; Mecko, J.; Krupová, D.; Slamka, M.; Pažitný, A. Above-ground biomass basic density of softwoods tree species. Wood Res. 2019, 64, 205–212. [Google Scholar]
  32. Petráš, R.; Košút, M.; Oszlányi, J. Listová biomasa stromov smreka, borovice a buka [Leaf biomass of spruce, pine and beech trees]. For. J. 1985, 31, 121–136. [Google Scholar]
  33. Hakkila, P. Utilization of Residual Forest Biomass; Springer Series in Wood Science; Springer: Berlin/Heidelberg, Germany, 1989; 568p. [Google Scholar]
  34. Ellenberg, H. Vegetation Ecology of Central Europe, 4th ed.; Strutt, G.K., Ed.; Cambridge University Press: Cambridge, UK, 1973; 756p. [Google Scholar]
  35. Günther, B.; Gebauer, K.; Barkowski, R.; Rosenthal, M.; Bues, C.-T. Calorific value of selected wood species and wood products. Eur. J. Wood Wood Prod. 2012, 70, 755–757. [Google Scholar] [CrossRef]
  36. So, C.L.; Eberhardt, T. A mid-IR multivariate analysis study on the gross calorific value in longleaf pine: Impact on correlations with lignin and extractive contents. Wood Sci. Technol. 2013, 47, 993–1003. [Google Scholar] [CrossRef]
  37. Stolarski, M.; Szczukowski, S.; Tworkowski, J.; Krzyżaniak, M.; Gulczyński, P.; Mleczek, M. Comparison of quality and pro-duction cost of briquettes made from agricultural and forest origin biomass. Renew. Energy 2013, 57, 20–26. [Google Scholar] [CrossRef]
  38. Uri, V.; Aosaar, J.; Varik, M.; Becker, H.; Kukumägi, M.; Ligi, K.; Pärn, L.; Kanal, A. Biomass resource and environmental effects of Norway spruce (Picea abies) stump harvesting: An Estonian case study. For. Ecol. Manag. 2015, 335, 207–215. [Google Scholar] [CrossRef]
  39. Runge, M. Energieumsätze in den Biozönosen terrestrischer Ökosysteme. Untersuchungen im “Sollingprojekt” [Energy Turnover in the Biocenoses of Terrestrial Ecosystems. Investigations in the “Solling Project”]; Scripta Geobotanica 4; Verlag Erich Goltze KG: Göttingen, Germany, 1973; 74p. [Google Scholar]
  40. Aniszewska, M.; Gendek, A. Comparison of heat of combustion and calorific value of the cones and wood of selected forest trees species. For. Res. Pap. 2014, 75, 231–236. [Google Scholar] [CrossRef] [Green Version]
  41. Font, R.; Conesa, J.A.; Moltó, J.; Muñoz, M. Kinetics of pyrolysis and combustion of pine needles and cones. J. Anal. Appl. Pyrolysis 2009, 85, 276–286. [Google Scholar] [CrossRef] [Green Version]
  42. Howard, E.T. Heat of combustion of various southern pine materials. Wood. Sci. 1973, 5, 194–197. [Google Scholar]
  43. Guan, L.L.; Zhou, X.Y.; Luo, Y. A review on the study of plant caloric value in China. Chin. J. Ecol. 2005, 24, 452–457. [Google Scholar]
  44. Kelsey, R.G.; Shafizadeh, F.; Lowery, D.P. Heat Content of Bark, Twigs, and Foliage of Nine Species of Western Conifers. Forestry, Paper 69, 1979. USDA Forest Service, Research Note INT-261. 1979. Available online: https://digitalcommons.usu.edu/govdocs_forest/69 (accessed on 20 August 2020).
  45. Harris, R.A. Fuel values of stems and branches in white oak, yellow-poplar and sweetgum. For. Prod. J. 1984, 34, 25–26. [Google Scholar]
  46. Larcher, W. Physiological Plant Ecology: Ecophysiology and Stress Physiology of Functional Groups; Springer: Berlin/Heidelberg, Germany, 2003. [Google Scholar]
  47. Nelson, N.; Darkwa, J.; Calautit, J.; Worall, M.; Mokaya, R.; Adjei, E.; Kemausuor, F.; Ahiekpor, J. Potential of Bioenergy in Rural Ghana. Sustainability 2021, 13, 381. [Google Scholar] [CrossRef]
  48. Sinclair, T.R.; Vadez, V. Physiological traits for crop yield improvement in low N and P environments. Plant Soil 2002, 245, 1–15. [Google Scholar] [CrossRef]
  49. Qu, G.; Wen, M.; Guo, J. [Energy accumulation and allocation of main plant populations in Aneurolepidium chinense grassland in Songnen Plain]. Ying Yong Sheng Tai Xue Bao = J. Appl. Ecol. 2003, 14, 685–689. [Google Scholar]
  50. Jin, Z.X.; Li, J.M.; Ma, J.E. Ash content and caloric value in the leaves of Sinocalycanthus chinensis and its accompanying spe-cies. Acta. Ecol. Sin. 2011, 31, 5246–5254. [Google Scholar]
Figure 1. Location of examined coniferous stands.
Sustainability 13 12686 g001
Figure 2. Variability of gross calorific values (a) ANOVA, Fischer LSD test; spruce: F(8, 36) = 6.1397, p = 0.0001; fir: F(8, 36) = 13.950, p = 0.0001; pine: F(8, 36) = 23.228, p = 0.0001; larch: F(6, 28) = 27.058, p = 0.0001. (b) 1—on the tree foot, 2—at the middle of the stem, 3—at the middle of the crown; ANOVA, Fischer LSD test; bark 1: F(3, 16) = 13.11, p = 0.0001; bark 2: F(3, 16) = 1.65, p = 0.2171; bark 3: F(3, 16) = 5.33, p = 0.0098; wood 1: F(3, 16) = 10.79, p = 0.0004; wood 2: F(3, 16) = 9.29, p = 0.0009; wood 3: F(3, 16) = 9.10, p = 0.0010; small-wood: F(3, 16) = 1.09, p = 0.4107; twigs: F(2, 12) = 0.81, p = 0.4696; needles: F(2, 12) = 9.91, p = 0.0029. Significantly different mean values (p < 0.05) are indicated by different letters.
Sustainability 13 12686 g002
Figure 3. Oven-dry weight of the above-ground biomass of the model trees of examined woody plants depending on their diameter (DBH) and height (10, 20, 30 m).
Sustainability 13 12686 g003
Figure 4. Variability of energy density of above-ground biomass fractions and of model trees. Significantly different mean values (p < 0.05) are indicated by different letters.
Sustainability 13 12686 g004
Figure 5. The energy reserves of above-ground biomass of the model trees of the examined woody plants depending on their diameter (DBH) and height (10, 20, 30 m).
Sustainability 13 12686 g005
Table 1. Geobiocoenological classification of stands of examined woody plants (in the sense of [24,25]).
Woody PlantVegetation
Grade
Edaphic-Hydric
Order
Edaphic-Trophic
Order
Group of
Geobiocoene Types
Norway spruce
(Picea abies (L.) H.Karst.)
3rd, Oak-BeechwettedMesotrophicQuerceto-Fagetum
5th, Fir-BeechnormalAbieto-Fagetum inf.a
hemioligotrophicFageto-Abietum inf.
6th, Spruce-Beech FirFageto-Abietum sup.b
Silver fir
(Abies alba Mill.)
3rd, Oak-BeechwettedmesotrophicQuerceto-Fagetum
4th, BeechnormalFagetum pauper
Fagetum typicum
little restrictedheminitrophilousFagetum tiliosum
5th, Fir-BeechnormalmesotrophicAbieto-Fagetum inf.
Fageto-Abietum sup.
6th, Spruce-Beech Firhemioligotrophic
Scots pine
(Pinus sylvestris L.)
1st, OaknormalmesotrophicCarpineto-Quercetum
2nd, Beech-OakFageto-Quercetum
European larch
(Larix decidua Mill.)
3rd, Oak-BeechwettedQuerceto-Fagetum
5th Fir-BeechnormalAbieto-Fagetum inf.
hemioligotrophicFageto-Abietum inf.
a inf.—inferiora; b sup.—superiora.
Table 2. Characteristics of trees from which biomass samples were taken.
Tree SpeciesNumber of
Sampled Trees
DBH
(cm)
h
(m)
AgeSite IndexAltitude
(m)
Picea abies1220–6223–3835–10526–42435–1070
Abies alba1123–7522–3935–15324–40390–950
Pinus sylvestris1025–5124–3075–10824–30165–940
Larix decidua1026–5624–3540–10028–40275–1070
Overview4320–7522–3935–15324–42165–1070
Table 3. Variability of gross calorific values (arithmetic mean ± SD in MJ kg−1): (a—ANOVA, Fischer LSD test; spruce: F(4, 40) = 11.577, p = 0.0001; fir: F(4, 40) = 27.931, p = 0.0001; pine: F(4, 40) = 8.027, p = 0.0008; larch: F(2,32) = 14.22, p = 0.0004; b—ANOVA, Fischer LSD test; wood: F(3, 56) = 29.322, p = 0.0001; bark: F(3, 56) = 3.568, p = 0.019; small-wood: F(3, 16) = 1.019, p = 0.410; twigs: F(2, 12) = 0.806, p = 0.469; needles: F(2, 12) = 9.903, p = 0.000).
Tree SpeciesBarkWoodSmall-WoodTwigsNeedles
a—Variability within each of the examined woody plants
Picea abies20.314 ± 0.495 a20.222 ± 0.142 a20.613 ± 0.208 a,b21.495 ±0.621 b21.005 ± 0.600 b
Abies alba20.422 ±0.330 a20.395 ± 0.164 a20.727 ± 0.342 a21.602 ± 0.468 b21.563 ± 0.338 b
Pinus sylvestris20.627 ±0.112 a20.596 ± 0.253 a20.856 ± 0.180 a21.857 ± 0.198 b22.196 ± 0.253 b
Larix decidua21.171 ± 0.910 b19.988 ± 0.159 a20.811 ± 0.166 b--
b—Variability within each of the basic biomass fractions of the examined woody plants
Picea abies20.314 ± 0.495 a20.222 ± 0.142 b20.613 ± 0.208 c21.495 ± 0.621 c21.005 ± 0.600 a
Abies alba20.422 ± 0.330 a20.395 ± 0.164 b20.727 ± 0.342 c21.602 ± 0.468 c21.563 ± 0.338 a
Pinus sylvestris20.627 ± 0.112 a,c20.596 ± 0.253 a20.856 ± 0.188 c21.857 ± 0.198 c22.196 ± 0.253 c
Larix decidua21.171 ± 0.910 c19.988 ± 0.159 c20.811 ± 0.166 c
Note: significantly different mean values (p < 0.05) are indicated by different letters (a,b,c).
Table 4. Net calorific values of biomass fractions of examined tree species (n = 5).
Tree
Species
Biomass
Fraction
COHNSAshMinMaxAverage ± SD
(%)(MJ kg−1)
Picea
abies
bark149.99 ± 0.242.645.91 ± 0.10.57 ± 0.00.05 ± 0.10.32 ± 0.118.38819.82819.217 ± 0.7 b
218.44519.11818.764 ± 0.3 b
318.44919.49819.094 ± 0.4 b
wood150.90 ± 0.039.935.99 ± 0.00.10 ± 0.00.05 ± 0.03.55 ± 0.318.72219.16318.985 ± 0.2 b
218.70519.05618.843 ± 0.1 b
318.80119.07418.929 ± 0.1 b
small-
wood
50.55 ± 0.241.796.16 ± 0.00.31 ± 0.00.03 ± 0.01.16 ± 0.118.96419.54519.273 ± 0.2 a,b
twigs50.50 ± 0.640.196.04 ± 0.01.01 ± 0.00.11 ± 0.02.15 ± 0.019.08920.64620.180 ± 0.6a
needles49.45 ± 0.538.356.15 ± 0.11.50 ± 0.00.13 ± 0.04.42 ± 0.118.69920.28919.675 ± 0.6 a
Abies
alba
bark151.95 ± 0.243.756.20 ± 0.00.46 ± 0.00.02 ± 0.00.28 ± 0.118.48220.62719.229 ± 0.9 b
218.76619.95319.273 ± 0.4 b
319.00920.31919.499 ± 0.5 b
wood149.65 ± 0.339.306.21 ± 0.00.09 ± 0.00.04 ± 0.02.05 ± 0.118.87219.28119.141 ± 0.2 b
218.73719.22718.989 ± 0.2 b
318.80119.14419.009 ± 0.1 b
small-
wood
51.80 ± 0.140.106.24 ± 0.00.31 ± 0.00.04 ± 0.01.51 ± 0.018.98919.75919.371 ± 0.3 a
twigs52.50 ± 0.137.376.21 ± 0.01.04 ± 0.00.11 ± 0.02.77 ± 0.019.65620.79920.254 ± 0.5 a
needles51.25 ± 0.237.946.03 ± 0.01.17 ± 0.00.11 ± 0.03.50 ± 0.119.74220.66320.252 ± 0.3 a
Pinus
sylvestris
bark151.35 ± 0.242.585.99 ± 0.00.41 ± 0.00.02 ± 0.00.40 ± 0.118.58621.70020.368 ± 0.1 a
218.31519.92918.745 ± 0.7 b
318.07819.27018.566 ± 0.5 b
wood150.78 ± 0.239.236.10 ± 0.00.12 ± 0.00.08 ± 0.02.94 ± 0.119.02219.80619.380 ± 0.3 b
219.02719.52719.214 ± 0.2 b
318.98819.58919.218 ± 0.2 b
small-
wood
51.25 ± 0.141.066.23 ± 0.00.32 ± 0.00.03 ± 0.01.11 ± 0.119.19420.78019.765 ± 0.6 a,b
twigs53.05 ± 0.236.836.34 ± 0.00.88 ± 0.00.07 ± 0.02.83 ± 0.020.25320.71320.482 ± 0.2 a
needles53.3 ± 0.135.966.31 ± 0.01.55 ± 0.00.13 ± 0.02.70 ± 0.120.52721.20920.828 ± 0.3 a
Larix
decidua
bark152.90 ± 0.146.426.20 ± 0.00.24 ± 0.00.03 ± 0.00.12 ± 0.019.89522.20721.157 ± 0.9 a
218.43819.77319.252 ± 0.5 b,c
319.07419.50619.308 ± 0.2 b,c
wood147.48 ± 0.439.215.87 ± 0.00.08 ± 0.00.03 ± 0.01.42 ± 0.118.47818.84818.692 ± 0.1 b
218.58118.92218.762 ± 0.1 b
318.30619.97818.924 ± 0.6 b,c
small-
wood
51.49 ± 0.441.205.97 ± 0.00.26 ± 0.00.01 ± 0.01.07 ± 0.119.35419.73619.511 ± 0.2 c
Note: significantly different mean values (p < 0.05) are indicated by different letters (a,b,c).
Table 5. Dry weight and percentage of above-ground biomass fractions of the model trees (DBH 60 cm, h 30 m) of examined woody plants.
Tree SpeciesBiomass FractionModel
Tree
BarkWoodSmall-WoodTwigsNeedles
(kg)(wt %)(kg)(wt %)(kg)(wt %)(kg)(wt %)(kg)(wt %)(kg tree−1)
Picea abies1016.9116979.7815.5362.4805.51467
Abies alba17210.7122076.2945.9362.2805.01602
Pinus sylvestris824.8143484.21398.240.2442.61703
Larix decidua27216.0132277.51116.5----1705
Average1579.6128679.41066.5191.2513.31619
Table 6. Energy reserves of above-ground biomass fractions and of model trees (DBH 60 cm, h 30 m) of examined woody plants (GJ tree−1).
Tree SpeciesBiomass FractionModel
Tree
BarkWoodSmall-WoodTwigsNeedles
Picea abies2.0523.641.670.771.6829.82
Abies alba3.5124.881.950.781.7332.85
Pinus sylvestris1.6929.532.900.090.9835.19
Larix decidua5.7626.422.31--34.49
Average3.2526.122.210.551.46133.09
Table 7. Amount of CO2 greenhouse gas released after burning of model trees (DBH 60 cm, h 30 m).
Tree SpeciesPicea abiesAbies albaPinus sylvestrisLarix decidua
Biomass
Fraction
CCO2CCO2CCO2CCO2
(%)(kg)(kg)(%)(kg)(kg)(%)(kg)(kg)(%)(kg)(kg)
Bark49.9950.49185.351.9589.35327.951.3542.11154.552.90143.89528.1
Wood50.90595.022183.749.65605.732223.050.78728.192672.547.48627.692303.6
Small-wood50.5540.95150.351.8041.96154.051.2571.24261.551.4957.15209.7
Twigs50.5018.1866.752.5018.9069.453.052.127.8
Needles49.4539.56145.251.2541.00150.553.3523.4786.1
Model tree50.28744.202731.251.43796.942924.851.96867.133182.4650.62828.733041.4
Publisher’s Note: MDPI stays neutral with regard to jurisdictional claims in published maps and institutional affiliations.

