Article

Optimised Selection of Water Supply and Irrigation Sources—A Case Study on Surface and Underground Water, Desalination, and Wastewater Reuse in a Sahelian Coastal Arid Region

by
António Freire Diogo
1,*,
Ricardo Alves Resende
1 and
António Luís Oliveira
2
1
Department of Civil Engineering, University of Coimbra, Pólo II, 3030-788 Coimbra, Portugal
2
Sacramento Campos—Projetos e Serviços, SA, 2610-294 Amadora, Portugal
*
Author to whom correspondence should be addressed.
Sustainability 2021, 13(22), 12696; https://doi.org/10.3390/su132212696
Submission received: 8 October 2021 / Revised: 25 October 2021 / Accepted: 26 October 2021 / Published: 17 November 2021
(This article belongs to the Section Environmental Sustainability and Applications)

Abstract

:
This paper presents a general conceptual procedure and an economic, sustainable, resilient, and integrated solution for the water supply and landscape irrigation of a large touristic complex projected in an arid to semi-arid southwest coastal region of the island of Santiago in Cape Verde, in the Western African Sahel. It is assumed that underground water can be explored, but at a minimum level to avoid aquifers depletion or any eventual saline intrusion, and that surface water can be mobilised with the construction of a dam. Other important sources of water that were identified, assessed, and compared include treated wastewater produced in the complex, which can be reused for irrigation after undergoing tertiary treatment, and desalinated sea water, which requires the construction of a desalination plant. The devised procedure includes the definition of all feasible alternatives by a deterministic complete enumeration, and the selection of the optimised solution that may be determined by a single objective cost function to be minimised, as well as by a multi-criteria decision-making process that considers a conventional 1–5 score to be maximised. Beyond the cost, four additional criteria are considered and scored for each solution, namely, Environmental Sustainability, Water Quality, Resilience, and Local Integration, and for the relative weighting between criteria a weighted sum model is assumed. For the parameters and cost models used, the best solution that was found considers that the landscape irrigation is performed with surface water and reused wastewater, and that the water distribution network is supplied with underground and desalinated water. Other solutions more or less close can be selected based on different scores or different decision maker weighting preferences.

1. Introduction

The greater part of our planet is covered with large masses of salty water, and both the planet surface and the salty water are subject to the natural hydrological cycle. Theoretically, water is thus a renewable good that may be considered practically inexhaustible on earth. However, with respect to fresh water, due to various factors, there are huge asymmetries on earth, either in time as in space, and this vital good may be extremely scarce in many places for long periods of time.
Some populated regions in a state of development currently face frequent or even permanent hydric deficits and alarming drought periods which appear to be on the increase due to global warming and climate change. If effective measures are not taken, disequilibrium between demands for water—as a condition of human activities—and the natural recharge of existing bodies of fresh water may lead to the depletion of water resources, from the surface or from underground aquifers, which may result in possible desertification in the medium to long term. Large infrastructures for the storage and/or transference of water between basins, artificial recharge of underground aquifers, desalination of sea or brackish water, mainly in coastal regions, particularly by reverse osmosis (a high energy-consuming process, requiring important costs of energy, operation and maintenance, and of capital [1,2,3]), and the reuse of treated wastewater [4,5] are becoming more common and their indispensability is being recognised across the world. In this environmental, socio-economic, and engineering context, many complex multi-criteria decision-making problems can arise [6], and simplified models can be used to solve them [7,8].
Western African Sahel and the Cape Verde Archipelago have observed, more or less regularly, long periods of severe droughts alternating with periods of comparatively abundant precipitation in the wet season [9,10,11]. Under such climatic conditions, adequate hydraulic infrastructures and the suitable management of water resources become even more essential in order to improve radically the equilibrium between availability and use of fresh water, and also to preserve its quality [12]. Surface and underground water quality and the risk of contamination of drinking water can be vital issues, particularly for public health in adverse climatic conditions [13,14].
Santiago Island is volcanic in origin and has an area of 991 km2. Precipitation is scarce, uneven from year to year, and erratic, occurring basically in just three to five months in the year, between July and November. In the coastal areas of the south/southwest that are at lower altitudes, the scarce and erratic precipitation varies in general between average values of approximately just 100 and 200 mm per year [15]. These areas are the drier and more arid of the Island, due mainly to the solar exposition and predominant winds. However, annual average precipitation increases rapidly with the altitude and distance from the coastal areas towards the centreline of the island and can reach a median above 600–650 mm locally in Serra da Malagueta. Several dams for storing surface water, mainly for agricultural purposes, have been built recently in Santiago, most of them on the east/northeast slope of the Island [16,17], where the underground aquifers have been traditionally explored quite comprehensively in some areas [18]. In the region of Assomada, which is on a plateau in the centre of the island, basic water needs seem to be still guaranteed mainly by underground water. However, in the south of Santiago, which is by far the most populated region of Cape Verde, the predominant source of water supply since 2002 has been desalinated sea water [19].
The treatment of wastewater produced by human communities is nowadays considered practically indispensable in order to preserve the natural environmental equilibrium. For simple restitution in water bodies with important renewable waters (i.e., excluding interior lakes and critical streams with low flow rates or stagnant water), current best engineering practice and national regulations still allow in exceptional cases the treatment level to be just primary (with a reduction up to 60–70% of the total suspended solids (SST) and up to 30% to 40% of biochemical oxygen demand (BOD)), though more frequently (i.e., in the general case), secondary treatment is required, with more or less conventional biological treatment (with a total reduction of up to about 80–90% of SST and up to about 80–95% of BOD [5]). When the final destinations of wastewater are sensitive water bodies, like interior lakes, or when the treated wastewater is to be reused, tertiary or advanced treatments are normally required. The reuse of treated wastewater for landscape irrigation, particularly at a regional scale, thus appears a very attractive option, given that it can combine two essential basic needs: (i) pollution control and water quality preservation; and (ii) the supply of water volumes required for the sustainable irrigation of green areas. This may be particularly relevant in areas where large volumes of irrigation water are required, and the availability of water resources is very limited. However, large scale reuse systems may also create new problems, as well as relevant engineering and environmental challenges. This has occurred in the case of a relatively recent large regional project on Santiago Island, which included the landscape irrigation of several large urbanizations that were planned in the municipality of Praia, not very distant from the Cape Verde capital [15,20].
This paper proposes a conceptual procedure and develops the subsequent application for a case study centred around the selection of suitable water sources for the water supply and for the landscape irrigation of a large touristic complex projected in an arid to semi-arid coastal area of the southwest of Santiago Island. The complex will be installed in a coastal zone relatively plane of the municipality of Ribeira Grande de Santiago, with an area of about 1.58 km2, and requires an estimated daily average water volume for human consumption at full capacity and irrigation needs of approximately 3900 m3/day. The projected urbanizations may be extremely relevant for the local populations and global economy of the municipality, where Cidade Velha, the former capital of Cape Verde, is situated.
A detailed analysis directly related to the surface water resources that can be mobilised with the construction of a dam and complementary hydraulic infrastructures is developed. Past local experiences with respect to the exploration of underground aquifers, desalination by reverse osmosis, and wastewater treatment are also presented, given that they may be fundamental elements to be considered in the multicriteria decision-making process. The available global alternative solutions based on water requirements and the capacity of sources are identified, their total costs and the annualised unit costs are calculated, and the minimum cost solution is selected. A multi-criteria decision-making procedure is proposed, using a scoring on a conventional scale, pairwise comparison between criteria, and a weighted sum method, and the results obtained with the proposed models are discussed and compared.

2. Materials and Methods
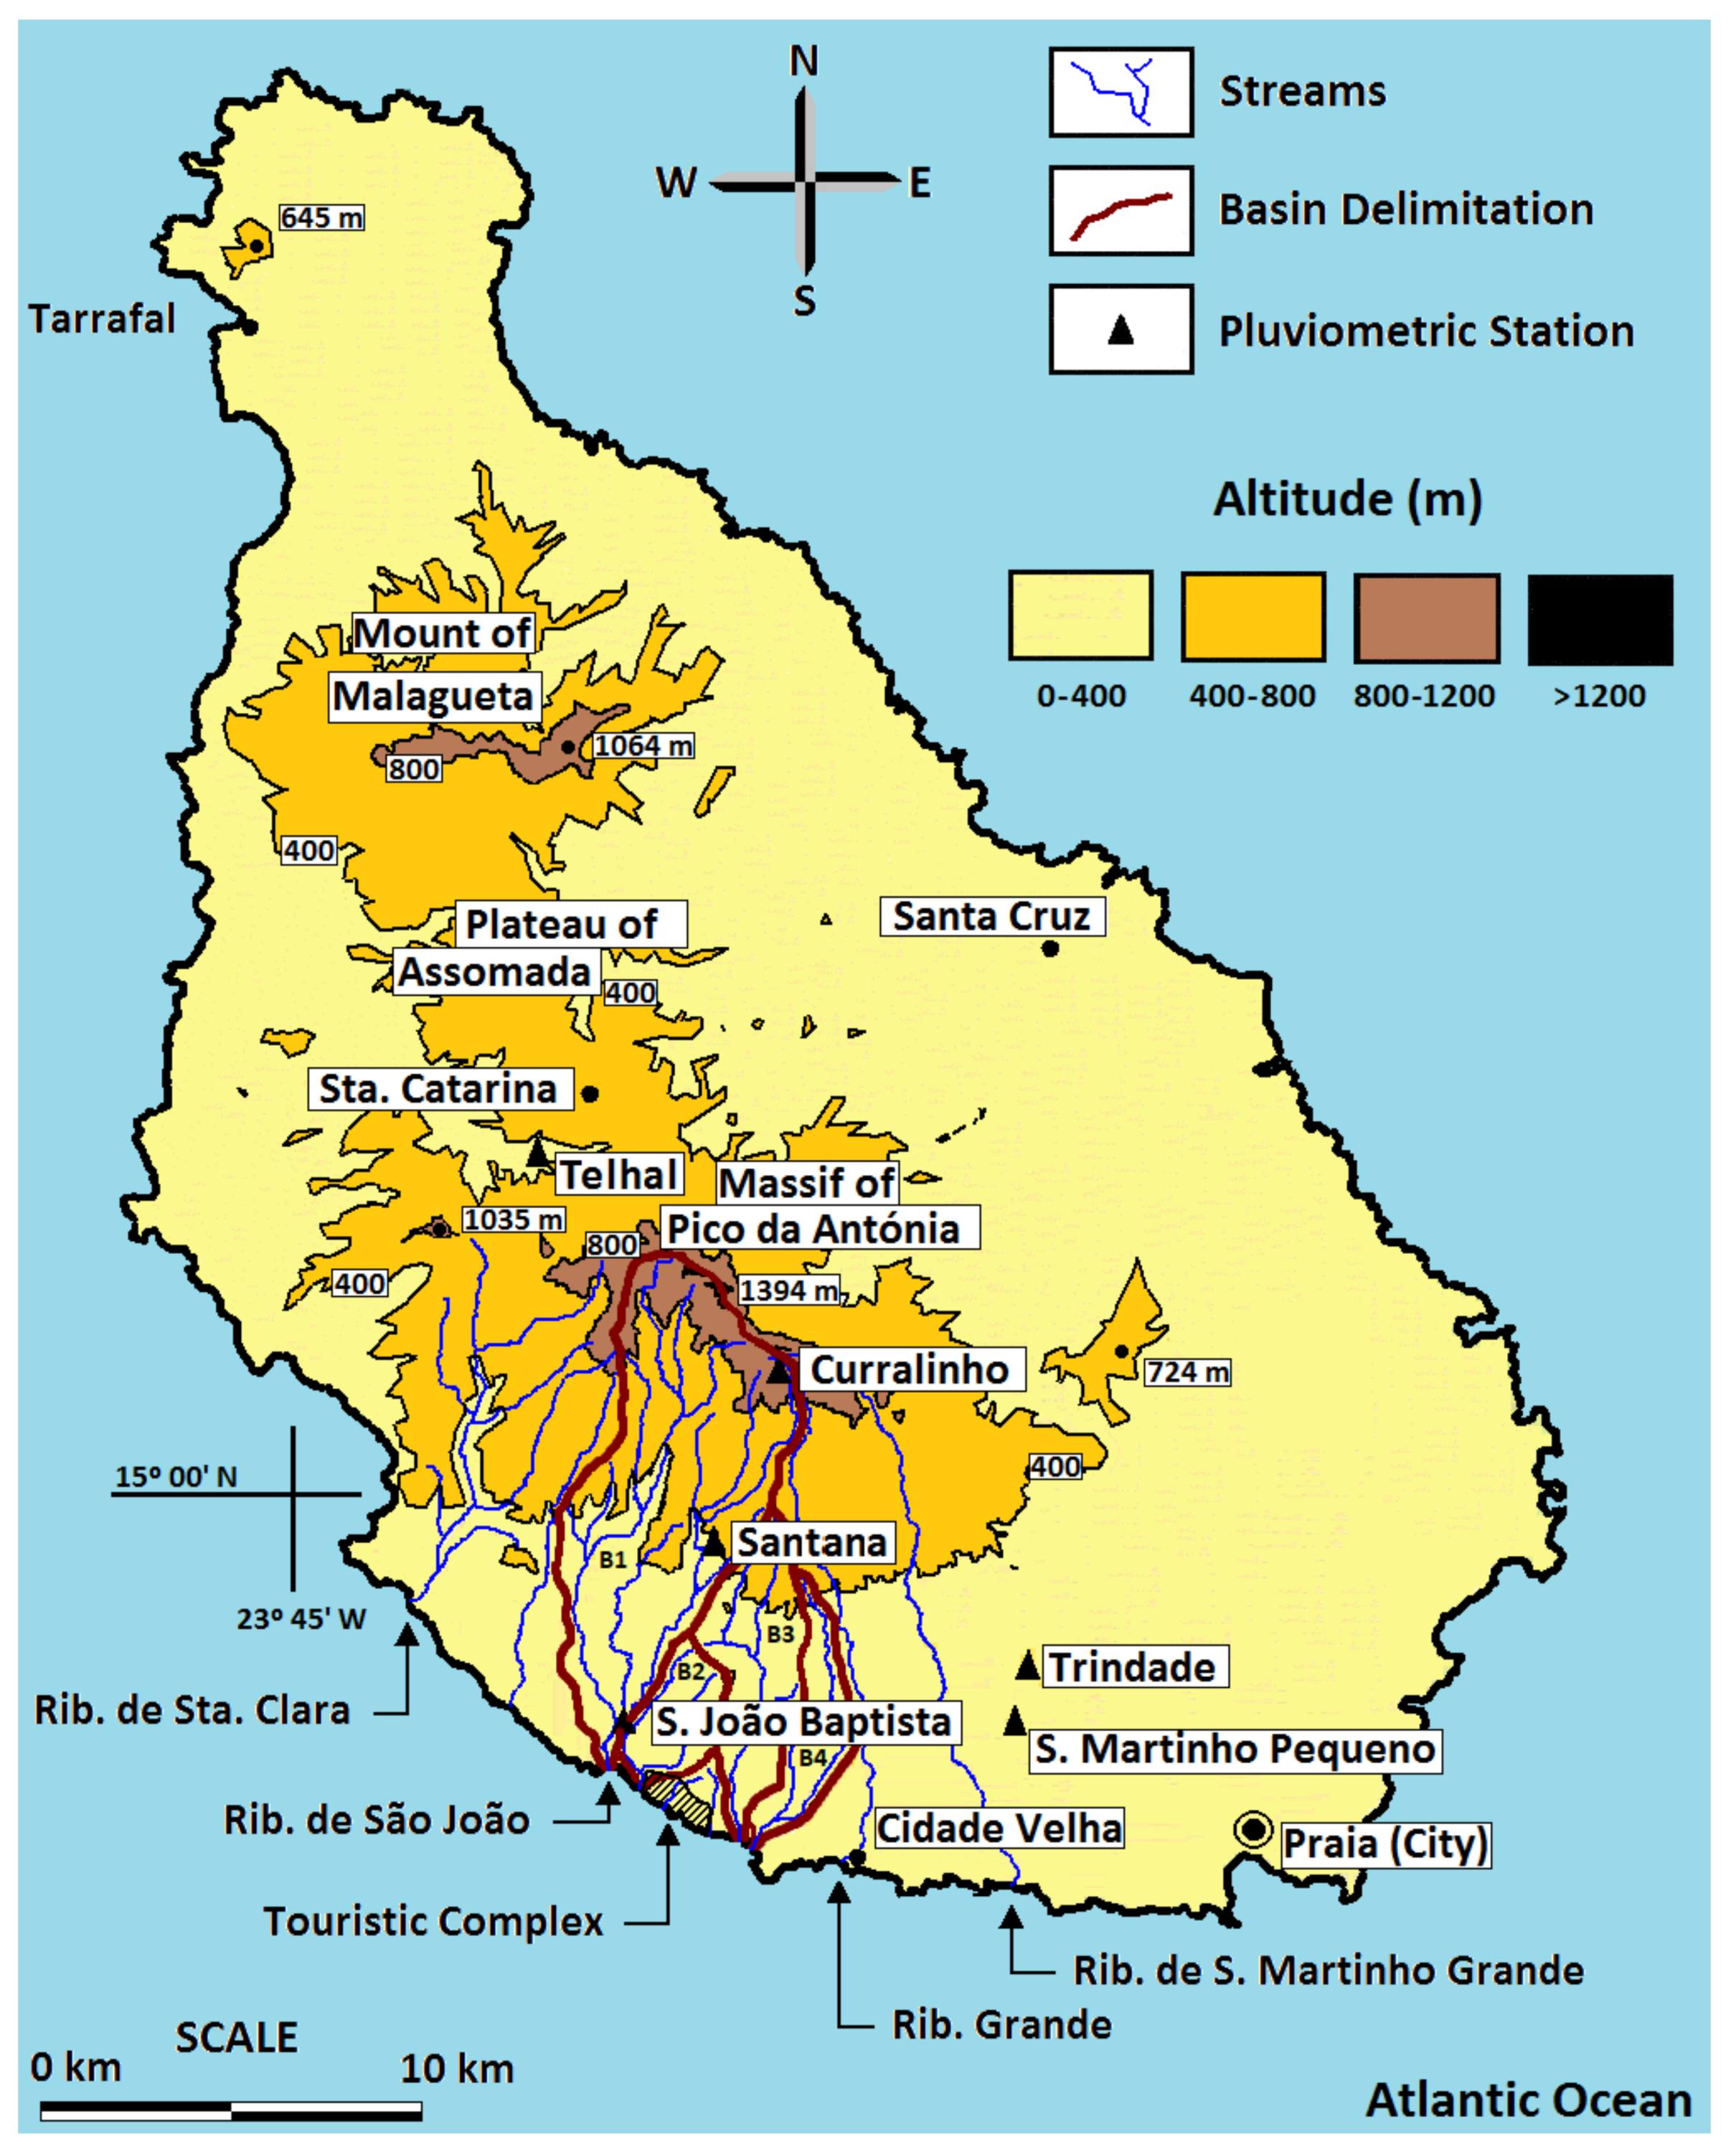
2.1. Study Area

The African tropical Atlantic island of Santiago has a total area of 991 km2, a current population of approximately 274,000 inhabitants, and is the largest and most populated island of the ten main islands of the Cape Verde archipelago. On the south coast of the island is located the capital of the country, the city of Praia, whose municipality had an estimated total population of about 131,600 inhabitants in 2010 [21]. The Cape Verde archipelago has a total area of 4033 km2 and approximately 492,000 inhabitants, is located between latitudes 14°48′ N and 17°12′ N and longitudes 22°40′ W and 25°22′ W, in the Atlantic Ocean, at a distance of about six hundred kilometers from Dakar, Senegal on the Western African Coast. Cape Verde is somehow inside the Western African Sahel Region that is bounded, in the continent, by desert climates at north, particularly by the Sahara Desert, and wet tropical climates at south. The annual precipitation in continental Sahel generally decreases with latitude. According to Nicholson [10], the mean annual precipitation varies generally between 500 to 600 mm in the southern edge, at latitudes roughly 14° N, and 100 to 200 mm in the northern limit, at latitudes roughly 18° N, near to the transition to the desert. Sahel, Cape Verde, and Santiago faced prolonged severe droughts several decades ago [9], and have suffered further droughts in more recent years.
Figure 1 shows the main simplified orography of Santiago, a schematic representation of the location of the touristic complex on southwest coast, the main streams of southwest part of the island, the main hydrographic basins in the vicinity of the complex, and the rain gauge stations considered. Cape Verde islands are volcanic in origin, and Santiago orography generally increases towards the centre of the island. A small mountain chain exists in the island centreline, running in the longitudinal direction, between the mountain of Malagueta in the north, reaching a height above mean sea level (AMSL) of 1064 m, and the Massif Central, where the main eruptive process occurred. It is in this massif that the highest point of Santiago can be found—the Pico da Antónia, with an altitude of 1394 m. Santiago is characterized by deep valleys created by strong hydric erosion and small plateaus or surfaces of low convexity, particularly in the coastal regions. The erosion seems to be mainly due to rapid surface runoffs caused by very intense rainfalls, normally of short duration and erratic, precipitations that are typical for the arid or semi-arid climates of the region [22,23,24].
The erratic precipitation increases significantly with the elevation towards the centre of the Island. The mean and median annual precipitation in Santiago is normally between 100 to 200 mm in the arid to semi-arid coastal south-southwest regions of lower altitude, and between 400 to 600 mm or more in the semi-humid to humid areas higher up. The north-northeast facing slopes are exposed to winds practically all of the year blowing in a southerly or southwesterly direction, and the air generally has a high relative humidity, particularly in the zones of higher altitude. In contrast, the south-southwest regions are drier and are particularly arid at lower altitudes, where the complex is located. The precipitation occurs basically during just three or four months of the year, between July and November, when the Intertropical Convergence Zone (ITCZ) of low pressures carrying equatorial air masses, both hot and humid, in its annual migration to the north is able to reach the latitude of the archipelago and stay there for a significant period of time [26,27]. The variation of the inter-annual precipitation is also very far from uniform or linear, reflecting the great variability in the positions that the ITCZ is able to reach and occupy from year to year. This may explain some of the severe droughts that have occurred in the past and which seem likely to continue to occur, probably now more severely due to global climate change. It is possible to identify cyclic periods of rainy years, with different durations, alternating with periods of drought years, also of greater or lesser duration. The total annual precipitation is frequently due to the occurrence of relevant or measurable precipitation in just a few days of the year in the rainy season. In the remaining eight to nine months of the year, there is practically no rain.
The projected complex, named Costa de Prata, occupies a total area of about 158 ha and is located in the municipality of Ribeira Grande de Santiago, in the southwest part of the Island, at a distance of about 5 km from Cidade Velha, the former capital of the archipelago, at seaside and with altitudes up to approximately 60 m (see Figure 1). The municipality of Ribeira Grande de Santiago has a total area of about 146 km2 and had a total population of about 8300 inhabitants in 2010. The Land Use Plan of the complex forecasts a total of 251 villas, 792 apartments, three hotels with a total lodging of 424 beds, an equestrian centre, two restaurants and an open space with a nine-hole golf course with an area of 48.5 ha [28,29,30,31]. The project predicts that the land will be occupied in several phases. In the final phase, the complex will serve a total population at full capacity that may be estimated around 3800 people.
The average water requirements at full capacity may be estimated at 1442 m3/day for the water supply system. This includes the provision of apartments and villas (772 m3/day), hotels (229 m3/day), confined or designated green spaces (310 m3/day, for an estimated irrigation area of 6.2 ha), and a 10% water loss in the supply system (131 m3/day). However, large variations in occupancy rates, required supply water volumes, and wastewater volumes reaching the wastewater treatment plant (WWTP) are expected along the project horizon. In first year of operation, the average total water requirements to supply the complex are estimated at 392 m3/day, and it is assumed that these requirements will vary linearly between this figure and the estimated maximum figure of 1442 m3/day on the project horizon (50 years). For irrigation of the golf course, the annual average water requirements are assumed to be constant and may be estimated at about 2425 m3/day. The per capita water consumption considered was 0.220 m3/head/day for villas and apartments and 0.540 m3/bed/day for the hotels, based on [28,29]. The water volumes required for the irrigation of green spaces and the golf course of Costa de Prata were estimated at about 50 m3/ha/day. This rate was based on [15,32,33,34], and was obtained for another resort on the island, located in the adjacent municipality of Praia (Santiago Golf Resort). Water requirements for irrigation may be particularly critical, given the low average annual precipitation and arid characteristics of the region, and the uneven and erratic rainfall patterns, both inter-annually and throughout the year.

2.2. Surface and Underground Water Resources

2.2.1. Surface Water

The mean and median annual precipitation in seven rain gauge stations located in the south-southwest area of Santiago, inside or nearby the watersheds that cross or are in the vicinity of the complex, for the 46-year period between 1961 and 2006 are presented in Table 1. In the last column of the table is shown the number of years in this period without annual data or without complete annual data obtained for each station. For the two years of incomplete precipitation data for Praia, the annual precipitations considered in Diogo et al. [15] were used. The remaining data were estimated by simple direct proportion using the annual precipitation observed at the station in Praia. The estimated value in a given station in a given year was thus obtained by multiplying Praia precipitation in that year by the quotient between the mean precipitations observed (for the same interval of years with existing data) in that station and in the Praia station. Even if the number of years without precipitation data in this period is relatively large in the case of several stations, it is possible to see that the mean annual precipitation calculated before and after filling these gaps using the described procedure does not differ significantly at any station.
As can be observed in Table 1, the S. J. Baptista station, which is the nearest to the complex, is the station that receives less annual precipitation. Mean and median annual precipitation generally increases with the distance between the station and the coastline, and with its altitude that generally is higher towards the centreline of the island. The average percentage of the annual average total precipitation observed during the wet season is also presented in Table 1. For all stations, in the 46-year period between 1961 and 2006, more than 95% of the annual precipitation occurred in just 5 months, between July and November, more than 85% in just 3 months, between August and October, and 68% or more, in just 2 months, in August and September.
The areas of the four main basins of the four main streams in the vicinity of the complex, which are delimited in Figure 1, and the areas of influence of each rain gauge station in each of the basins, which were calculated using the Thiessen polygon method, are given in Table 2. The watersheds are relative to Ribª. de S. João (including its tributary Ribª. de Santa Ana) (B1), Ribª. Zimbrão (B2), Ribª. Caniço Grande (B3), and Ribª. do Caniço (B4). Due to their greater distance from the area under study, the stations of Praia and Trindade have no area of influence in the basins, and Telhal has merely a residual influence in B1.
Table 2 presents also the annual average precipitation for each measurement station in the wet season between August and October, and between August and September, the total annual precipitation, mean and median, estimated for each one of the four complete basins, and a first approximation for the annual mean excess runoff in the area of influence of each station (in mm) and in each complete basin (in m3/year). The 3-month and 2-month average precipitations for each station were directly calculated using the observed average percentages and the corrected annual average total precipitations presented in Table 1 (due to the local erratic behaviour of the rains, only total annual missing precipitation data were corrected/completed).The approximations presented in Table 2 for the annual mean excess runoff were based on a simplified hydric balance, related to the Penman–Grindley method [37,38,39,40] that is or may be used for calculating groundwater recharge. It was assumed, however, in this case, that the recharge of groundwater volumes, whenever an excess of water for recharge and runoff may exist in a given time period, is of an order of 15% of the total precipitation in that period. The maximum capacity of water retention of about 50 mm in the typically thin soil of Santiago [35,36,41] was assumed for the basins on the southwest slope of the island.
Pina [35] estimated the mean monthly potential evapotranspiration over the year using several methods for three stations, namely, Praia (64 m AMSL), S. Jorge dos Órgãos (310 m AMSL), and Serra da Malagueta (765 m AMSL). These stations were considered representative of Santiago potential evapotranspiration, respectively, for arid to semi-arid areas that were assumed below 400 m, semi-humid areas, presumed between 400 and 600 m, and humid areas, all the remaining above 600 m. In the present case, except for the stations of Santana (388 m AMSL), Telhal (335 m AMSL), and Curralinho (818 m AMSL), which are located at higher altitudes, in all remaining coastal stations that are clearly below 400 m the monthly mean precipitation in the period 1961–2006 is always lower over the entire year than the monthly potential evapotranspiration estimated for Praia [35] using the Penman–Monteith method. Thus, in these lower altitude stations and in their area of influence, the excess of water volumes for aquifers recharge and surface runoff (directly related to the availability of surface water volumes) may be neglected (actual monthly evapotranspiration may be assumed to be not much different from monthly precipitation, for all months of the year).
Given that the southwest slopes are drier than the northeast slopes, the evapotranspiration considered for Curralinho area of influence, at the higher altitudes of the basins, was approximated in this study by the evapotranspiration estimated for semi-humid areas. For Curralinho and Telhal, only between August and October the monthly mean precipitation (3-month total of 423.5 and 348.8 mm, respectively) exceeds the Penman–Monteith monthly potential evapotranspiration estimate obtained by Pina [35] for semi-humid areas (3-month total of 199.2 mm), causing measurable excess of water for underground recharge and surface runoff. For Santana station this situation only occurs on average in August and September, when the monthly mean precipitation (2-month total of 245.0 mm) exceeds the potential evapotranspiration (2-month total of 136.5 mm, according to [35]).
The excess surface runoff for each station (in mm) was calculated by subtracting from the total precipitation, for the two or three-month period mentioned above, respectively the soil retention maximum capacity of 50 mm, the potential evapotranspiration, and the infiltration (assumed as 15% of the total precipitation in the period), and the results of this hydric balance are given in Table 2. According to this approximation, the resulting mean annual water volume that it may be possible to mobilize seems merely residual for the basins of Ribª. Zimbrão and Ribª. do Caniço (B2 and B4), due mainly to the low altitude of the basins (see Table 2). The average surface water total volume is also relatively low for the basin of Rib.ª Caniço Grande (B3), with about 520 m3/day (or 190,010 m3/year), but it may reach more than 6600 m3/day (or about 2.440 million m3/year) for the basin of Ribª de S. João (B1). This last volume was approximated ignoring the area of influence of Telhal (i.e., considering this residual area as included in the area of influence of Curralinho). The annual total average requirements for irrigation and water supply of the complex at maximum capacity were estimated at about 3900 m3/day, and thus well below the gross daily average available total volume of more than 6600 m3/day that was estimated for B1. It may then be possible to mobilize any surface water production capacity up to, or even well above from the maximum requirements calculated for the complex. This can be achieved by means of a storage reservoir with the construction of a dam and related infrastructures that may include a direct transference of water between basins, if required. A possible solution is to build small catchment infrastructures in Ribª. de S. João and Ribª. de Santa Ana near the village of S. J. Baptista and transfer the collected volumes to the basin of Ribª. Zimbrão that seems to have excellent natural conditions in the vicinity of the complex for storing the captured water volumes. Currently, such water volumes from surface runoff flow naturally to the sea and are practically lost. Even with predictable additional important losses for infiltration and direct evaporation in the artificial pond (which may be estimated up to about 27% of the average stored volume), the water total volumes obtained largely exceed the requirements for the water supply and/or irrigation of the complex at its maximum capacity. Thus, this storage reservoir may also directly benefit several villages and the local populations, particularly on the municipality coast.
It should be noted that the construction of dams in Santiago for storing important volumes of surface water resulting from precipitation that falls mainly in the higher areas of the island, and thus avoiding that most of the subsequent surface runoff be lost to the sea, is relatively recent. The first dam that was constructed and began to store water in 2006 was the Poilão dam in Ribeira Seca, located on the east-northeast slope of the island in the municipality of Santa Cruz [17,18,42]. Currently, there is already a total of seven main dams in Santiago that were all built for mainly agricultural purposes. All of them have ponds with individual total storing capacities below 2 million m3 (total capacities between approximately 0.7 and 1.8 million m3). One of these dams (Salineiro dam) was built in 2013 over/in the watercourse Ribeira Grande, in the east part of the municipality of Ribeira Grande de Santiago (the municipality of the complex), near the village of Salineiro, a little above Cidade Velha. Any possible construction of a dam in the future, for agricultural irrigation or other purposes, in the upper area of the basins of Ribª. de Santa Ana or Ribª. de S. João, at least if it has a similar storing or useful capacity to the more small dams recently constructed (i.e., most of them), seems generally compatible with the remaining available surface water in basin B1 that may be allocated to supply or irrigate the complex, according to the estimated requirements.

2.2.2. Underground Water

Several more or less generalist studies have been performed with respect to the existing underground aquifers of Santiago, mostly in the eastern part of the island, and have considered relevant aspects related to water availability, potential for recharge, and water quality [12,35,43,44,45]. However, the available information with respect to the southwest part of the island specifically, particularly in the region of the complex does not seem to be extensive or fully conclusive.
Praia water supply system has included as water sources three bores in Ribª. Santa Clara (watercourse that is located some kilometres to northwest of the complex; see Figure 1), with a total productivity estimated by Electra at 860 m3/day. These flows are transported to Praia along a total distance of about 32 km by a pipe that crosses the complex with a 200 mm diameter. The first phase of the project, from a total of six developing phases that were planned by Sacramento Campos [28,29,30,31], considers an occupation about 20% of the full capacity, located in the west-northwest part of the complex, and assumes that the required water volumes that were estimated at about 500 m3/day for this stage could be delivered exclusively from this public infrastructure. The remaining volumes required for the water supply systems along the progressive remaining five project stages would then be guaranteed with the production of desalinated water after the construction of a desalination plant at the east-southeast limit of the complex [28,30].
Praia water supply system included also (as origin/source) water catchment galleries, particularly in Rib.ª Grande, that could produce important water volumes during two or three months in the year. However, since 2007 that no gallery is serving as origin for the Praia public water supply. The actual reasons subjacent to this fact do not seem absolutely conclusive, particularly if it is due to some sort of weakening of these natural sources, if strategic, or both. In fact, due to the generalised water resources scarcity on the island, it seems that has been conjectured and might has been decided that the water resources should be preferably allocated to the municipalities from where they really belong or are extracted.
Figure 2 and Figure 3 show, respectively, for the different water origins, the produced daily average volumes, and the guaranteed daily average production capacity of Praia-Santiago water supply system, according to Electra Reports from 2001 to 2017 [19]. Although the total production capacity of underground water has been assumed relatively constant and established in the recent years at about 2080 m3/day, the production of underground water has progressively been slowly diminishing from values a little above 2000 m3/day before 2001 up to values of around 800 m3/day in 2016 and 2017. The opposite tendency can be observed for the capacity and production of desalinated water that has increased significantly and progressively in the last two decades (Figure 2 and Figure 3). Up to 2001, the production of underground water was above the production of desalinated water, and since 2002 that the production of desalinated water increased substantially and has been occurring clearly above the production of underground water. In 2001, the capacity of desalination was 2400 m3/day, and the desalinated water production was 1658 m3/day, and this capacity and production increased respectively to 15,000 m3/day and 13,832 m3/day in 2017.
The progressive reduction of underground water production in the recent years seems to induce a difficulty in maintaining the extraction of the previous water volumes at a sustainable level. This may be likely associated also to a not complete knowledge of the underground aquifers. Given that the island has volcanic origin, the aquifers may be developed in spaces relatively enclosed, perhaps sometimes not very large, and whose limits and inter-connections may be difficult to determine or identify with a suitable level of accuracy. The aquifers may have a slow or limited capacity for natural recharge and recovery, particularly when submitted to an intense extraction. Additionally, the recharge depends on rainfall and the region has been cyclically subject to systematic prolonged droughts. The production of desalinated water, even if more expensive and with lower quality than the underground water, may then be more reliable in guaranteeing the required water volumes that may be indispensable, particularly for human consumption.

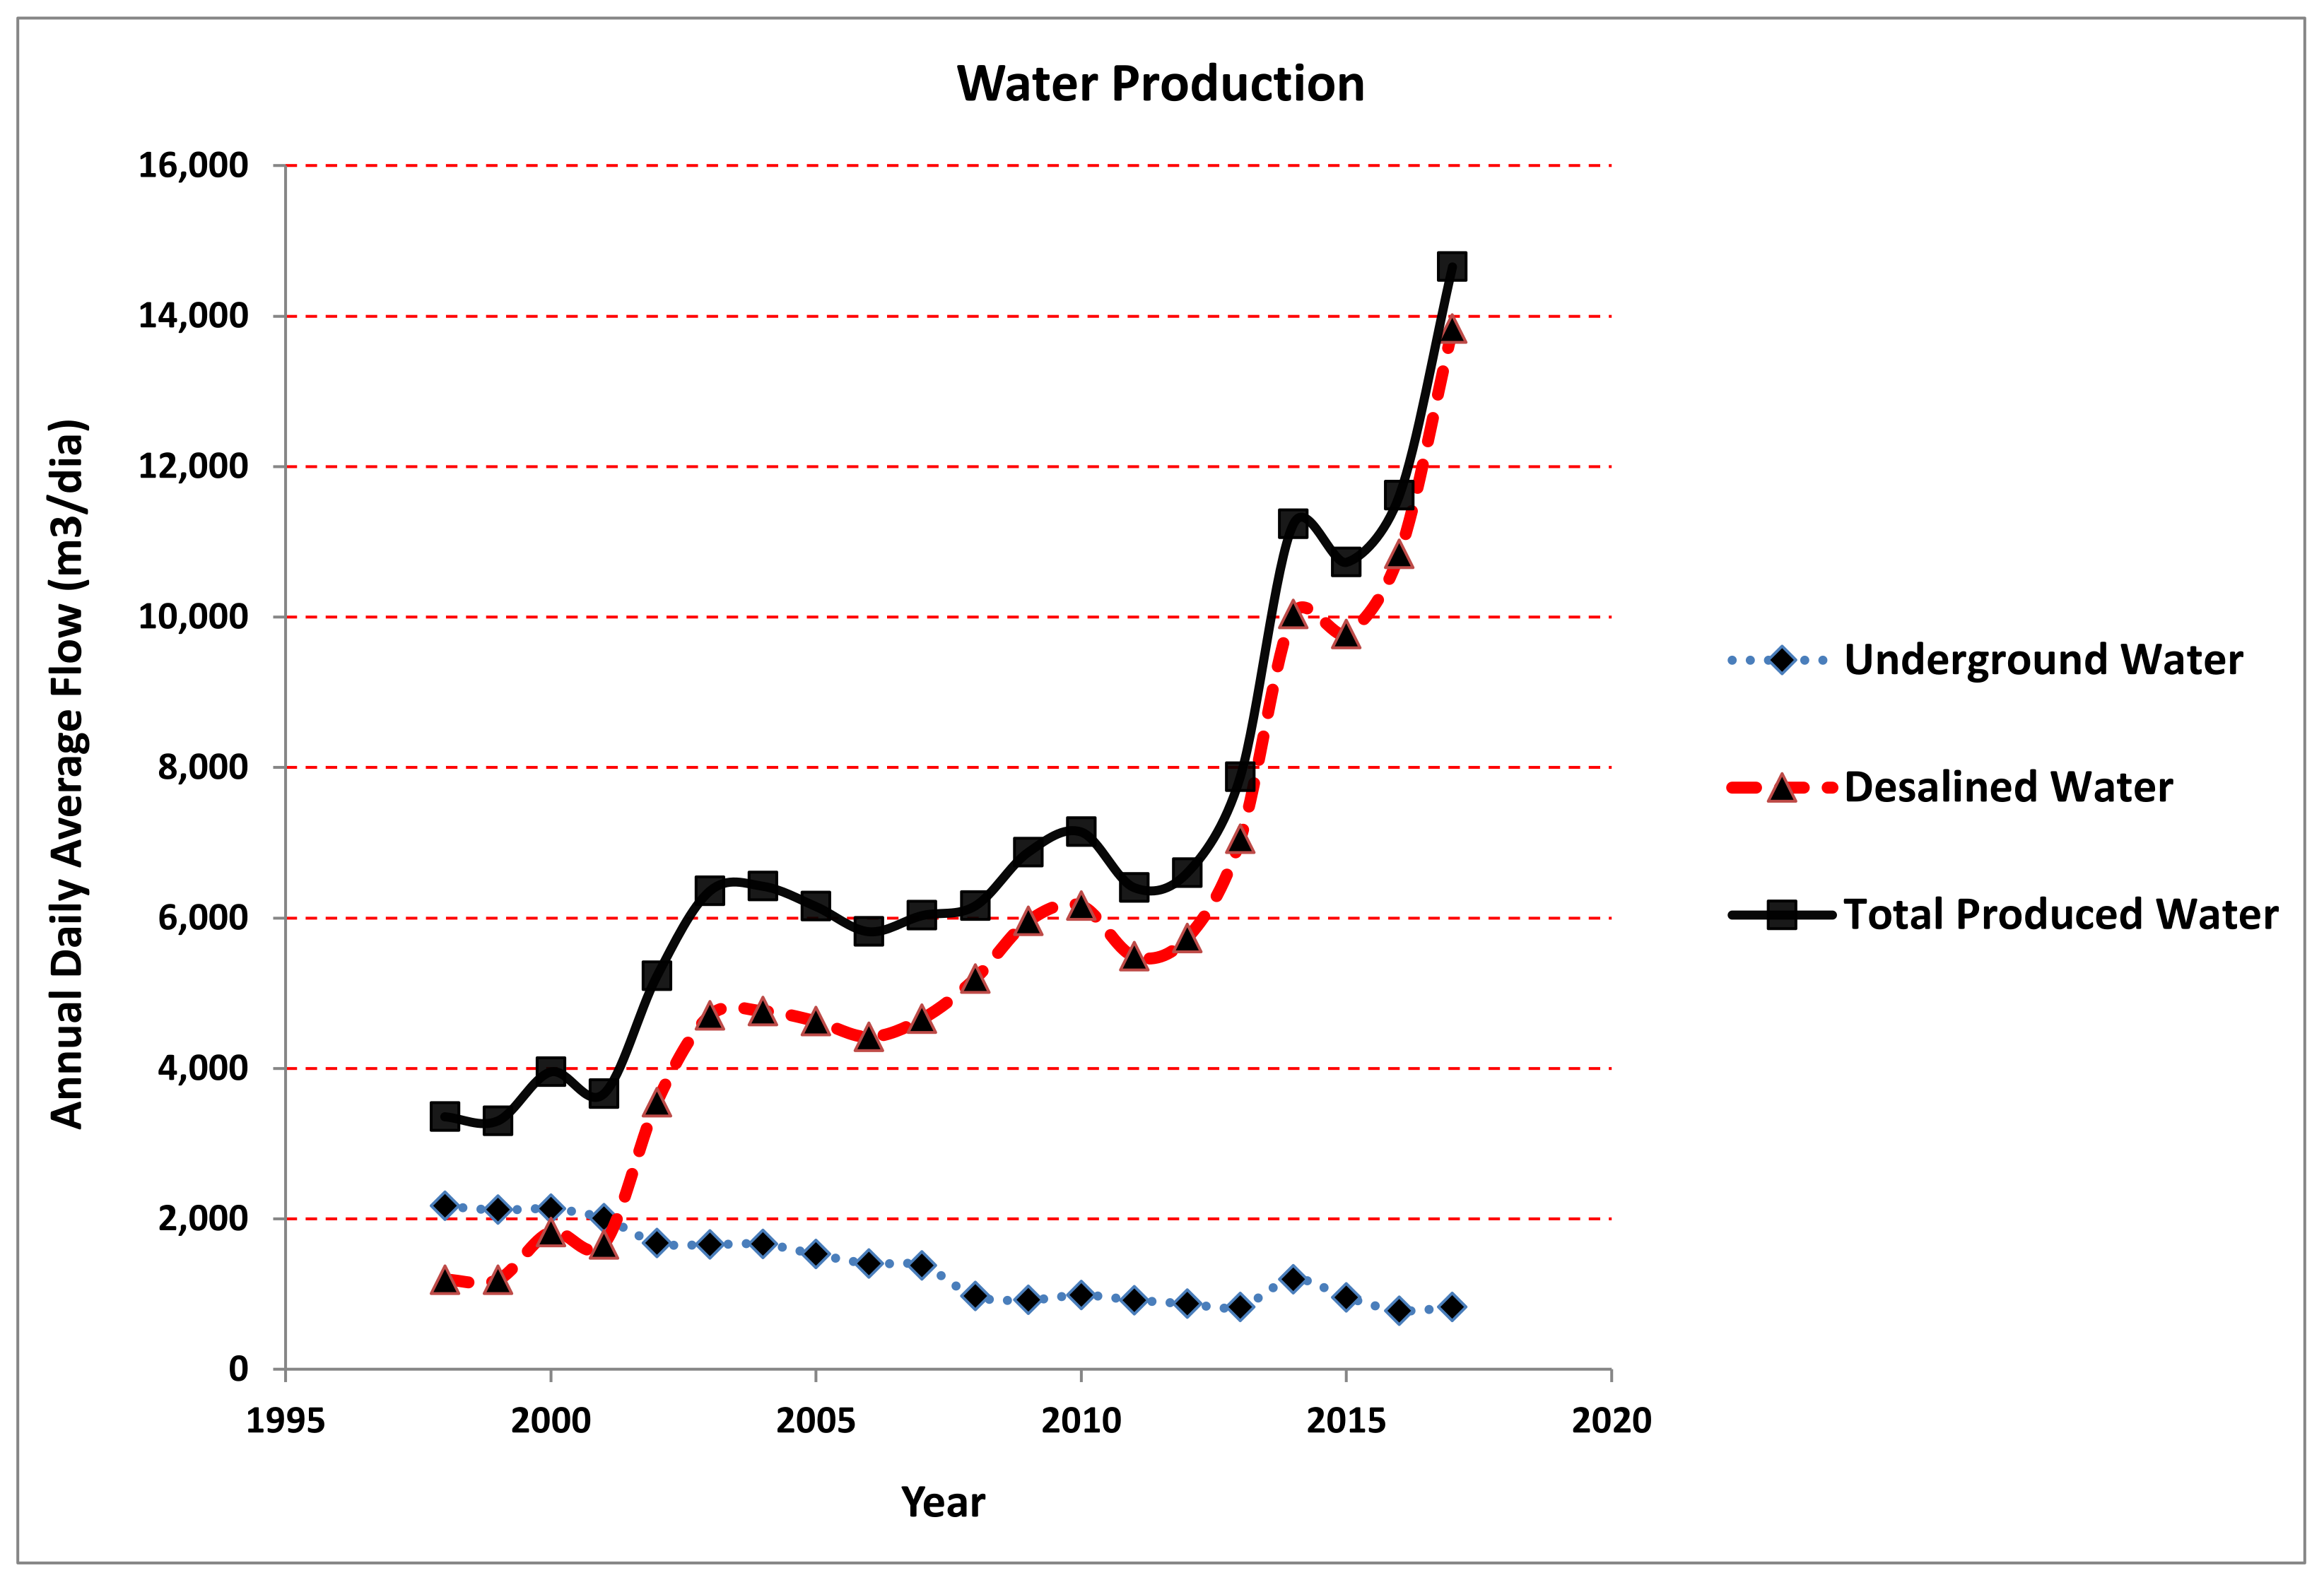
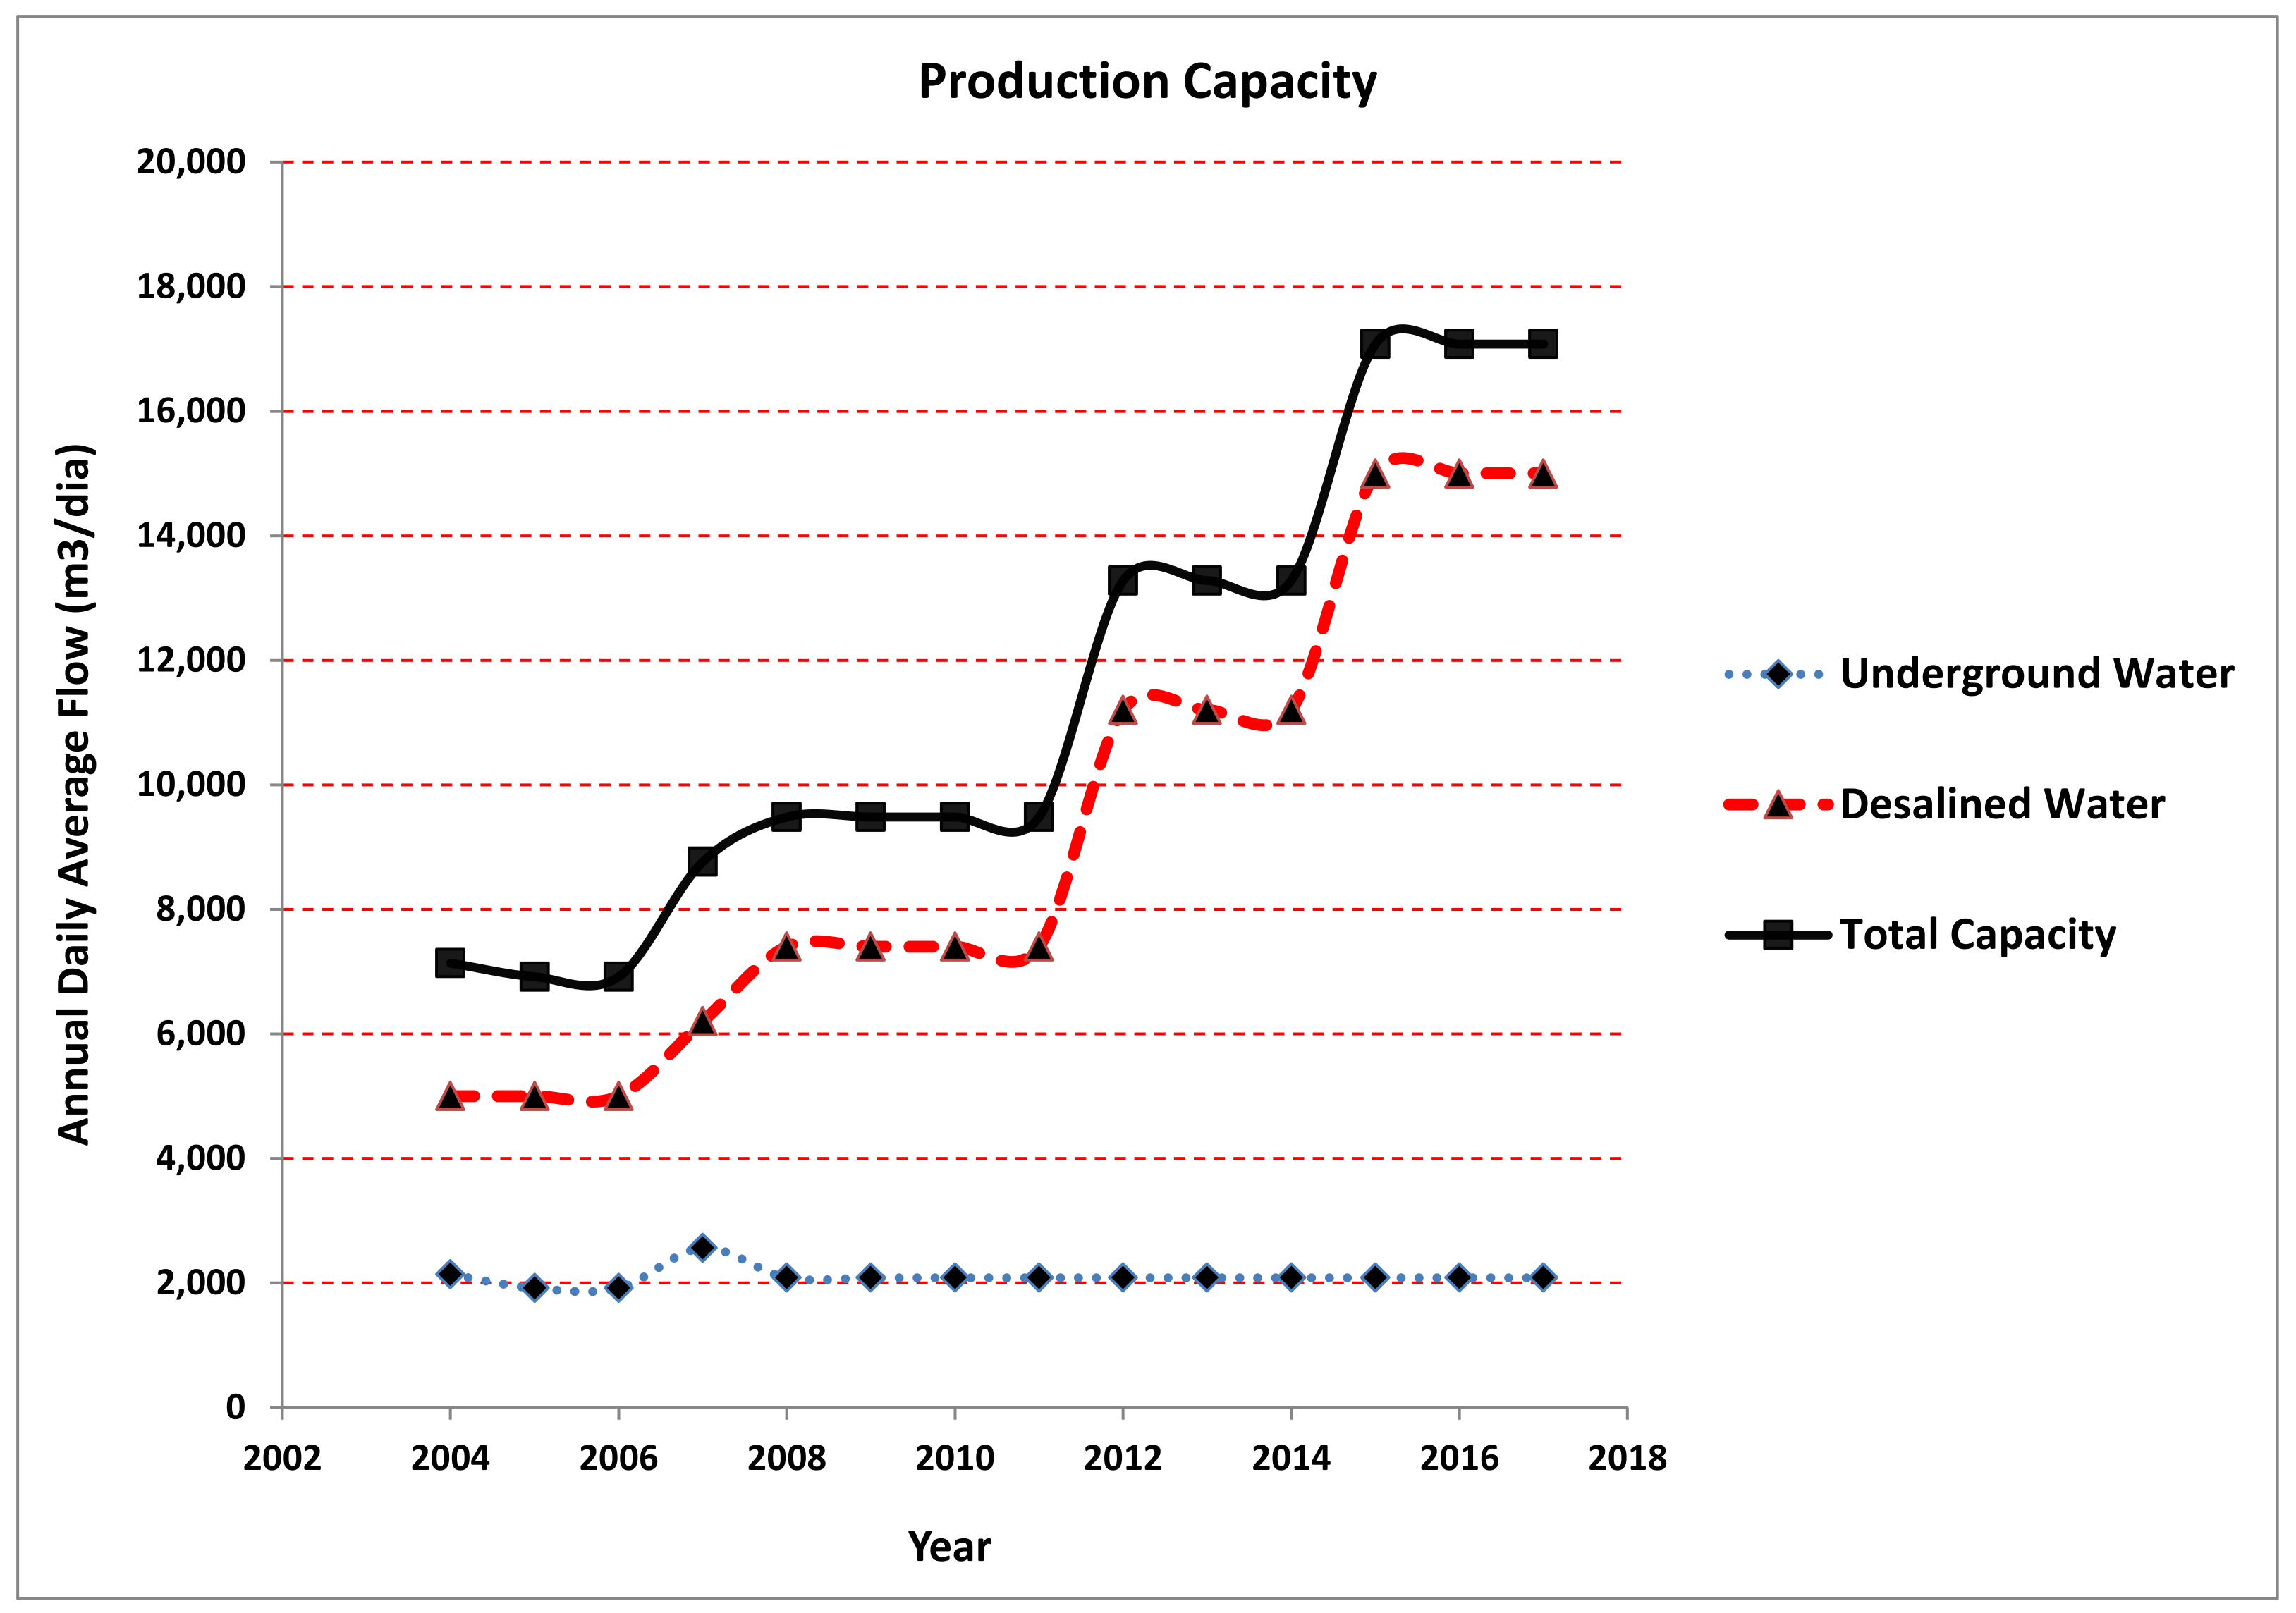
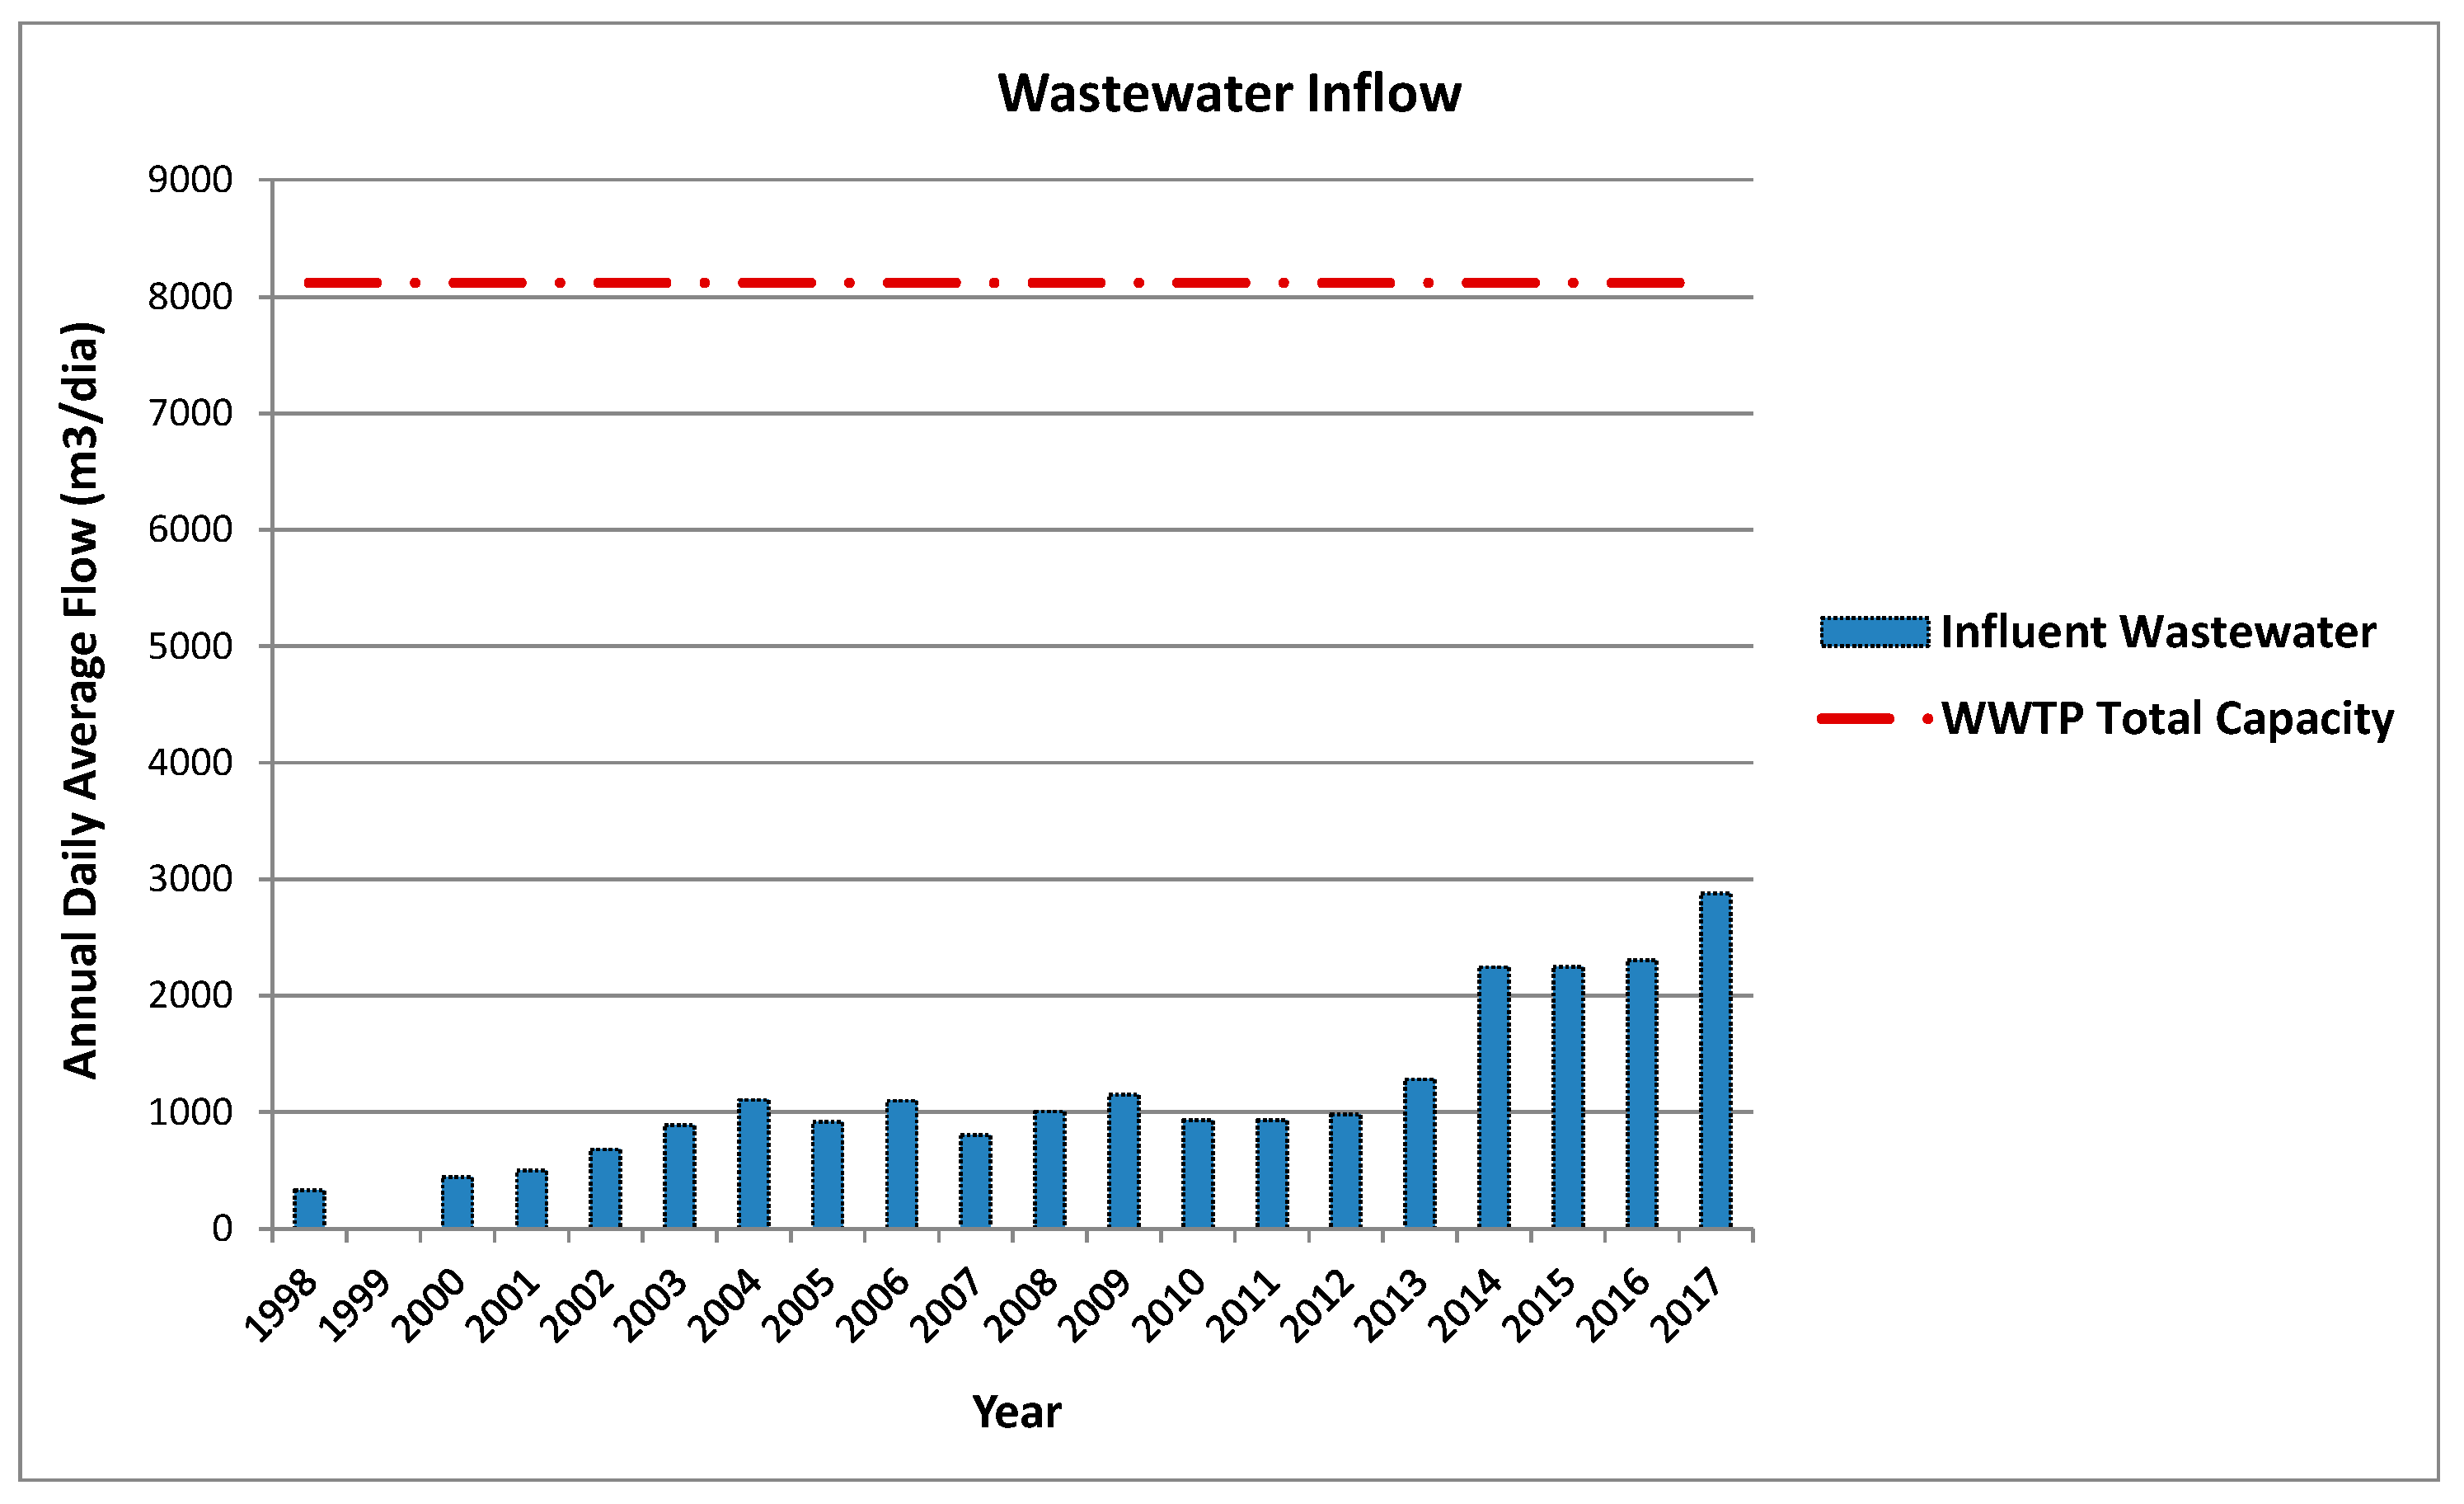
2.3. Desalination, and Wastewater Treatment and Reuse

Due to the low and erratic pluviometry observed, and particularly due to the recurrent drought periods, sea water desalination has been essential since many years ago for guaranteeing some basic water needs of Cape Verde, in general, and of Santiago Island, in particular. According to the reports of Electra, in 2001 an average of 1658 m3/day of desalinated water was produced by mechanical vapour compression to supply Praia- Santiago supply system, but in the following years the thermo-mechanic desalination process has been practically abandoned and replaced by reverse osmosis (RO) (Electra, 2001–2019) [19]. To reduce the salt concentration before the treatment in the semipermeable membranes and to improve the efficiency of the process, brackish water is captured in deep bores built at the coastline near Praia city and pumped to the desalination plant that is located near the bores.
Local experience in installed capacity and desalinated water production seems to follow the worldwide recent tendency with respect to desalination processes that seems to prefer reverse osmosis of seawater or brackish water over the conventional thermic or mechanical processes (see, for example, [2]). The production of desalinated water is traditionally considered expensive, particularly when compared to surface and underground fresh water production. The salt concentration of the produced water and the water quality in general, even if the desalinated water may be submitted to an additional treatment correction, may be also extremely relevant. With RO, the traditional high consumption of energy, the possibility of energy recovery, and the permeability, cleaning and replacement of membranes, in order to improve the energetic efficiency and, in particular, the operation and maintenance costs, are major issues that have been continuously subject to research and technological improvement, so that production costs have been progressively falling. Potential use of renewable energies, particularly wind and solar energy, when the production capacity is in excess, i.e., in low energy consumption periods, would allow the production and storage of important desalinated water volumes at a low cost, and seems to be a possible step to follow. The construction of a desalination plant, mainly for the resort water supply, but eventually also for irrigation of the golf course, seems thus a reliable, if not even indispensable, alternative source of fresh water production to be considered.
Reuse of treated wastewater is increasing swiftly, particularly for landscape irrigation, agricultural uses, or the recharge of aquifers in arid or semi-arid climates, where fresh water is a scarce good. Several different treatment processes have been developed, particularly in recent decades, both for physical, chemical, and biological treatments (see, for example [5]). With respect to conventional biologic treatment, with biological reactors containing suspended or fixed biomass, the last decades seem to show a relative tendency towards activated sludge treatment processes, or mixed processes, and related treatment techniques, such as sequencing batch reactors (SBR) or moving bed biofilm reactors (MBBR), for example. The level of treatment necessary for the wastewater reuse, depends on the water quality requirements for the intended use. It is relatively common to consider water disinfection (e.g., by ultraviolet or chlorine), removal of nutrients (nitrogen and phosphorous), and sometimes the additional removal of suspended solids or pollutants that are not removed in the previous primary and secondary treatment stages.
Praia-Santiago wastewater treatment plant that treats the wastewater collected in the city initially included just primary treatment. Later (in the first decade of this century), it was remodelled to incorporate an elaborated activated sludge biological treatment process followed by disinfection with ultraviolet, in order to allow for possible reuse for landscape irrigation [46]. Figure 4 shows the daily average volumes of wastewater drained to the WWTP of Praia in the period 1998 to 2017. It can be seen that the water daily volumes treated are far below WWTP design capacity, which may potentially hamper the performance of the plant and the treatment efficiency [47]. Praia-Santiago sewerage system seems to exhibit a common feature of arid or semi-arid climates, where the wastewater volumes reaching the WWTPs are normally well below the volumes consumed in the water supply systems.
Despite probable local limitations, the reuse of treated wastewater produced in the complex for irrigation, although requiring an additional cost due to the superior level of treatment required in the wastewater treatment plant to be built locally, seems an environmentally challenging and promising alternative. The additional total costs required to the tertiary treatment in relation to the conventional secondary biological treatment were estimated in this study for a generic activated sludge process. For that estimate, the cost models used in Diogo [48] for activated sludge WWTPs were considered and the corresponding costs were updated to 2021. It should be noted that wastewater treatment processes are an emerging area that has been continuously improving [49]. However, at this stage, only an engineering estimate for comparable additional costs is required, regardless the specific technologies or treatment details that will be exactly considered in the WWTP to be constructed.

3. Procedure Conceived for the Water Sources Optimised Selection

To select the optimised water source or set of water sources, the first step of the procedure that was devised is to quantify the water volumes required for the water supply system and the golf irrigation and its temporal variation, alongside the identification of the available water sources already existing or that may be mobilized and their estimated individual capacity. The annual average water supply demands were assumed with linear variation between 392 m3/day in the first year of operation and 1442 m3/day in the project horizon of 50 years, and the annual average of the golf water irrigation requirements were assumed practically constant with 2425 m3/day. For Supply the complex (S), the available sources considered were Desalinated Water (DWS), Surface Water (SWS) and Underground Water (UWS), and for irrigation (I) purposes the available alternatives considered were Desalinated Water (DWI), Surface Water (SWI), Underground Water (UWI), and Reused Water (RWI). It is assumed that all sources are able to guarantee the different desired average annual water volume requirements, with the exception of underground water, whose annual average capacity is limited up to 600 m3/day, and reused treated water, whose annual average capacity is assumed to be limited linearly between 215 m3/day, in the first year of operation, and 761 m3/day, in the project horizon (N) of 50 years that was considered for the civil construction works. Underground water then requires a complementary source, either for supply or for irrigation, and reused water, with or without underground water, requires complementation with surface water or desalinated water for golf irrigation. The treated wastewater annual daily average production was estimated considering that 80% of the water distributed in the supply system that is not used in the irrigation of confined/designated spaces reaches the WWTP and that 5% of the inlet volumes are lost in the treatment and storage.
In the second step, the full set of feasible alternatives is defined by full enumeration, and each alternative total cost is evaluated in monetary units (MU) or in monetary units per cubic metre of water (MU/m3) (for example € or €/m3, respectively, in the Euro Zone). For each water source, the total cost along the project horizon, CTN (MU), and the total annualised unit cost, CuT (MU/m3), both referenced to the year of the infrastructures’ construction or first year of operation, were estimated by the sum of capital costs, also known as costs of first investment, CINV (or capital annualised unit costs, CuINV), operation and maintenance costs, CO&M (or operation and maintenance annualised unit costs, CuO&M), and energy costs, CE (or energy annualised unit costs, CuE):
CTN = CINV + CO&M + CE,
and
CuT = CuINV + CuO&M + CuE.
CuO&M is approximated by CuO&M = CuINV × RO&M (with exception for desalinated water production, where CuO&M can be directly estimated by stepped cost rates), and energy costs, CuE, are calculated by CuE = CkWh × ECpcm, where RO&M is the initial annual rate of operation and maintenance expenses and CkWh and ECpcm are, respectively, the initial energy cost (in MU/kWh) and the energy consumption (in kWh per cubic metre of produced water), resulting in:
CuT = CuINV + CuINV × RO&M + CkWh × ECpcm
Given that the costs of the first investment, operation and maintenance, and energy are performed in different years, i, along the project horizon, N (in years), the technique of annualised costs is used. The capital annualised unit costs (capital recovery cost, referenced to the first year of operation), CuINV (MU/m3), is then calculated by:
CuINV = CINV i = 1 N 365.25   Q i   1 + RInf i 1 + RI i
the total operation and maintenance costs along the project horizon, CO&M (MU), is approximated by:
CO & M = CuINV × RO & M i = 1 N 365.25   Q i   1 + RInf i 1 + RI i
and the total energy costs, CE (UM), by:
CE = CkWh × ECpcm i = 1 N 365.25   Q i   1 + RInf i 1 + RI i
where Qi is the annual average water volume produced by the source in year i (in m3/day) according to the alternative, and RI and RInf are, respectively, the annual average rates of interest and inflation. It should be noted that, as basic approximation, these rates were assumed as practically constant along the project horizon N (normally 40 or 50 years for civil construction works).
Assuming that CO&M can be approximated by an expression of type:
CO & M = R 0 × CINV i = 1 N 1 + RUO & M i 1 + RI i
where R0 is an initial O&M rate and RUO&M is an annual average update rate of the expenses of O&M, then RO&M can be obtained by:
RO & M = R 0 i = 1 N 1 + RUO & M i 1 + RI i
Once the cost of all water sources, or set of water sources, and feasible alternatives are calculated, and when the cost can be assumed as single objective function to be minimized, the best solution can be directly selected deterministically in a third and final step by the simple direct cost comparison of all alternatives.
If a multi-criteria decision making is necessary or advisable for the selection of sources, then the procedure goes on to a fourth step, with the criteria definition, a weighting between criteria, and a scale selection for uniform comparison, assuming, for reasons of simplicity, a weighted sum method. Several criteria, weighs, and scale of scores, S, can be adopted. In this water resources case study, beyond the cost, four additional relevant criteria were considered: (i) Environmental Sustainability; (ii) Water Quality; (iii) Resilience, regarded here as Response to the Risk (damage level and frequency of the failure); and (iv) Local Integration. For a given criterion, each alternative is scored between 1 and 5, respectively, as weak or bad (S = 1), insufficient or below average (S = 2), reasonable or satisfactory (S = 3), good or well above average (S = 4), and very good or excellent (S = 5). The cost of each alternative (first criterion), Ci, is then adjusted for the new scale and score, Si, linearly between the worst cost alternative, Cw, scored as Sw = 1, and the best cost, Cb, scored as Sb = 5, by:
S i = 1 + 4 C w C i C w C b
The weighting between criteria is accomplished by pairwise comparison of each criterion with a criterion selected as reference, and different feasible weighing scenarios can be established according to rational preferences. In the fifth step, for a given scenario, the five scores achieved in the five criteria for each alternative are weighted according to the weighting of each criterion and the alternative solution with the highest weighted score can be directly identified. Finally, a sensibility analysis can be performed, comparing the final scores obtained in different scenarios, and the solution or solutions that are globally more promising can be selected. The application of different scenarios may allow a more comprehensive perspective, including a possible incorporation of different decision-maker preferences, which may lead to a more balanced selection, or any eventual fine tuning of the final solution.

4. Results and Discussion

The procedure described in the previous section was written/programmed in Microsoft Excel. The parameters, unit costs, rates, and remaining input data can be set or updated, according to the details of the real-world problem under consideration. The results presented and discussed in this case study were obtained considering that the project horizon (N) is 50 years, the interest rate (RI) is 3.5%, and the inflation rate (RInf) is 1%. The energy local cost (CkWh) is typically high and was set at about 0.18 €/kWh. RUO&M is estimated at 1.5% for surface and underground water and at 2.0% for reused treated wastewater. R0 is estimated at 1% and 0.5% for surface water, of supply or mixed productions, and of irrigation, respectively, 1% for underground water, and 1.5% for reused treated wastewater. With these rates, RO&M is then about 31.6% for surface water, of supply or mixed productions, and underground water, 15.8% for irrigation surface water, and 52.8% for reused water. Energy required (ECpcm) for surface water was ignored. For underground water was estimated at 0.4 kWh/m3, and for the required additional treatment of wastewater compatible with the reuse at 0.14 kWh/m3. Beyond the mentioned costs of O&M and energy, a separate additional cost of about 0.05 €/m3 for reagents was considered for the tertiary treatment of the wastewater. The capital costs for underground water were estimated at 0.12 × 10⁶ € and include the works of civil construction and complete equipment for three bores of 200 m3/day capacity each, and also the full replacement of electromechanical equipment after 25 years of operation. The capital costs for the wastewater additional tertiary treatment, serving a population equivalent of about 3800 inhabitants at the project horizon, with a maximum capacity of about 800 m3/day, and able to produce up to a maximum of 761 m3/day, were estimated at about 0.40 × 10⁶ €. All costs presented herein, although estimated and so indicative, are actual, referenced to 2021, and can be always updated for any year.
For desalination, the capital costs considered, including electromechanical equipment replacement after 25 years of operation, for desalination plant capacities between 900 and 3900 m3/day, obtained according to the water requirements of the alternative, were estimated with stepped cost rates between 2.70 × 10⁶ € per 1000 m3/day for a 900 m3/day capacity and 1.80 × 10⁶ € per 1000 m3/day for 3700 and 3900 m3/day capacities (total capital costs between, respectively, 2.43 × 10⁶, and 6.66 × 10⁶ and 7.02 × 10⁶ €). The remaining intermediate rates were then 2.50 × 10⁶, 2.40 × 10⁶, 2.20 × 10⁶, and 1.95 × 10⁶ per 1000 m3/day, respectively, for capacities 1500 m3/day, 1700 and 1900 m3/day, 2300 and 2500 m3/day, and 3100 and 3300 m3/day. The total desalination operation and maintenance unit costs (CuO&M) normally decrease with the desalinated water volumes produced (and the desalination plant capacity) and are expected to be generally lower for irrigation water than for consumption water. CuO&M was directly estimated assuming stepped unit costs between minimums of 0.16 and 0.17 €/m3 for irrigation water, and capacity plants of 2300 and 2500 m3/day and 1700 and 1900 m3/day, respectively, and a maximum of 0.22 €/m3 for supply water and 900 m3/day capacity plant. For all mixed productions for irrigation and supply, with desalination plant capacities above or equal to 3100 m3/day, CuO&M was assumed as 0.175 €/m3. Energy required for desalination (ECpcm) was estimated at 3.0 kWh/m3 for supply water, 2.5 kWh/m3 for irrigation water, and an intermediate value of 2.7 kWh/m3 for mixed water productions for irrigation and supply.
Capital costs required for dam construction and complementary works were estimated based on the information available with respect to several recent dams constructed in Santiago, particularly the Figueira Gorda dam that was constructed in 2014, has a pond maximum capacity of about 1.80 × 10⁶ m3 and had a cost of 4.1 × 10⁶ € [17,50]. Given that the inter-annual precipitation shows great variation (in many years it practically does not rain in many parts of the island) and that the water losses (infiltration and mainly direct evaporation) can be very high, the total pond storage volume estimated, Vs (m3), for satisfying a desired annual average flow rate (i.e., an annual average daily volume), Q(m3/day), was specially increased, considering a multiplying factor of 2 and total water losses of about 27% of the average values: Vs = 2 Q 365.25/(1 − 0.27) ≈ 1000 Q. For the larger ponds that are able to satisfy total water requirements above or equal to 3100 m3/day, simultaneously for golf irrigation and supplying the complex, an additional useful average daily volume of up to approximately 900 m3/day that can be mobilised is considered for supplying freely (without costs) other regional needs, increasing the local integration and the production capacity from between 3100 and 3900 m3/day up to approximately between 4000 and 4800 m3/day, respectively. Capital costs for surface water mobilisation are assumed to vary proportionally to the quotient between the maximum pond volumes (Vs) that are required for satisfying the average flow rates (Q), and the Figueira Gorda pond maximum capacity. Different flow rates varying between 900 and 4800 m3/day were considered, according to the alternatives evaluated (namely, 900, 1500, 1700, 1900, 2300, 2500, 4000, 4200, 4600, and 4800 m3/day). The required capital costs were calculated multiplying Figueira Gorda dam construction costs by the quotient between the mentioned pond volumes, they were then updated to the year of 2021, using an annual average inflation rate of about 1.5% (cost increase of about 11%), and were additionally increased by 30% to incorporate a basin transfer. The 30% increase includes the investment costs that are required to build small infrastructures of catchment in Ribª. de S. João and Ribª. de Santa Ana, near the village of S. J. Baptista, and the pipelines or channels that are required to transfer the collected volumes to the basin of Ribª. Zimbrão, in the vicinity of the complex, where it is anticipated that the main dam can be constructed.
There are four feasible solutions for water supply and eight feasible solutions for the golf irrigation (four with underground water), which are defined in the entries of Table 3. Given that the underground water capacity is below the requirements both for supply and irrigation, it is thus assumed that it cannot be used simultaneously for supply and irrigation, in contrast to what occurs with desalinated and surface water. The total number of alternative solutions to be considered then is 4 × 8 − 8 = 24. Table 3 presents the estimated total costs along the project horizon and the corresponding annualized unit costs, both referenced for 2021, for all described solutions. It should be noted that in this case study it is assumed as basic simplified approximation that for each use and source the maximum capacity of the source according to the water volumes required is always mobilised (economies of scale). Other approximations that increase the number of alternatives to be evaluated are naturally possible, particularly for other case studies, and, if necessary, stochastic optimization techniques or evolutionary algorithms may be eventually used.
If only the cost is considered as single objective function, the best solution considers that the complex should be supplied with underground and desalinated water and the irrigation should be performed with surface water. Such solution has a total cost of 1.447 × 10⁷ € and an annualised unit cost of 0.430 €/m3, which is approximately half of the cost of the worse solution (respectively, 2.928 × 10⁷ € and 0. 869 €/m3), and that considers desalination both for supply and irrigation. If, beyond surface water, the irrigation is also performed with reused water, such solution has a cost very close to the best (respectively, 1.466 × 10⁷ € and 0. 435 €/m3) but does not reduce the global cost necessary (see Table 3).
It should be noted that with reused water, the initial water production is relatively low and large additional capital costs for other irrigation sources (necessarily, surface or desalinated water) are always required. With reused water, such large additional capital costs cannot thus be fully recovered along the project horizon by the water volumes produced by the corresponding complementary sources. Even if the estimated total unit costs of the additional tertiary treatment required for reused water are relatively low (0.210 €/m3), and are only higher than the total unit costs of underground water production (both for supply, 0.099 €/m3, and for irrigation, 0.097 €/m3), such low costs for reused water production do not reduce the global costs necessary. A rather different situation should be expected, for example, for large volumes of reused water production, so that large capital costs for other additional sources are not simultaneously required.
Table 4 presents the quotients ai of the pairwise comparisons performed between the weight of each of the five criteria considered in the multi-criteria decision-making procedure described in Section 3, and the weight of the environmental sustainability criterion taken as reference, as well as the resulting weights of each criterion Wi at a 0–1 scale, for a total of four different preference scenarios. In the first scenario, all criteria have the same weight (20% at a 0–100% scale), and in the second scenario, the cost dominates with 40% and the remaining 60% are equally distributed over the other four criteria (15% each). In the third scenario, environmental sustainability and resilience dominate, with 25% each (ai = 1), are followed by water quality and cost, with 18.75% each (ai = 3/4), and local integration, with just 12.5% (ai = 1/2). Finally, in the fourth scenario, the focus is equally centred on environmental sustainability, resilience, and local integration, whose weights are assumed to be double that of water quality and cost.
Table 5 presents the scores attributed to the water sources, according to their use, on a conventional 1–5 scale for each one of the four additional criteria. To compute the resulting scores of each one of the 24 complete alternative solutions, the same relative importance is given to the water supply and irrigation (equal weighting in the final score), and for the same fixed use (supply or irrigation) the scores are weighted proportionally to the total water volumes produced along the project horizon by each source considered in the solution. The required total volumes for this computation are explicitly given or can be directly calculated from the data presented in Table 6. For the first criterion (cost), the score achieved by each one of 24 solutions was (and can be) directly calculated from the costs shown in Table 3 (either 3a, or 3b) using the Equation (9). The scores that were obtained for each criterion, according to the described procedures, and the given input data, are presented in Table 7.
Table 8 presents the final scores for all 24 feasible alternative solutions, evaluated considering all the five criteria and their weighting, according to the preferences previously described that were established in each one of the four scenarios. All data presented in Table 8 can be directly derived from the data presented in Table 4 and Table 7. The best and worst solutions, according to the criterion, or scenario of criteria weighting, can be directly identified, and are highlighted in Table 7 and Table 8. Table 7 and Table 8 may be thus regarded as self-explicative. For the water supply of the touristic complex, the results seem to confirm in general the outcome obtained previously, when the purpose was simply minimising the cost—that is, the water supply network must be preferably supplied with underground water and desalinated water. In the multi-criteria decision making, for the irrigation, the reuse of treated wastewater tends naturally to appear in most of the best scored solutions, and the surface water with a dam construction remains always preferable in practically all scenarios. However, other solutions can be naturally selected based on different cost models, different scores for each source in each criterion, or on radically different decision maker preferences of weighting between criteria.

5. Conclusions

Scarcity of water resources in the African Sahel and frequent hydric deficits in the region have been typically a well-recognised problem. The development of socio-economic activities that need large amounts of fresh water as essential element in arid and semi-arid regions, may require relevant scientific and engineering efforts, particularly when the purpose is to develop large green landscapes in adverse climatic conditions. Water resources must be properly mobilised and the available water sources rationally managed in order to guarantee in particular a suitable environmental sustainability.
After the water requirements and the capacity of all potential water sources and their limitations have been rationally identified, the selection of water sources to be mobilised both for water supply and irrigation purposes can be performed either by a direct cost comparison of all feasible alternative solutions or by a multi-criteria analysis in a multi-objective decision-making process. Beyond the cost, environmental sustainability, in order to avoid the resources depletion, water quality, considering the intended uses, resilience, or capacity to respond to the damages caused by potential failures and their frequency, and local integration, avoiding in particular the drawback of potential increase of social disequilibrium and exclusion, were found to be some of the fundamental criteria to be assessed in the decision-making process. The response of each alternative solution to each of these criteria can be assessed by a scoring on a 1 to 5 conventional scale. The overall evaluation of each solution can then be computed by a weighted sum method obtained by pairwise comparisons reflecting the relative importance of criteria. The comparisons may be established under different decision maker preferences, according to different scenarios, confirming or adjusting the outcomes obtained and enlarging the frame of the decision.
Desalination and reuse of treated wastewater can be considered viable alternatives to surface water and underground aquifers for community supply, and landscape irrigation, particularly in the case of coastal areas requiring large volumes of fresh water, and when the capacity of these last sources is very limited. Due to the specific rainfall patterns in Santiago, with large variations of total precipitation in altitude to the centre of the island and between the seasons of the year and between years, the construction of dams for surface water retention, and of complementary infrastructures for possible local water transfer between basins can be essential for sustainable water resources management, avoiding large water volumes being lost to the sea by surface runoff. Considerable volumes of water are expected to be lost directly in the ponds by infiltration and mainly by direct evaporation, but the average annual precipitation in the higher regions of the island seems to compensate such losses. Large pond volumes for storage of rain water may be required, particularly when compared to the planned water demands, due mainly to the uneven and erratic rainfall regime, but also to the mentioned water losses. Long drought periods that may occur cyclically are also a permanent concern. In Santiago, underground aquifers are a precious resource that seem to show some potential vulnerability and need to be managed with prudence, particularly with respect to the potentials of recharge and exploration.
According to the proposed procedure, under the above mentioned local circumstances, and for the input data assumed as based on the best engineering practice, the best solution that was found for the touristic complex projected in the arid to semi-arid coastal region of southwest Santiago that requires large water volumes for network supply and landscape irrigation considers simultaneously: (i) the desalination of sea water, with the construction of a desalination plant, complemented with limited water extraction of underground aquifers for water supply; and (ii) surface water mobilization, with the construction of a dam and related infrastructures for water transfer between basins, complemented with the reuse of the treated wastewater produced in the complex for irrigation. The proposed generic models may incorporate different input data for their parameters or variables, including different decision maker weighting preferences, or even different or upgraded criteria. This may lead to the selection of other optimised solutions more or less close to the one that was found in this case study as being the best.

Author Contributions

Conceptualization, A.F.D., A.L.O. and R.A.R.; methodology, A.F.D.; software, A.F.D.; validation, A.F.D.; formal analysis, A.F.D. and R.A.R.; investigation, A.F.D., A.L.O. and R.A.R.; resources, A.F.D. and A.L.O.; data curation, A.F.D. and A.L.O.; writing—original draft preparation, A.F.D.; writing—review and editing, A.F.D.; visualization, A.F.D., A.L.O. and R.A.R.; supervision, A.F.D. All authors have read and agreed to the published version of the manuscript.

Funding

This research received no external funding.

Conflicts of Interest

The authors declare no conflict of interest.

References

  1. WateReuse Association Desalination Committee. Seawater Desalination Costs, White Paper. WateReuse Association: Alexandria, VA, USA, 2012. Available online: https://watereuse.org/wp-content/uploads/2015/10/WateReuse_Desal_Cost_White_Paper.pdf (accessed on 17 June 2021).
  2. World Bank. The Role of Desalination in an Increasingly Water-Scarce World; World Bank: Washington, DC, USA, 2019. [Google Scholar]
  3. Wang, Z.; Ye, A.; Liu, K.; Tan, L. Optimal Model of Desalination Planning Under Uncertainties in a Water Supply System. Water Resour. Manag. 2021, 35, 3277–3295. [Google Scholar] [CrossRef]
  4. Resende, R.A. Reutilização de Águas Residuais Comunitárias Tratadas versus Outras Origens Alternativas. Análise dos Aspectos Económicos, Ambientais, de Qualidade dos Efluentes e Factores de Risco. M.Sc. Thesis, University of Coimbra, Coimbra, Portugal, 2012. [Google Scholar]
  5. Inc. Metcalf & Eddy; Tchobanoglous, G.; Stensel, H.; Tsuchihashi, R.; Burton, F. Wastewater Engineering: Treatment and Resource Recovery, 5th ed.; McGraw-Hill Education: New York, NY, USA, 2014; Volumes 1 & 2. [Google Scholar]
  6. Gebre, S.L.; Cattrysse, D.; Van Orshoven, J. Multi-Criteria Decision-Making Methods to Address Water Allocation Problems: A Systematic Review. Water 2021, 13, 125. [Google Scholar] [CrossRef]
  7. Marler, R.T.; Arora, J.S. The weighted sum method for multi-objective optimization: New insights. Struct. Multidisc. Optim. 2010, 41, 853–862. [Google Scholar] [CrossRef]
  8. Odu, G. Weighting methods for multi-criteria decision making technique. J. Appl. Sci. Environ. Manag. 2019, 23, 1449. [Google Scholar] [CrossRef] [Green Version]
  9. de Brum Ferreira, D. La crise climatique actuelle dans l’archipel du Cap Vert. Quelques aspects du problème dans l’île de Santiago. Finisterra 1987, 22, 113–152. [Google Scholar] [CrossRef] [Green Version]
  10. Nicholson, S.E. The West African Sahel: A Review of Recent Studies on the Rainfall Regime and Its Interannual Variability. ISRN Meteorol. 2013, 2013, 453521. [Google Scholar] [CrossRef]
  11. Sheen, K.L.; Smith, D.M.; Dunstone, N.J.; Eade, R.; Rowell, D.P.; Vellinga, M. Skilful prediction of Sahel summer rainfall on inter-annual and multi-year timescales. Nat. Commun. 2017, 8, 14966. [Google Scholar] [CrossRef] [PubMed] [Green Version]
  12. Gonçalves, N.; Valente, T.; Pamplona, J.; Antunes, I. Hydrochemistry and Evolution of Water Quality in a Context of Aridity and Increasing Agriculture in Three River Sub-Basins of Santiago Island (Cape Verde). Geoscience 2021, 11, 263. [Google Scholar] [CrossRef]
  13. Gharibi, H.; Mahvi, A.H.; Nabizadeh, R.; Arabalibeik, H.; Yunesian, M.; Sowlat, M.H. A novel approach in water quality assessment based on fuzzy logic. J. Environ. Manag. 2012, 112, 87–95. [Google Scholar] [CrossRef] [PubMed]
  14. Mirzabeygi, M.; Abbasnia, A.; Yunesian, M.; Nodehi, R.N.; Yousefi, N.; Hadi, M.; Mahvi, A.H. Heavy metal contamination and health risk assessment in drinking water of Sistan and Baluchistan, Southeastern Iran. Hum. Ecol. Risk Assess. Int. J. 2017, 23, 1893–1905. [Google Scholar] [CrossRef]
  15. Diogo, A.F.; Tavares, P.L.; Oliveira, A.L. O Projecto Hidráulica Recursos Hídricos e Ambiente—Santiago Resort e a Gestão Sustentável dos Recursos Hídricos. In Proceedings of the 6th Luso-Mozambican Engineering Congress CLME, 3rd Mozambique Engineering Congress, Maputo, Mozambique, 29 August–2 September 2011. [Google Scholar]
  16. Fortes, A.; Landim, L.; Novais, M.H.; Silva, S.; Carvalho, J.; Penha, A.; Morais, M. Qualidade da Água em Reservatórios na Ilha de Santiago-Cabo Verde. In Proceedings of the 14th Symposium on Hydraulics and Water Resources of the Portuguese Language Countries (SILUSBA), Praia, Cabo Verde, 16–20 September 2019. [Google Scholar]
  17. Sobrinho, A. Valerá a Pena Construir Barragens em Cabo Verde? Blogue Shift—Grupo de Investigação Ambiente, Território e Sociedade do ICS-ULISBOA. 2018. Available online: https://ambienteterritoriosociedade-ics.org/2018/12/05/valera-a-pena-construir-barragens-em-cabo-verde/ (accessed on 30 March 2021).
  18. Shahidian, S.; Serralheiro, R.P.; Serrano, J.; Sousa, A. O Desafio dos Recursos Hídricos em Cabo Verde—In Cabo Verde—Agronomia e Recursos Naturais. 2014. Available online: https://www.researchgate.net/publication/271835969 (accessed on 15 June 2019).
  19. Electra, Empresa de Electricidade e Água, Cabo Verde. Relatório e Contas, Exercícios de 2001 a 2019; Electra: Mindelo, Cape Verde, 2019. [Google Scholar]
  20. Diogo, A.F.; e Oliveira, A.L. Sistemas de drenagem e reutilização de águas residuais comunitárias da zona Sudoeste do município da Praia, Cabo Verde. Um caso de estudo. In Proceedings of the 5th Luso-Mozambican Engineering Congress, CLME, Maputo, Mozambique, 2–4 September 2008. [Google Scholar]
  21. INECV (2010), Recenseamento Geral da População e Habitação 2010—Estado e Estrutura da População Cabo-Verdiana. Available online: https://ine.cv/wp-content/uploads/2016/11/analise-do-estado-e-estrutura-da-populacao-censo-2010.pdf (accessed on 13 July 2021).
  22. Pinto, M.M.S.C. Geochemical Mapping of Santiago Island with a Medium/Low Sampling Density. Ph.D. Thesis, Universidade de Aveiro, Aveiro, Portugal, 2010. [Google Scholar]
  23. Martins, C.C.S.S. Impact of the Climate Change on the Santiago´s Island Hydrological Regime and Consequences on the Local Drainage System. M.Sc. Thesis, University of Coimbra, Coimbra, Portugal, 2017. [Google Scholar]
  24. Silva, E.P.; e Sabino, A.A. Projecto de Conservação, Drenagem e Mobilização de Recursos Hídricos para fins Múltiplos. Estudo hidrológico das bacias hidrográficas das ribeiras de S. Martinho Pequeno, S. Martinho Grande, Calheta de S. Martinho e Ribão Seca, Santiago Golf Resort. Praia, Cape Verde, 2007.
  25. Centro de Estudos de Pedologia e Centro de Geografia. Carta Hipsométrica da Ilha de Santiago, Escala 1: 50 000; Instituto de Investigação Científica Tropical, Instituto para a Cooperação Económica: Lisboa, Portugal, 1983. [Google Scholar]
  26. Faria, F.X. Os solos da Ilha de Santiago; Junta de Investigações do Ultramar, Estudos, Ensaios e Documentos, N.º 124; Overseas Inverstigation Board: Lisboa, Portugal, 1970. [Google Scholar]
  27. Ventura, J.E.; Mascarenhas, J.M. A problemática dos recursos hídricos em Santiago. In Proceedings of the 2nd Congresso Lusófono de Ciência Regional, Cidade da Praia, Cape Verde, 6–11 July 2009. [Google Scholar]
  28. Sacramento Campos, Projetos e Serviços, S.A. Empreendimento Turístico Costa de Prata em Cabo Verde—Projeto de Rede de Águas—Estudo Prévio. Barreiro, Portugal, 2012.
  29. Sacramento Campos, Projetos e Serviços, S.A. Empreendimento Turístico Costa de Prata em Cabo Verde—Projeto de Esgotos Domésticos e Pluviais—Estudo Prévio. Barreiro, Portugal, 2012.
  30. Sacramento Campos, Projetos e Serviços, S.A. Empreendimento Turístico Costa de Prata em Cabo Verde—Projeto de Rede de Águas—Projeto de Execução. Barreiro, Portugal, 2013.
  31. Sacramento Campos, Projetos e Serviços, S.A. Empreendimento Turístico Costa de Prata em Cabo Verde—Projeto de Esgotos Domésticos e Pluviais—Projeto de Execução. Barreiro, Portugal, 2013.
  32. Diogo, A.F. Relatório Final Do Trabalho de Consultadoria dos Projectos dos Sistemas de Abastecimento de Água, Drenagem de Águas Residuais e Reutilização de Águas Residuais Comunitárias Tratadas Para Rega do Empreendimento Santiago Golf Resort, Cabo Verde; Technical Report for the Project Hydraulics, Water Resources and Environment—Santiago Resort; FCTUC, IPN: Coimbra, Portugal, 2008. [Google Scholar]
  33. Onno Schaap, Consultadoria. Anteprojecto de Rega e Drenagem para Santiago Golfe, Cabo Verde, Ilha de Santiago. Estoril, Portugal, 1998.
  34. Sacramento Campos, Projetos e Serviços, S.A. Sustentabilidade dos sistemas de infraestruturas gerais do empreendimento turístico da Sociedade Costa de Prata (Avaliação prévia). Barreiro, Portugal, 2008.
  35. Pina, A.F.L. Hidroquímica e Qualidade das Águas Subterrâneas da ilha de Santiago—Cabo Verde. Ph.D. Thesis, Universidade de Aveiro, Aveiro, Portugal, 2009. [Google Scholar]
  36. Monteiro, R.D. Avaliação de Recursos Hídricos e Viabilidade da Recarga Artificial de Aquíferos na Bacia Hidrográfica dos Engenhos na Ilha de Santiago—Cabo Verde. M.Sc. Thesis, Universidade Nova de Lisboa, Lisboa, Portugal, 2013. [Google Scholar]
  37. Ragab, R.; Finch, J.; Harding, R. Estimation of groundwater recharge to chalk and sandstone aquifers using simple soil models. J. Hydrol. 1997, 190, 19–41. [Google Scholar] [CrossRef]
  38. Penman, H.L. The dependence of transpiration on weather and soil conditions. Eur. J. Soil Sci. 1950, 1, 74–89. [Google Scholar] [CrossRef]
  39. Penman, H.L. The water balance of the Stour catchment area. J. Inst. Water Engr. 1950, 4, 457–469. [Google Scholar]
  40. Grindley, J. The estimation of soil moisture deficits. Meteorol. Mag. 1967, 96, 97–108. [Google Scholar]
  41. Varela, I.L.B.L. Estudo de Aproveitamento de Fins Múltiplos da Barragem de Faveta, Ilha de Santiago (Cabo Verde) com Enfoque na rega e Abastecimento de água. M.Sc. Thesis, University of Coimbra, Coimbra, Portugal, 2014. [Google Scholar]
  42. Santos, E.A.T. As Barragens em Cabo Verde: Avaliação dos Impactes Ambientais, Socioeconómicos e Culturais. Caso de Estudo “A Barragem do Poilão” Ilha de Santiago. M.Sc. Thesis, Universidade Nova de Lisboa, Lisboa, Portugal, 2013. [Google Scholar]
  43. Gonçalves, R.M.D.; Gomes, A.M.; Pina, A.F.L.; Almeida, E.P.; Santos, F.A.M. Investigação hidrogeofísica na ilha de Santiago (Cabo Verde) usando sondagens transientes (TDEM), Projecto HYDROARID (POCTI/CTE-GEX/55399/2004). In Proceedings of the 5ª Assembleia Luso-Espanhola de Geodesia e Geofísica, Seville, Spain, 30 January–3 February 2006. [Google Scholar]
  44. Heitor, A.M.; Pina, A.P. Águas subterrâneas em Cabo Verde. Qualidade da água na Ilha de Santiago. In Proceedings of the 6º SILUSBA—Simpósio de Hidráulica e Recursos Hídricos dos Países de Língua Oficial Portuguesa, Praia, Cabo Verde, 10–13 November 2003. [Google Scholar]
  45. Santos, F.A.M.; Almeida, E.P.; Gomes, M.; Pina, A. Hydrogeological investigation in Santiago Island (Cabo Verde) using magnetotellurics and VLF methods. J. Afr. Earth Sci. 2006, 45, 421–430. [Google Scholar] [CrossRef]
  46. Gomes, J.R.F. Safe Reuse of Treated Urban Wastewater in Praia, Cape Verde: A Case Study. M.Sc. Thesis, Universidade Nova de Lisboa, Lisbon, Portugal, 2014. [Google Scholar]
  47. Naston Ltd. Praia Wastewater Sewage Treatment Plant. Acceptance Performance Testing; Naston Ltd.: Weybridge, UK, 2007. [Google Scholar]
  48. Diogo, A.F. Optimização Tridimensional de Sistemas Urbanos de Drenagem. Ph.D. Thesis, University of Coimbra, Coimbra, Portugal, 1996. [Google Scholar]
  49. Ahmadi, E.; Yousefzadeh, S.; Mokammel, A.; Miri, M.; Ansari, M.; Arfaeinia, H.; Badi, M.Y.; Ghaffari, H.R.; Rezaei, S.; Mahvi, A.H. Kinetic study and performance evaluation of an integrated two-phase fixed-film baffled bioreactor for bioenergy recovery from wastewater and bio-wasted sludge. Renew. Sustain. Energy Rev. 2020, 121, 109674. [Google Scholar] [CrossRef]
  50. NRV-Norvia (2011–2015); Ficha Projeto: Barragem Principal e Rede de Adução (2015); Barragem da Figueira Gorda e Rede de Adução (2013); Barragem do Saquinho e Rede de Adução (2012); Barragem da Faveta e Rede de Adução (2011); Barragem do Salineiro e Rede de Adução (2011). Available online: https://www.nrv-norvia.com/pt/projetos?type=7&country=65&year=&order= (accessed on 11 July 2021).
Figure 1. Santiago-Cape Verde, simplified orography of the island, location of the touristic complex and its hydrographic integration, main streams in the southwest coast, and main hydrographic basins in the vicinity of the complex. (Simplified orography drawn according to [25]).
Sustainability 13 12696 g001
Figure 2. Praia-Santiago Water Supply System—Daily average volumes of produced water according to their origins. Source: Electra Annual Reports (Electra, 2001–2019) [19].
Sustainability 13 12696 g002
Figure 3. Praia-Santiago Water Supply System—Daily average volumes of water production capacity according to their origins. Source: Electra Annual Reports (Electra, 2001–2019) [19].
Sustainability 13 12696 g003
Figure 4. Praia-Santiago Sewerage System—Daily average volumes of wastewater drained to Praia WWTP. Source: Electra Annual Reports (Electra, 2001–2017) [19].
Sustainability 13 12696 g004
Table 1. Average and median annual precipitation and observed percentages of annual average precipitation during the rainy season between July and November (periods of 2, 3, and 5 months) in the rain gauge stations of the region close to the complex in a 46-year period from 1961 to 2006 (Source: [22,24,35,36], INMG Cape Verde).
Rain
Gauge
Station
Annual
Total
Precipitation
(mm)
% of Observed Annual Average Precipitation in the
Wet Season
Nº of
Absent Annual Data
(-)
July–November
5
Months
August–October
3
Months
August–September
2
Months
MeanMedian
Corrected
ObservedCorrected
S. J. Baptista137.5141.2128.898.991.477.935
S. Martinho P.219.0202.0172.498.586.568.330
Santana294.0279.9277.099.196.287.520
Telhal363.9382.7340.298.191.170.114
Curralinho488.2485.8506.796.987.271.44
Praia159.3158.7157.195.689.374.72
Trindade193.9198.8191.196.689.876.06
Table 2. Surface water resources—hydrographic basins adjacent to the complex, areas of influence using Thiessen polygon method, rainy season (July/August/September) average precipitation and annual mean excess runoff at the stations, and annual mean precipitation and annual mean excess runoff at the basins in a 46-year period from 1961 to 2006.
Hydrographic Basins—Total Area (km2)
B1B2B3B4
46.7386.91514.5827.730
Rain Gauge
Station
Hydrographic Basins
Influence Area (km2)
Annual Average
Rainfall/Runoff (mm)
August
to October
August
to September
Excess
Runoff
B1B2B3B4
S. João Baptista7.2366.8135.8583.235129.0110.0-
S. Martinho Pequeno---2.224174.8137.9-
Santana21.7560.1028.7242.271269.2245.021.8
Telhal0.564---348.8268.147.3
Curralinho17.182---423.5347.1110.8
Praia----141.7118.5-
Trindade----178.7151.1-
Hydrographic Basins
B1B2B3B4
Annual Mean
Precipitation (mm)
335.4143.2224.2199.4
Annual Median
Precipitation (mm)
339.2131.0217.5184.9
Annual Mean Runoff (m3/year)2,440,2932217190,01049,464
Annual Mean Volume Available (mil. m3/year)2.4400.0020.1900.049
Table 3. Definition of all feasible alternative solutions assessed for the water supply and golf irrigation and their estimated total cost along the project horizon of 50 years. All costs are in (a) euros and (b) euros/m3, and are referenced for 2021. (The best and worst solutions are highlighted in the table).
(a) Total cost along the project horizon for each alternative solution (€)
Golf IrrigationSupply of the Complex
1—DWS2—SWS3—UWS + DWS4—UWS + SWS
1—DWI2.928 × 1072.739 × 1072.540 × 1072.537 × 107
2—SWI1.951 × 1072.076 × 1071.447 × 1071.875 × 107
3—RWI + DWI2.689 × 1072.515 × 1072.297 × 1072.313 × 107
4—RWI + SWI1.969 × 1072.084 × 1071.466 × 1071.883 × 107
5—UWI + DWI2.518 × 1072.344 × 107--
6—UWI + SWI1.783 × 1071.877 × 107--
7—UWI + RWI + DWI2.276 × 1072.111 × 107--
8—UWI + RWI + SWI1.802 × 1071.886 × 107--
(b) Total annualized unit cost for each alternative solution (€/m3)
Golf IrrigationSupply of the Complex
1—DWS2—SWS3—UWS + DWS4—UWS + SWS
1—DWI0.8690.8130.7540.753
2—SWI0.5790.6160.4300.557
3—RWI + DWI0.7980.7470.6820.687
4—RWI + SWI0.5850.6190.4350.559
5—UWI + DWI0.7480.696--
6—UWI + SWI0.5290.557--
7—UWI + RWI + DWI0.6760.627--
8—UWI + RWI + SWI0.5350.560--
Table 4. Four analyzed scenarios for the quotients ai of the pairwise comparisons performed between the weight of each criterion and the environmental sustainability criterion weight, taken as reference, for all considered criteria nc (nc = 5), and resulting weights Wj (with j = 1, nc) on a 0–1 scale ( W j = a j i = i nc a i ).
Scenario Criterion
Environmental SustainabilityWater QualityResilienceLocal
Integration
Cost
1. Pairwise
Comparison (-)
11111
Criteria Weight (-)0.20.20.20.20.2
2. Pairwise
Comparison (-)
11118/3
Criteria Weight (-)0.150.150.150.150.4
3. Pairwise
Comparison (-)
13/411/23/4
Criteria Weight (-)0.250.18750.250.1250.1875
4. Pairwise
Comparison (-)
11/2111/2
Criteria Weight (-)0.250.1250.250.250.125
Table 5. Scores of the water sources in a scale 1 to 5 according to the use for the additional four criteria. (1—Weak or bad; 2—Insufficient or below average; 3—Reasonable or satisfactory; 4—Good or well above average; 5—Very good or excellent).
CriterionSupply SourcesGolf Irrigation Sources
DWSSWSUWSDWISWIUWIRWI
Environmental
Sustainability
3522415
Water Quality2452555
Resilience5135134
Local Integration4523415
Table 6. Estimated total volumes produced/used along the project horizon.
Total Volume (m3)
Resort
Supply
Golf
Irrigation
Irrigation with
Underground
Water
Supply with
Underground
Water
Irrigation with Reused Water
1.675 × 1074.429 × 1071.096 × 1071.055 × 1078.910 × 106
Table 7. Scores of all feasible alternative solutions assessed in a scale 1 to 5 for all five criteria, according to each criterion. (1—Weak or bad; 2—Insufficient or below average; 3—Reasonable or satisfactory; 4—Good or well above average; 5—Very good or excellent. The best and worst solutions for each criterion are highlighted in the table).
(a) Cost
Golf IrrigationSupply of the Complex
1—DWS2—SWS3—UWS + DWS4—UWS + SWS
1—DWI1.0001.5122.0502.056
2—SWI3.6403.3025.0003.845
3—RWI + DWI1.6452.1172.7042.661
4—RWI + SWI3.5903.2804.9503.824
5—UWI + DWI2.1092.580--
6—UWI + SWI4.0933.838--
7—UWI + RWI + DWI2.7623.208--
8—UWI + RWI + SWI4.0433.816--
(b) Environmental Sustainability
Golf IrrigationSupply of the Complex
1—DWS2—SWS3—UWS + DWS4—UWS + SWS
1—DWI2.5003.52.1852.555
2—SWI3.5004.5003.1853.555
3—RWI + DWI2.8023.8022.4872.857
4—RWI + SWI3.6014.6013.2863.656
5—UWI + DWI2.3763.376--
6—UWI + SWI3.1294.129--
7—UWI + RWI + DWI2.6783.678--
8—UWI + RWI + SWI3.2294.229--
(c) Water Quality
Golf IrrigationSupply of the Complex
1—DWS2—SWS3—UWS + DWS4—UWS + SWS
1—DWI2.00032.9453.315
2—SWI3.5004.5004.4454.815
3—RWI + DWI2.3023.3023.2473.617
4—RWI + SWI3.5004.5004.4454.815
5—UWI + DWI2.3713.371--
6—UWI + SWI3.5004.500--
7—UWI + RWI + DWI2.6733.673--
8—UWI + RWI + SWI3.5004.500--
(d) Resilience/Response to Risk
Golf IrrigationSupply of the Complex
1—DWS2—SWS3—UWS + DWS4—UWS + SWS
1—DWI5.00034.3703.630
2—SWI3.0001.0002.3701.630
3—RWI + DWI4.8992.8994.2693.529
4—RWI + SWI3.3021.3022.6721.932
5—UWI + DWI4.7532.753--
6—UWI + SWI3.2471.247--
7—UWI + RWI + DWI4.6522.652--
8—UWI + RWI + SWI3.5491.549--
(e) Local Integration
Golf IrrigationSupply of the Complex
1—DWS2—SWS3—UWS + DWS4—UWS + SWS
1—DWI3.50042.8703.055
2—SWI4.0004.5003.3703.555
3—RWI + DWI3.7014.2013.0713.256
4—RWI + SWI4.1014.6013.4713.656
5—UWI + DWI3.2533.753--
6—UWI + SWI3.6294.129--
7—UWI + RWI + DWI3.4543.954--
8—UWI + RWI + SWI3.7294.229--
Table 8. Final scores of all feasible alternative solutions assessed on a scale of 1 to 5 considering all criteria according to the weighting obtained in each scenario. (1—Weak or bad; 2—Insufficient or below average; 3—Reasonable or satisfactory; 4—Good or well above average; 5—Very good or excellent. The best and worst solutions for each scenario are highlighted in the table).
(a) Scenario 1
Golf IrrigationSupply of the Complex
1—DWS2—SWS3—UWS + DWS4—UWS + SWS
1—DWI2.8003.0022.8842.922
2—SWI3.5283.5603.6743.480
3—RWI + DWI3.0703.2643.1563.184
4—RWI + SWI3.6193.6573.7653.576
5—UWI + DWI2.9723.166--
6—UWI + SWI3.5203.569--
7—UWI + RWI + DWI3.2443.433--
8—UWI + RWI + SWI3.6103.665--
(b) Scenario 2
Golf IrrigationSupply of the Complex
1—DWS2—SWS3—UWS + DWS4—UWS + SWS
1—DWI2.3502.6302.6752.706
2—SWI3.5563.4964.0053.571
3—RWI + DWI2.7142.9783.0433.053
4—RWI + SWI3.6123.5624.0613.638
5—UWI + DWI2.7563.020--
6—UWI + SWI3.6633.636--
7—UWI + RWI + DWI3.1243.377--
8—UWI + RWI + SWI3.7183.703--
(c) Scenario 3
Golf IrrigationSupply of the Complex
1—DWS2—SWS3—UWS + DWS4—UWS + SWS
1—DWI2.8752.9712.9342.935
2—SWI3.4643.4003.5813.364
3—RWI + DWI3.1283.2173.1893.181
4—RWI + SWI3.5683.5093.6853.474
5—UWI + DWI3.0293.117--
6—UWI + SWI3.4713.424--
7—UWI + RWI + DWI3.2833.367--
8—UWI + RWI + SWI3.5753.533--
(d) Scenario 4
Golf IrrigationSupply of the Complex
1—DWS2—SWS3—UWS + DWS4—UWS + SWS
1—DWI3.1253.1892.9812.981
2—SWI3.5183.4753.4123.268
3—RWI + DWI3.3443.4033.2013.195
4—RWI + SWI3.6373.5983.5313.391
5—UWI + DWI3.1553.214--
6—UWI + SWI3.4503.419--
7—UWI + RWI + DWI3.3753.431--
8—UWI + RWI + SWI3.5703.542--
Publisher’s Note: MDPI stays neutral with regard to jurisdictional claims in published maps and institutional affiliations.

