Article

An Assessment of the On-Road Mobile Sources Contribution to Particulate Matter Air Pollution by AERMOD Dispersion Model

1
Department of Environmental Engineering, Faculty of Ecology and Environmental Sciences, Technical University in Zvolen, 960 01 Zvolen, Slovakia
2
Department of Physics, Electrical Engineering and Applied Mechanics, Technical University in Zvolen, 960 01 Zvolen, Slovakia
3
Slovak Hydrometeorological Institute, 833 15 Bratislava, Slovakia
*
Authors to whom correspondence should be addressed.
Sustainability 2021, 13(22), 12748; https://doi.org/10.3390/su132212748
Submission received: 11 October 2021 / Revised: 10 November 2021 / Accepted: 16 November 2021 / Published: 18 November 2021

Abstract

:
On-road mobile sources of emissions make important contributions to particulate matter pollution (PM2.5–PM10) in cities. The quantification of such pollution is, however, highly challenging due to the number of interacting factors that affect emissions such as vehicle category, emission standard, vehicle speed and weather conditions. The proper identification of individual sources of emission is particularly necessary for air quality management areas. In this study, we estimated exhaust and non-exhaust traffic-related PM2.5 and PM10 contributions to total ambient pollution in Banská Bystrica (Slovak republic) by simulation based on the AERMOD dispersion model. Emission rates of particular vehicle categories were obtained through vehicle population statistics, traffic data survey and emission factors from the EMEP/EEA air pollutant emission inventory guidebook. Continuous PM10 and PM2.5 data from air quality monitoring stations were analysed for the years 2019–2020 and compared with modelled concentrations. The annual concentration values of PM2.5 and PM10 in the study area reached 16.71 μg/m3 and 15.57 μg/m3, respectively. We found that modelled PM2.5 peak concentration values exceeded the WHO air quality guideline annual mean limit. Traffic-related PM2.5 and PM10 contributions to ambient pollution at the reference point located nearby to a busy traffic route were approximately 25% and 17%, respectively. The reference point located outside the main transport corridors showed an approximately 11% contribution, both for PM2.5 and PM10 concentrations. The simulations showed that PM pollution is greatly contributed to by on-road mobile sources of emissions in the study area, and especially non-exhaust emissions, which require serious attention in association with their health impacts and the selection of Banská Bystrica as an air quality management area.

1. Introduction

Air pollution is a major problem in recent years, which has a significant impact on the environment and human health. Local air pollution is associated with greater sensitivity to respiratory infections in humans. According to the World Health Organization (WHO) one third of deaths from stroke, lung cancer and heart disease are due to air pollution [1].
While the level of air pollution by stationary sources of pollution is relatively measurable and controlled by regular emission monitoring and an emission inventory system collecting a comprehensive set of data on stationary sources, on-road mobile sources of pollution are quite difficult to assess. Populations living close to major traffic routes, especially children and older adults, have an increased occurrence of health issues associated with air pollution related to emissions from on-road mobile sources [2]. The increased air pollution in urban areas is due to the urban canyoning effect where on-road mobile sources contribute two to ten times as much as in general background locations [3]. The health impacts from air pollution near roadways causes hundreds of preventable deaths, and hospitalizations in urban areas [4,5,6].
In addition, the growing ability of people to own vehicles, and strong intensification of global demand for goods and services increases the exposure to emissions in urban areas. The WHO concluded that up to 30% of fine particulate matter with particles of diameter of less than 2.5 µm (PM2.5) in urban areas comes from road traffic exhaust emissions. Road transport contributes the majority of urban background PM pollution, emissions of nitrogen dioxide (NO2), and volatile organic compounds represented primarily by benzene [7,8]. Almost all tailpipe exhaust PM emissions can be found in the PM2.5 range [3]. Non-exhaust emissions of PM are also released due to the mechanical wearing of brakes, tires, road surfaces, and re-suspended road dust [8]. Non-exhaust traffic related emissions of PM (PM2.5-PM10) contribute as much and often more than exhaust emissions in cities [3,9]. The adverse health effect of PM is due to its being deposited in the respiratory system because of short-term (hours, days) and long-term (months, years) exposure [10]. According to Tena and Clarà [11], the size and shape of PM are primary factors that condition its deposition in the upper respiratory track or deep into the lungs.
Air pollution related to non-exhaust emissions from road traffic is less well-understood than from exhaust sources, which have decreased over the past decades thanks to the tightening of emission standards (in the European Union referred as EURO-X emission standards). Increasing the stringency of existing emissions standards, replacing older engines without diesel particulate filter (DPF), and electrification of vehicles will result in almost all PM emissions from road traffic coming from non-exhaust sources in future years [12]. However, there are numerous non-exhaust processes which have received relatively little attention and which may contribute significantly to atmospheric PM pollution. Estimating non-exhaust PM emission is subject to high uncertainty, due to the lack of up-to-date emission inventory guidelines and research [13].
According to Franco et al. [14], emission factors are used as an apparatus to quantify specific pollutants emitted by a single vehicle or fleet. The reference unit is usually distance travelled by vehicle, or consumed amount of energy (fuel), respectively. Emission factors are derived for vehicle type and depend on vehicle characteristics, vehicle emission control technology, type and quality of fuel used, operating environment, operating conditions and other parameters.
Air quality modelling is an essential tool to determinate the spatial distribution of pollutants concentration and to evaluate the population exposure to traffic-related emissions. Hence, monitoring and modelling of transportation-related PM emissions and their dispersion are important for understanding human exposure and to prevent harmful effects on human health and the environment as a whole. According to Askariyeh et al. [15], air pollution dispersion models, especially the American Meteorological Society (AMS) and U.S. Environmental Protection Agency (U.S. EPA) Regulatory Model (AERMOD) [16,17], can provide satisfactory results for pollution distribution occurring close to roadways. Previous research by Askariyeh et al. [15] found that AERMOD provides contradictory results when modelling mobile line sources with different program configurations as area or volume sources, and more studies are needed to further evaluate the performance of AERMOD for near-road predictions. According to Munir et al. [18], air dispersion modelling significantly supports air quality monitoring, and vice versa. However, air quality monitoring provides data only for points where the measuring sensors are installed, whereas dispersion models provide better spatial coverage.
The aim of the present study was to evaluate the contribution of on-road mobile sources to ambient PM pollution in the selected urban area, defined as an Air Quality Management Area (AQMA) by air dispersion modelling. We focused on determining the extent of the impact of exhaust and non-exhaust traffic related emissions and particular vehicle categories. In order to determine the most representative emission factors, vehicle population data from a technical inspections database were used. To estimate the emission rate from all relevant vehicle categories, the European Monitoring and Evaluation Programme (EMEP)/European Environment Agency (EEA) Air Pollutant Emission Inventory Guidebook was used. The air dispersion modelling approach was based on the U.S. EPA’s recommended regulatory dispersion model AERMOD. A comparison of modelled and observed PM concentrations of pollutants at air quality monitoring stations was also performed. The present study is an important contribution to knowledge of the air quality situation in AQMA and the applicability of AERMOD to simulate roadways as linear sources of PM pollution.

2. Materials and Methods

2.1. Background

Due to the effective air quality assessment in agreement with Directive 2008/50/EC of the European Parliament and of the Council of 21 May 2008 on ambient air quality and cleaner air for Europe, the territory of the Slovak Republic was allocated into zones and agglomerations. Each zone and agglomeration has relatively variable spatial distribution of pollutant concentrations and usually implies areas with significant emission sources and deteriorated air quality, but also relatively clean areas without such sources. For zones and agglomerations within which concentrations of pollutants in ambient air exceed the relevant air quality target values or limit values, ‘Air Quality Management Areas’ (AQMAs) were defined. According to the annual Air Quality Report prepared by the Slovak Hydrometeorological Institute (SHMI), the city territory of Banská Bystrica was selected as AQMA, due to particulate matter (PM10) and benzo(a)pyrene (BP) pollutants based on air pollution monitoring in the years 2016–2019. A pollutant is removed from AQMA’s list if pollutant concentration at the monitoring station did not exceed the limit value within three consecutive years [19].
Dominant sources of air pollution in Banská Bystrica are considered to be road transport, heating plants and several industrial sources of air pollution.

2.2. Study Design and Model Set Up

Emissions from on-road mobile sources depend on several factors and require fairly detailed models to take all into account. These factors include vehicle population statistics, i.e., age and composition of the fleet, size and weight of the vehicles, their emission standards, abatement technologies used to reduce emissions, the type and quality of fuel used, vehicle speed and driving conditions, trip characteristics and temperature conditions, so accurate determination of emission factors for vehicles is challenging [20,21]. Due to the lack of required information on the vehicle fleet in the study area, an EMEP/EEA Guidebook was used to estimate the emission factors. This is frequently used as a reference document by researchers. As such, it remains the most influential set of emission estimation methods used in air pollution studies in Europe and elsewhere. The EMEP/EEA Guidebook describes a tiered methodology for estimating emissions. For the purpose of the present study, the Tier 1 method based on a linear relation between activity data and emission factors was conducted [22].
The AERMOD modelling system (version 21112) was used to perform air dispersion modelling based on the following inputs and data flow design, shown in Figure 1.
The AERMOD is considered a state-of-art modelling system based on planetary boundary layer (PBL) turbulence structure and scaling concepts, including treatment of both surface and elevated sources, and both simple and complex terrain. The model set up requires three main steps: meteorological and land cover data processing by AERMOD meteorological pre-processor (AERMET); elevation data processing by AERMOD terrain pre-processor (AERMAP); and AERMOD Gaussian plume model that performs the dispersion calculations [23]. AERMET uses PBL, which serves as a replacement to the Pasquill–Gifford stability classes previously used by plume dispersion models. AERMOD calculates the effects of vertical variation of wind, turbulence profiles and temperature [24]. Due to its extensive development, the AERMOD is currently the most recommended dispersion model in the U.S. EPA, and is also suitable for linear sources of emissions [25].
The modelled data in the study were compared with the measured data at two air quality monitoring stations in Banská Bystrica to estimate the contribution of on-road mobile sources to local PM pollution. Despite the fact that air pollution by PM particles is often interpreted as a 24-h average, AERMOD results were aggregated to annual averages in the present study due to the model´s tendency to underpredict the highest 24-h concentration values [26].

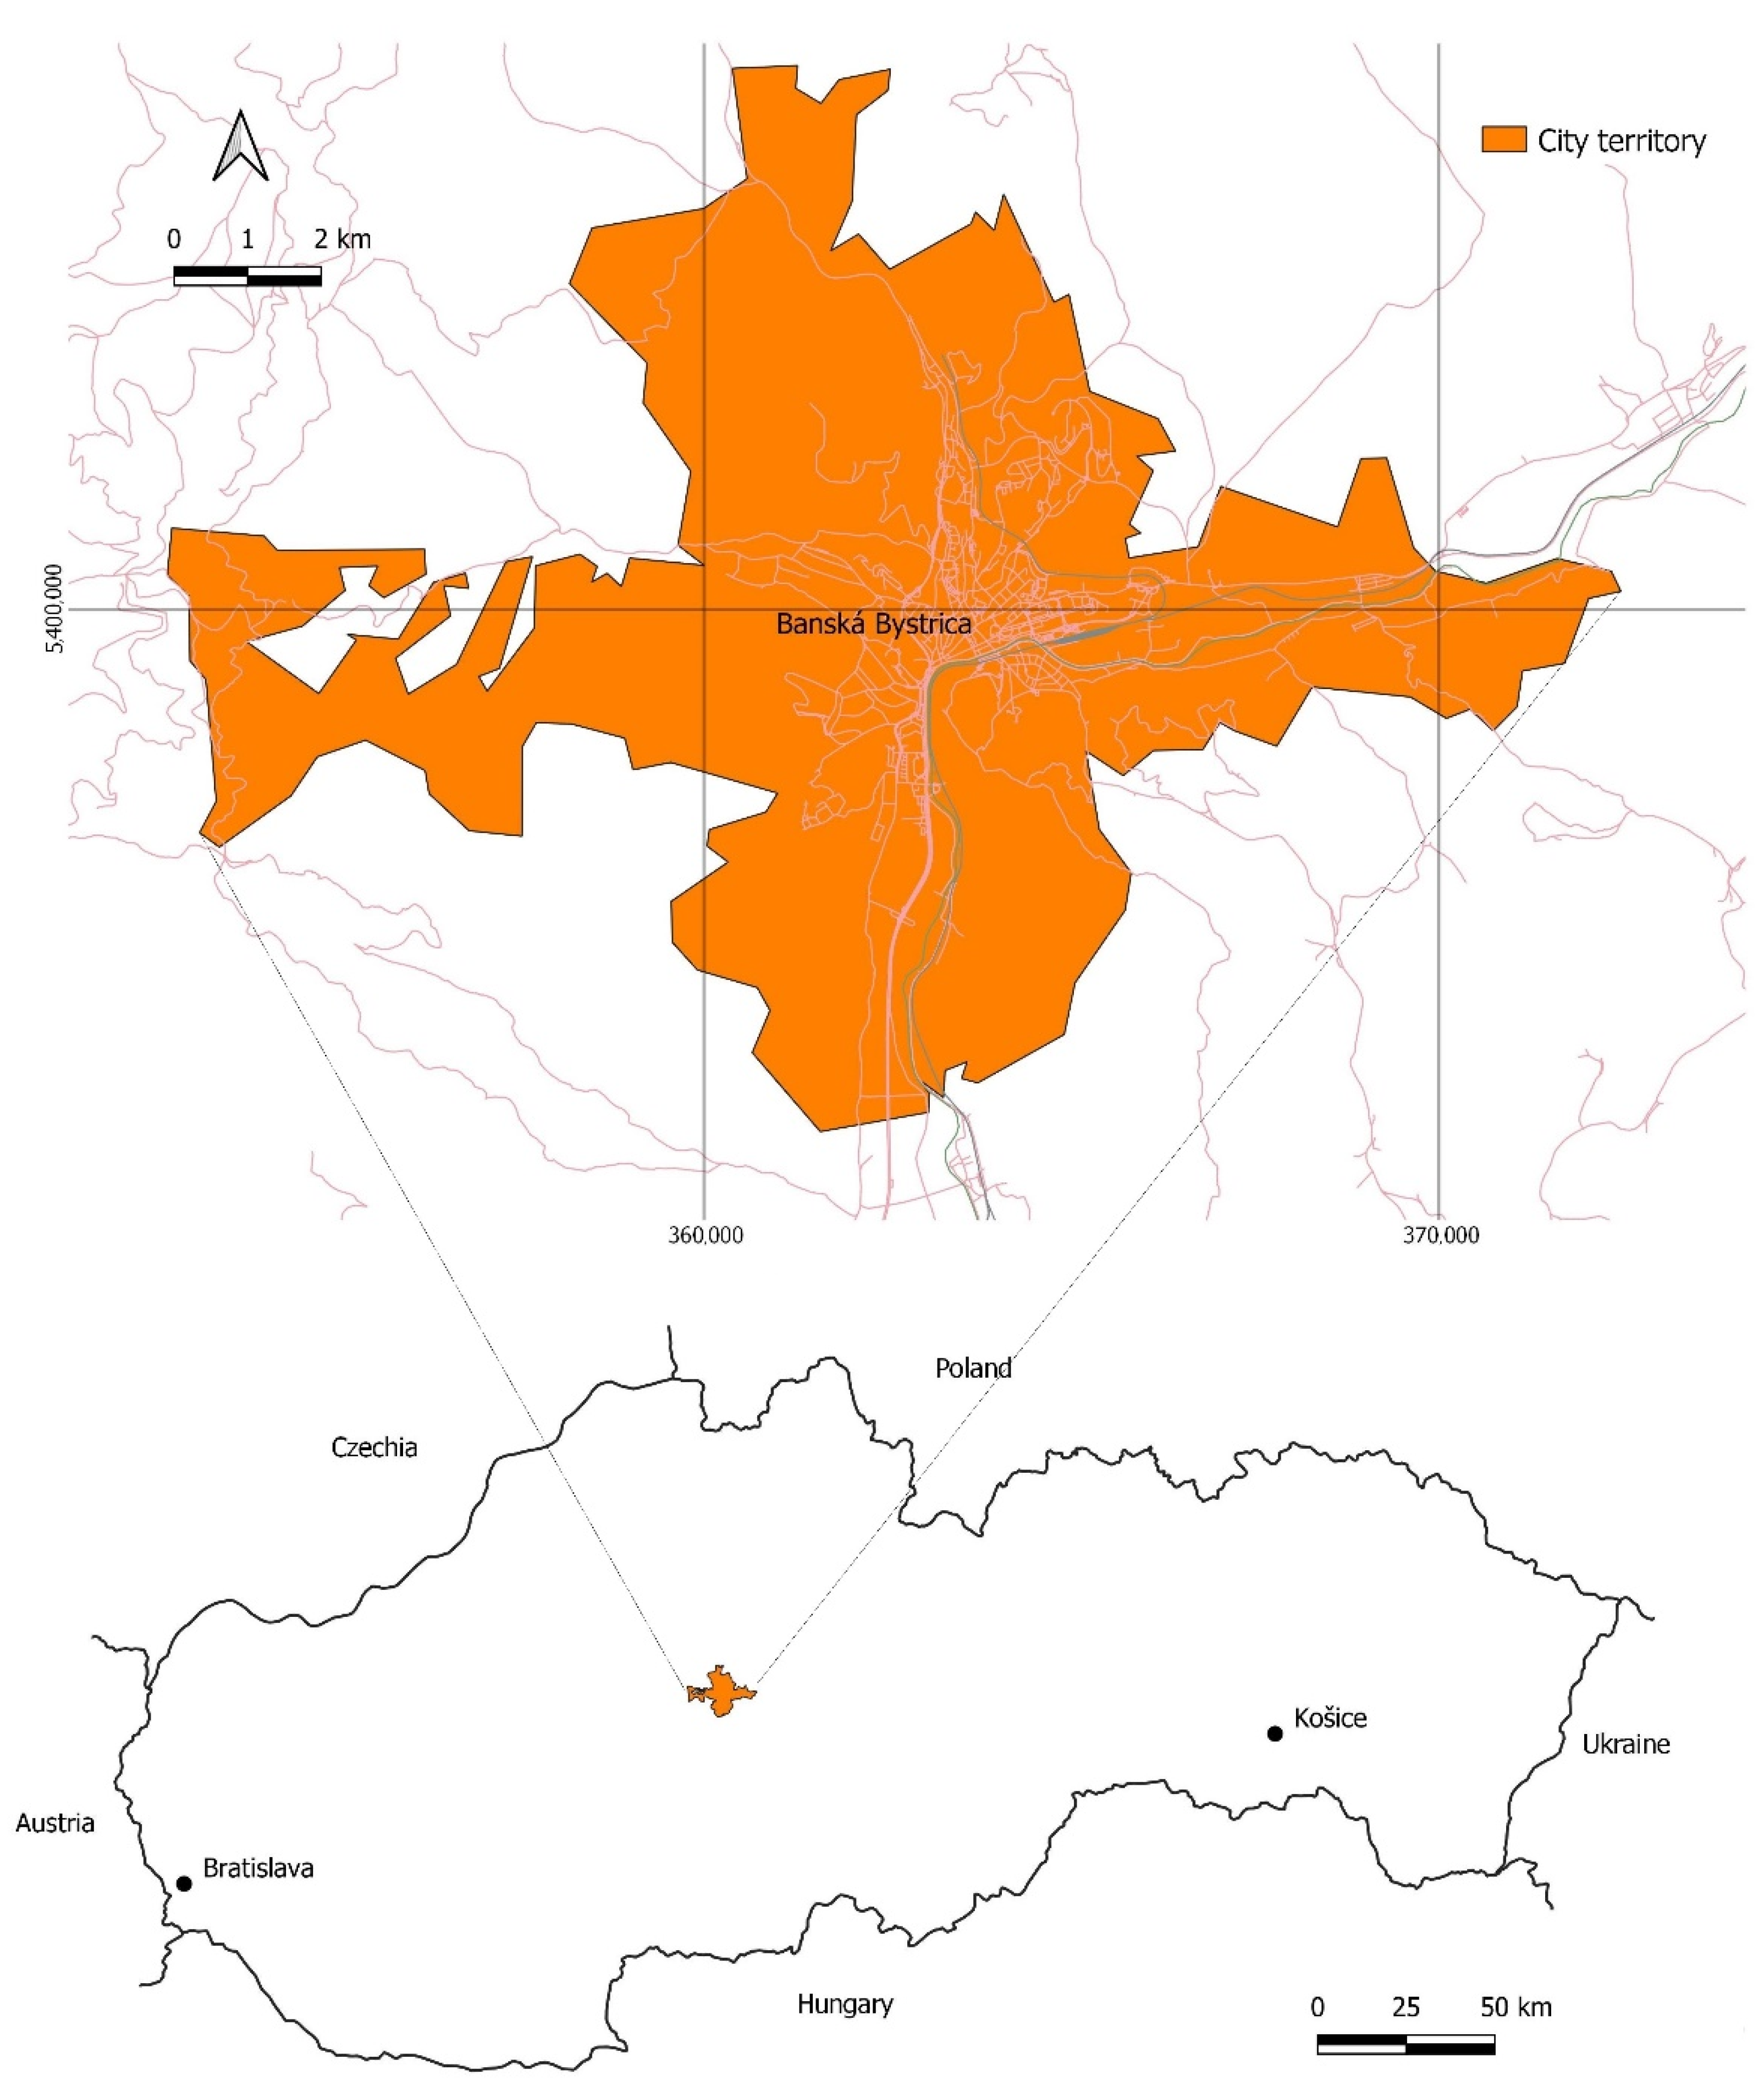
2.3. Description of the Study Area

The present study focuses on the city territory of Banská Bystrica. The city is located in central Slovakia about halfway between Slovakia’s two largest cities, north-east from Slovakia’s capital Bratislava (approximately 208 km) and west of Košice (approximately 217 km). The total area of the city is 103.38 km2 (Figure 2). With 78,000 inhabitants, Banská Bystrica is the sixth most populated municipality in the Slovak republic [19]. Currently, the density of the population is 756.51/km2 [19,27].
The model domain consists of a square area centred in city of Banská Bystrica (at X = 364,002.41; and Y = 5,399,511.22) with the domain boundaries summarized in Table 1.
This section may be divided by subheadings. It should provide a concise and precise description of the experimental results, their interpretation, and the conclusions that can be drawn.
The domain was discretized using a uniform Cartesian grid. A total of 441 receptors spaced uniformly across the domain and two discrete receptors, which represented the position of local air quality monitoring stations, were calculated by AERMOD. Receptors’ heights were considered at ground level.

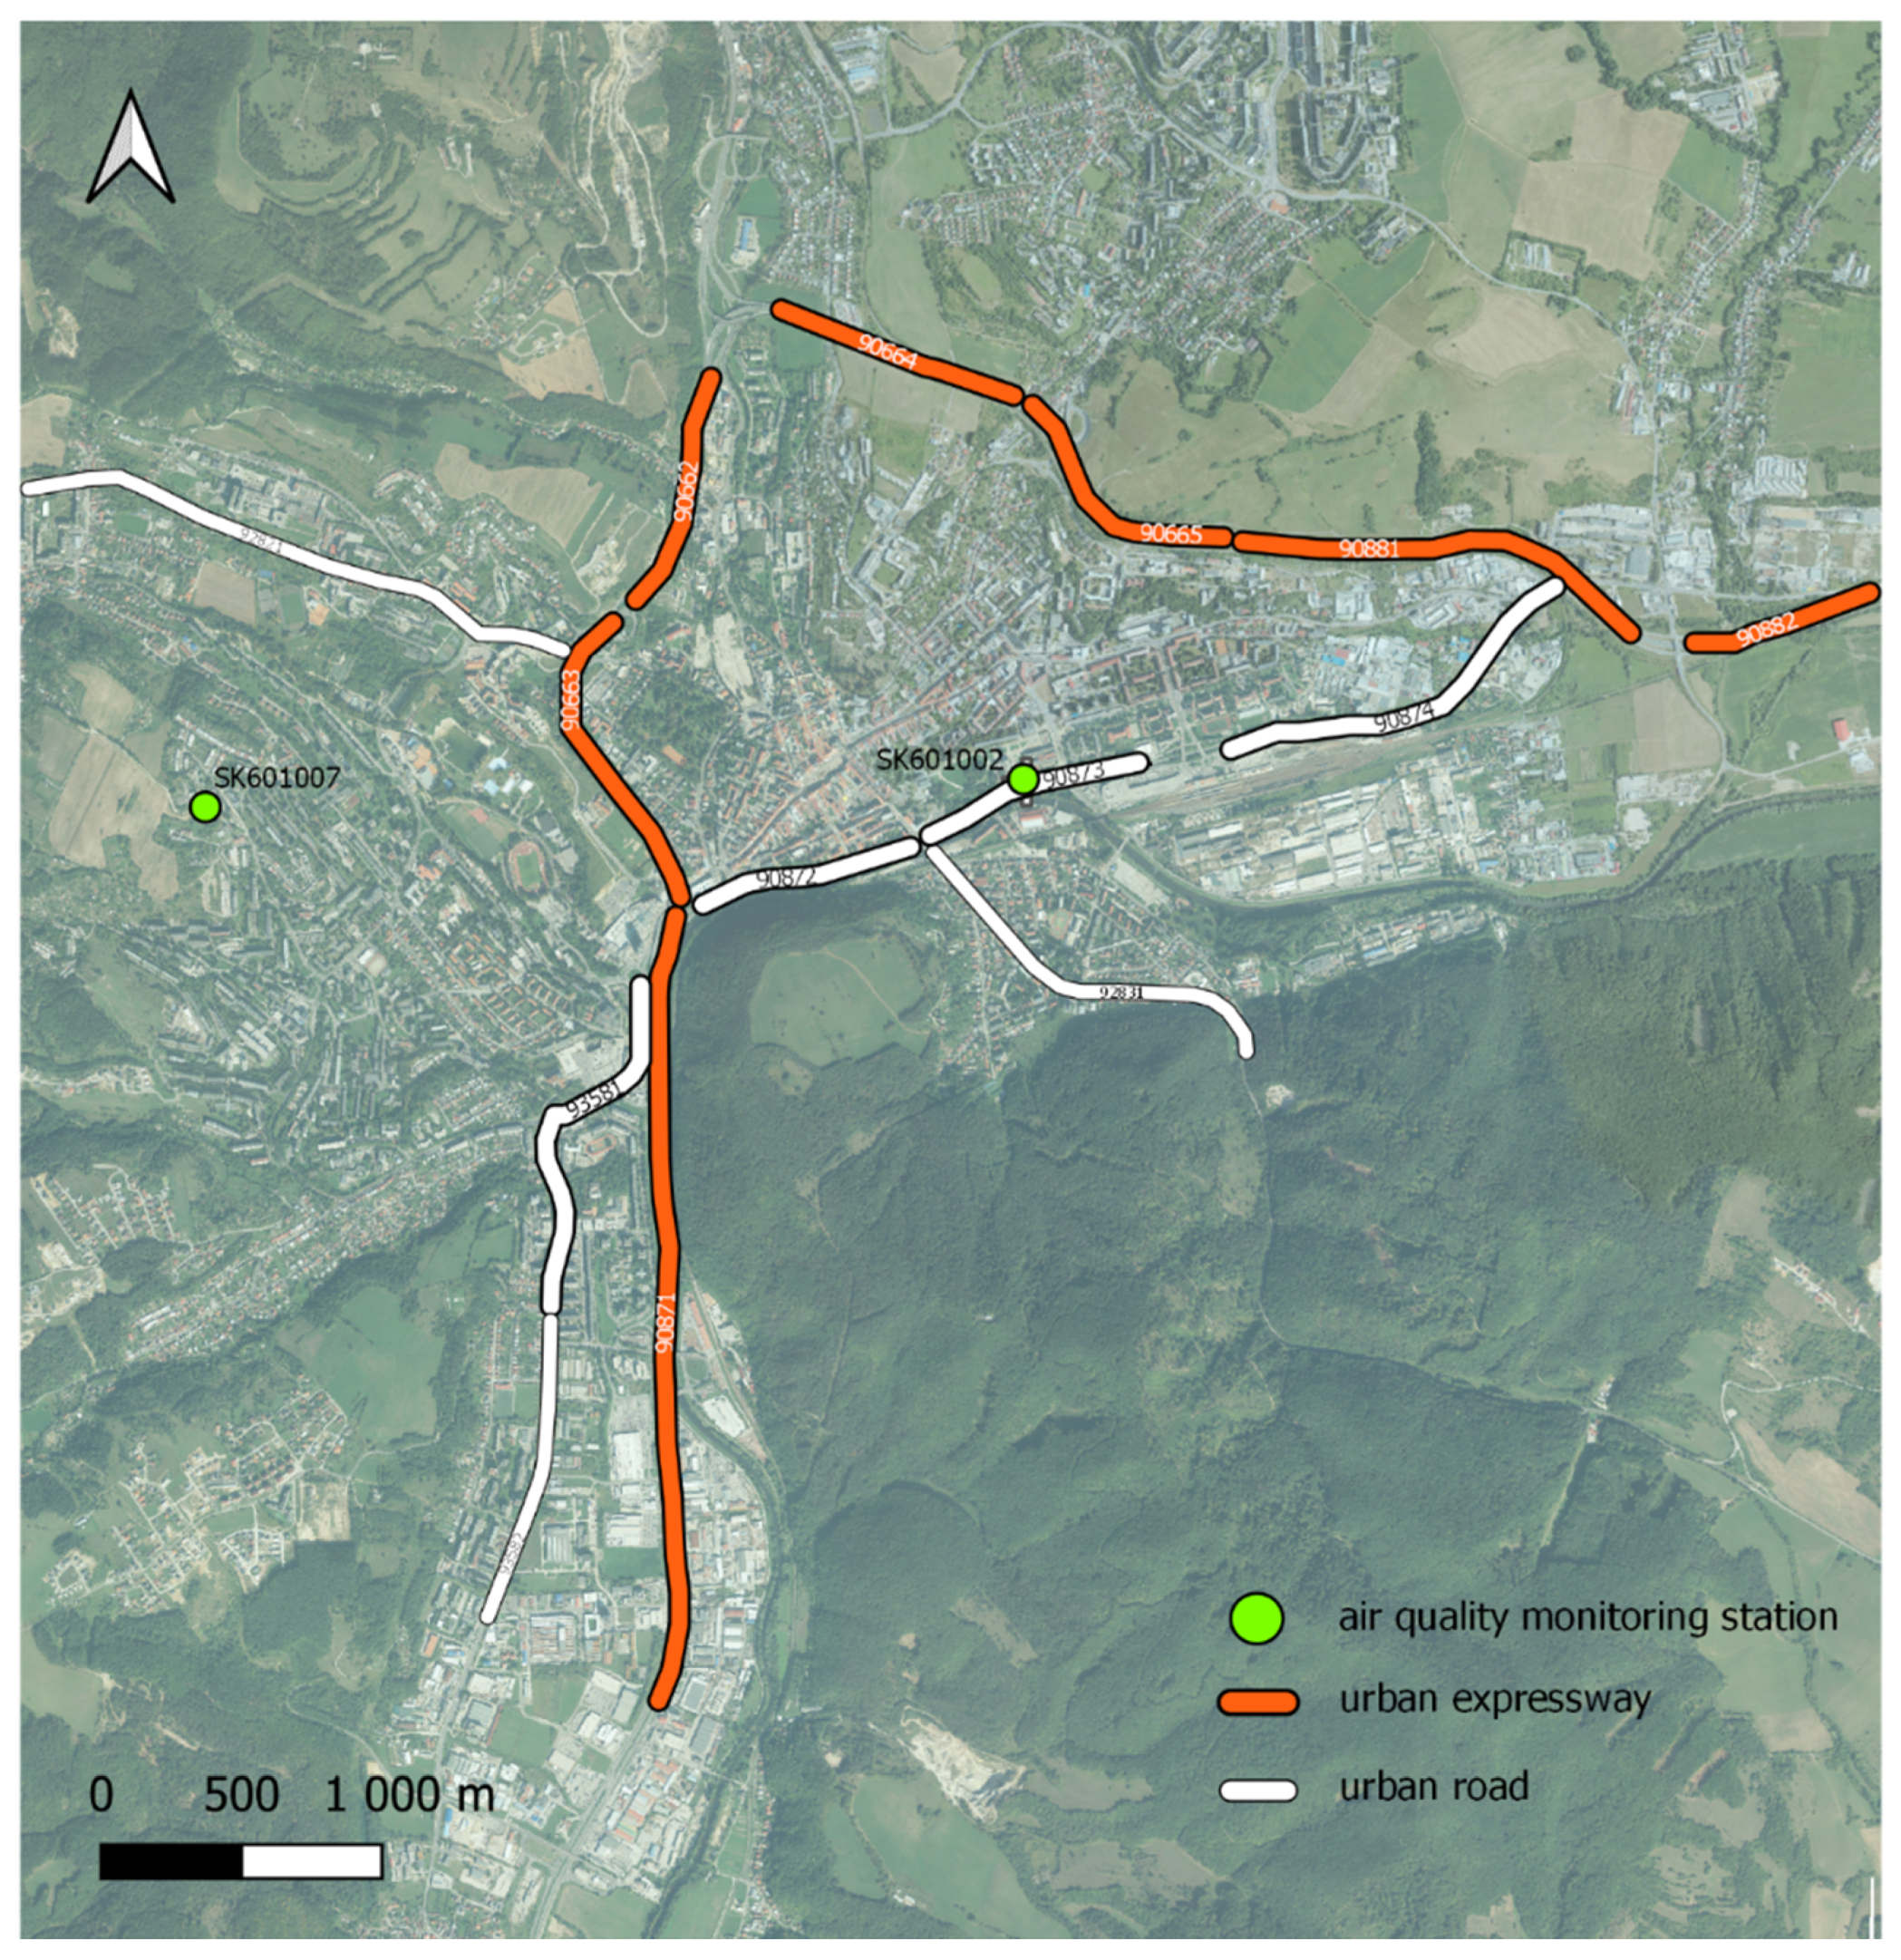
2.4. Air Quality Monitoring Stations in Study Area
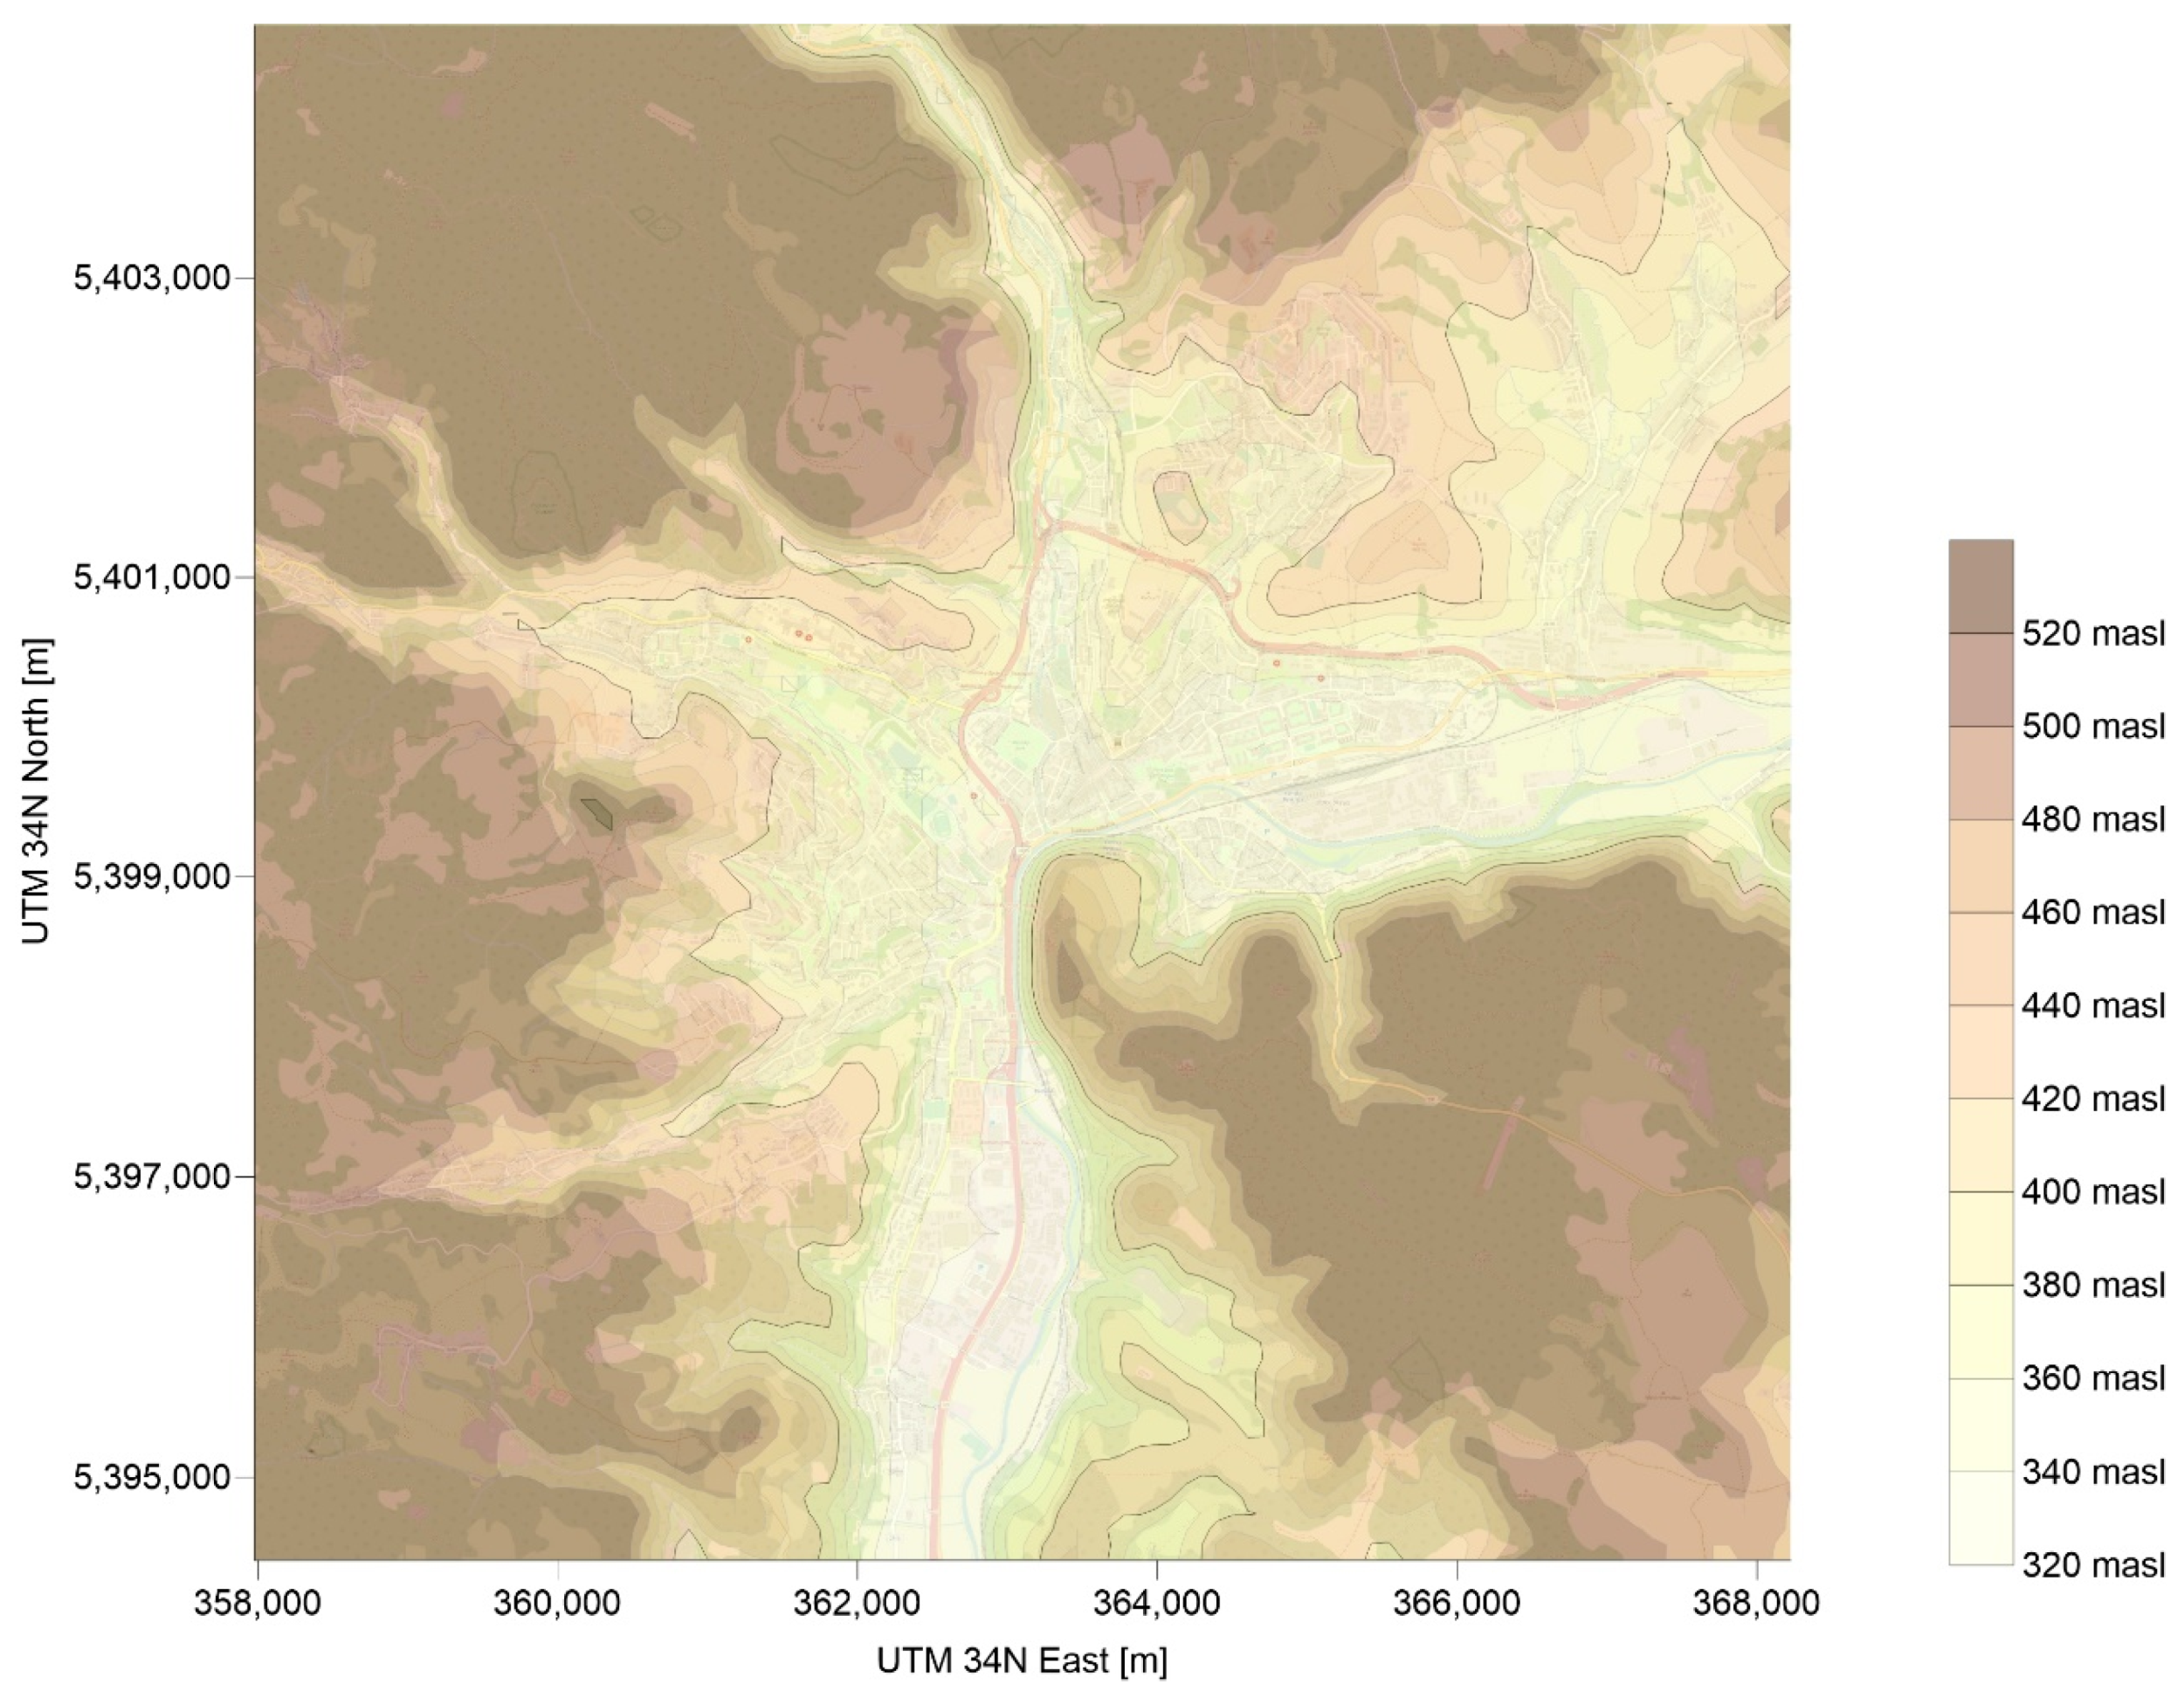
Air quality monitoring is performed at two monitoring stations (Table 2) located in Banská Bystrica as a part of the national air quality monitoring network in the Slovak republic managed by SHMI. Automatic instruments for continuous monitoring provide average 1-h concentrations of pollutants. The determination of PM10 and PM2.5 is based on a tapered element oscillating microbalance (TEOM) equivalent (E) technique, which is a real-time detection of aerosol particles by measuring their mass concentration [28].
The monitoring station SK601002 is located in the valley part (346 masl) of the city close to a busy four-lane urban road and river Hron. This area is characterized by worsened dispersion conditions. The monitoring station SK601007 is located on a slight ridge at an altitude of 425 masl close to a residential zone with a housing development. However, unlike the station SK601002, it is located outside the city’s main sources of air pollution, including major transport routes. The location and design of both air quality monitoring stations meet the requirements of legislation in the field of air protection in the Slovak Republic and the European Union (EU) [28]. The location of air quality monitoring stations is shown in Figure 5. The position of air quality monitoring stations was also used as a reference point for model simulations to compare the observed data with modelled data from on-road mobile sources.

2.5. Terrain Data

Banská Bystrica is located on the River Hron. Figure 3 shows a topographic map of the city territory prepared by a digital elevation dataset obtained during the Shuttle Radar Topography Mission (SRTM) with resolution of 90 m [29]. Surrounding the city territory is prevailingly mountainous terrain. The shape of the urban area follows the valley formed by the river. Average elevation of the urban area of the city is approximately 362 m above sea level (masl). Digital elevation data were preprocessed by AERMAP [30].

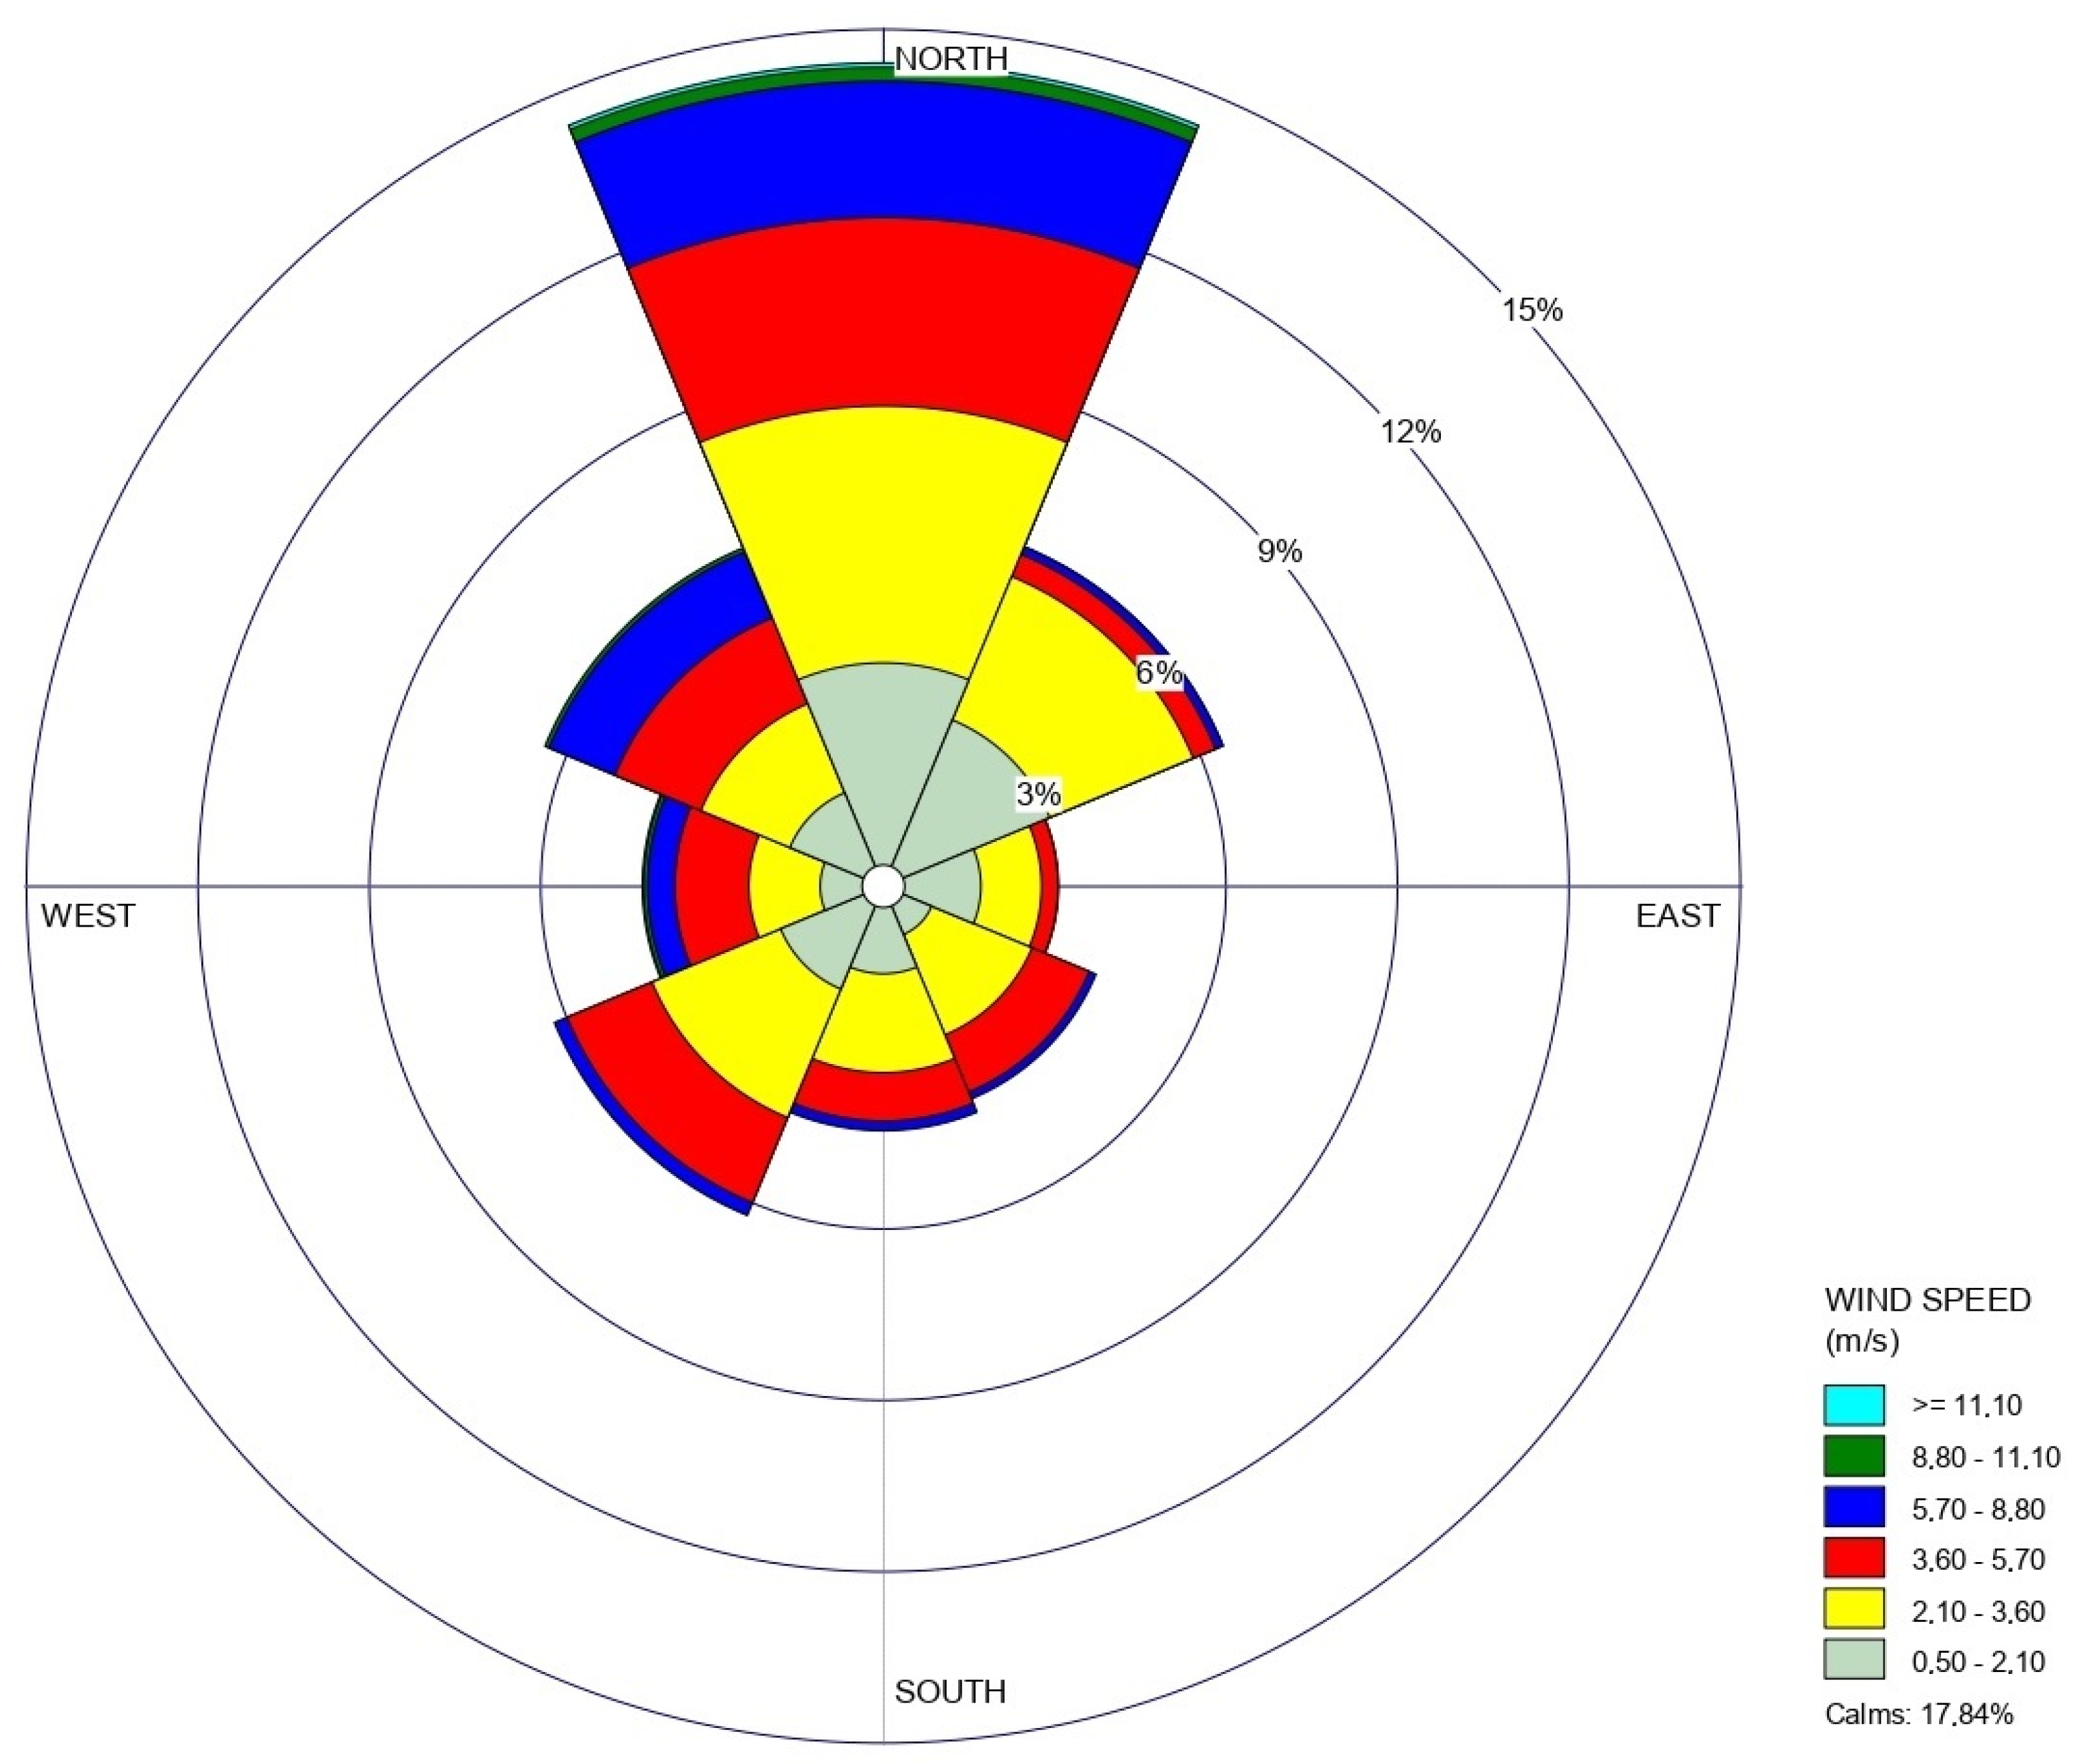
2.6. Meteorological Data

Meteorological conditions such as wind speed, ambient temperature, precipitation, and humidity levels play an important role in affecting air pollution concentrations. Wind affects the transport of the pollutants in the atmosphere and drives the vertical air mixing process, and thus the ventilation of the urban air [31].
Weather conditions in Banská Bystrica are affected by local orography which causes low wind velocity and frequent temperature inversions, mainly in the winter season [19].
Hourly meteorological data for the year 2019 and 2020, as an input for the dispersion model, including temperature, relative humidity, wind speed and direction, precipitation and cloud coverage, were obtained from the Automated Surface Observing System (ASOS) at Sliač airport which is located approximately 10 km south of Banská Bystrica (5,388,981.31 N, 362,816.25 E). In agreement with U.S. EPA´s memorandum [32], the ASOS meteorological data are appropriate for use with the AERMOD modelling system. The raw meteorological data was arranged into the SCRAM format which is required by the AERMOD model. Raw surface meteorological data, arranged into the FSL format data, from Sliač airport (313 masl) and upper air data were processed by the meteorological data preprocessor AERMET. Upper air data were purchased from the AERMOD service data hub as AERMET-Ready Weather Research and Forecasting (WRF) met data in AERMET compatible file format (.FSL). Hourly surface observations from Sliač airport and upper air met data were implemented in the AERMET preprocessor (version 21112) to create a surface data file (.SFC) and profile data file (.PFL) applicable in the AERMOD model. A quality assessment process was also executed, which checked the selected surface variables of met data for missing data, or data outside the range of acceptable values. Default surface variable ranges in AERMET were used [33]. To specify surface parameters such as albedo, ratio, surface roughness and land-use, CORINE Land Cover (CLC) inventory data were implemented in the model [34].
According to Windrose (Figure 4), prevailing wind direction in the region of Banská Bystrica is northerly. The average wind speed is 2.13 m/s and the average percentage of calm situations when no motion of air is detected is approximately 18%.

2.7. Input Data

2.7.1. Vehicle Population Statistics

Emission factors represent the relationship between pollutant emissions and source of pollution. In the present study, we focused on the following types of traffic-related sources of emission. Vehicles were classified into categories in terms of EU classification [35]:
  • Category L: 2-, 3- and 4-wheel vehicles such as motorcycles, mopeds, quads, and minicars;
  • Category M: vehicles with at least four wheels designed to carry passengers;
  • Category N: vehicles carrying goods including Light Commercial Vehicles (LCV) with a gross vehicle weight of <3.5 metric tons and Medium and Heavy Commercial Vehicles (MHCV) with a gross vehicle weight of between >3.5 and <12 tons and >12 tons, respectively.
Data on vehicle population in Table 3 were obtained from the periodical vehicle technical inspections database. The data set contains the registered vehicle population count in the Slovak republic by various criteria such as vehicle class, vehicle status, vehicle model, fuel type and other descriptors [36].
In group of petrol vehicles, several configurations with a different type of fuel were found. However, strictly petrol-powered engines remain the dominant type of fuel utilizer for these vehicles. On the other hand, for diesel-powered vehicles such combinations are not typical. Only 0.21% of all diesel-powered passenger vehicles are also powered by electricity and 0.01% of all diesel-powered MHCV vehicles are fueled with a combination of diesel and LPG.
Table 4 shows vehicle population data in the Slovak republic according to EURO-X emission standards. Based on these data, the EURO 4 emission standard is dominant in Slovak republic followed by EURO 6 and EURO 5.

2.7.2. Traffic Data

In the study area, we focused on the main road sections shown in Figure 5. The selection of modelled road sections was based on Slovak Road Administration data and the methodology for performance and assessment of a nationwide traffic survey. This methodology is described in detail in the publicly available information published by the Slovak Road Administration. According to this methodology, the determination of the position of the survey stand and the number of investigated road sections in urban area depends on multiple requirements, especially for the survey’s representativeness and its availability in terms of economic costs. An elementary condition for locating the position is the selection of such a road profile, which can be considered characteristic for the given survey section in terms of the prevailing intensity and composition of the traffic flow [37].
The city of Banská Bystrica has two main road corridors, the first an urban expressway creating an inner city bypass, which is in 651.2 m in length, led on pillars on the road section number 90663. The second main corridor consists of road sections number 90872, 90873 and 90874. Data showed that this corridor has the highest vehicle volume compared to other road sections in Banská Bystrica. This is because this corridor serves as an artery for downtown and for most economic activities in the city such as manufacturing companies, government agencies, schools, hospitals, hotel facilities and the main bus and train station.
Table 5 shows average daily traffic (ADT) on examined road sections described in Figure 5. ADT is represented by the average number of vehicles that travel through a specific point over a short time period, usually 7 days. Traffic data in Table 5 were based on a nationwide road traffic survey in the Slovak Republic as part of the E-Road Traffic Census organized by the European Economic Commission at the United Nations Organization in Geneva and the international organization EUROSTAT in Brussels. The number of vehicles during the traffic survey was measured primarily by the automatic count method via in-situ detectors taken at 1-h intervals for each 24-h period. In addition, traffic detectors provided accurate information on vehicle speed [37].
Table 5 shows the following share of particular vehicle categories at the examined road sections: 87.59% for passenger cars, 9.33% for LCVs and 2.81% for MHCVs. The volume of 0.26% for L-category vehicles is practically negligible. The busiest road section was urban expressway number 90,871 with 16.4% share of ADT in Banská Bystrica. The total ADT on the examined road sections was 323,220 vehicles.
For the calculations of emission rates, the traffic intensity at peak hour was considered. Peak hour traffic is represented by approximately 20% of 24-h averages.

2.7.3. Emission Data and AERMOD Performance

In order to calculate the emission rate of PM, information was estimated based on the traffic data (Table 5), vehicle population statistics and share of EURO-X emission standards in the Slovak republic (Table 3 and Table 4, respectively). The study focused on petrol-powered and diesel-powered vehicles only. The accuracy of such a procedure may be questioned, but it is objectively impossible to record a vehicle´s emissions parameters during a standard traffic survey. Therefore, national vehicle data were applied to a sample of vehicles represented by the vehicle fleet in Banská Bystrica.
Emissions of all categories of passenger cars, LCV and MHCV were taken into consideration for the assessment of the on-road mobile sources contribution to PM in the study area. Category L (2-, 3- and 4-wheel vehicles) was not included in the calculation due to the low number of passes compared to the other vehicle categories and therefore we consider its contribution to be insignificant.
Emission factors were determined for the following sources of PM emissions for each type of vehicle category:
  • Exhaust emissions,
  • Road vehicle tire and brake wear;
  • Road surface wear.
  • Third bullet.
The above-mentioned sources were calculated as PM10 and PM2.5 fraction using the emission factors shown in Table 6 based on type of fuel, emission standard and vehicle speed.
Exhaust emission factors shown in Table 6 have been deduced on the basis of a large amount of experimental data, i.e., measuring of vehicles’ emission performance across different laboratories in Europe [22]. The uncertainty of the exhaust emission factor depends on the variability of individual vehicle measurements for the particular speed class. This uncertainty has been reported in detail by Kouridis et al. [38], who concluded that the majority of exhaust emission factors shown in Table 6 are statistically significant and based on a sufficiently large set of measured and evaluated data. Kouridis et al. [38] expressed the uncertainty as standard deviation for each vehicle category, fuel, EURO-X standard, and speed class, respectively. In total, 14 speed classes corresponding to 14 classes of 10-km/h speed intervals (from 0 to 140 km/h) were specified. Standard deviation (g/km) of exhaust PM emission factors for the investigated vehicle categories ranged from 0.001 to 0.285 which is considerably low uncertainty.
Exhaust emission factors were considered according to the EMEP/EEA Guidebook, dependent on vehicle speed for each vehicle category. The calculation generic equation was as follows:
E F = A p l h a × V 2 + B e t a × V + G a m m a + D e l t a V ( E p s i l o n × V 2 + Z e t a × V + E t a ) × ( 1 R F )
where EF was emission factor, and V was vehicle speed. The Greek Letter components of the equation can be found in Appendix 4 to the chapter “1.A.3.b.i-iv Road transport 2019” of the EMEP/EEA Guidebook. Where necessary a reduction factor RF was applied. In exhaust PM emissions, the coarse fraction (>2.5 μm in diameter) is considered to be negligible, hence all exhaust PM = PM2.5 [22]. According to Tiwary and Williams [39], petrol-powered vehicles are usually thought of as negligible PM emitters, except in the case of leaded petrol. However, this was not taken into account in the study, because the Slovak Republic phased out leaded petrol completely by 1995 [40]. Tiwary and Williams [39], also determined the typical particle size distribution from old diesel engines which peaked at around 0.1 μg/m3.
Estimation of emissions from road vehicle tire wear, brake wear and road surface wear was based on the EMEP/EEA Guidebook Tier 1 procedure. Emission factors are given as a function of vehicle category alone. Total traffic generated emissions can be estimated by summating the emissions from individual vehicle categories [22]. In order to calculate non-exhaust PM2.5 and PM10 emissions, Equation (2) was used:
T E = j N j × M j × E F i , j
where TE was the calculated number of emissions for the defined time period and spatial boundary, Nj was the number of vehicles in each vehicle category within the defined spatial boundary, Mj was the average distance driven per vehicle in category j during the defined time period and EFi, j was the mass emission factor for pollutant i and vehicle category.
Non-exhaust emission factors shown in Table 6 have been derived from studies conducted on dry days with dry road conditions. The water layer on the road causes a significant reduction of PM emissions, especially from brake and road surface wear, because such particles may be trapped by the water [22]. The impact of seasonal variations and weather conditions on the PM emissions factor was investigated by Ferm and Sjöberg [41], who concluded that the emission factor for PM10 is considerably lower for wet roads than for dry roads. On the other hand, there is very little difference between wet and dry roads for the PM2.5 emission factor, indicating that most of the PM2.5 particles originate from exhaust pipes which is consistent with the EMEP/EEA emission factors used in the present study.
According to Nam et al. [42], exhaust PM emissions are significantly affected by ambient temperature, thus during a cold start phase, engines emit higher levels of PM. In general, PM emissions doubled for every 20 °F (approximately equal to 11 °C) drop in ambient temperature. According to the EMEP/EEA Guidebook [22], the exhaust PM measurement procedure regulated for vehicle exhaust PM emissions requires that samples are taken at a temperature < 52 °C. At this temperature, PM contains a large fraction of condensable species. Therefore, PM emission factors are considered to include both filterable and condensable material.
Table 7 provides the emission rates for PM2.5 and PM10 and for the three source categories (i.e., hot exhaust emissions, tire and brake wear combined, and road surface wear).
The AERMOD model simulation was executed for 730 analysis days in 2019–2020 for the study area. The model was run using hourly meteorological data and calculated emission rates are shown in Table 7. On-road mobile sources of emissions were treated as a line source represented by separated volume sources in AERMOD, with a plume height of 2.6 meters for M/LCV category, and 6.8 meters for MHCV category, respectively. The top of the plume height was calculated as 1.7 times the average vehicle height. The release height at which wind effectively begins to affect the plume was calculated by multiplying the plume height by 0.5. Plume width was calculated as recommended by U.S. EPA, for single lane roadways (vehicle width + 6 meters), and for two-lane roadways (road width + 6 meters) [16].

2.8. Statistical Analysis

Data were analysed by STATISTICA (StatSoft Inc., Tulsa, OK, USA, ver. 12). Statistical significance was set at p < 0.05.

3. Results and Discussion

3.1. Model Validation

The AERMOD model is one of the most commonly studied and validated dispersion models in the world. Studies in this field have typically demonstrated good correlation with real observations. To validate the model’s accuracy we followed the recommendations of the EPA’s “Guideline on Air Quality Models” [43]. The accuracy of the model is normally determined by an evaluation procedure which involves the comparison of model concentration estimates with measured air quality data. The statement of model accuracy is based on statistical tests or performance measures, although a detailed analysis of these recommendations is beyond the scope of this paper. The most suitable method for the validation of air dispersion modelling results is to compare the observed concentrations with the model’s prediction. Therefore, observed concentrations from air quality monitoring station SK601002 that best reflect traffic-related pollution due to its location near busy road section number 90873 were compared with the AERMOD simulation in terms of variations in short-term averages. Correlation analysis of modelled high and second-high 1-, 3-, and 24-h concentrations of PM at this road section showed good correlation with the corresponding data series from this air quality monitoring station. Especially, concentrations during peak traffic periods, typically 7–10 a.m. and 3–6 p.m., showed good correlation (r > 0.70) with modelled data. The performance of the AERMOD model was also validated by the comparison with MODIM (version 03, ENVItech, Trenčín, Slovak Republic), which is a program intended for regulatory and planning purposes in based on Gaussian plume dispersion, with a numerical model for line sources, street networks and street canyons.
During the validation process, we ensured that roadway emissions was appropriately spaced when using volume source so that the emissions field was uniform across the roadway. Receptors were placed outside the exclusion zones to prevent underestimation of roadway impacts. As mentioned above, we considered study design and model set up a satisfactory representation of on-road mobile sources of PM emissions in the study area.

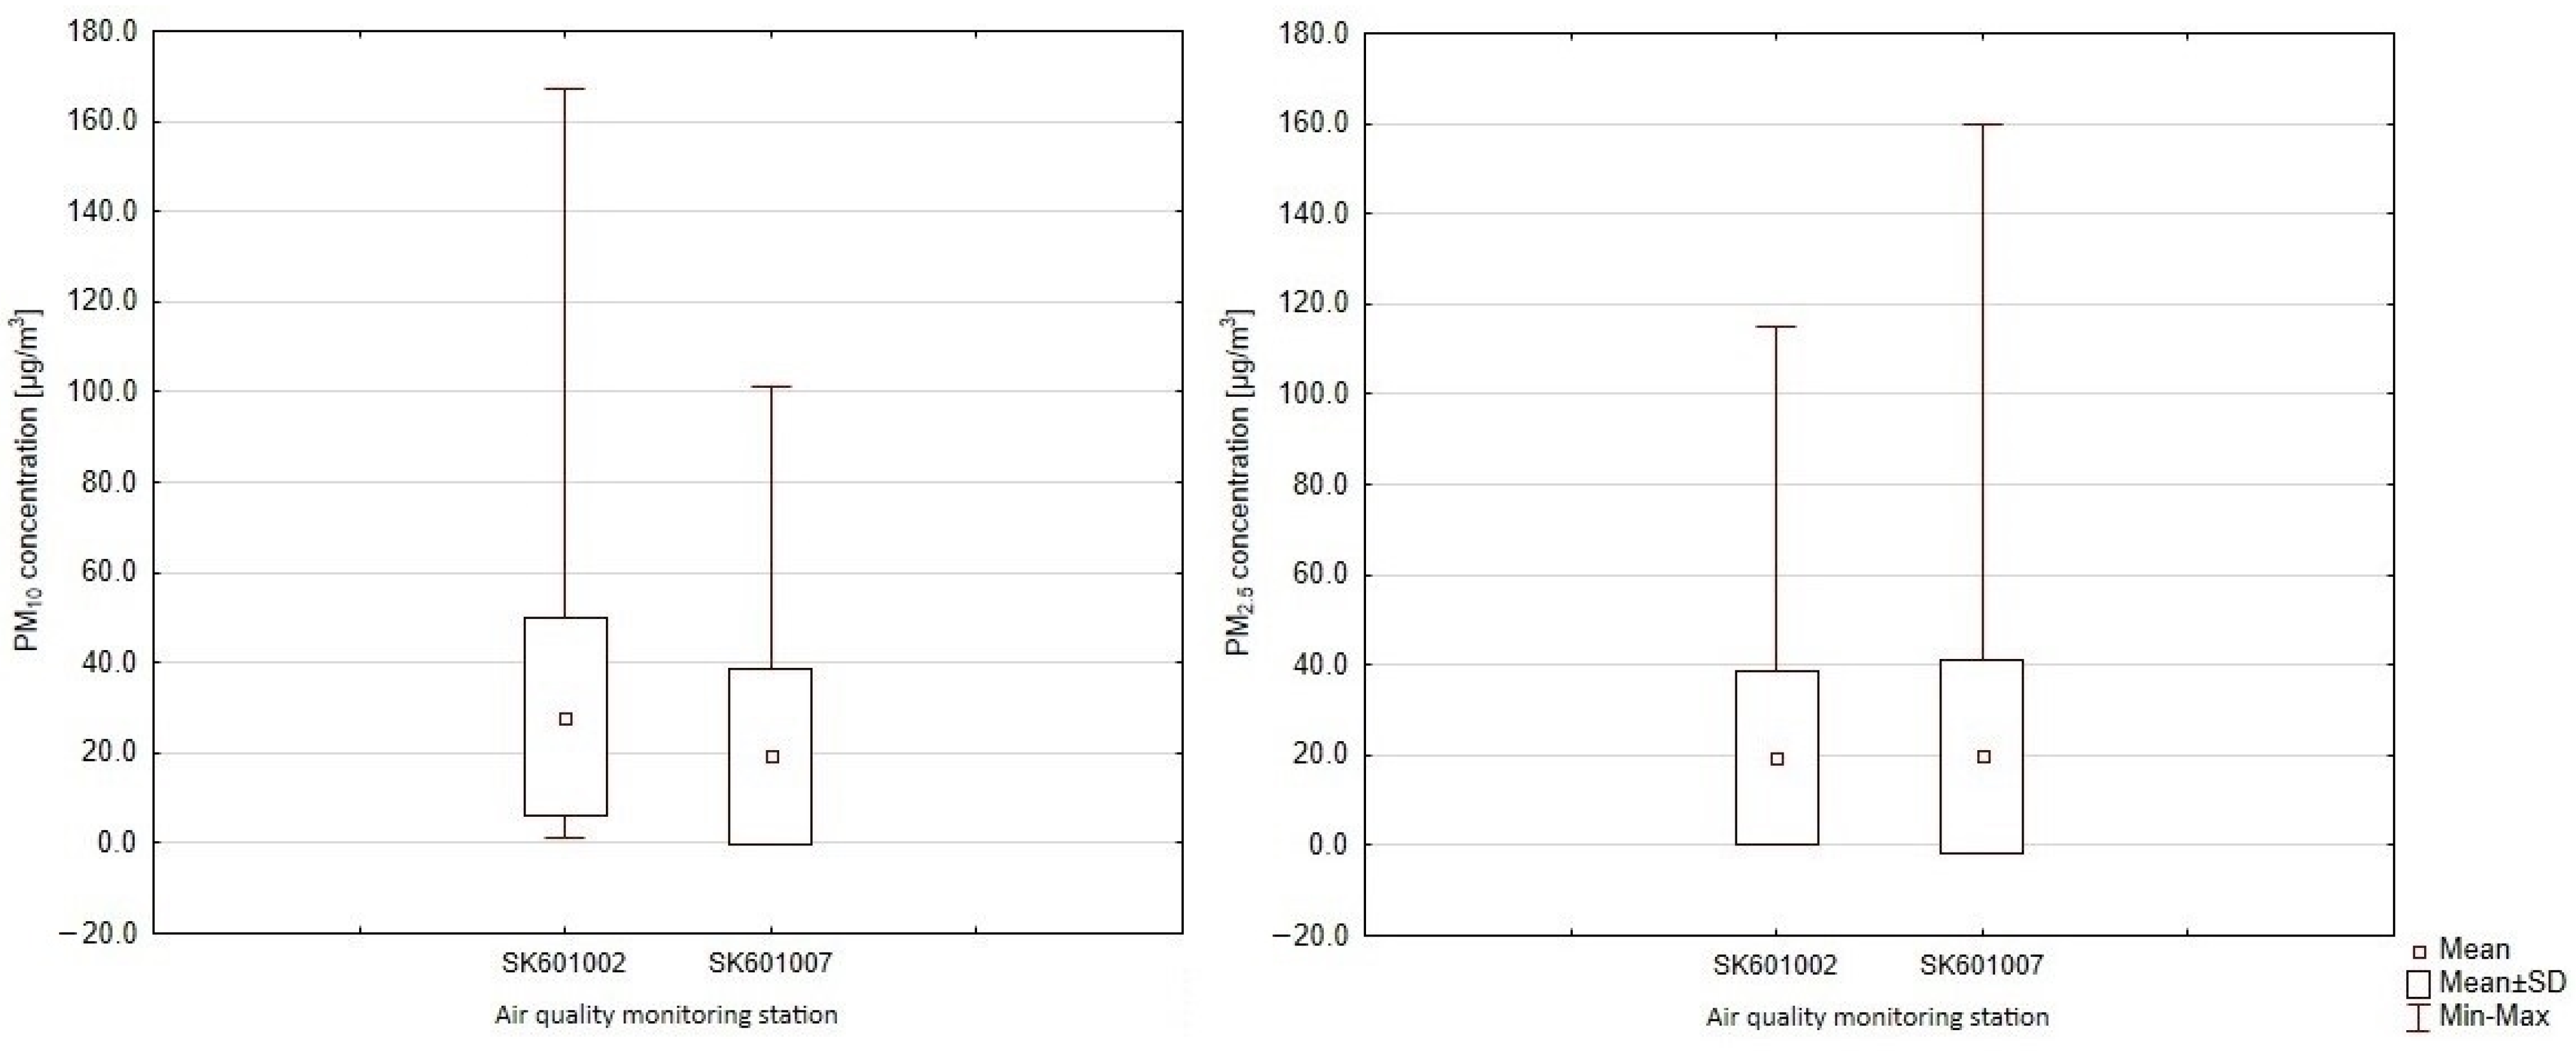
3.2. Air Quality Monitoring Stations Data Analysis

Firstly, we conducted the background concentrations data comparison from air quality monitoring stations located in Banská Bystrica (see Table 2). Descriptive statistics for PM10 and PM2.5 pollutant concentration values as 1-h averages at these monitoring sites were conducted. A corresponding data set was available from 25 November 2019 until 31 December 2020 due to maintenance on each monitoring station at different times during 2019; however, this time period was long enough to obtain more than 9200 individual data for each pollutant and station. Annual mean PM2.5 and PM10 concentration values calculated from 1-h measurements during the monitored period at air quality monitoring station SK601002 were 19.42 ± 19.05 μg/m3 and 28.05 ± 22.03 μg/m3, respectively. Determined concentrations at station SK601007 were 19.70 ± 21.44 μg/m3 for PM2.5 and 19.26 ± 19.35 μg/m3 for PM10.
The independent samples t-test showed that there was no statistically significant difference (p > 0.05) in determined PM2.5 concentrations at monitoring station SK601002 and SK601007. On the other hand, we found a statistically significant difference (p < 0.001) among PM10 concentration values.
Figure 6 compares mean, standard deviation and min–max range of PM10 and PM2.5 concentration values from air quality monitoring stations in Banská Bystrica.
These results suggest that on-road mobile sources do not significantly affect concentrations of PM2.5 in Banská Bystrica. Mean 1-h PM10 concentration was found approximately 45% higher at air quality monitoring station SK601002 compared to monitoring station SK601007. An increase in PM10 concentration at air quality monitoring station SK601002 located near the main traffic route in the city might be associated with non-exhaust emissions from road vehicle tire and brake wear and road surface wear, respectively.
Data from air quality monitoring stations in Banská Bystrica are consistent with previous findings of Ferm and Sjöberg [41], who concluded that the average street level concentrations of PM10 in Gothenburg with highly traffic flow were 36% higher than the urban background concentrations.
According to SHMI [19], the numbers of warning threshold exceedances of PM2.5 and PM10 concentrations at air quality monitoring station SK601002 were 18 and 26, respectively. At air quality monitoring station SK601007 it was 10 exceedances for PM2.5 and 16 exceedances for PM10.

3.3. On-Road Mobile Sources Contribution to PM2.5 and PM10 Concentrations

The emission rates, as described in Section 2.7.3 were applied to the AERMOD model to estimate PM concentrations in the study area. Based on the AERMOD model, we estimated the spatial distribution of annual PM concentration values in Banská Bystrica produced by all vehicle categories, which we included in the simulation. The annual concentration values displayed on the dispersion maps (Figure 7) ranged from 0.28 to 16.71 μg/m3 for PM2.5, and from 0.27 to 15.57 μg/m3 for PM10, respectively.
Despite the assumptions, average annual PM2.5 concentrations were generally higher than PM10. Overall these results are in accordance with findings reported by Qu et al. [44], who found that mean values of PM10 and PM2.5 for three different traffic flow levels, ranging from 186 to 819 cars/5 min, were from 10.32 to 15.41 μg/m3, and from 23.34 to 32.06 μg/m3, respectively.
The distribution of the PM pollution follows the prevailing wind from north to south and was significantly influenced by local topographical conditions. Peak concentration values were found at the point which lied on road section number 90871 (5,398,259.54 N, 363,062.15 E), close to the crossing point with road sections number 90872 and 93581 (see Figure 7).
The mean ± SD concentrations from all receptors of the AERMOD model in the study area were 2.83 ± 2.09 μg/m3 for PM2.5, and 2.66 ± 1.95 μg/m3 for PM10, respectively. A similar conclusion was reached by Keirbek et al. [4], who estimated that traffic contributed to ambient PM2.5 levels from 0.40 to 2.60 μg/m3 across 1-km grid cells within New York City. Previous studies by Gibson et al. [24], and Ginzburg et al. [45] also confirmed that roadway emissions might contribute to PM2.5 pollution at the levels calculated in our study. However, it is important to highlight the fact that modelled annual PM2.5 peak concentration values exceeded the WHO air quality guideline annual mean limit value 10 μg/m3 [46], and they were close to the exposure concentration obligation set at 20 μg/m3 [47]. So the volume of the traffic in this location of the city Banská Bystrica is relatively high and requires serious attention regarding exposure to traffic-related emissions and human health. It is important to highlight that, according to WHO [46], reducing annual average PM2.5 concentrations to 10 μg/m3 could reduce air pollution-related deaths by around 15%.
Exceeding the air quality annual limit for PM10 of 40 µg/m3 according to the Directive of the European Parliament and of the Council, number 2008/50/EU [48], was not confirmed in the present study. The range of the modelled PM10 concentrations in the study area varied from 0.63 to 38.93% of the PM10 annual limit value. Thus, we assume that exceedances of warning threshold for PM10 limit value established for human health protection, on the basis of which the city of Banská Bystrica was classified as AQMA, would be partially caused by on-road mobile sources of emissions. On the other hand, Macêdo and Ramos [25], found a maximum annual concentration 37.60 μg/m3 generated by light vehicles, motorcycles, busses, and trucks. However, the PM distribution at Tancredo Neves Avenue in Aracaju (Brazil) was modelled as total suspended particles. Compared with our results, this difference is consistent with findings provided by Heydari et al. [49], who concluded that traffic contribution to air pollution in European, North American, and Oceanian cities is on average 36% lower than other regions.
Table 8 shows the descriptive statistics for estimated annual PM2.5 concentration values from 441 receptors calculated by the AERMOD dispersion model. Traffic-related PM2.5 emissions come from three sources: exhaust, road surface wear, and brake and tire wear [50]. Traffic-related PM10 emissions were modelled as surface wear, and brake and tire wear. Coarse fraction of exhaust PM10 was considered to be negligible [22].
Our results showed that total peak annual exhaust and non-exhaust PM2.5 concentration values in the study area were 8.31 μg/m3 and 8.40 μg/m3, respectively. Non-exhaust PM2.5 emissions were slightly higher than exhaust emissions, but no statistically significant (p > 0.05) difference was found among these types of PM2.5 traffic-related emissions by independent samples t-test.
Road vehicle tire and brake wear were found as the dominating sources of non-exhaust PM pollution with estimated annual mean PM2.5 and PM10 contribution of 0.93 μg/m3 and 1.74 μg/m3, respectively. Approximately 65% of modelled non-exhaust emissions were of tire and brake wear origin. Similar to our findings, Rahimi et al. [51] concluded that brake wear accounts for 55% of non-exhaust emissions and significantly contributes to urban health diseases related to air pollution. Our findings are also consistent with Amato et al. [52], who concluded that brake wear contributions vary from negligible up to 4.00 μg/m3, or higher at specific traffic hotspots.
Interestingly, non-exhaust PM2.5 emitted by passenger cars contributed as much as approximately 82% of the total amount of traffic-related exhaust PM2.5 emissions by average. The difference between exhaust and non-exhaust PM2.5 emissions is not yet significant in Banská Bystrica, but it is clear that the percentage of non-exhaust PM2.5 will increase in the future. The same trend was modelled by Jörß and Handke [53], who found that non-exhaust sources in Germany accounted for 25% of traffic PM2.5 emissions in 2000, and 70% by 2020, respectively. According to Timmers and Achten [54], the share of non-exhaust emissions can reach up to 85% of PM2.5 emissions, and 90% of PM10 emissions from traffic. Several studies have reached the same conclusion, e.g., Rexeis and Hausberger [55], Hopke et al. [47] and Denier van der Gon et al. [56].
In terms of the redistribution of the PM emissions contribution among the vehicle categories, we found that approximately 66% of all modelled PM2.5 emissions in study area were generated by passenger cars. For trucks, this was 34%, of which 16% represents LCV and 18% the MHCV category, respectively. A similar conclusion was reached by Keirbek et al. [4], who found that primary and secondary PM2.5 concentrations associated with truck and bus emissions contributed to an average of 39% of total PM2.5 concentrations from all on-road mobile sources in New York City.
Road surface wear emissions are strongly affected by the state and texture of the road surface, weather conditions, vehicle speed, driving patterns and other factors [57]. A major limitation of our study is the variability of factors which were not considered and emission rates of vehicles were calculated using uniform EMEP/EEA emission factors shown in Table 6. Under these conditions, approximately 81% of all modelled PM10 road surface wear emissions were generated by passenger cars, followed by MHCV and LCV vehicle categories, with estimated contribution of approximately 11% and 8%, respectively.
Table 9 shows the results of the AERMOD dispersion model for annual PM concentration values obtained from the reference points that were set at the location of the air quality monitoring stations in Banská Bystrica. Data were divided into exhaust emissions, road surface wear, and road vehicle tire and brake wear combined, respectively. Compering data from Table 9 with mean concentration values calculated from 1-hour averages observed at the air quality monitoring stations in Banská Bystrica, the contribution of each vehicle category, as well as source of PM2.5 and PM10 emissions associated with traffic, were estimated.
According to Ginzburg et al. [45], based on the data collected from a PM2.5 monitoring program in Largo, Maryland, the contribution of on-road mobile sources to ambient air pollution was from approximately12.5% to 17.0% of PM2.5 at the near-road site. The sampled aerosol was a combination of petrol and diesel exhausts and brake and tire wear. However, the individual monthly roadway contributions varied from 7–20% depending on the season. As was mentioned above, the present study did not consider season or weather variations, and our results were slightly higher than the data provided by Ginzburg et al. [45], at reference point SK601002 (near road side), where estimated contribution of PM2.5 was approximately 25%. On the other hand, the estimated PM2.5 contribution to ambient air pollution from on-road mobile sources at reference point SK601007 was about 11%, which is consistent with the position of this site outside major transport routes in Banská Bystrica. Results at reference point SK601002 were consistent with Karagulian et al. [58], who concluded that 25% of urban ambient air PM2.5 pollution is contributed by traffic.
On-road mobile sources contribution to ambient PM10 pollution in Banská Bystrica was estimated to be approximately 17% at reference point SK601002, and 11% at reference point SK601007, respectively. Based on data reported by Heydari et al. [49], traffic contribution to PM pollution varies from 5% to 61% in cities worldwide, with an average of 27%. Wang et al. [59], concluded that traffic-related emissions accounted for approximately 25% of PM10 concentrations in Shanghai, China, on clean days based on back-calculation emission factors and roadside concentration measurements. Heydari et al. [49] found that traffic contribution is on average 24% lower in cities with less than 500,000 inhabitants. Banská Bystrica with 78,000 inhabitants is significantly below this population level. We assume that based on our modelled data traffic significantly contributes to ambient air PM10 pollution, especially along the major traffic routes in Banská Bystrica. According to our results, the contribution of traffic-related PM10 concentrations at locations near the city´s busiest road section number 90871, could reach 50–60% compared to the current level of ambient pollution, which is in agreement with Bukowiecki et al. [60], who found a traffic-related PM10 burden in urban areas close to roads at approximately 60%, and Weinbruch et al. [61] who determined a percentage of 73%. Therefore, the contributions of traffic-related emissions to the ambient PM10 pollution in Banská Bystrica is considered to be primarily responsible for the city´s classification as AQMA. However, a more complex study with an air dispersion model which includes other local sources of emissions in Banská Bystrica, e.g., point sources of emissions from industry and heating, area sources of emissions such as parking or construction sites, as well as other line sources of emissions, especially rail transport, is necessary.
A number of previous studies have been conducted using similar simulation parameters for air dispersion modelling and field data from air quality measuring stations for estimation of the contribution of on-road mobile sources of emissions to PM pollution. These studies in different locations and vehicle fleets have often reported different magnitudes of exhaust and non-exhaust emissions. According to Craig et al. [62], the relative fraction of exhaust to non-exhaust PM2.5 emissions from vehicles depends on road type, vehicle fleet mix, fuel characteristics of the vehicle fleet, surface silt loading, and other factors. Pant and Harrison [63] concluded that exhaust emissions are typically responsible for the majority of the traffic-related PM2.5 emissions near major roadways. Our results showed that the contribution of modelled vehicle exhaust emissions was approximately 46% of total estimated traffic-related PM2.5 emissions at reference point SK601002, and approximately 49% at reference point SK601007. These results are in good agreement with findings provided by Craig et al. [62], who modelled emissions from traffic in Providence and Indianapolis, where the exhaust PM2.5 shares of total traffic-related emissions were 49% and 51%, respectively.
Estimated PM2.5 contributions of tire and brake wear in Table 9 were similar to data reported by Jeong et al. [64], who found that non-exhaust emissions from brake wear accounted for 2% and 6% of PM2.5 at downtown and highway sites in Toronto.
The contribution of PM10 emissions from road surface wear in the present study was broadly in line with results concluded by Amato et al. [65], who found that road dust (road surface wear was incorporated into the re-suspended road dust category) contributed 13% of annual PM10 at a ring road in Paris.
Ginzburg et al. [45], pointed out that no direct correlation of PM2.5 emissions with traffic volumes or speeds was found in the collected data, which supporting data from air quality monitoring stations in Banská Bystrica show in Figure 6. In contrast, Qu et al. [44] demonstrated that both PM10 and PM2.5 concentration levels were significantly correlated with traffic volumes along urban streets of Shenyang and concluded that traffic sources contribute greatly to the mass concentrations of PM10 and PM2.5. In agreement with this research, we found statistically significant (p < 0.001) difference among air quality monitoring stations in Banská Bystrica for PM10 concentration levels and we assume that this is the direct consequence of higher traffic flow rates near reference point SK601002. This is consistent with what has been found in previous research by Qu et al. [44], who suggest that when the traffic flow is greater than 450 cars/5 min, PM10 levels increase rapidly. Furthermore, Padoan and Amato [66] reported an increasing gradient of contributions of PM10 from rural traffic locations. Our findings also support the notion that PM pollution generated by on-road mobile sources is influenced by vehicle fleet, which was demonstrated by Azhari et al. [67].
Traffic-related PM emissions will be significantly affected by growing demand for electro-mobility. Živčák et al. [68] stated that optimistic expectations in 2030 could be for up to 50,000 electric vehicles in the Slovak Republic. Timmers and Achten [54] concluded that combined exhaust and non-exhaust PM emissions of electric vehicles are similar to those of internal combustion engine vehicles. Electric vehicles combine regenerative braking and friction braking whereas internal combustion engine vehicles rely solely on friction braking [69], Thus, electric vehicles avoid brake wear, but due to the need for a battery they are heavier and require stronger brake force leading to more brake wear and more tire wear, as tire wear correlates with vehicle weight [70,71]. Resuspension is assumed to be higher for electric vehicles due to higher weight [54,72]. According to Hooftman et al. [3], electric vehicles’ tire wear is assumed to be 10% higher while brake wear is assumed to be 33% lower compared to the performance of internal combustion engine vehicles. Some studies have shown that electric vehicles can even increase non-exhaust emissions [54,73,74]. Therefore, we assume that the increase in the share of electric vehicles will have a partial positive effect on the ambient air pollution in Banská Bystrica, but fleet electrification makes only a limited contribution in reducing non-exhaust emissions, which were found as the major source of PM emissions in the study area. In addition, due to electric vehicles having no exhaust PM emissions, the change in vehicle fleet effect on PM10 concentrations remains questionable.

4. Conclusions

This study offers an estimation of the contributions of on-road mobile sources of emissions to PM pollution in the air quality management area of Banská Bystrica. The contribution of on-road mobile sources of emissions was based on numerical simulation executed by the AERMOD dispersion model and comparison with data obtained through local air quality monitoring stations. The simulations showed that PM pollution is greatly contributed to by on-road mobile sources of emissions in the study area, especially along the major traffic routes in Banská Bystrica. No statistically significant difference was found among exhaust and non-exhaust PM2.5 traffic-related emissions. Road vehicle tire and brake wear were found to be the dominating sources of non-exhaust PM pollution. Non-exhaust PM-emissions require a stronger policy focus in the same way that exhaust emissions from transport have been addressed in past decades. In addition, the results of the study provide additional information on air dispersion modelling through AERMOD when setting up line sources as separated volume sources.
There are some limitations to the scope of this study. The first is that our research only focused on primary urban expressways and urban roads because traffic data from secondary roads were not available. Another limitation is that the emission rates used in the modelling process were compiled on the basis of a vehicle technical inspections database in the Slovak Republic, thus foreign vehicles were not taken into account. Furthermore, the building downwash effects and climate dependence were not considered during the performance of AERMOD.
In future, more a comprehensive study is needed to analyze the contribution of all local sources of emissions to overall PM concentration in Banská Bystrica. Therefore, future work could extend our study to secondary roads, and we would like to explore the effects of season and climate changes as well as the growing share of electric vehicles in the fleet.

Author Contributions

Conceptualization, J.S. and M.V.; methodology, J.S.; software, J.S.; validation, M.V., M.S. and A.Ď.; formal analysis, A.Ď.; investigation, J.S.; resources, M.G.; data curation, J.S. and P.T.; writing—original draft preparation, J.S.; writing—review and editing, M.V.; visualization, J.S.; supervision, M.S. and M.G.; project administration, M.G. All authors have read and agreed to the published version of the manuscript.

Funding

This research received no external funding.

Institutional Review Board Statement

Not applicable.

Informed Consent Statement

Not applicable.

Data Availability Statement

The data that support the findings of this study are available from the corresponding author, M.V., upon reasonable request.

Acknowledgments

The paper is based on work performed under research contract KEGA 008TU Z-4/2019 and Operational Programme Research and Innovation (NFP: 313010T721). The authors gratefully thank Slovak Hydrometeorological Institute for their assistance and cooperation.

Conflicts of Interest

The authors declare no conflict of interest.

References

  1. How Air Pollution Is Destroying Our Health. Available online: https://www.who.int/news-room/spotlight/how-air-pollution-is-destroying-our-health (accessed on 6 February 2021).
  2. US EPA Organization. How Mobile Source Pollution Affects Your Health. Available online: https://www.epa.gov/mobile-source-pollution/how-mobile-source-pollution-affects-your-health (accessed on 6 February 2021).
  3. Hooftman, N.; Oliveira, L.; Messagie, M.; Coosemans, T.; Van Mierlo, J. Environmental Analysis of Petrol, Diesel and Electric Passenger Cars in a Belgian Urban Setting. Energies 2016, 9, 84. [Google Scholar] [CrossRef]
  4. Kheirbek, I.; Haney, J.; Douglas, S.; Ito, K.; Matte, T. The Contribution of Motor Vehicle Emissions to Ambient Fine Particulate Matter Public Health Impacts in New York City: A Health Burden Assessment. Environ. Health 2016, 15, 89. [Google Scholar] [CrossRef] [PubMed] [Green Version]
  5. Sohrabi, S.; Zietsman, J.; Khreis, H. Burden of Disease Assessment of Ambient Air Pollution and Premature Mortality in Urban Areas: The Role of Socioeconomic Status and Transportation. Int. J. Environ. Res. Public Health 2020, 17, 1166. [Google Scholar] [CrossRef] [PubMed] [Green Version]
  6. Khreis, H.; Warsow, K.M.; Verlinghieri, E.; Guzman, A.; Pellecuer, L.; Ferreira, A.; Jones, I.; Heinen, E.; Rojas-Rueda, D.; Mueller, N.; et al. The Health Impacts of Traffic-Related Exposures in Urban Areas: Understanding Real Effects, Underlying Driving Forces and Co-Producing Future Directions. J. Transp. Health 2016, 3, 249–267. [Google Scholar] [CrossRef]
  7. The Contribution of Transport to Air Quality-TERM 2012: Transport Indicators Tracking Progress towards Environmental Targets in Europe—European Environment Agency. Available online: https://www.eea.europa.eu/publications/transport-and-air-quality-term-2012 (accessed on 6 February 2021).
  8. Krzyżanowski, M.; Kuna-Dibbert, B.; Schneider, J. Health Effects of Transport-Related Air Pollution; WHO Regional Office for Europe: Copenhagen, Danmark, 2005; ISBN 978-92-890-1373-4. [Google Scholar]
  9. Publications Office of the European Union. Non-Exhaust Traffic Related Emissions-Brake and Tyre Wear PM: Literature Review. Available online: http://op.europa.eu/en/publication-detail/-/publication/5b788afc-985d-4e7a-82fe-f8b28f283f8d/language-en (accessed on 6 February 2021).
  10. Koenig, J.Q. Health Effects of Particulate Matter. In Health Effects of Ambient Air Pollution: How Safe is The Air We Breathe? Koenig, J.Q., Ed.; Springer: Boston, MA, USA, 2000; pp. 115–137. ISBN 978-1-4615-4569-9. [Google Scholar]
  11. Fernández Tena, A.; Casan Clarà, P. Deposition of Inhaled Particles in the Lungs. Arch. Bronconeumol. 2012, 48, 240–246. [Google Scholar] [CrossRef]
  12. Non-Exhaust Particulate Emissions from Road Transport: An Ignored Environmental Policy Challenge|En|OECD. Available online: http://www.oecd.org/environment/non-exhaust-particulate-emissions-from-road-transport-4a4dc6ca-en.htm (accessed on 6 February 2021).
  13. ETC/ATNI Report 5/2020: Transport Non-Exhaust PM-Emissions. An Overview of Emission Estimates, Relevance, Trends and Policies. Available online: https://www.eionet.europa.eu/etcs/etc-atni/products/etc-atni-reports/etc-atni-report-5-2020-transport-non-exhaust-pm-emissions-an-overview-of-emission-estimates-relevance-trends-and-policies (accessed on 10 September 2021).
  14. Franco, V.; Kousoulidou, M.; Muntean, M.; Ntziachristos, L.; Hausberger, S.; Dilara, P. Road Vehicle Emission Factors Development: A Review. Atmos. Environ. 2013, 70, 84–97. [Google Scholar] [CrossRef]
  15. Askariyeh, M.H.; Kota, S.H.; Vallamsundar, S.; Zietsman, J.; Ying, Q. AERMOD for Near-Road Pollutant Dispersion: Evaluation of Model Performance with Different Emission Source Representations and Low Wind Options. Transp. Res. Part Transp. Environ. 2017, 57, 392–402. [Google Scholar] [CrossRef]
  16. U.S. EPA. User’s Guide for the AMS/EPA Regulatory Model (AERMOD); U.S. Environmental Protection Agency, Office of Air Quality Planning and Standards, Air Quality Assessment Division, Air Quality Modeling Group: Durham, NC, USA, 2019.
  17. Cimorelli, A.J.; Perry, S.G.; Venkatram, A.; Weil, J.C.; Paine, R.J.; Wilson, R.B.; Lee, R.F.; Peters, W.D.; Brode, R.W. AERMOD: A Dispersion Model for Industrial Source Applications. Part I: General Model Formulation and Boundary Layer Characterization. J. Appl. Meteorol. Climatol. 2005, 44, 682–693. [Google Scholar] [CrossRef]
  18. Munir, S.; Mayfield, M.; Coca, D.; Mihaylova, L.S.; Osammor, O. Analysis of Air Pollution in Urban Areas with Airviro Dispersion Model—A Case Study in the City of Sheffield, United Kingdom. Atmosphere 2020, 11, 285. [Google Scholar] [CrossRef] [Green Version]
  19. Slovak Hydrometeorological Institute. Air Pollution in the Slovak Republic-2019; Slovak Hydrometeorological Institute Air Quality Department: Bratislava, Slovakia, 2020; p. 101.
  20. Zhao, D.; Chen, H.; Shao, H.; Sun, X. Vehicle Emission Factors for Particulate and Gaseous Pollutants in an Urban Tunnel in Xi’an, China. J. Chem. 2018, 2018, e8964852. [Google Scholar] [CrossRef] [Green Version]
  21. Hudda, N.; Fruin, S.; Delfino, R.J.; Sioutas, C. Efficient Determination of Vehicle Emission Factors by Fuel Use Category Using On-Road Measurements: Downward Trends on Los Angeles Freight Corridor I-710. Atmos. Chem. Phys. 2013, 13, 347–357. [Google Scholar] [CrossRef] [Green Version]
  22. EMEP/EEA Air Pollutant Emission Inventory Guidebook 2019—European Environment Agency. Available online: https://www.eea.europa.eu/publications/emep-eea-guidebook-2019 (accessed on 2 July 2021).
  23. Perry, S.G.; Cimorelli, A.J.; Paine, R.J.; Brode, R.W.; Weil, J.C.; Venkatram, A.; Wilson, R.B.; Lee, R.F.; Peters, W.D. AERMOD: A Dispersion Model for Industrial Source Applications. Part II: Model Performance against 17 Field Study Databases. J. Appl. Meteorol. Climatol. 2005, 44, 694–708. [Google Scholar] [CrossRef] [Green Version]
  24. Gibson, M.D.; Kundu, S.; Satish, M. Dispersion Model Evaluation of PM2.5, NOx and SO2 from Point and Major Line Sources in Nova Scotia, Canada Using AERMOD Gaussian Plume Air Dispersion Model. Atmos. Pollut. Res. 2013, 4, 157–167. [Google Scholar] [CrossRef] [Green Version]
  25. Macêdo, M.F.M.; Ramos, A.L.D. Vehicle Atmospheric Pollution Evaluation Using AERMOD Model at Avenue in a Brazilian Capital City. Air Qual. Atmos. Health 2020, 13, 309–320. [Google Scholar] [CrossRef]
  26. Dresser, A.L.; Huizer, R.D. CALPUFF and AERMOD Model Validation Study in the Near Field: Martins Creek Revisited. J. Air Waste Manag. Assoc. 2011, 61, 647–659. [Google Scholar] [CrossRef] [PubMed]
  27. Statistical Office of the Slovak Republic DATAcube Database. Available online: http://datacube.statistics.sk/ (accessed on 9 February 2021).
  28. Slovak Hydrometeorological Institute. Air Pollution in the Slovak Republic-2020; Slovak Hydrometeorological Institute Air Quality Department: Bratislava, Slovakia, 2021; p. 83.
  29. Farr, T.G.; Rosen, P.A.; Caro, E.; Crippen, R.; Duren, R.; Hensley, S.; Kobrick, M.; Paller, M.; Rodriguez, E.; Roth, L.; et al. The Shuttle Radar Topography Mission. Rev. Geophys. 2007, 45. [Google Scholar] [CrossRef] [Green Version]
  30. U.S. EPA. User’s Guide for the AERMOD Terrain Preprocessor (AERMAP); U.S. Environmental Protection Agency, Office of Air Quality Planning and Standards, Air Quality Assessment Division, Air Quality Modeling Group: Durham, NC, USA, 2019.
  31. Warneck, P.S. Pal Arya: Air Pollution Meteorology and Dispersion. J. Atmos. Chem. 2000, 37, 209–211. [Google Scholar] [CrossRef]
  32. Fox, T. SUBJECT: Use of ASOS Meteorological Data in AERMOD Dispersion Modeling. Available online: https://www.semanticscholar.org/paper/SUBJECT%3A-Use-of-ASOS-meteorological-data-in-AERMOD-Fox/98faae921c97651911e8a74625382b8eee050e7c (accessed on 14 February 2021).
  33. U.S. EPA. User’s Guide for AERMOD Meteorological Preprocessor (AERMET); U.S. Environmental Protection Agency, Office of Air Quality Planning and Standards, Air Quality Assessment Division, Air Quality Modeling Group: Durham, NC, USA, 2019.
  34. CORINE Land Cover—Copernicus Land Monitoring Service. Available online: https://land.copernicus.eu/pan-european/corine-land-cover (accessed on 15 February 2021).
  35. An Official Website of the European Union Vehicle Categories. Available online: https://ec.europa.eu/growth/sectors/automotive/vehicle-categories_en (accessed on 7 February 2021).
  36. Webclinic s.r.o. Certificate of Roadworthiness in Slovak Republic-Online Database. Available online: https://www.stkonline.sk/overenie-technickej-kontroly-vozidla (accessed on 28 September 2021).
  37. Transport Engineering|Slovak Road Administration-Ssc.Sk. Available online: https://www.ssc.sk/en/activities/road-network-development/transport-engineering.ssc (accessed on 2 July 2021).
  38. Institute for Environment and Sustainability (Joint Research Centre); Ntziachristos, L.; Pastorello, C.; Kioutsioukis, I.; Kouridis, C.; Dilara, P.; Gkatzoflias, D. Uncertainty Estimates and Guidance for Road Transport Emission Calculations; Publications Office of the European Union: Luxembourg, 2010; ISBN 978-92-79-15307-5. [Google Scholar]
  39. Tiwary, A.; Williams, I. Air Pollution: Measurement, Modelling and Mitigation, 4th ed.; CRC Press: Boca Raton, FL, USA, 2018; ISBN 978-0-429-46998-5. [Google Scholar]
  40. Ursínyová, M.; Hladíková, V. Chapter 4 Lead in the environment of Central Europe. In Trace Metals in the Environment; Markert, B., Friese, K., Eds.; Trace Elements—Their Distribution and Effects in the Environment; Elsevier: Amsterdam, The Netherlands, 2000; Volume 4, pp. 109–134. [Google Scholar]
  41. Ferm, M.; Sjöberg, K. Concentrations and Emission Factors for PM2.5 and PM10 from Road Traffic in Sweden. Atmos. Environ. 2015, 119, 211–219. [Google Scholar] [CrossRef]
  42. Nam, E.; Kishan, S.; Baldauf, R.W.; Fulper, C.R.; Sabisch, M.; Warila, J. Temperature Effects on Particulate Matter Emissions from Light-Duty, Gasoline-Powered Motor Vehicles. Environ. Sci. Technol. 2010, 44, 4672–4677. [Google Scholar] [CrossRef] [PubMed]
  43. U.S. EPA. Guideline on Air Quality Models; U.S. Environmental Protection Agency, Office of Air Quality Planning and Standards, Air Quality Assessment Division, Air Quality Modeling Group: Durham, NC, USA, 1978.
  44. Qu, H.; Lu, X.; Liu, L.; Ye, Y. Effects of Traffic and Urban Parks on PM10 and PM2.5 Mass Concentrations. Energy Sources Part Recovery Util. Environ. Eff. 2019, 1–13. [Google Scholar] [CrossRef]
  45. Ginzburg, H.; Liu, X.; Baker, M.; Shreeve, R.; Jayanty, R.K.M.; Campbell, D.; Zielinska, B. Monitoring Study of the Near-Road PM2.5 Concentrations in Maryland. J. Air Waste Manag. Assoc. 2015, 65, 1062–1071. [Google Scholar] [CrossRef] [Green Version]
  46. World Health Organization Official Website Ambient (Outdoor) Air Pollution. Available online: https://www.who.int/news-room/fact-sheets/detail/ambient-(outdoor)-air-quality-and-health (accessed on 31 August 2021).
  47. Hopke, P.K.; Harrison, R.M.; de Leeuw, F.; Querol, X. Chapter 1-Current State of Particulate Air Quality. In Non-Exhaust Emissions; Amato, F., Ed.; Academic Press: Cambridge, MA, USA, 2018; pp. 1–19. ISBN 978-0-12-811770-5. [Google Scholar]
  48. Standards-Air Quality-Environment-European Commission. Available online: https://ec.europa.eu/environment/air/quality/standards.htm (accessed on 8 September 2021).
  49. Heydari, S.; Tainio, M.; Woodcock, J.; de Nazelle, A. Estimating Traffic Contribution to Particulate Matter Concentration in Urban Areas Using a Multilevel Bayesian Meta-Regression Approach. Environ. Int. 2020, 141, 105800. [Google Scholar] [CrossRef] [PubMed]
  50. Mukherjee, A.; McCarthy, M.C.; Brown, S.G.; Huang, S.; Landsberg, K.; Eisinger, D.S. Influence of Roadway Emissions on Near-Road PM2.5: Monitoring Data Analysis and Implications. Transp. Res. Part Transp. Environ. 2020, 86, 102442. [Google Scholar] [CrossRef]
  51. Rahimi, M.; Bortoluzzi, D.; Wahlström, J. Input Parameters for Airborne Brake Wear Emission Simulations: A Comprehensive Review. Atmosphere 2021, 12, 871. [Google Scholar] [CrossRef]
  52. Amato, F.; Cassee, F.R.; Denier van der Gon, H.A.C.; Gehrig, R.; Gustafsson, M.; Hafner, W.; Harrison, R.M.; Jozwicka, M.; Kelly, F.J.; Moreno, T.; et al. Urban Air Quality: The Challenge of Traffic Non-Exhaust Emissions. J. Hazard. Mater. 2014, 275, 31–36. [Google Scholar] [CrossRef] [PubMed]
  53. Jörß, W.; Handke, V. Emissionen Und Maßnahmenanalyse Feinstaub 2000–2020; Umweltbundesamt: Dessau-Roßlau, Germany, 2007; ISSN 1862-4804. [Google Scholar]
  54. Timmers, V.R.J.H.; Achten, P.A.J. Non-Exhaust PM Emissions from Electric Vehicles. Atmos. Environ. 2016, 134, 10–17. [Google Scholar] [CrossRef]
  55. Rexeis, M.; Hausberger, S. Trend of Vehicle Emission Levels until 2020–Prognosis Based on Current Vehicle Measurements and Future Emission Legislation. Atmos. Environ. 2009, 43, 4689–4698. [Google Scholar] [CrossRef]
  56. Denier van der Gon, H.A.C.; Gerlofs-Nijland, M.E.; Gehrig, R.; Gustafsson, M.; Janssen, N.; Harrison, R.M.; Hulskotte, J.; Johansson, C.; Jozwicka, M.; Keuken, M.; et al. The Policy Relevance of Wear Emissions from Road Transport, Now and in the Future—An International Workshop Report and Consensus Statement. J. Air Waste Manag. Assoc. 2013, 63, 136–149. [Google Scholar] [CrossRef] [Green Version]
  57. Denby, B.R.; Kupiainen, K.J.; Gustafsson, M. Chapter 9-Review of Road Dust Emissions. In Non-Exhaust Emissions; Amato, F., Ed.; Academic Press: Cambridge, MA, USA, 2018; pp. 183–203. ISBN 978-0-12-811770-5. [Google Scholar]
  58. Karagulian, F.; Belis, C.A.; Dora, C.F.C.; Prüss-Ustün, A.M.; Bonjour, S.; Adair-Rohani, H.; Amann, M. Contributions to Cities’ Ambient Particulate Matter (PM): A Systematic Review of Local Source Contributions at Global Level. Atmos. Environ. 2015, 120, 475–483. [Google Scholar] [CrossRef]
  59. Wang, Y.; Huang, Z.; Liu, Y.; Yu, Q.; Ma, W. Back-Calculation of Traffic-Related PM10 Emission Factors Based on Roadside Concentration Measurements. Atmosphere 2017, 8, 99. [Google Scholar] [CrossRef] [Green Version]
  60. Bukowiecki, N.; Lienemann, P.; Hill, M.; Furger, M.; Richard, A.; Amato, F.; Prévôt, A.S.H.; Baltensperger, U.; Buchmann, B.; Gehrig, R. PM10 Emission Factors for Non-Exhaust Particles Generated by Road Traffic in an Urban Street Canyon and along a Freeway in Switzerland. Atmos. Environ. 2010, 44, 2330–2340. [Google Scholar] [CrossRef]
  61. Weinbruch, S.; Worringen, A.; Ebert, M.; Scheuvens, D.; Kandler, K.; Pfeffer, U.; Bruckmann, P. A Quantitative Estimation of the Exhaust, Abrasion and Resuspension Components of Particulate Traffic Emissions Using Electron Microscopy. Atmos. Environ. 2014, 99, 175–182. [Google Scholar] [CrossRef]
  62. Craig, K.J.; Baringer, L.M.; Chang, S.-Y.; McCarthy, M.C.; Bai, S.; Seagram, A.F.; Ravi, V.; Landsberg, K.; Eisinger, D.S. Modeled and Measured Near-Road PM2.5 Concentrations: Indianapolis and Providence Cases. Atmos. Environ. 2020, 240, 117775. [Google Scholar] [CrossRef]
  63. Pant, P.; Harrison, R.M. Estimation of the Contribution of Road Traffic Emissions to Particulate Matter Concentrations from Field Measurements: A Review. Atmos. Environ. 2013, 77, 78–97. [Google Scholar] [CrossRef]
  64. Jeong, C.-H.; Wang, J.M.; Hilker, N.; Debosz, J.; Sofowote, U.; Su, Y.; Noble, M.; Healy, R.M.; Munoz, T.; Dabek-Zlotorzynska, E.; et al. Temporal and Spatial Variability of Traffic-Related PM2.5 Sources: Comparison of Exhaust and Non-Exhaust Emissions. Atmos. Environ. 2019, 198, 55–69. [Google Scholar] [CrossRef]
  65. Amato, F.; Favez, O.; Pandolfi, M.; Alastuey, A.; Querol, X.; Moukhtar, S.; Bruge, B.; Verlhac, S.; Orza, J.A.G.; Bonnaire, N.; et al. Traffic Induced Particle Resuspension in Paris: Emission Factors and Source Contributions. Atmos. Environ. 2016, 129, 114–124. [Google Scholar] [CrossRef]
  66. Padoan, E.; Amato, F. Chapter 2—Vehicle Non-Exhaust Emissions: Impact on Air Quality. In Non-Exhaust Emissions; Amato, F., Ed.; Academic Press: Cambridge, MA, USA, 2018; pp. 21–65. ISBN 978-0-12-811770-5. [Google Scholar]
  67. Azhari, A.; Halim, N.D.A.; Mohtar, A.A.A.; Aiyub, K.; Latif, M.T.; Ketzel, M. Evaluation and Prediction of PM10 and PM2.5 from Road Source Emissions in Kuala Lumpur City Centre. Sustainability 2021, 13, 5402. [Google Scholar] [CrossRef]
  68. Živčák, J.; Kádárová, J.; Puškár, M.; Kočišová, M.; Lachvajderová, L. Expected Impacts of the Massive Increase in Electric Vehicles in Slovakia. Appl. Sci. 2020, 10, 8945. [Google Scholar] [CrossRef]
  69. Luin, B.; Petelin, S.; Al-Mansour, F. Microsimulation of Electric Vehicle Energy Consumption. Energy 2019, 174, 24–32. [Google Scholar] [CrossRef]
  70. Berjoza, D.; Jurgena, I. Effects of Change in the Weight of Electric Vehicles on Their Performance Characteristics. Agron. Res. 2017, 15, 952–963. [Google Scholar]
  71. Pohrt, R. TIRE WEAR PARTICLE HOT SPOTS–REVIEW OF INFLUENCING FACTORS. Facta Univ. Ser. Mech. Eng. 2019, 17, 17–27. [Google Scholar] [CrossRef] [Green Version]
  72. Beddows, D.C.S.; Harrison, R.M. PM10 and PM2.5 Emission Factors for Non-Exhaust Particles from Road Vehicles: Dependence upon Vehicle Mass and Implications for Battery Electric Vehicles. Atmos. Environ. 2021, 244, 117886. [Google Scholar] [CrossRef]
  73. Brezin, V.; Antov, P. Engineering Ecology, 1st ed.; Publishing House of the UF: Sofia, Bulgaria, 2015. [Google Scholar]
  74. Simons, A. Road Transport: New Life Cycle Inventories for Fossil-Fuelled Passenger Cars and Non-Exhaust Emissions in Ecoinvent V3. Int. J. Life Cycle Assess. 2016, 21, 1299–1313. [Google Scholar] [CrossRef]
Figure 1. Data flow in study design.
Sustainability 13 12748 g001
Figure 2. Location of the city territory of Banská Bystrica; locating position using the Universal Transverse Mercator (UTM) coordinate system, zone 34 N.
Sustainability 13 12748 g002
Figure 3. Topographic map of Banská Bystrica with elevation contours based on SRTM digital elevation dataset.
Sustainability 13 12748 g003
Figure 4. Windrose diagram (data period: from 1 January 2019 to 31 December 2020) compiled using WRPlot View (v.8.0.2, Lakes Environmental, Waterloo, ON, Canada).
Sustainability 13 12748 g004
Figure 5. Main road sections in Banská Bystrica used in the model simulations based on nationwide traffic survey conducted by the Slovak Road Administration (road section numbering according to Table 5).
Sustainability 13 12748 g005
Figure 6. Box plots comparing PM10 and PM2.5 concentration values from air quality monitoring stations in Banská Bystrica.
Sustainability 13 12748 g006
Figure 7. Distribution of estimated annual PM2.5 (left) and PM10 (right) concentration values from on-road mobile sources within the study area.
Sustainability 13 12748 g007
Table 1. Domain boundaries and parameters.
Domain AxisLength [m]Spacing [m]Boundary Points UTM 34N [m]
X Axis6268.80313.44360,868.07 (XMIN)
367,136.87 (XMAX)
Y Axis6258.40312.925,396,382.02 (YMIN)
5,402,640.42 (YMAX)
Table 2. Air quality monitoring stations operating within Banská Bystrica parameters.
Station NameStation CodeSampling Method (PM2.5/PM10)Sampling InstrumentIntegration Time (PM2.5/PM10)Station
Type
Banská Bystrica, Štefánikovo nábrežieSK601002TEOM-ETEOM 1405F1-hurban traffic
Banská Bystrica, ZelenáSK601007TEOM-ETEOM 1405F1-hurban background
Table 3. Vehicle population statistics according to vehicle technical inspections database in the Slovak republic, 31 December 2020.
Vehicle CategoryFuel TypeFuel Type, %Vehicles in Use
MPetrol53.631,320,329
Diesel44.991,107,497
CNG0.04994
Electric Power0.092194
Ethanol0.002
LNG0.000
LPG0.0010
N/A1.2530,687
Subtotal 100.002,461,713
LCVPetrol15.3041,161
Diesel83.08223,527
CNG0.06154
Electric Power0.05135
Ethanol0.000
LNG0.000
LPG0.003
N/A1.524077
Subtotal 100.00269,057
MHCVPetrol0.16128
Diesel97.9279,293
CNG0.0539
Electric Power0.000
Ethanol0.000
LNG0.0864
LPG0.000
N/A1.791452
Subtotal 100.0080,976
LPetrol97.00163,728
Diesel0.10166
CNG0.000
Electric Power0.58983
Ethanol0.000
LNG0.000
LPG0.000
N/A2.323910
Subtotal 100.00168,787
Grand Total 2,980,533
Note: CNG = Compressed Natural Gas; LNG = Liquefied Natural Gas; LPG = Liquefied Petroleum Gas; N/A = Not Available; Petrol group includes all types of petrol fuels according to their octane rating, fuel combinations (petrol + CNG/LNG/LPG), and hybrid vehicles; Electric power = pure-electric vehicles.
Table 4. EURO-X emission standards in Slovak republic, 31 December 2020.
Vehicle CategoryFuel TypeEURO-X Emission Standards
EURO 1EURO 2EURO 3EURO 4EURO 5EURO 6
MPetrol0.00%4.94%8.38%31.62%19.92%35.14%
Diesel0.00%4.86%15.82%27.00%29.20%23.11%
LCVPetrol0.00%4.12%16.27%66.92%5.55%7.15%
Diesel0.00%3.34%17.77%44.22%17.77%16.89%
MHCVPetrol0.00%46.67%40.00%13.33%0.00%0.00%
Diesel0.00%1.95%15.36%12.12%17.49%53.07%
LPetrol0.03%25.64%49.22%24.69%0.42%0.00%
Diesel0.00%69.41%18.82%11.76%0.00%0.00%
Table 5. Traffic data and road parameters of associated road sections included in study.
Road SectionRoad TypeNumber of LanesLengthLane WidthSpeed LimitVehicle Category ADT
MLCVMHCVL
---[m][m][km/h][Number of Vehicles per 24 h]
93582UR41186.2014.0050587465019643
90871UE62669.1021.509046,78145691375193
93581UR51331.8017.505021,912134740567
90872UR5772.6019.205038,6972485748100
92831UR21481.407.0050374835510721
90663UE41328.4015.009026,3493724112161
90873UR4857.1014.205030,367222867195
92821UR21960.906.005045763269816
90662UE4831.0015.009031,1264670140640
90664UE4721.2014.008012,138250775440
90665UE41238.7014.009021,003237471562
90881UE41350.8014.008013,116183755337
90874UR31346.4010.055012,021115534729
90882UE4456.9014.008015,413194058448
Note: UE = urban expressways; UR = urban road.
Table 6. PM emission factors by EMEP/EEA Guidebook used in study (95% confidence interval of non-exhaust emission factor shown in parentheses).
Vehicle CategoryFuelSpeed LimitExhaust Emission Factor (PM2.5)Non-Exhaust Emission Factor
Road Surface WearRoad Vehicle Tire/Brake Wear Combined
EURO2EURO3EURO4EURO5EURO6PM10PM2.5PM10PM2.5
--[km/h][mg/km Per Vehicle][mg/km Per Vehicle]
MP503.203.201.301.301.407.50 4.50–10.10)4.10 (2.40–5.50)13.80 (8.30–19.50)7.40 (4.50–10.70)
P901.901.901.201.201.20
D5042.1027.8026.802.101.50
D9044.7038.1024.701.601.00
LCVP503.201.301.301.401.407.50 (4.50–10.10)4.10 (2.40–5.50)21.60 (13.90–28.20)11.70 (7.10–14.80)
P901.901.201.203.003.00
D5061.5041.2021.501.101.10
D90118.1079.1041.300.900.90
MHCVD50139.20145.2033.2041.104.0038.00 (22.80–51.30)20.50 (12.30–27.70)59.00 (50.00–95.00)31.60 (28.10–54.10)
D90164.30110.7028.0032.102.90
Note: P—petrol; D—diesel.
Table 7. Determined emission rates of total PM2.5 and PM10 for each vehicle category and road section used by AERMOD model.
PollutantRoad SectionEmission Rate [mg/s]
Exhaust EmissionsRoad Surface Wear EmissionsRoad Vehicle Tire and Brake Wear Emissions
MLCVMHCVMLCVMHCVMLCVMHCV
PM2.5935822.810.711.651.590.180.262.860.500.41
9087152.6421.2128.1728.442.784.1851.337.936.44
9358111.791.653.836.650.410.6112.001.170.95
9087212.071.774.106.810.440.6612.291.251.01
928312.240.481.121.260.120.182.280.340.28
9066314.768.6111.437.971.131.7014.393.222.61
9087310.511.764.085.930.440.6510.701.241.01
928213.620.591.372.040.150.223.690.420.34
9066210.906.758.975.890.881.3310.632.522.05
906643.693.144.181.990.410.623.601.180.96
9066510.975.126.795.930.671.0110.701.911.55
908817.474.325.734.040.570.857.281.611.31
908746.541.433.323.690.350.536.651.010.82
908822.971.542.051.600.200.302.900.580.47
PM1093582---2.900.320.495.340.930.76
90871---52.035.087.7595.7314.6312.03
93581---12.160.751.1422.372.151.77
90872---12.460.801.2222.922.301.89
92831---2.310.220.334.260.630.52
90663---14.582.063.1426.835.944.88
90873---10.840.801.2119.952.291.88
92821---3.740.270.416.880.770.63
90662---10.781.622.4719.834.663.83
90664---3.650.751.156.712.171.78
90665---10.841.231.8719.953.532.90
90881---7.381.031.5813.582.982.45
90874---6.740.650.9912.411.871.53
90882---2.930.370.565.401.060.87
Table 8. Estimated annual mean PM concentrations, standard deviation, median, maximum and minimum concentration values produced by on-road mobile sources of PM emissions in study area. The contribution (percent) of vehicle category to total estimated concentrations in study are shown in parentheses.
PollutantStatistical
Indicator
Exhaust Emissions
[μg/m3]
Non-Exhaust EmissionsTotal [μg/m3]
Road Surface Wear
[μg/m3]
Road Vehicle Tire and Brake Wear [μg/m3]
MLCVMHCVMLCVMHCVMLCVMHCV
PM2.5Mean ± SD0.74 ± 0.54 (26.15%)0.27 ± 0.22
(9.54%)
0.38 ± 0.29 (13.43%)0.41 ± 0.30 (14.49%)0.04 ± 0.03 (1.41%)0.06 ± 0.04 (2.12%)0.73 ± 0.53 (25.80%)0.11 ± 0.09 (3.89%)0.09 ± 0.07 (3.18%)2.83 ± 2.09 (100%)
Median0.640.210.320.350.030.050.640.090.07-
Min0.07
(25.00%)
0.03 (10.71%)0.04 (14.29%)0.04 (14.29%)0.00 (0.00%)0.01 (3.57%)0.07 (25.00%)0.01 (3.57%)0.01 (3.57%)0.28 (100%)
Max4.41 (26.39%)1.74 (10.41%)2.16 (12.93%)2.39 (14.30%)0.23 (1.38%)0.32 (1.92%)4.31 (25.79%)0.66 (3.95%)0.49 (2.93%)16.71 (100%)
PM10Mean ± SD---0.74 ± 0.54 (27.82%)0.07 ± 0.06 (2.63%)0.11 ± 0.08 (4.14%)1.37 ± 1.00 (51.50%)0.21 ± 0.16 (7.89%)0.16 ± 0.12 (6.02%)2.66 ± 1.95 (100%)
Median---0.650.060.091.190.170.14-
Min---0.07 (25.93%)0.01 (3.70%)0.02 (7.41%)0.13 (48.15%)0.02 (7.41%)0.02 (7.41%)0.27 (100%)
Max---4.37 (28.07%)0.42 (2.70%)0.60 (3.85%)8.04 (51.64%)1.22 (7.84%)0.92 (5.91%)15.57 (100%)
Table 9. Estimated annual PM concentration values in μg/m3 calculated by AERMOD dispersion model simulation at reference points. The contribution (percent) of mean PM concentration measured at air quality monitoring stations shown in parentheses.
PollutantVehicle CategoryReference Point SK601002Reference Point SK601007
Exhaust EmissionsRoad Surface WearRoad Vehicle Tire and Brake WearExhaust EmissionsRoad Surface WearRoad Vehicle Tire and Brake Wear
PM2.5M1.34 (6.90%)0.75
(3.86%)
1.36
(7.00%)
0.55 (2.79%)0.31 (1.57%)0.55 (2.79%)
LCV0.29
(1.49%)
0.06
(0.31%)
0.17
(0.88%)
0.20
(1.02%)
0.03 (0.15%)0.08 (0.41%)
MHCV0.57
(2.94%)
0.09
(0.46%)
0.14
(0.72%)
0.27
(1.37%)
0.04 (0.20%)0.06 (0.30%)
Subtotal2.20 (11.33%)0.90 (4.63%)1.67 (8.60%)1.02 (5.18%)0.38 (1.92%)0.69 (3.50%)
PM10M-1.37 (4.88%)2.53 (9.02%)-0.60 (3.12%)1.03 (5.35%)
LCV-0.11 (0.39%)0.32 (1.14%)-0.05 (0.26%)0.15 (0.78%)
MHCV-0.17 (0.61%)0.26 (0.93%)-0.08 (0.42%)0.12 (0.62%)
Subtotal-1.65 (5.88%)3.11 (11.09%)-0.73 (3.80%)1.30 (6.75%)
Publisher’s Note: MDPI stays neutral with regard to jurisdictional claims in published maps and institutional affiliations.

