
A Regional Industrial Economic Forecasting Model Based on a Deep Convolutional Neural Network and Big Data

 ,
, 
Abstract
:1. Introduction
- (1)
- A novel multilayer CNN is constructed for predicting the economic development of primary, secondary and tertiary industries of multi-regions. In the CNN, the GDP of a region is separated from the other indicators of the region before full connection layers, which aims to enhance the predict accuracy according to the GDP value.
- (2)
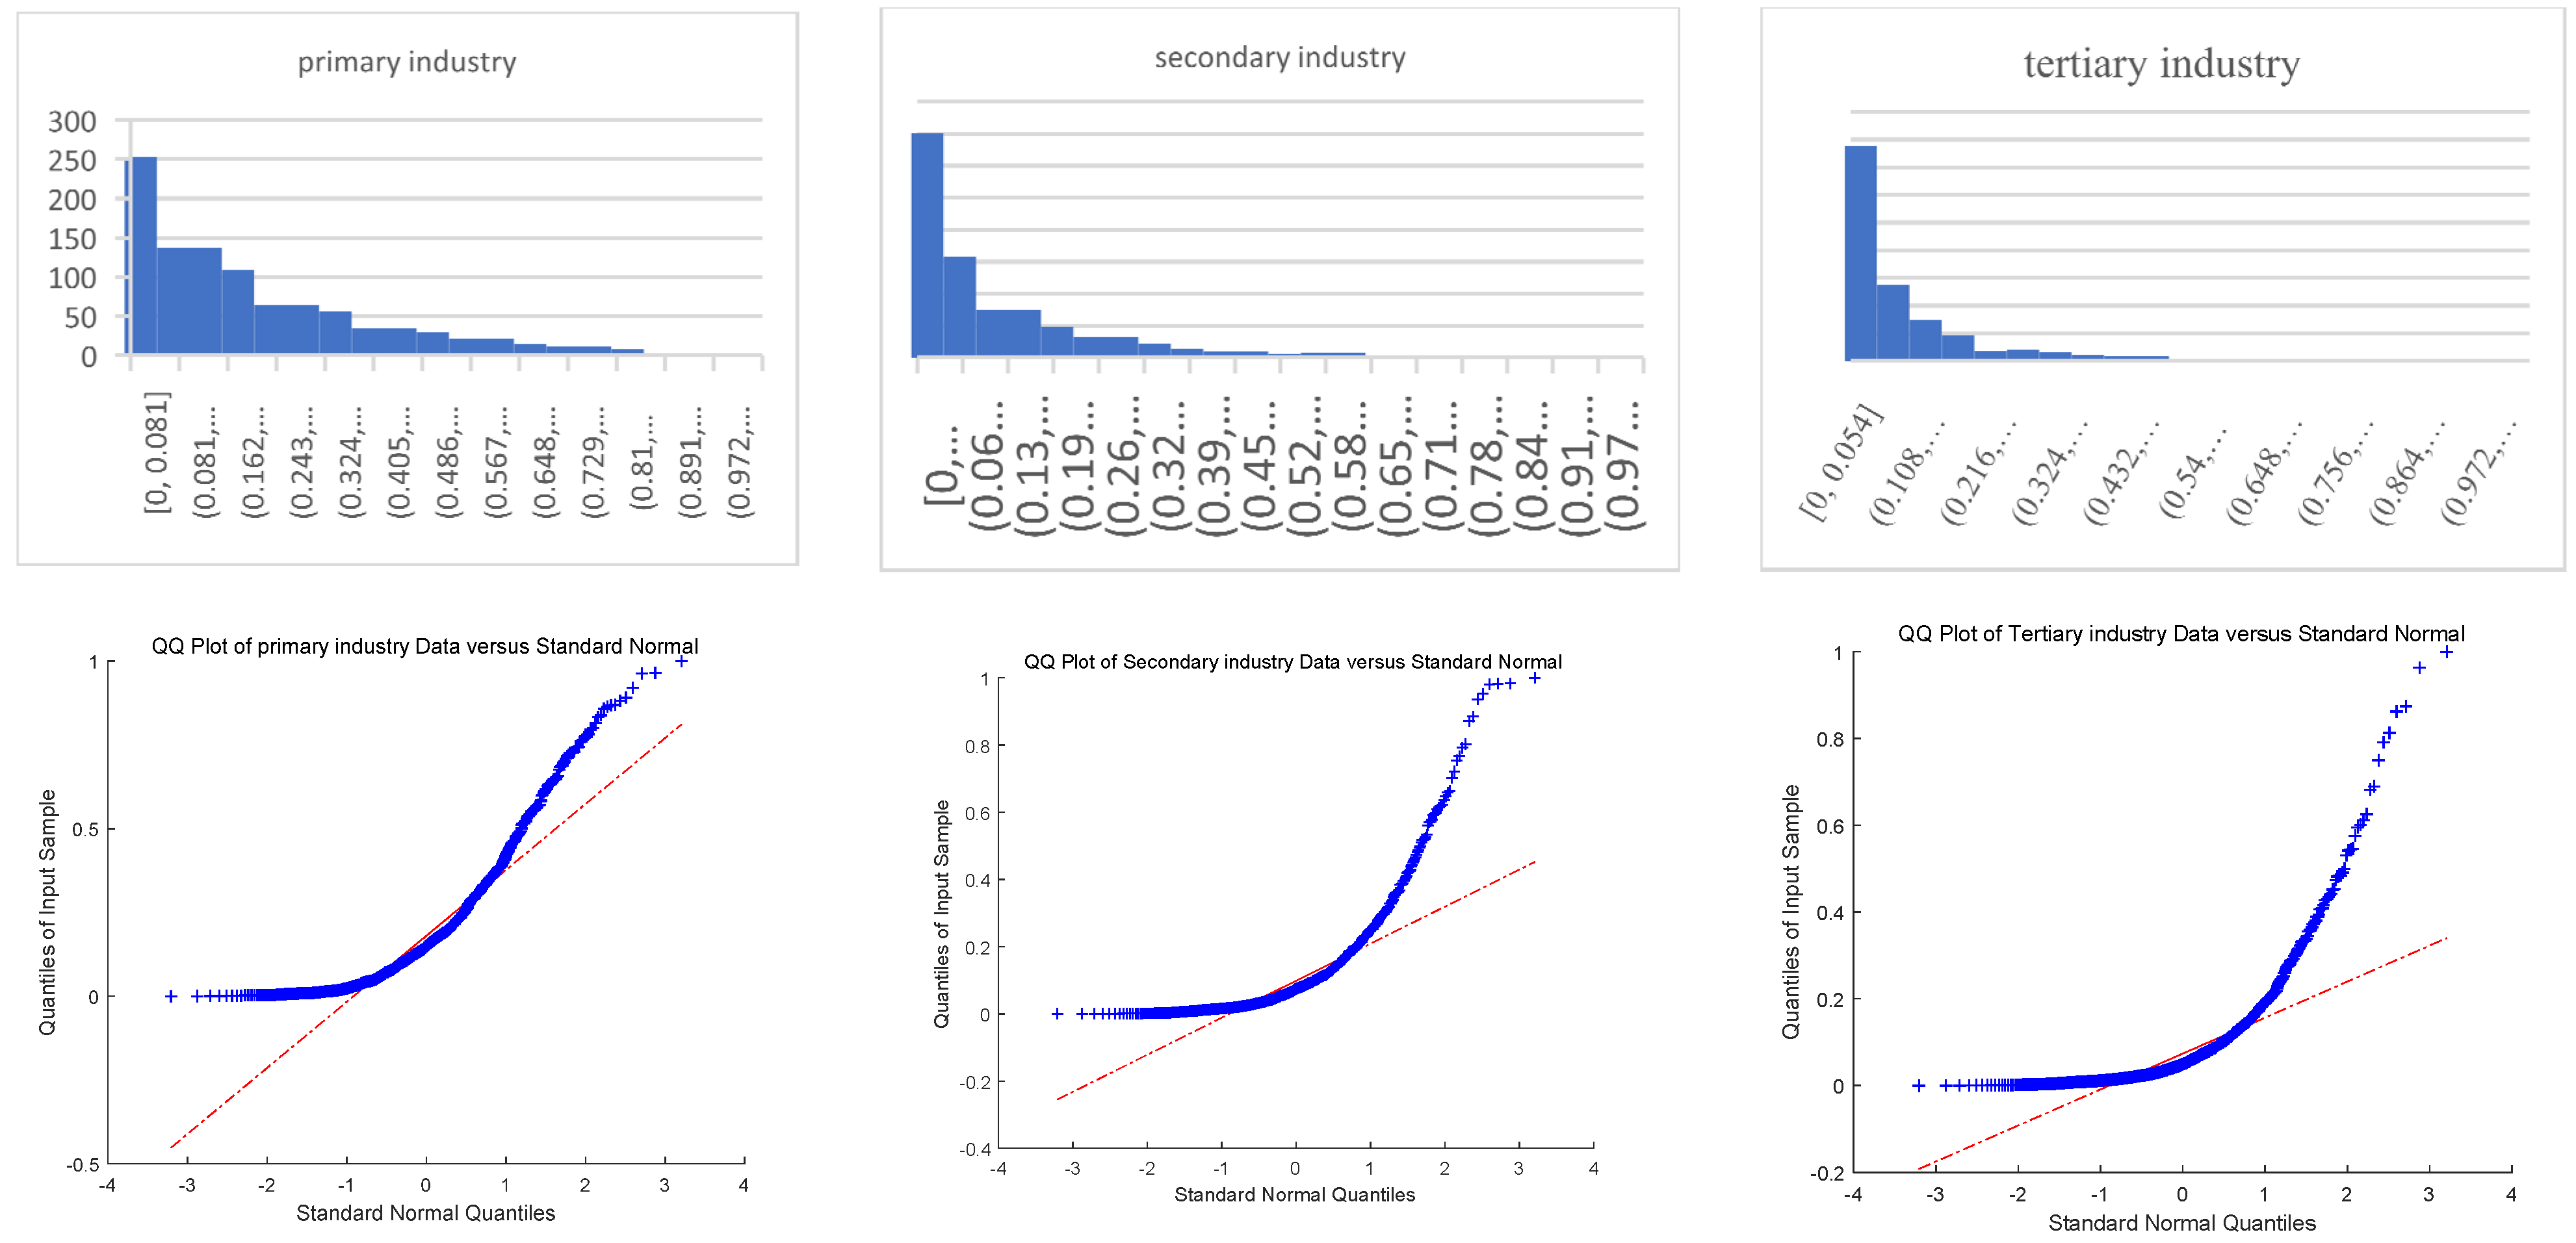
- To reduce the data heterogeneity among the economic indicators of each regions and the differences in the economic development levels of each region, the data are first normalized to balance the deviations among the indicators, and then the normalized data were transformed exponentially to balance the deviations among the regions.
2. Prediction Models Based on Deep Convolutional Neural Networks
2.1. Model Architecture
2.2. Model Analysis
3. Analysis and Forecast of the Industrial Economy of 31 Provinces and Municipalities in China
3.1. Dataset
3.2. Network Parameters
3.3. Results and Analysis
- (1)
- R-Squaredwhere and represent the true output value and network prediction of the ith sample, respectively; and represents the mean value of the true value in the region.
- (2)
- Root Mean Squared Log Error RMSLEwhere and represent the true output value and network prediction of the ith sample, respectively.
- (1)
- The multilayer CNN requires a large sample size to train the network, but the historical economic data of each region is general not sufficient due to the lack and missing of historical data.
- (2)
- The CNN has high prediction and recognition ability when it has seen similar sample data; however, its prediction ability is deficient for the data that has never been seen before.
- (3)
- The predication model proposed in this work only considers the GDP; GDP grow index; and the growth value of primary, secondary, and tertiary industry as inputs, and it can also predict the future growth values of primary, secondary, and tertiary industries in a region. However, regional economic forecasting should consider the development trends of more precise industrial economies (e.g., financial industry, tourism, ecological environment, population structure, etc.).
- (1)
- Construction of a multiregional and multi-industrial structure economic index system. The indicators of regional population structure, ecological environment, tourism, logistics, service industry, agriculture and industry are integrated to build a more scientific and complete multiregional and multi-industry structure indicator system.
- (2)
- Construction of correlation relationship model for the multiregional and multi-industry structure.
- (3)
- Prediction model construction for multiregional and multi-industrial structure economic indexes.
4. Conclusions
Supplementary Materials
Author Contributions
Funding
Institutional Review Board Statement
Informed Consent Statement
Data Availability Statement
Acknowledgments
Conflicts of Interest
References
- Lin, Y. Economics in the New Era of China. Theory Stud. Explor. 2020, 1, 9–12. [Google Scholar]
- Lin, Y. The New Dual Cycle Development Apporach. China Bond 2021, 3, 7–9. [Google Scholar]
- Ye, L.; Li, Y.; Liang, W.; Zhang, H. Correlation and Ripple Effect of Agriculture Sector in Hainan Province. Chin. J. Trop. Agric. 2017, 37, 82–87. [Google Scholar]
- Chen, X.; Zhu, J.; Li, G.P. Regional Disparity and Influencing Factors of Industrial Co-Agglomeration in Chinese Manufacturing. Econ. Geogr. 2018, 38, 104–110. [Google Scholar]
- Chen, X.; Zhu, J. The effect of manufacturing industry affiliation on inter-industry synergistic agglomeration. Soc. Sci. Front. 2018, 2, 257–261. [Google Scholar]
- He, D.; Hu, X. A Study of Correlation Effect and Ripple Effect of Real Estate Industry Based on the Positive Analysis of Input-output Tables in China. Rev. Ind. Econ. 2015, 2, 17–27. [Google Scholar]
- Wei, M.; Wang, L.; Li, Y. The Industrial Association and Spreading Effects Resulting From Modern Logistics Industry. J. Bus. Econ. 2009, 12, 15–21. [Google Scholar]
- Hu, R.; Huang, X.; Chen, L. Dynamic Effects of Financial Services Industry on the Optimization of Industrial Structure in Hunan. Theory Pract. Financ. Econ. 2012, 33, 22–26. [Google Scholar]
- Chen, J.; Wang, Y. Industry Linkages and Spatial Distribution of Producer Services—An Analysis Based on Urban Panel Data Spatial Econometrics. Econ. Surv. 2016, 33, 96–101. [Google Scholar]
- Li, J.; Wan, C. The Empirical Research on the Influential Factors of Shanghai Cultural and Creative Industries Development-Based on the Gray Connection Model Analyzes. Comment. Cult. Ind. China 2017, 24, 202–219. [Google Scholar]
- Zhou, M. Study on the correlation effect of information industry in Zhejiang Province, China. Res. Financ. Econ. Issues 2016, S1, 18–22. [Google Scholar]
- Zhu, L.; Wang, M. Evolution Analysis of Industry Correlation and Spreading Effect of Circulation Industry Based on the Inout-Outout Table. China Bus. Mark. 2018, 32, 75–84. [Google Scholar]
- Wang, S. A study of industrial linkages and industrial ripple effects of the financial industry in Zhejiang Province, China. Manag. Adm. 2014, 12, 86–88. [Google Scholar]
- Tuo, S.; He, H. A Study of Multiregional Economic Correlation Analysis Based on Big Data—Taking the Regional Economy of Cities in Shaanxi Province, China, as an Example. Sustainability 2021, 13, 5121. [Google Scholar] [CrossRef]
- Yang, T.; Pan, H.; Zhang, X.; Greenlee, A.; Deal, B. How neighborhood conditions and policy incentives affect relocation outcomes of households from low-income neighborhoods—Evidence from intra-city movement trajectories. Cities 2021, 119, 103415. [Google Scholar] [CrossRef]
- Kong, L.; Liu, Z.; Wu, J. A systematic review of big data-based urban sustainability research: State-of-the-science and future directions. J. Clean. Prod. 2020, 273, 123142. [Google Scholar] [CrossRef]
- Allam, Z.; Dhunny, Z.A. On big data, artificial intelligence and smart cities. Cities 2019, 89, 80–91. [Google Scholar] [CrossRef]
- Tang, Z.; Wang, M.; Wei, D.; Liu, Z. Seasonally-Adjusted FWA-SVR Model and Its Application in Tourism Economic Forecast. J. Syst. Sci. Math. Sci. 2021, 41, 1572. [Google Scholar]
- Cheng, M.; Han, Y. Grey Model GM(1,1) Based on Variable Generation Coefficient and Its Applications. Stat. Decis. 2020, 36, 15–18. [Google Scholar]
- Tang, C.; Ye, L. On China’s Macroeconomic Forecast Based on Bayesian Mixing Model. New Financ. 2021, 2, 24–30. [Google Scholar]
- Chen, Y.; Liu, L.; Chen, X. Research on Inflation Rate Forecasting Based on Deep Learning LSTM Model. Res. Financ. Econ. Issues 2021, 1–14. Available online: https://kns.cnki.net/KXReader/Detail?invoice=mzlTo0TGfkyB3xEJ0UHfGjP%2Fkd6nU0C3aIOecU3%2B2PuwSNb%2BuUxo%2BfyA3T0D2ehPzg3Gs%2FjseCKwUKUKWM%2BhIm%2Fa7MSWw16%2BfWt%2FwikgGTYZ9XADbi%2BcCwvpRa2o6JaB7sVejQayjH0iZrH4AFiwLxK4vbRpWS8BougEZB%2BjG5g%3D&DBCODE=CAPJ&FileName=CJWT20210406000&TABLEName=capjlast&nonce=F519E1B03A874B58AA9FE624BBA0FC55&TIMESTAMP=1637207398092&UID=WEEvREcwSlJHSldTTEYzVnBFbFJWVUp0Y2dHZmxNMjkyNHRDb3M0WnNSND0%3d%249A4hF_YAuvQ5obgVAqNKPCYcEjKensW4IQMovwHtwkF4VYPoHbKxJw!!&PlatForm=kdoc (accessed on 20 May 2021).
- Ji, Y. Big Data-based Mixed Frequency Macroeconomic Prediction and Monitoring Index Construction. Stat. Decis. 2021, 7, 36–39. [Google Scholar]
- Xia, M.; Jiang, L. China’s Consumer Confidence Index Forecast Based on Deep Network CNN-LSTM Model. Stat. Decis. 2021, 7, 21–26. [Google Scholar]
- Rakpho, P.; Yamaka, W. The forecasting power of economic policy uncertainty for energy demand and supply. Energy Rep. 2021, 7, 338–343. [Google Scholar] [CrossRef]
- Lyu, Y.; Nie, J.; Yang, S.K.X. Forecasting US economic growth in downturns using cross-country data. Econ. Lett. 2021, 198, 109668. [Google Scholar] [CrossRef]
- Claveria, O.; Monte, E.; Torra, S. Economic forecasting with evolved confidence indicators. Econ. Model. 2020, 93, 576–585. [Google Scholar] [CrossRef]
- Tang, X.; Li, Z.; Hu, X.; Xu, Z.; Peng, L. Self-correcting error-based prediction model for the COVID-19 pandemic and analysis of economic impacts. Sustain. Cities Soc. 2021, 74, 103219. [Google Scholar] [CrossRef]
- Kim, S.Y.; Upneja, A. Majority voting ensemble with a decision trees for business failure prediction during economic downturns. J. Innov. Knowl. 2021, 6, 112–123. [Google Scholar] [CrossRef]
- Goodfellow, I.; Bengio, Y.; Courville, A. Deep Learning; MIT Press: Cambridge, UK, 2016; Volume 1, pp. 326–366. [Google Scholar]
- Ioffe, S.; Szegedy, C. Batch normalization: Accelerating deep network training by reducing internal covariate shift. In Proceedings of the 32nd International Conference on International Conference on Machine Learning (ICML’15), Lille, France, 7–9 July 2015; JMLR.org: Boston, MA, USA, 2015; Volume 37, pp. 448–456. [Google Scholar]
- Kingma, D.; Ba, J. Adam: A Method for Stochastic Optimization. In Proceedings of the 3rd International Conference on Learning Representations (ICLR 2015), San Diego, CA, USA, 7–9 May 2015. [Google Scholar]
 ,
,  ,
,  ,
,  and
and  represent the values of GDP, GDP growth index, primary industry growth value, secondary industry growth value, and tertiary industry growth value, respectively, of one years.
, , , and represent the values of GDP, GDP growth index, primary industry growth value, secondary industry growth value, and tertiary industry growth value, respectively, of one years.
represent the values of GDP, GDP growth index, primary industry growth value, secondary industry growth value, and tertiary industry growth value, respectively, of one years.
, , , and represent the values of GDP, GDP growth index, primary industry growth value, secondary industry growth value, and tertiary industry growth value, respectively, of one years.


| Subnetwork 1 for Panel Data | Subnetwork 2 for GDP Data | |||||||||
|---|---|---|---|---|---|---|---|---|---|---|
| Layers | Type | Number of Channels | Kernel Size | Stride Size | Padding Size | Layers | Type | Number of Channels | Kernel Size | Padding Size |
| Convolution layer 1 | Convolution | 64 | (3,1) | (1,1) | (2,1) | Convolution layer 1 | Convolution | 16 | (3,1) | (1,0) |
| Batch normalization | 64 | / | / | / | / | Batch normalization | 16 | / | / | |
| Relu | 64 | / | / | / | / | Relu | 16 | / | / | |
| Pooling | 64 | (3,1) | / | / | / | Pooling | 16 | (3,1) | / | |
| Convolution layer 2 | Convolution | 32 | (1,3) | (1,1) | (1,2) | Full connection layer 0_0 | Input size: 16; output size: 32 | |||
| Batch normalization | 32 | / | / | / | Full connection layer 0_1 | Input size: 32; output size: 16 | ||||
| Relu | 32 | / | / | / | ||||||
| Pooling | 32 | (1,2) | / | / | ||||||
| Convolution layer 3 | Convolution | 16 | (2,2) | (1,1) | (0,0) | |||||
| Batch normalization | 16 | / | / | / | ||||||
| Relu | 16 | / | / | / | ||||||
| Pooling | 16 | (2,2) | / | / | ||||||
| Merge the output of subnetwork 1 and subnetwork 2 | ||||||||||
| Full connection layer 1_0 | Input size: 16, output size:32 | |||||||||
| Full connection layer 1_0 | Input size: 32, output size:3 The output is the economic growth values of the three industries in the 6th year. | |||||||||
Publisher’s Note: MDPI stays neutral with regard to jurisdictional claims in published maps and institutional affiliations. |
© 2021 by the authors. Licensee MDPI, Basel, Switzerland. This article is an open access article distributed under the terms and conditions of the Creative Commons Attribution (CC BY) license (https://creativecommons.org/licenses/by/4.0/).
Share and Cite
Tuo, S.; Chen, T.; He, H.; Feng, Z.; Zhu, Y.; Liu, F.; Li, C. A Regional Industrial Economic Forecasting Model Based on a Deep Convolutional Neural Network and Big Data. Sustainability 2021, 13, 12789. https://doi.org/10.3390/su132212789
Tuo S, Chen T, He H, Feng Z, Zhu Y, Liu F, Li C. A Regional Industrial Economic Forecasting Model Based on a Deep Convolutional Neural Network and Big Data. Sustainability. 2021; 13(22):12789. https://doi.org/10.3390/su132212789
Chicago/Turabian StyleTuo, Shouheng, Tianrui Chen, Hong He, Zengyu Feng, Yanling Zhu, Fan Liu, and Chao Li. 2021. "A Regional Industrial Economic Forecasting Model Based on a Deep Convolutional Neural Network and Big Data" Sustainability 13, no. 22: 12789. https://doi.org/10.3390/su132212789