1. Introduction
In the last twenty years, in terms of the intensity of its presentation in the media market, the daily press has been confronted with a constant decrease in the number of titles issued, a decrease in their sales and reading, an increase in the average cost of these editions, and lower advertising revenues [
1].
The volume of daily press has been significantly impacted by economic factors and technological development. On one hand, publishing print media is economically demanding, on other hand it is affected by the loss of revenues from declining print sales due to the growing popularity of network media [
2].
A growing amount of literature documents that electronic media draw consumers from traditional media markets. Fewer studies examine how the Internet has altered the audience for traditional media [
3]. As further stated by the authors Gronlund and Bjorkroth, the daily newspapers are currently facing inter-media and intra-media competitive pressures [
4]. The results showed that the decline trends of circulation and advertising expenditure are not only due to external environmental factors that are difficult to control, such as the development of communication technology, economics, and politics of the country, but they are also influenced by internal factors within newspapers and newspaper companies that indirectly shape reader and advertiser perceptions toward the credibility and quality of a newspaper [
5] (p. 42).
Authors Conboy and Steel concluded that the evidence to date suggests that the impact of the Internet on contemporary newspaper practice and indeed on the potential future of newspapers is far from a simple switch of technological engagement with readerships. It is rather a switch that has, within its institutional and political dynamic, a number of factors that destabilize traditional notions of citizenship and community. Hyper-differentiation may indeed place pressure on the deliberative ideal; yet, the producers and the readers of newspapers have the ultimate say and even responsibility for their future [
6].
It is a fact that the crisis in the daily press market is increasing not only abroad but also in Slovakia. This is confirmed by the long-term decreasing sales of the daily newspapers. We recorded this fact in virtually all the journals observed—those that are considered to be focused on serious content, as well as those that are focused on a less demanding reader, or even tabloid-oriented ones. An interesting view of these topic is presented by Appel [
7] (p. 1).
Parratt and Olmo point out that the phenomenon of free daily press also has a considerable impact on the daily press [
8].
The natural question for all current actors in the media market is what the further development of these media channels will be in terms of their impact on readers and also in terms of their possible content changes. In both cases, however, two questions need to be answered—How the size of the prospective target audience of readers will evolve? and What forms of information transmission will ensure their effective contact with readers? In a more detailed way, the similar questions “…on relationship between social media influencers and their followers by focusing on their attachment development mechanism and its casual factors and effects…” were discussed by Chung-Wha [
9] (p. 2).
As stated by the authors Fortunati and O’Sullivan, print newspapers have come to be seen as the weakest layer in the network of personal media [
10].
Sales promotions that bundle products with newspaper sales have become a fundamental element of the sales strategy of most journals. However, in recent years, due to saturation between products in the newsstand and the lack of strategy after its launch, among other factors related to the crisis of traditional media, this tool has begun to show signs of failure to motivate sales [
11] (p. 2).
The future of the press is still vague in Malaysia. Researchers under the management of Otman Siti Suriani conducted a research study here. The study examined two key questions regarding steps taken by Malaysian newspapers to enhance the circulation of newspapers and methods to increase the popularity of online newspapers. In addition, the solutions were also examined to determine whether they were tools that created risks or opportunities for the future of the press. Four newspapers were examined in this study, namely, Sinar Harian, Berita Harian, Harian Metro, and Sin Chew Daily, with 11 news and online editors being interviewed. “The findings suggest that major steps to improve the circulation of newspapers include improving the quality of content and newspaper layout, as well as increasing newspaper promotion. The online newspaper is seen as a survival tool for journalism, as it enables journalism to function with its audience.” [
12].
Cowen conducted several interviews in order to gauge the opinion of journalists, information specialists, and new media professionals as to the future path for newspapers. The interview results showed that there is no clear strategy for the future of newspapers on the WWW. However, what became clear was the opinion that newspapers should concentrate on targeting a local audience, facilitating community publishing, and investing in research. All participants stressed that whatever move they make, newspapers must make one and fast [
13].
The Internet has fundamentally transformed the media landscape in Zimbabwe. Technology has spawned new practices, whose impact on the printed newspaper is dialectical. On the one hand, newspapers can assert their presence globally through online editions, thus improving their readership. On the other, the technology portends the demise of the printed newspaper due to competition presented by online editions. This study examined the newspaper reading habits in Zimbabwe to ascertain the impact of the Internet on the printed newspaper [
14].
Picard concluded that trends in the USA indicate that advertising expenditures will plateau and decline in the future, denying newspapers revenue growth that is critically needed for sustainability [
15].
The Scottish press industry is optimistic about its future. The promise offered by online and mobile subscription models, the increasing popularity of tablets as an alternative to print media, and the historical resilience of the print press give hope for the survival of Scotland’s long-established newspaper brands. “Many in the industry think that individual titles could be lost in the process of adaptation to digital, but that this is a natural process and won’t mean the end of the industry. Others believe that there will be consolidation in the market or that some of the London-based newspapers may withdraw their investment from Scottish editions, as in some cases this investment may not deliver the revenue to justify it. The more successful Scottish editions of London titles, though, are most likely to remain in the Scottish market.” [
16].
According to Osepashvili, the usage of multimedia news implies the end of newspapers as traditional media [
17]. Kosovo became the first country in Europe without print media. As the AP reported on World Press Freedom Day, newspapers are no longer being sold in Kosovo as the news outlets have moved to the Internet under the coronavirus pandemic [
18]. The main research objective of the submitted contribution was to identify and quantify key factors of development on the selected print media market in Slovakia for the period 2010–2020.
For individual newspapers, we monitored the volume of their printed as well as sold pieces. As part of their more detailed analysis, we aim to answer the following basic research question:
What were the basic development trends in the selected print media in Slovakia in the period 2010–2020? To better understand the dynamics of the media market, we also answer the following specific research questions:
What are similarities in newspapers production and selling among the selected media?
How the development trends could be utilized for forecasting the future dynamics on media market?
What was the variability in the volume of production and sales of periodical printings and how it could be explained?
Has the decline in periodical press production and sales trendily stabilized?
2. Materials and Methods
The basic statistical information necessary to meet the stated goal was drawn from verified sources published by the Office for Cost Verification periodic press ABC SR. In particular, we followed the daily newspapers—Economic Newspapers, Nový Čas, Daily Plus 1, and SME.
Given the breadth of the media market, these periodicals are only a selection of the most important journals, which in our opinion also appropriately represent the content and qualitative nature of this environment. We briefly confirm this with the following information [
19].
1—HN daily. The periodical has been published since 1 January 1992. The nationwide daily is typologically classified as a newspaper for the general public, with a content focus on economics and politics [
20].
2—Daily Nový Čas (New Time). The periodical has been published since 1 August 1991. A daily with nationwide coverage that is typologically classified as a newspaper for the public [
21].
3—Daily Plus 1. Periodical of the company 7 PLUS, spol. s r. o., has been published since 4 September 2006. A daily with a nationwide scope that is typologically classified as a newspaper for the public, as its content presented as a social daily [
22].
4—SME Journal. The periodical was started by the joint-stock company SUMUS on 14 January 1993. A daily with a nationwide scope that is typologically classified as a newspaper for the public, as its content is focused on domestic and foreign news, analysis and commentary on politics, economics and international relations, cultural information, social life, and sport [
23].
The available data represent only a relatively small segment of the media market in Slovakia. The answers to the above postulated question should be interpreted in view of these limitations. This aspect is frequently presented in the relevant literature [
24].
To obtain qualified responses, it was necessary to statistically process the available data on the scope of production and sales of relevant periodicals for the period 2010–2020 in the form of a time series. Consequently, appropriate econometric models were applied as a tool for their analysis with the possibility of their predictive extrapolations [
25].
For further progress in the statistical analysis of the monitored development, we introduce the symbolics
Ptj for the production volume of the newspaper
j at the time
t, respectively, and
Stj for the volume of sales of the journal
j at the time
t. To verify the nature of the time development, we considered the time series for the whole reference period of 2010–2020. This means, we consider the values
The individual variables reflect the production volume Ptj, or the sales volume Stj of daily newspapers j in monthmonth t. For further considerations, we concentrated on a time series representing the volume of press sales.
As recommended by theory, we continued by verifying their stationary properties. For these purposes, we used the augmented Dickey–Fuller test (ADF test) [
26].
From the graphical presentation (Graph 1), we can deduce the linear decrease in production volume as well as sales volume in the case of all selected newspapers. However, for more detailed knowledge of the time series representing individual newspapers, we used the linear regression function, with the dependent variable
Ptj, and/or
Stj. As an independent variable, we considered the time factor
t. In our case, we approximated this value with the code of the evaluated month. We formally expressed the volume of production and/or sales of newspaper as a function of the time variable
t. The estimated printed volume,
Pj, is given by
where
t is a time factor and
e is a random variable. This formula could also be expressed in the following form:
where
aj is the locating constant and
bj is an indicator of the effect of the unit time change of explanatory variable
t on a dependent variable
Ptj.
By estimating parameters aj as well as bj, we obtained the information for theoretical representation of individual time series through their independent variables t. The suitability of such estimation for forecasting the future volumes of printing and/or selling was reflected by the statistical significance and values of the coefficients aj and bj, as well as by value of the determination index, R2.
After the previous information, it was possible to define the steps for analyzing the statistical data needed for answering the research questions in the following order:
Verification of the stationarity of the time series,
Verification of the development of a decreasing trend of the production and sales of daily newspapers,
Analysis of variability in the development of production and sales of individual daily newspapers,
Analysis of the mutual relationship in the development of production volumes and sales of individual journals,
Confirmation of a stabilized trend development of production volumes and sales of daily newspapers, and
Application of forecasting models for estimating the development of periodical printing and sales in Slovakia.
In addition to the already introduced linear regression Models (1) and (2), we verified the autoregressive nature of the observed time series. For these purposes, we considered the regression model with time-delayed variables. In our case, it meant that we expressed the variable
Ptj using the previous time series members as follows:
where
n is the number of previous time series members,
Ptj-n is the
n-th previous member of the time series, and
e is a random influence on the value of the variable
Ptj.
By then applying the standard procedure of multiple linear regression, we obtained a solution that provides information about the impact of previous time series values on the current value or its last member. By this procedure, we confirmed the validity of both hypotheses and answered research questions 5 and 6.
The application of Model (3) allows us to identify and to quantify the “inertia” impact of the journal sales volume in previous months on the current values of its sales. These findings may be useful for deriving a useful tool for the estimation of the future volumes of sales.
Similar extension and deepening of time series analysis tools is needed, including options for the valid authentication of monthly or quarterly seasonality to time series values. For this purpose, we monitored the impact of individual months or quarters parallelly with the long-term impact of the time factor on the decrease (growth) in the volume of printing and sales of journals. For this purpose, we applied the following model:
where
t represents the time factor (month) and
M1,…, M12 represent months;
Q1,…, Q4 represent the quarters, as explicit input variables; and variable
e represents random impact.
The results of the analysis of time series using the first two approaches are given in the following sections, including more detailed comments.
In seeking the answers to the above research questions, we analyzed the time series observed, their stationarity, and a downward trend in both the production and sales volume of periodical printing. We also focused on the partial variable components and the minimal and maximal changes in their values, and we looked for both quantitative and qualitative factors in these changes.
The results of processing the underlying statistics were then employed as an input for forecasting the development of the currently sold periodicals in Slovakia for the future 60 months. For each journal, we also monitored the critical level of sales volume that would indicate the economic collapse of that newspaper. For our presentation, we set this level at 20% of its baseline production and selling volume.
Data and Results
The data on volumes of printed and sold daily newspapers for period 2010–2020 were analyzed. In
Table 1, we provide an illustrative selection of this data for the initial years.
In Graph 1, we present the development of production volumes and sales of these products for the whole studied period. The detailed statistical analysis is presented in the following sections of this article.
The individual time series were labeled as follows:
HN P Hospodarske noviny Volume of print
HN S Hospodarske noviny Volume of sales
NČ P Daily Nový Čas Volume of print
NČ S Daily Nový Čas Volume of sales
Plus 1 P Daily Plus 1 Volume of print
Plus 1 S Daily Plus 1 Volume of sales
SME P SME Journal Volume of print
SME S SME Journal Volume of sales
For easier interpretation of the characteristics of the monitored time series, we present their graphical representation in
Figure 1. It is evident that the production and sale volumes for all observed periodicals had a time-degressive development over the whole 2010–2020 reference period.
The basic statistical characteristics of the production and sale volume indicators of daily newspapers are set out in
Table 2. In the case of all analyzed dailies, a clear trend of a decrease in printed and sold copies was recorded in the observed period.
The values in last row indicate the concentration (closeness or distance) of the extremal values in printed and sold newspapers.
Given that the dynamics of change in production volumes and sales of periodical printing in Slovakia are on a significantly decreasing trend, it is necessary to indicate and identify, the possible factors of these changes. Having in mind the last technological changes, it is crucial to monitor the internet media market. Based on data on the daily number of users accessing this information source, it is necessary to analyze them carefully and to consider their impact on the market situation of the classical print media.
In
Table 3 below, we provide a brief outline of the characteristics of user approaches to the selected Internet media market. When comparing indicators on the volume of sales of classic newspapers, it is evident that the consequences of the Internet market will become increasingly intense with a stronger and growing impact on classical media.
Due to the lack of complete data on time series of the Internet media market, we cannot analyze its impact on the classical market yet. However, this task will be considered later for verifying the hypothesis about the impact of Internet media on the classical media market after obtaining the necessary database.
In the following sections of this paper, we will present the methodological procedure of the solution considered [
28], the statistical data will be analyzed and processed in more detail so that all previously formulated research questions can be answered, and the following working hypotheses can be confirmed:
Hypothesis (H1). The time development of production and sale of periodic printing in Slovakia in 2010–2021 has the character of a stationary time series.
Hypothesis (H2). The time development of production and sales of periodical press in Slovakia in 2010–2020 has a decreasing trend.
3. Results and Discussion
As a first step before analyzing the time series and their statistical processing, we verified and confirmed their stationariness by means of an ADF test at the significance level of alpha <0.05 for all considered logs. By confirming the stationarity of the time series for all newspapers, we confirmed the validity of the H1 hypothesis, as shown by the below data (
Table 4):
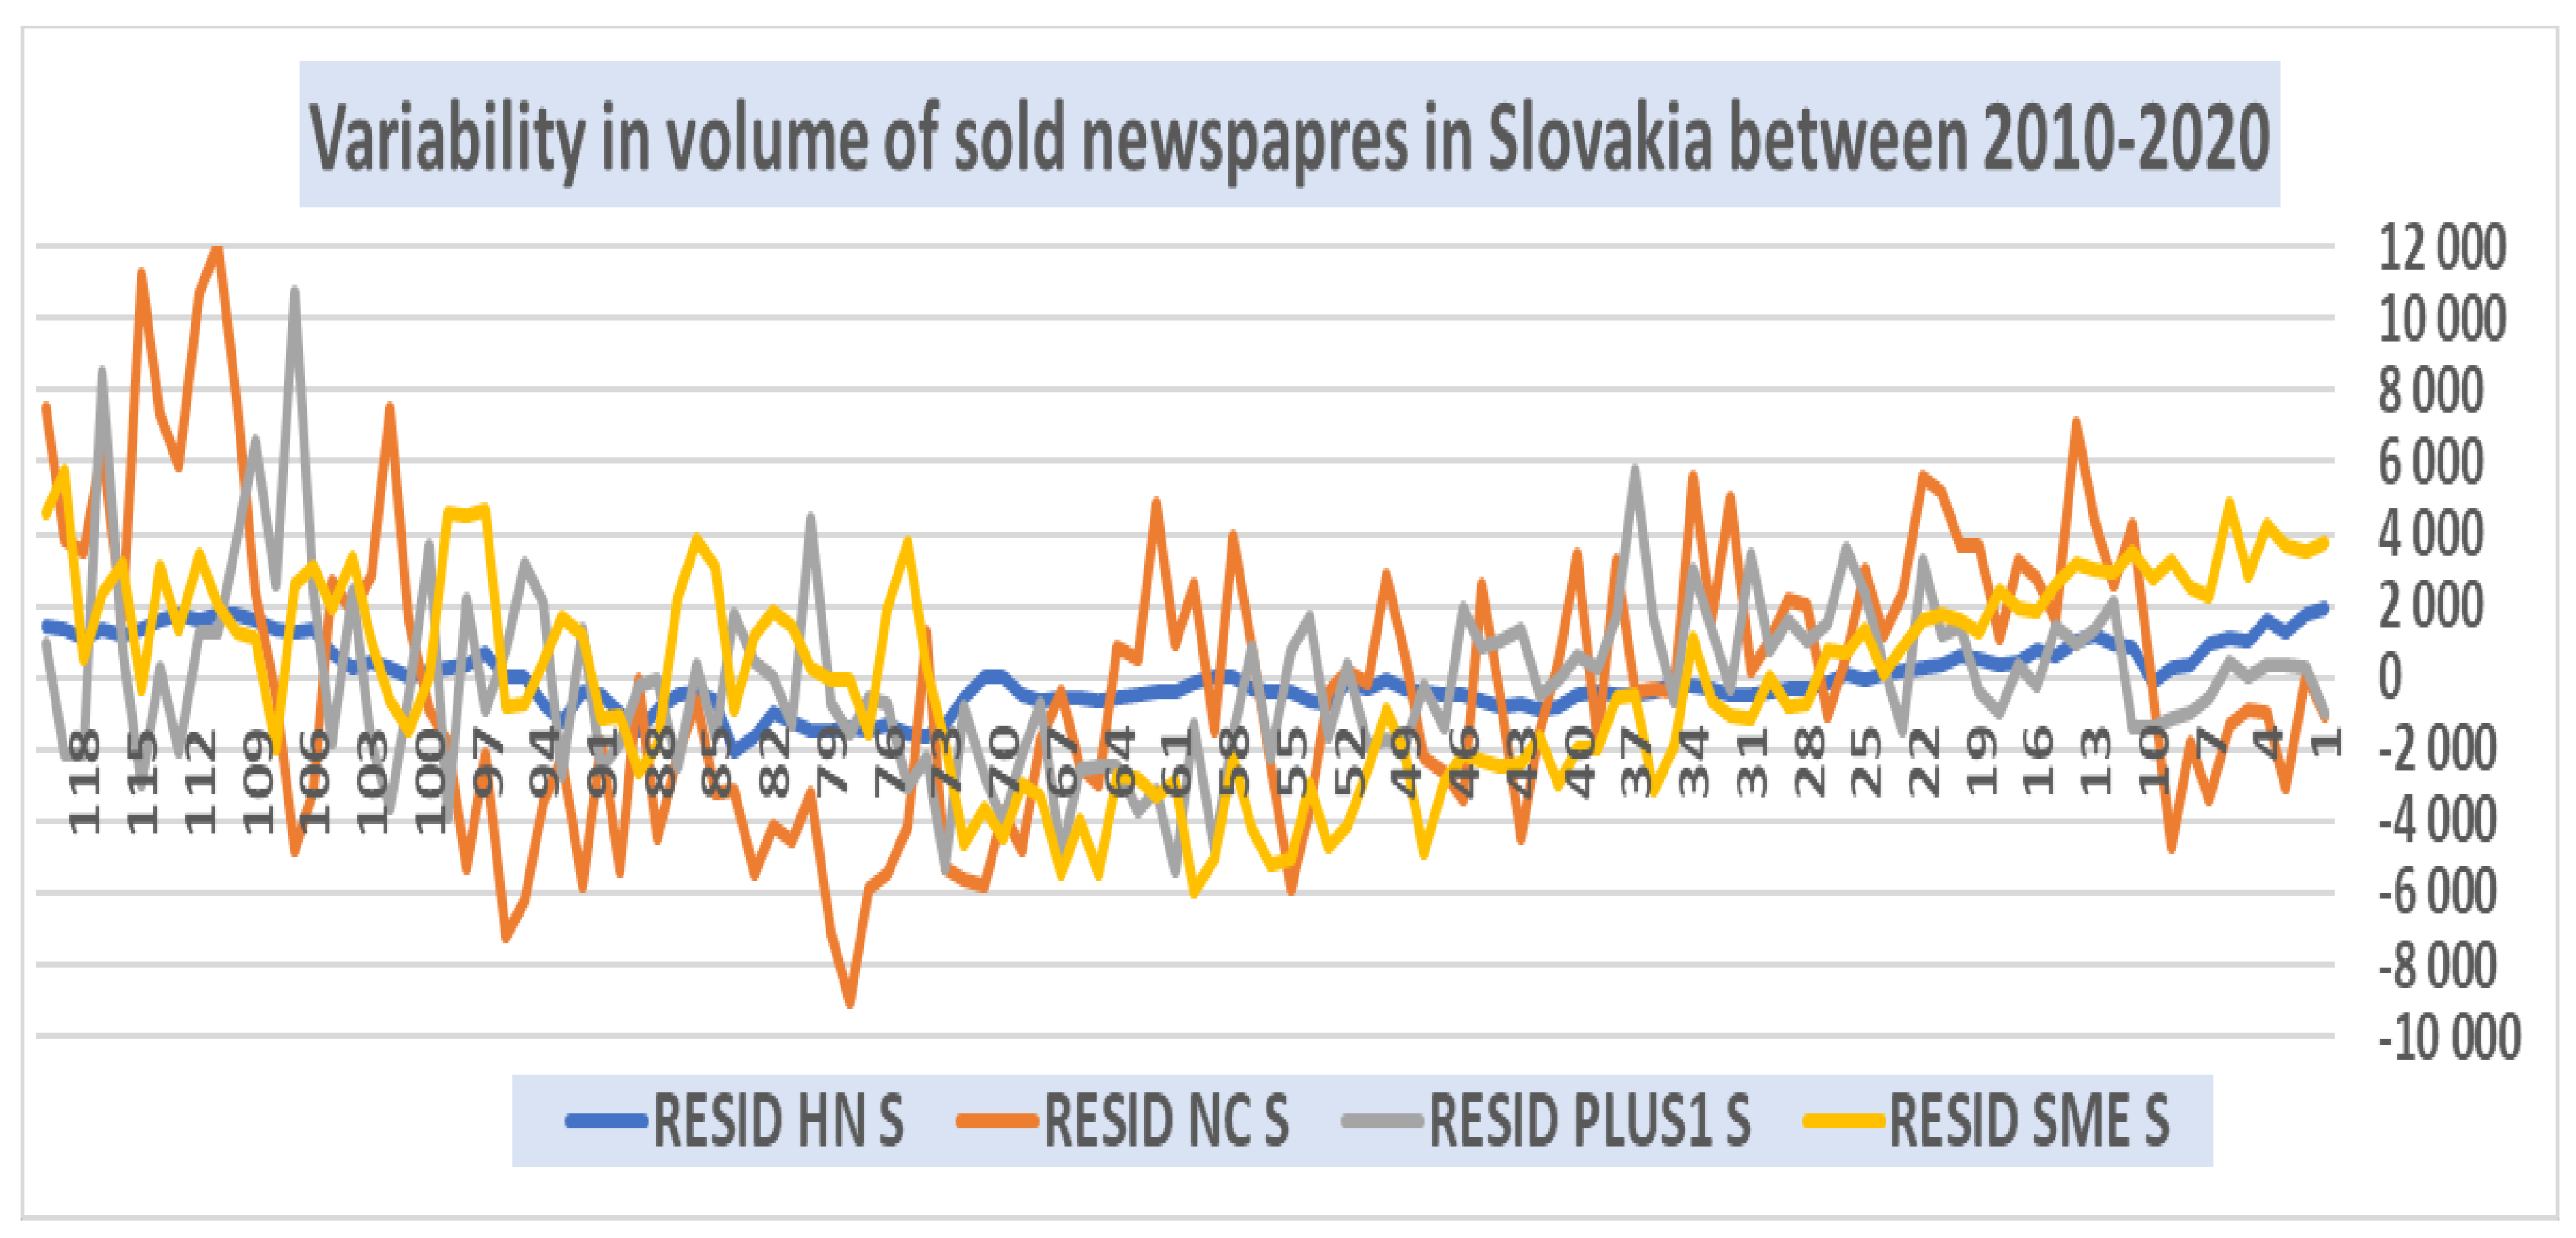
One of the tasks for the assessment of the situation of the media market is to monitor and analyze the development of the number of individual journals printed and sold, including their time variability.
Figure 2 indicates approximately the same nature of changes in the number of daily magazines sold. A slight increase in variability can be identified in recent years, which may be related to the intensive progress of Internet media as a substitute to classical media products.
Other graphical and analytical results, characterizing the development of production volume and sales of individual journals, which we obtained by applying regression Models (2) and (3), are presented and interpreted gradually.
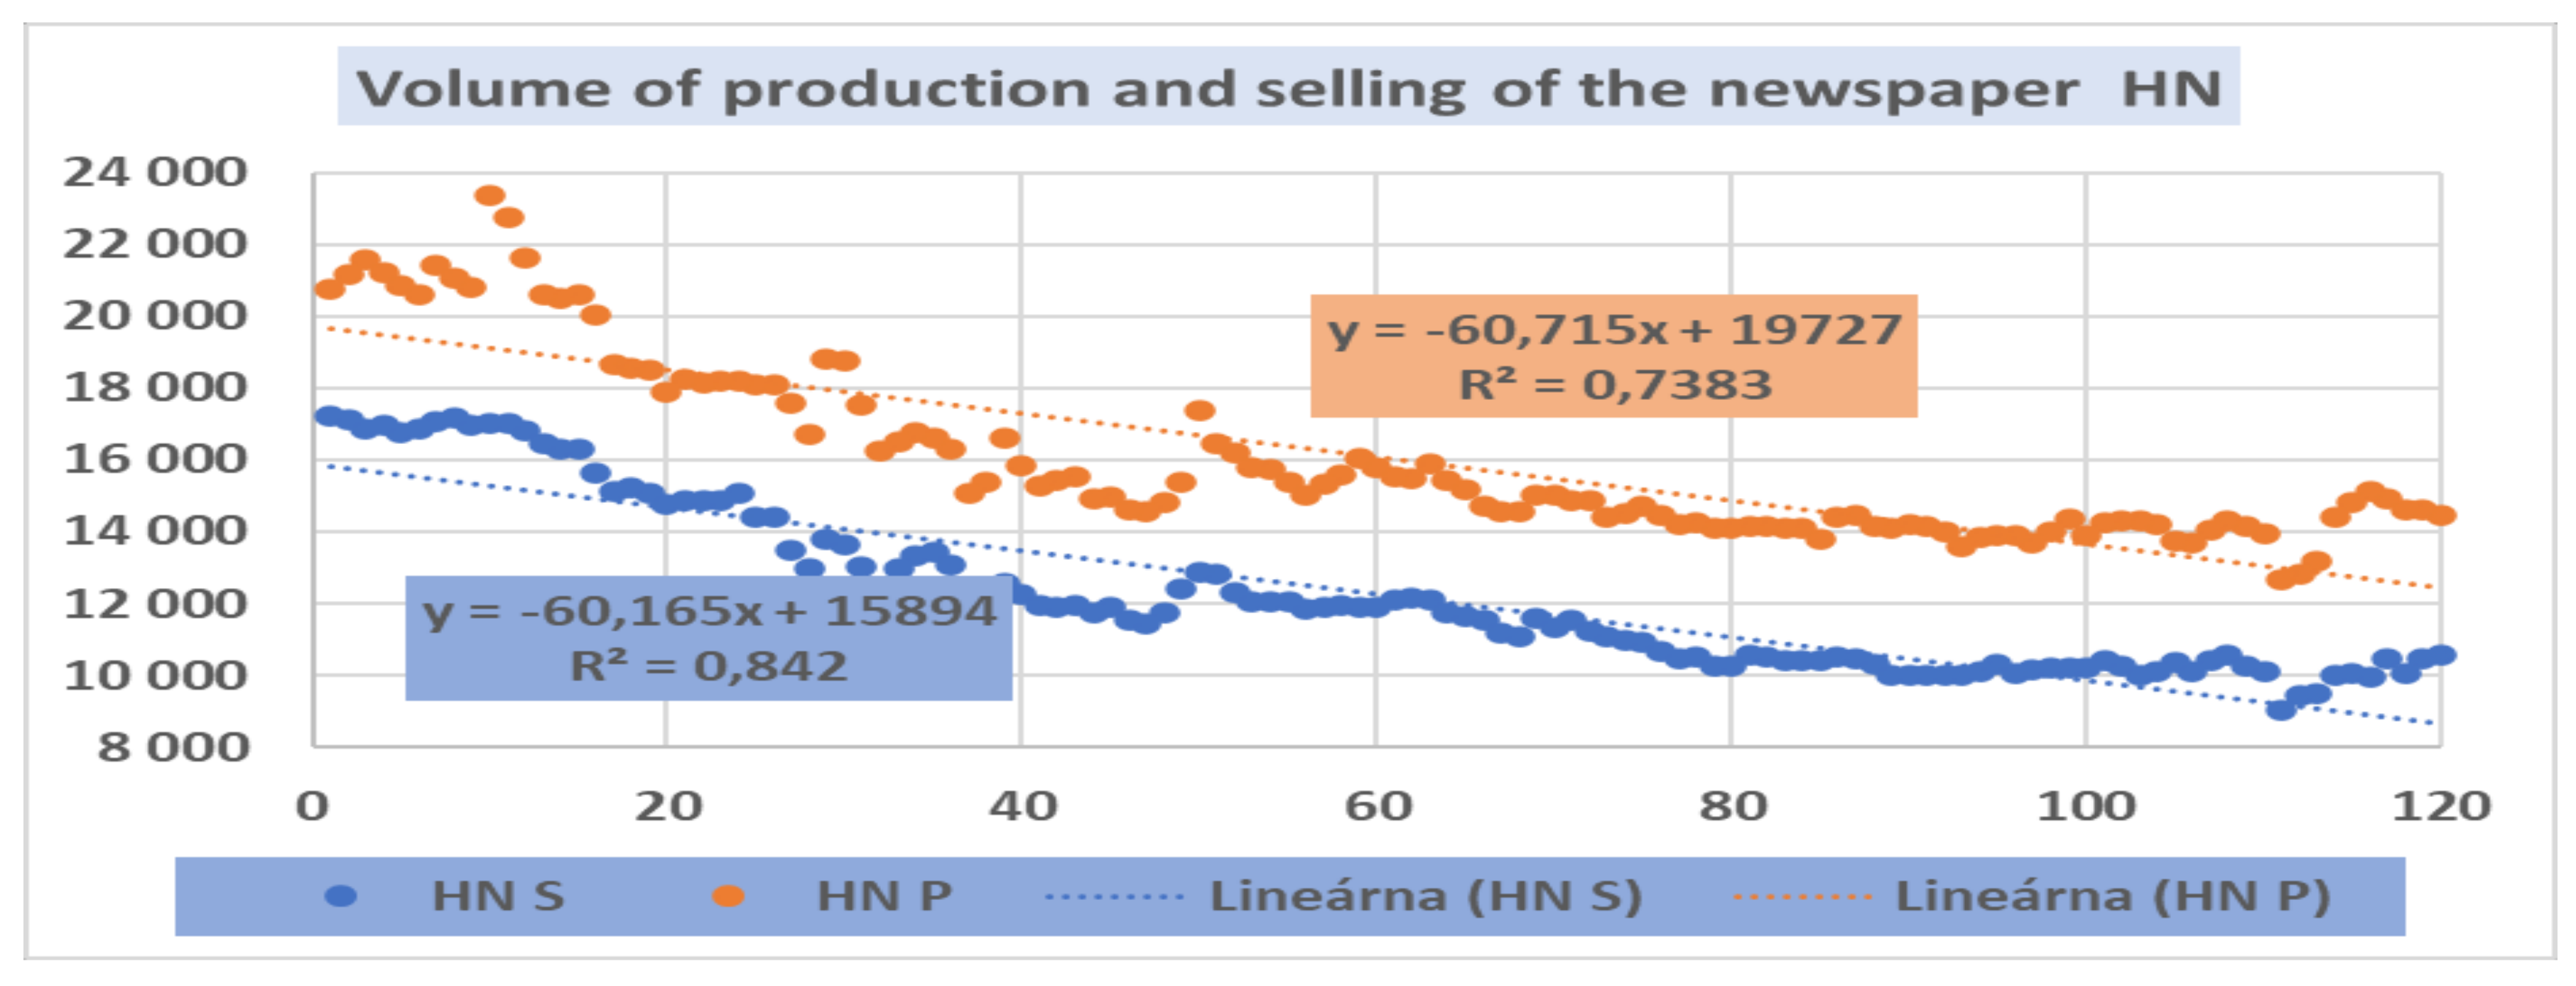
According to
Figure 3, the volume of printing and sales for the journal HN shows a slight but long-term decrease, both in production volume and sales, which we have identified as a reflection of a relatively stable readership background. The regression functions for both production and selling of this newspaper are expressed by following formulas and indicators:
It can be deduced from the data obtained that the changes in production and sales volume were almost identical, as confirmed by the respective regression coefficients b = −60,715 for the decrease in print production and b = −60,165 for the decrease in sales. These values can be interpreted as an average, long-term monthly decrease in print volume, and sales, respectively, of HN.
The relative stability in the volume of sales indicates the long-lasting interest of the permanent readers. It should also be added that the HN journal is a respected economic daily in Slovakia. It is one of the generally trusted printed information sources with a history of qualified readers.
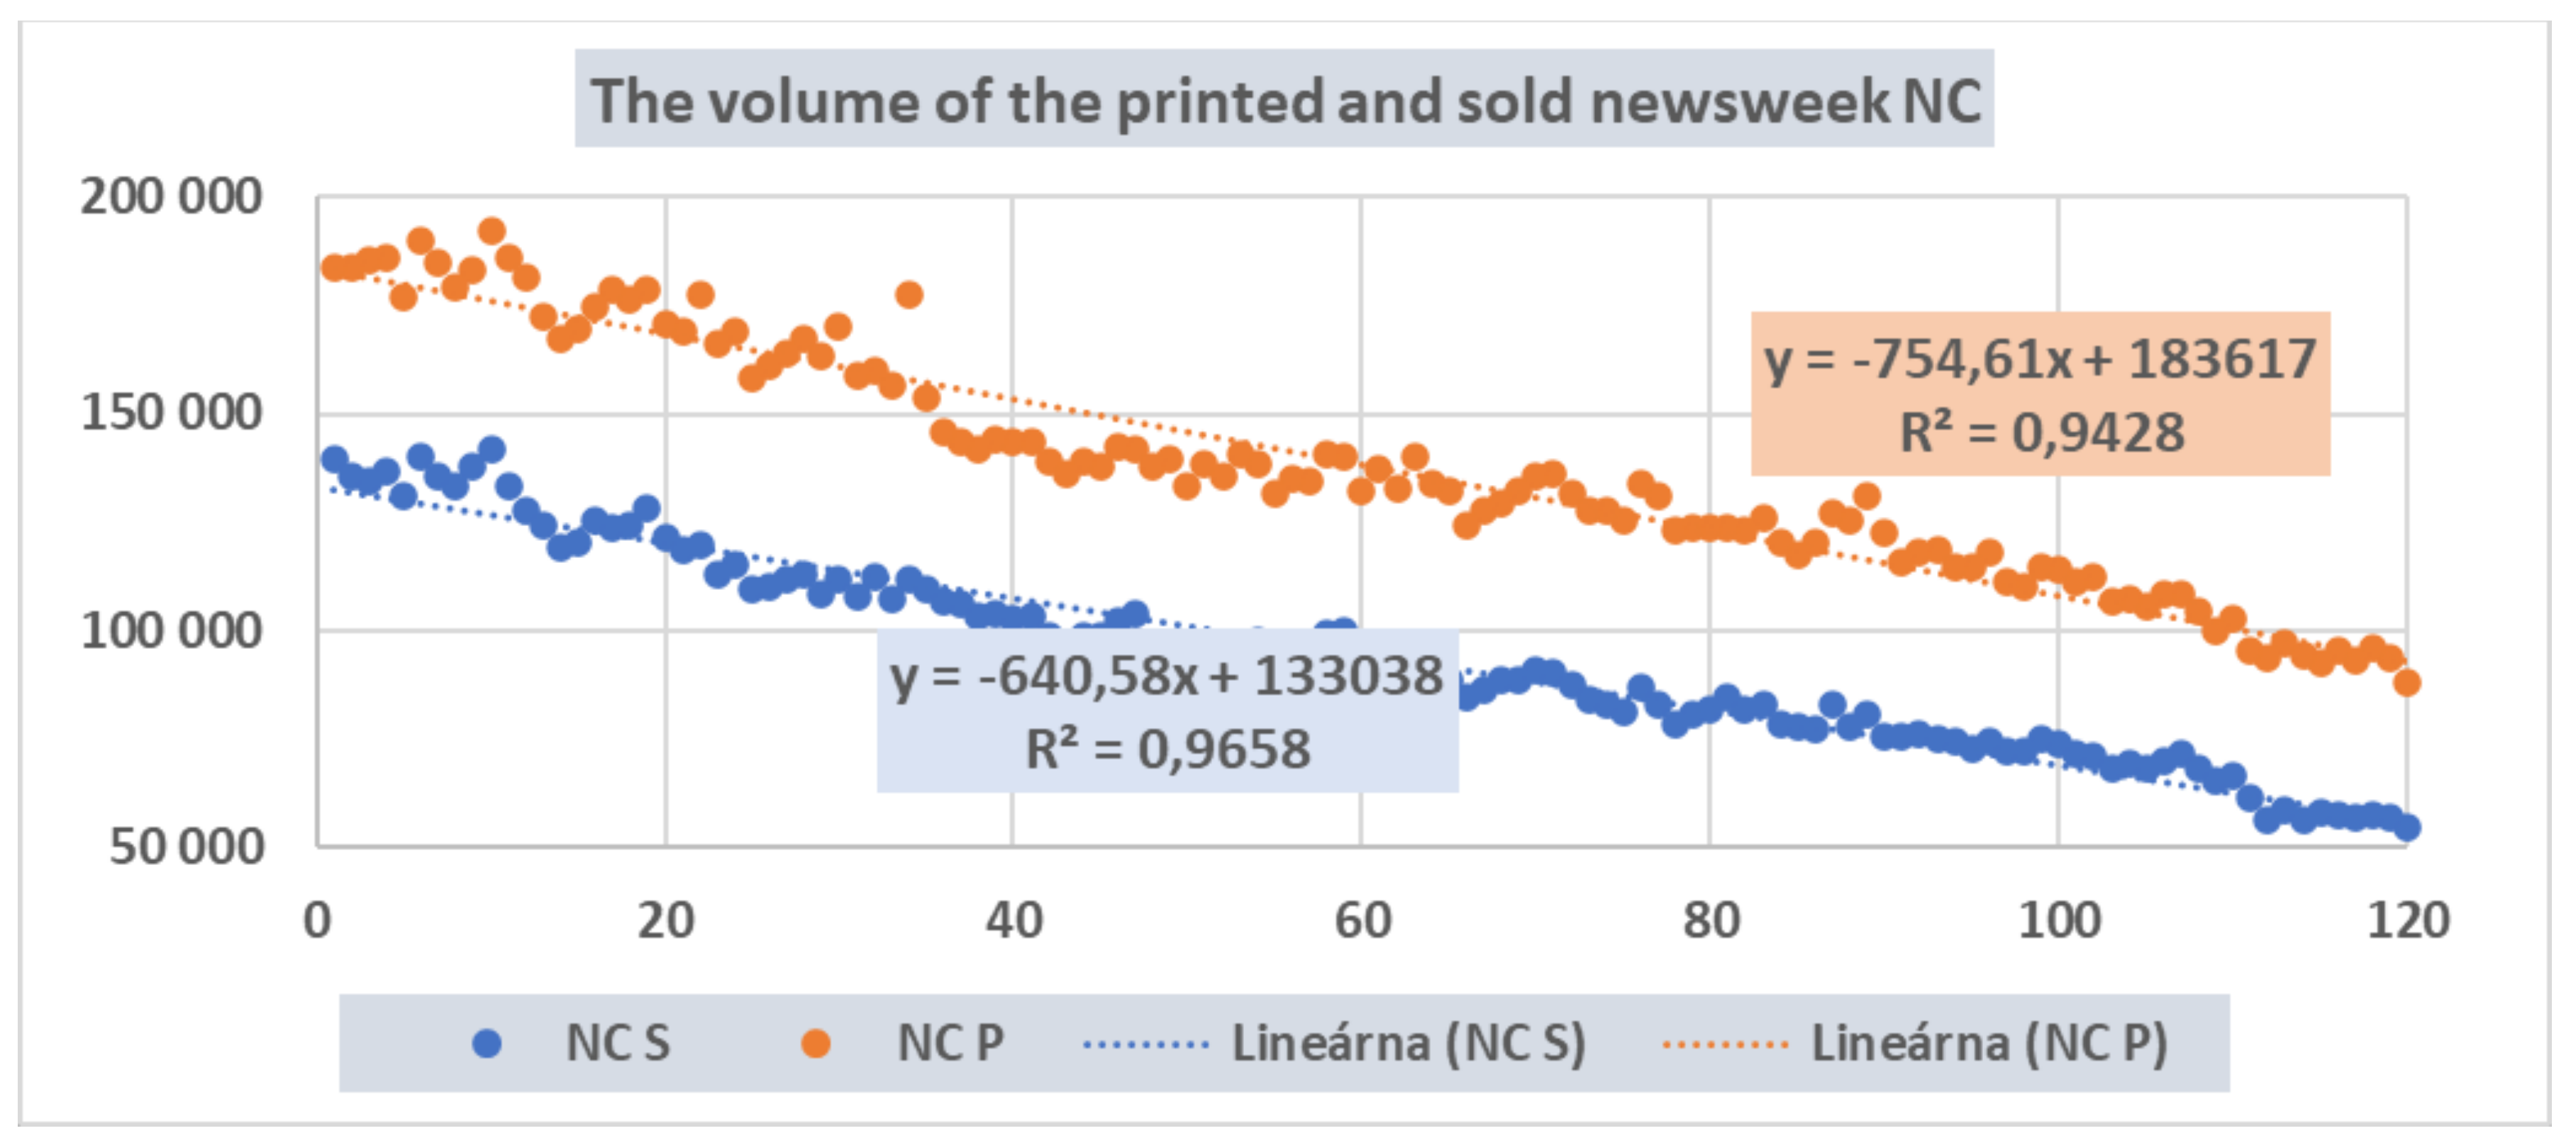
A different interest group of readers is linked with the tabloid type of journal Novy Cas, or NC. A graphical interpretation of the NC time series for its production and sales is shown in
Figure 4. The regression functions for its printed and sold volumes are represented by the following formulas:
Regression models for both the production and sales of the newspaper NC were statistically highly significant, with the R2 = 0.9428 for printed and 0.9658 for sold newspapers.
The long-term average monthly decrease in both groups was, according to the regression coefficients, b = −754 pieces for printed and b = −640 for the number of sold newspapers.
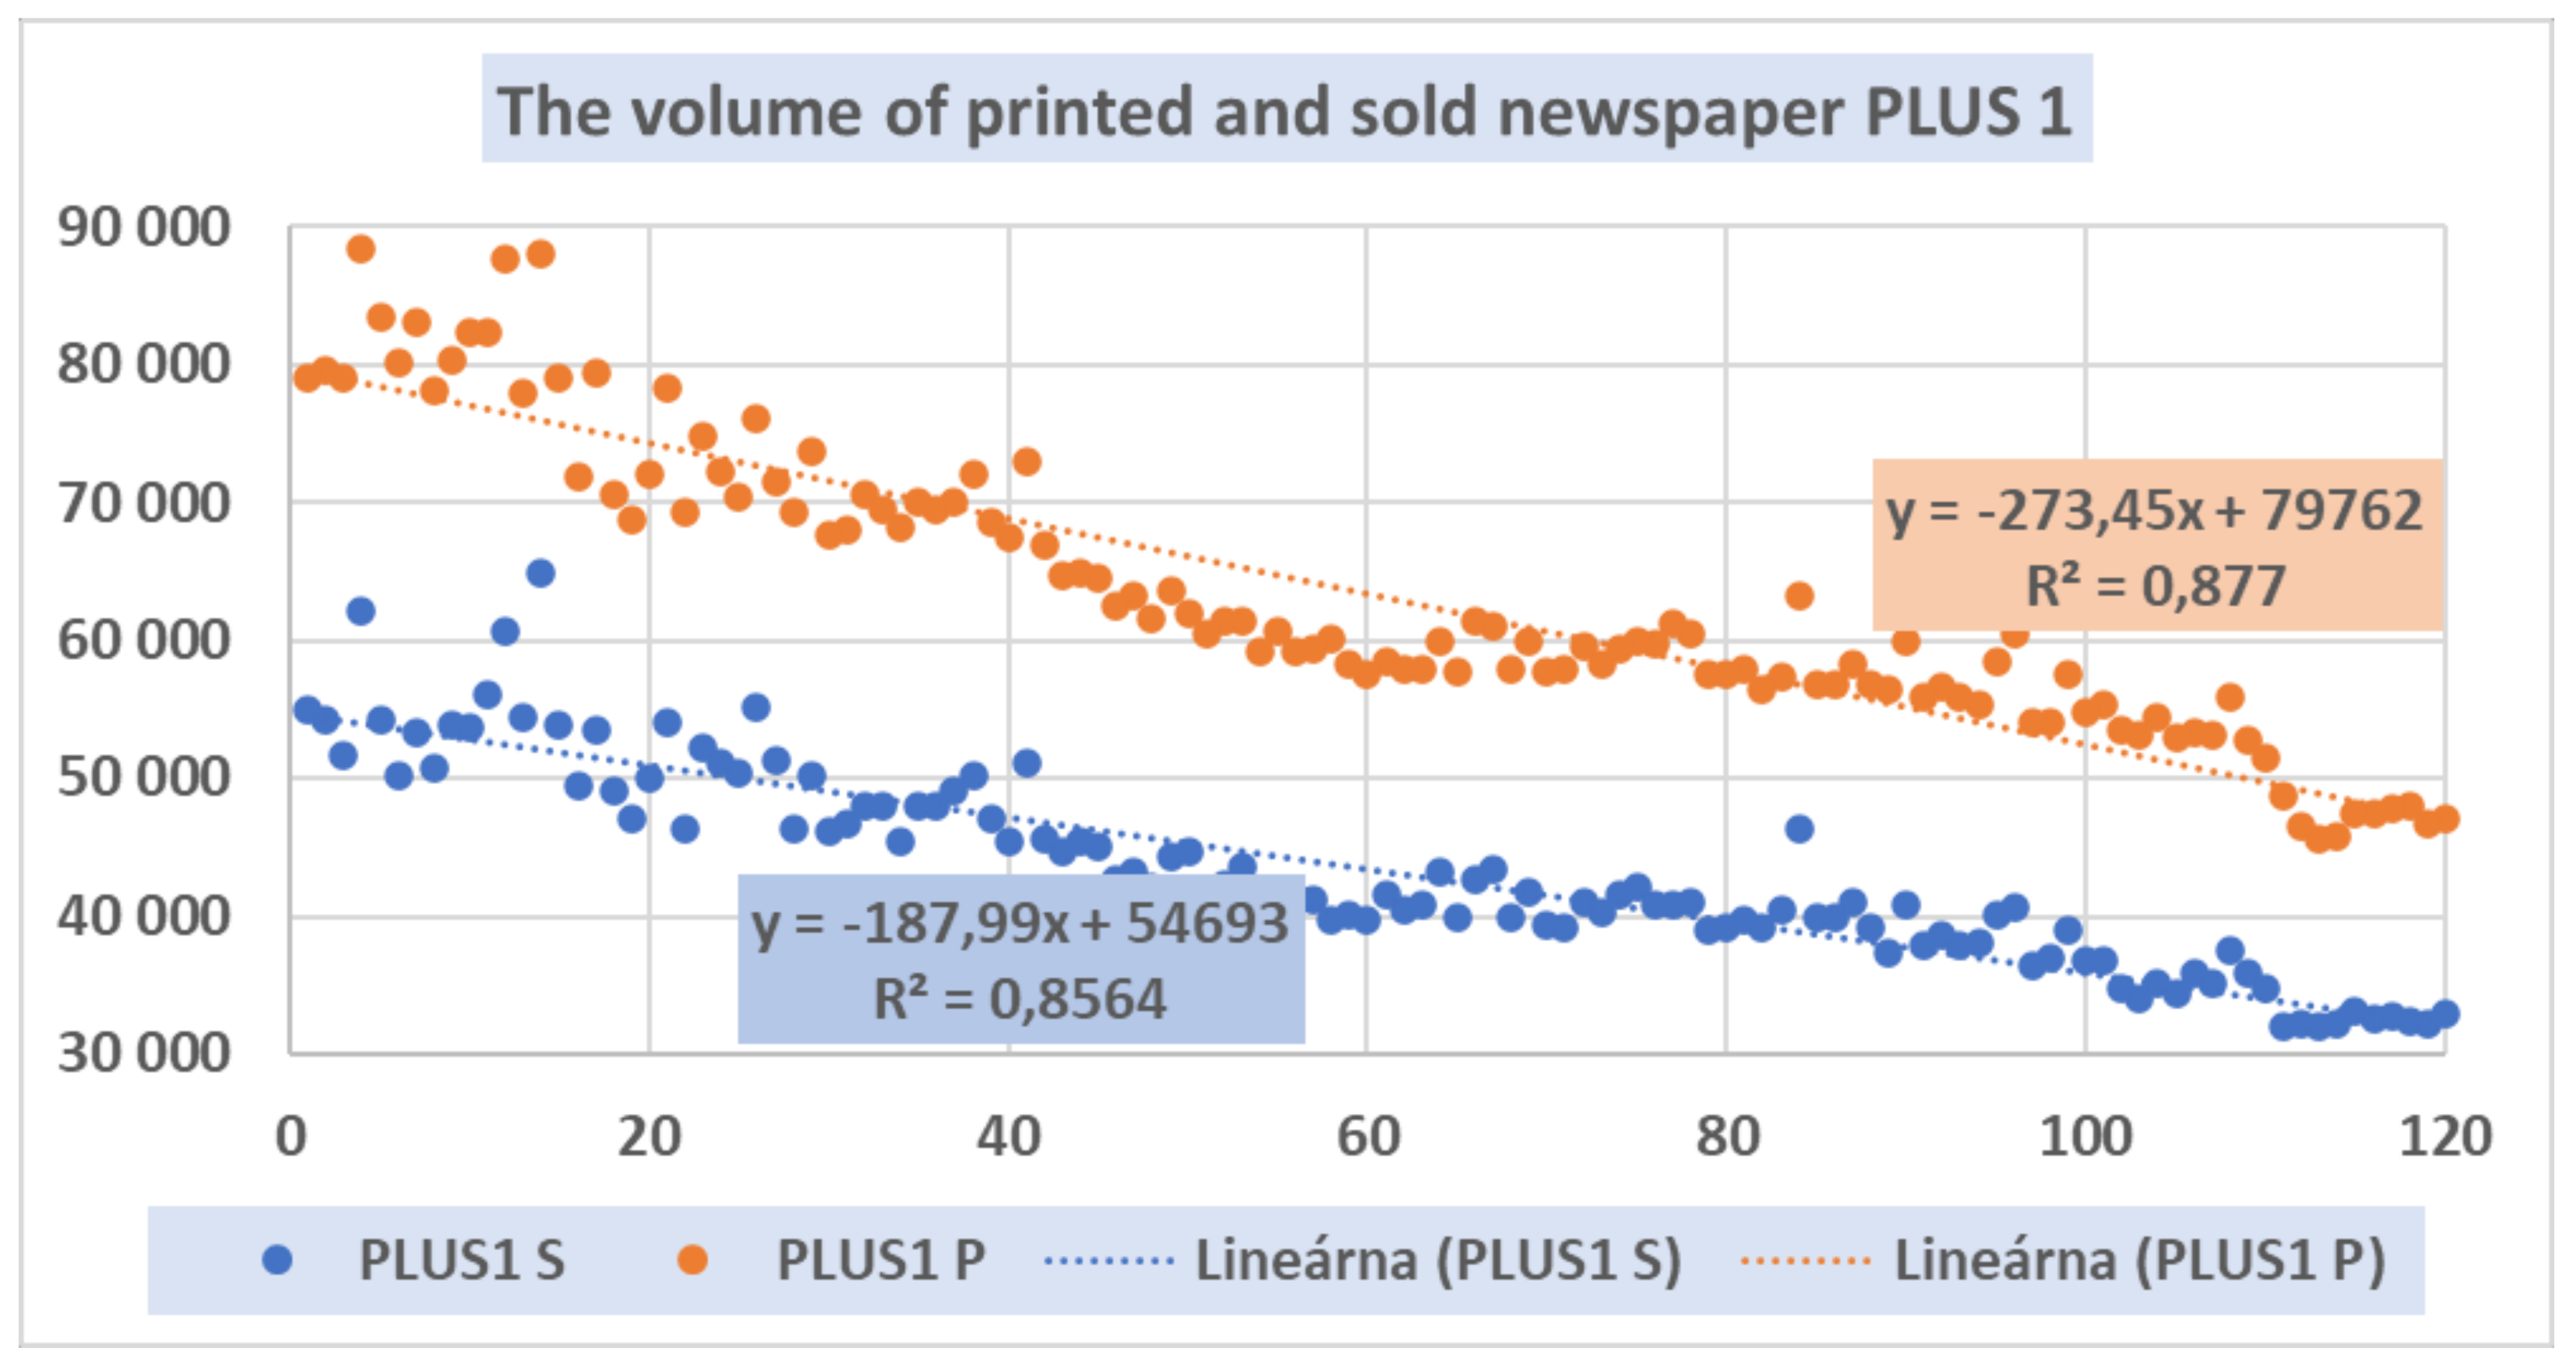
A similar audience reads the Daily Plus 1, abbreviated as Plus 1. Its time series data is presented in
Figure 5.
The regression functions for the printed and sold volumes are presented through the following formulas:
The values R2 = 0.877 for the time series of production of this journal and R2 = 0.8564 for the time series of its selling confirm the statistically high significance of both regression models.
The regression coefficients show a significant monthly decrease for both production and sales of this journal, namely, by 273 pieces in production and by 187 pieces in sales.
The last monitored journal was the SME.
Figure 6 shows the strong decreasing trend in its volumes of printed and sold newspapers, with relatively low variability. Its regression functions for printing and selling volumes were as follows:
According to regression models, the stability of time development for the SME journal was confirmed by the values of the determination indices R2 = 0.9049 for the decrease in production and R2 = 0.9379 for the decrease in its sales.
The regression coefficients b = −359 for production volume and b = −320 for sales volume confirm a long-term trend of decrease in the production and sales of SME journal.
3.1. Summary Analysis of Evolution in the Volume of Newspapers Sold
Using the previous statistical analysis, we obtained the necessary information to answer all research questions as well to confirm the validity of both hypotheses.
According to the numerical regression coefficients, as well as the graphical presentation of the individual time series for development of the production and the sale volumes of journals, all regression coefficients were b < 0, which confirmed the H2 hypothesis regarding the systematically decreasing production and sales of newspapers.
Variability in time series is a typical part of them and reflects the natural development of the monitored process. In the situation, as observed by us, the variability was reflected both in the trend decrease in the volume of journals sold and in the inter-monthly changes in the sales volume of the daily newspaper. When analyzing, we were interested in both components of the time series, with attention required by their extreme values—both in the decrease and in the increase in sales. According to
Table 5, the highest monthly decrease was recorded by the NC newspaper, namely, 9062 pieces. The maximum inter-monthly increase was also recorded by the daily NC with 12,058 newspapers sold. Extreme changes in sales volume deserve a deeper marketing analysis.
In line with the evaluation of the long-term dynamics in an individual time series, it is useful to draw attention to the results provided by the methodology of simple linear regression on inter-monthly changes in the number of copies sold,
Table 6.
According to these data, it was also statistically confirmed that all monitored journals faced a long-term permanent decline in readers. With the highest decline of readers for the NC journal—up to 641 pieces per month.
3.2. Autoregressive Influences on Time Series Dynamics
As another time series analysis tool, we applied Model (3). With its help, we wanted to identify and quantify autoregressive influences on the dynamics of the time series. In the following table, we provide only a brief overview of the results of estimated parameters of time series models for sale volumes indicators of individual newspapers.
According to the data in
Table 7, we can confirm that the time series of individual journals, i.e., the volume of their sales, had its statistical “inertia”. This was confirmed by the fact that current sales of journals were generally influenced by sales results in some previous months. In the case of HN, the “inertia” of the sales volume was confirmed by the effect of the sales volume in previous months, as indicated by the regression coefficients b(T−1) = 0.832 and b(T−4) = 0.134. The current sales volume at the time of T was thus statistically affected by the result of the previous month’s sales (T−1) and the result of sales 4 months ago, i.e., at the time (T−4).
In the case of Daily Plus 1, statistical “inertia” was even “richer” because it was influenced by up to three previous time series members.
It can also be concluded that all the time series studied had a relatively high degree of autoregression, which was confirmed by statistically high evidence values (alpha < 0.05) of the regression coefficients b1, b2, b3, and b4. Equally highly evident were all the R2 determination indices.
3.3. Indicators to Be Recorded and Interpreted
Based on the solution to Model (2), we obtained the regression parameters for individual time series functions representing the sales volume of each journal,
Table 8.
The data in the table express the theoretically estimated starting value of the sales volume of the respective journal, in the month is given a regression coefficient, which reflects the monthly decrease in the sales volume of the respective journal. This indicator should be closely monitored and should give rise to major marketing decisions. The R2 determination index is shown in the last column. Its value reflects the ability of the relevant regression model to express the randomness of fluctuations in the sales volume of the relevant journal. From the statistical characteristics obtained, we estimated the forecast of the evolution of the volume of daily newspapers for the following months and years.
Table 9 gives an estimate of the evolution of the sold newspapers for the future 60 months. At the bottom, you can see the relative decrease in the number of journals sold. The top of the table shows the time intervals at which the number of journals sold falls below the critical value, relative to the baseline. Illustratively, we set this barrier at 20% of sales in the base year.
An important information offered by forecast extrapolation is a time estimate of when the newspaper/journal is likely to collapse at the latest.
4. Conclusions
Based on the above presented and clarified results of the time series analysis on production and sales and daily newspapers in Slovakia, we can conclude that all three methodological procedures for estimating the development of the sold daily press have been applied, and the suitability of their results for our analysis has been confirmed by statistically significant values of R
2, as well as the values of the individual regression coefficient, b (
Table 10).
In view of the research objectives, the research questions and the results achieved, it can be concluded that we have obtained sufficient statistical arguments according to which, the following statements are true:
The time development of production and sale of periodic printing in Slovakia has the character of a stationary time series, which allows their statistical analysis and forecasting applications.
According to the three applied econometric models, the trend decrease in production and sales of periodic printing was confirmed.
The answers to all research questions are presented through the partial outcomes of the regression analysis models (Models (1)–(4)) and their interpretations, which we have systematically drawn attention to.
In view of the above, we consider that the objectives set for the contribution have been met. Based on the results of the statistical research carried out, the following conclusions can be established:
In the years 2011–2020, it can be observed that the production and sales of all Slovak daily newspapers showed a decreasing trend, but by the nature of variability, approximately the same decrease in total as well average daily number of prints was observed. Total average daily number of prints have fallen by 130% in the last 10 years. While in January 2011 the average daily number of prints in the total of all analyzed newspapers (Hospodárske noviny, Nový Čas, Daily Plus 1, and SME) reached 269,383 copies, in December 2020, it was already 116,786 newspapers. If we compare the developments over the last 20 years, this decrease is even higher. While in December 2000 the average daily number of prints of the Hospodárske novony, Nový Čas, and SME daily (the Daily Plus 1 had not yet been published) averaged at 241,584 copies, in December 2020, it was only 83,875 copies.
The main reason for the decline in daily press sales can be factors such as the growing popularity of digital media at the expense of traditional media. As print media sales decline so does readership and advertising. These unfavorable economic conditions for publishing activity are subsequently reflected in the growth of newspaper prices.
If the current downward trend in daily average cost of sale continues, based on a simple linear regression model, it can be assumed that the classic issue of the SME daily will collapse economically after 166 months, the Nový Čas newspaper after 208 months, and the Daily Plus 1 after 291 months. The newspaper that would last longest in its print version is the daily Hospodárske noviny—328 months.
It follows from the above that, in the medium-term forecast of the development of the cost of goods sold, the journals could be published in the classic form, while in the long-term forecast of the development of the volume of sales it is likely that some publishers will be forced to stop traditional print publishing and focus on electronic editions, which they have strongly supported in recent years.
Discussions on the future of journalism center on new economic models, digital modes of distribution, and how to attract young audiences [
29]. Nowadays, the Internet and smart phones turn out to be a new challenge for the print media industry. This phenomenon seems to keep on going. Digitalization challenges print media companies to develop the sustainable economic growth of the company [
30].
Despite the fact that we carried the research in 2011–2020 and obtained the submitted results regarding the daily press market in Slovakia exhaustively within the research study, the research area offers scope for further investigation with the possibility of processing several research topics. A forward-looking topic is the analysis of the development of trends in daily printing using qualitative analysis tools. It will be equally important to match the trends of daily newspapers with the reading of daily newspapers in electronic form and to verify their mutual statistical subdimensions. These findings will allow us to predict much better the structure and volume of shifts in the overall media market.


