Abstract
Different livelihoods have different vulnerability risks and influences on the management of marine protected areas (MPAs). This research aimed to compare the seasonal, trend and shock livelihood vulnerability indicators (LVIs) of three dominant livelihood groups and the groups’ perceptions towards supporting MPA conservation efforts. The Anambas Archipelago MPA was selected as the study site. A total of 66 respondents from the three major groups were selected using stratified random sampling and interviewed using a questionnaire containing 14 LVIs. The responses were standardised and aggregated using functional relationships. The groups’ perceptions were determined using frequency distribution and thematic analyses (NVIVO 10). The LVI composite values showed that fishers were the most vulnerable (0.65), followed by fish farmers (0.62) and ecotourism operators (0.47). Fishers and fish farmers expressed high vulnerability due to their dependency on the coastal resources. The ecotourism operators had low vulnerability due to their lower dependency on natural resources, smaller impacts from seasonal weather, low involvement in resource conflicts and greater political support. The three groups supported the MPA regimes despite differences in their knowledge of the MPA restrictions on their livelihood practices. The study’s findings provide key alternative strategies to address the vulnerability risks of the three major groups and to increase their support for conservation goals in similar MPAs.
1. Introduction
The pressures from vulnerability, such as remoteness, insularity, proneness to natural disaster and competition over limited resources, directly affect the sustainability of a livelihood in small island areas [1]. Such pressures, if not addressed, will lead to changes in resource use patterns, forming a continuous feedback loop that will threaten the sustainability of the island’s environment and its local community groups. Livelihood vulnerability of small island communities is generally overlooked by researchers, despite the growing literature on coastal vulnerability [2]. Studies are usually based on ecological and economic approaches that consider external vulnerability factors, such as climate change or market failure, that influence small island community livelihoods. Research measuring local community risk perception regarding their livelihood vulnerability is rare or non-existent [2,3]. Many vulnerability studies lack an understanding of the ‘subjective vulnerability’ within a diverse local community [4]. Subjective vulnerability relates to the different perceptions of people and their adaptive reaction or resilience to the impact of a particular event [4]. Consequently, poverty programs and vulnerability interventions are too general to address or provide a solution to different scales of vulnerability risk within a diverse local community.
Furthermore, vulnerability studies of small islands commonly consider small-island developing states (SIDs), which were extensively discussed in the literature (e.g., [1,5,6]). The lack of differentiation between the vulnerability characteristics of small islands and SIDs leads to the conception that small islands and SIDs have similar economic and geographical conditions. Therefore, a global approach to measuring the sustainability of SIDs is deemed valid to apply to small island contexts [7]. However, within small island contexts, direct intervention from the central government (vertically) is relatively slow to address vulnerability risk due to remoteness and a weak governmental structure. In contrast, the governmental structure in SIDs is generally within the SIDs, which allows for faster responses to address vulnerability risks. This is in line with Kerr [8], who argued that the strong economic and political autonomy of SIDs enables them to adapt to changing situations faster compared with the weak autonomy of small islands, which depend on the central government.
The vulnerability of protected natural resources has received more attention compared to the livelihood vulnerability that is faced by local communities in MPAs of both developed and developing countries. For example, fishers in the Maldives’ largest MPA [9] and California’s MPAs [10] have likely suffered from the fishing limitations that were imposed by the MPA authorities. Particularly in Indonesia, studies by Ferse et al. [11] and Ferrol-Schulte et al. [12] suggested that increased fisher livelihood vulnerabilities in small island MPAs due to natural resource degradation can be solved through population transmigration to other areas. This suggestion clearly favours the protection of the damaged natural ecosystems over recognising local fisher community rights and their attachment to their place and way of life. This view also fails to recognise the community diversity in which other non-fisher groups might have better adaptation and resilience to vulnerability risks. The generalisation of small island communities as fishers has been loosely used throughout Indonesia [13]. As a result, other community groups, which have different perceptions and stronger adaptability to address vulnerability risks, are dissolved into weaker, but dominant, community groups [4].
Numerous studies regarding the relationship between small island local communities and MPAs in Indonesia (such as [11,14,15]) identified three main types of community groups, i.e., fishers, fish farmers and ecotourism operators, without undermining the importance of other groups. With such clear differentiation, there has not been any research that has attempted to study the specific vulnerability risks that are faced by each of these groups, nor have the groups been compared to one another. There are also no studies explaining the relationship between vulnerability risks and perception of these different community groups when establishing an MPA. This is important to study because MPA establishment has the potential to increase the vulnerability risks of local communities by prohibiting or limiting access to protected resources.
This study aimed to develop and compare the socially constructed livelihood vulnerability indicators (LVIs) of three different community groups and their influence on the community groups that do or do not support the MPA establishment. The socially constructed LVIs that were used here were based on a definition of vulnerability risks by Dolan and Walker [2] and Kelly and Adger [16], where individual or community perceptions construct the condition of vulnerability instead of the pressure from physical events. For this purpose, vulnerability was defined as the capacity of individuals or social groups to respond to, cope with, recover from and adapt to external stress on their livelihoods and well-being [2,16]. Besides the importance of unravelling the vulnerability risks from local community perceptions, the socially constructed LVIs were used here because hard data from assessing vulnerability risks in small islands in Indonesia are largely unavailable. This has been a challenge for many researchers who conduct vulnerability assessments in developing countries [17]. In addition, this study also intended to provide a useful tool to examine the root causes of vulnerability based on the perception of different community groups in small island MPAs. Birkmann [18] pointed out the need to study vulnerability risks at the local community level to balance the more common global study of vulnerability. In doing so, policy and intervention programs from the government, and other institutions, could be efficiently and effectively directed to manage vulnerability risks at a finer level, namely, the community level.
2. Materials and Methods
2.1. Study Area
The Anambas Archipelago MPA is a district comprising a cluster of small islands situated in the southern South China Sea, between 2°10′0”–3°40′0” N and 105°15′0”–106°45′0” E. It is one of the sea frontier areas of Indonesia and shares its borders with the Vietnam exclusive economic zone (EEZ) lines in the north and the Malaysia EEZ lines in the west and east. It is closer to Malaysian (201 km) or Singaporean territorial land (215 km) than its provincial capital city (Riau Province, 320 km). Survey and interview activities were carried out in 15 villages of the seven sub-districts to cover the possible variability of the population within the Anambas archipelago (Figure 1). The surveyed villages were selected to represent the five main/important islands (Siantan, Jemaja, Telaga, Kiabu and Matak Islands) in the Anambas Archipelago, the main settlement of populations and the sub-district administrative boundary. Figure 1 and the locations of surveyed villages were created using ArcGIS ver.10. Fieldwork was carried out over four months, including the preparation and survey activities, from July to November 2014.
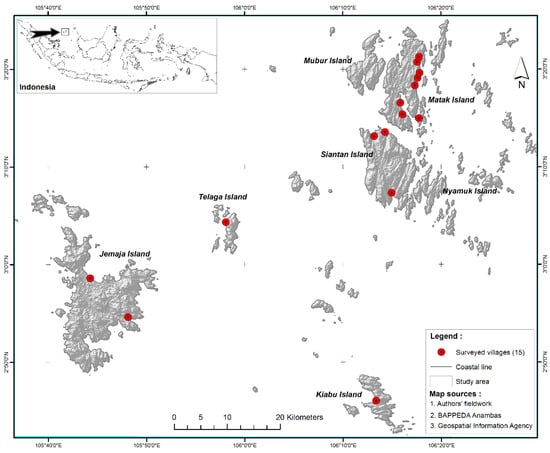
Figure 1.
Location of study sites (villages) in the Anambas MPA.
2.2. Questionnaire Design
This research used the perceptions of community groups to measure their livelihood vulnerability risks and their levels of support for the establishment of the MPA in their area. For such purposes, predetermined LVIs, which were based on the sustainable livelihood approach (SLA), following Scoones, I. [19], Department for International Development [20] and Ellis, F. [21], were embedded into the questionnaire. The LVIs were used to measure the tangible perceptions of fishers, fish farmers and ecotourism operators in Anambas MPA regarding the influence of vulnerability risks to their livelihoods. The LVIs with similar characteristics were grouped into categories of seasonal, trend and shock [20,22] (Table 1). A set of questions was also developed to address the perception of community groups regarding the establishment of the Anambas MPA, including the knowledge, level of support and perceived benefits (Supplementary Material).

Table 1.
LVIs used in the study.
All questions that measured livelihood vulnerability risks used a 5-point Likert scale response, ranging from 1 (not important) to 5 (very important). All questions that were designed to capture the perceptions of local community groups to the establishment of the Anambas MPA used a 3-point Likert scale response: 1 (disagree), 2 (neutral) and 3 (agree).
2.3. Data Collection
Primary data (quantitative and qualitative) were collected from direct face-to-face interviews with respondents, whilst secondary data were collected from published and online literature. The respondents totaled 66 individuals, consisting of 43 fishers, 18 fish farmers and 5 ecotourism operators (Table 2). Stratified random sampling with proportional allocation was used to select respondents and to address the uneven sample number from household groups. The respondents from the household groups were selected if they were categorised as small-scale. The concept of small-scale could vary from artisanal, local, traditional and small to subsistence, and each region or country had its own definition of each term [23]. In order to maintain consistency in the data collection, the characteristics of respondents from each small-scale household group followed the Indonesian Law No. 50/2015 regarding the empowerment of small-scale fishers and fish farmers. The law defines a small-scale fisher as an individual who owns or operates a boat with less than 5 gross tonnage to catch fish as their main livelihood to meet their daily needs; a small-scale fish farmer is an individual who cultures marine finfish as their main livelihood to meet their daily needs. Additional characteristics of small-scale fish farmers were used based on [24], where the number of net cages owned was less than 15 pens and in terms of the minimal production input (i.e., uses locally caught trash fish, low stocking density, no contract labour). The selection of respondents of small-scale ecotourism operator (hereafter called ecotourism or ecotourism operator) was based on Law No. 10/2019 regarding tourism [25,26]. All respondents from ecotourism operator households were the local owners of micro- and small-scale tourism businesses that operated in Anambas tourism areas, such as small restaurants, homestays, traders and traditional tourism boat operators. Human ethics approval was acquired from the UNSW Human Research Ethics Committee (approval number #HC14191) prior to the fieldwork and was considered ‘low impact’ research on human subjects.
Table 2.
Distribution of respondents based on Anambas sub-districts.
2.4. Data Analysis
2.4.1. LVI Index Values
The LVI dataset that was collected from the interviews used Likert scale data with different scale units; thus, data normalisation into a common unit was required. The Likert scale data were transformed into index values using a simple linear transformation (Equations (1) and (2)), following the method suggested by Erenstein et al. [27], Jones & Andrey [28] and Ranganathan et al. [29]. This standardisation produced values from 0–1 for all LVIs, maintaining a similar spread and equal weighting [27]. This normalisation was valid, as Likert scale data can be interpreted at a subscale, such as using indexes and aggregated to acquire a composite value [30] (Equation (3)).
The following equations (Equations (1) and (2)) are the mathematical expressions that were used to transform the original Likert scale data to an index value. Equation (1) was used when higher values of original data corresponded to higher index values (increased functional relationship). Equation (2) was used when higher values of original data corresponded to lower index values (decreased functional relationship).
where LVIijx is the LVI index value of the respondent’s response i in indicator j of group x; Xijx is the real value of respondent response i in indicator j of group x; Min(Xijx) is the minimum real value of respondent’s response in indicator j of group x; Max(Xijx) is the maximum real value of respondent’s response in indicator j of group x. (Note: i = 1, 2, 3, ..., i; 0 < LVIijx < 1).
The index composite value for each indicator was computed using Equation (3):
where LVIjx is the LVI index value of indicator j of group x and njx is the number of respondents for indicator j of group x.
The classification of vulnerability has been debated in the literature due to the fuzziness between points of the scale and, thus, it varies greatly between scholars [31]. For example, different scales are commonly used in the literature, such as a 3-point scale by Eakin and Bojórquez-Tapia [31] or a 5-point scale by Hahn et al. [32]. This study used a 5-point scale to determine the LVI index values to maintain the consistency of the original data transformation, which ranged from 0 (least vulnerable) to 1 (most vulnerable).
2.4.2. Local Community’s Perception towards the Anambas MPA Establishment
Frequency distribution analysis was used to analyse the different perceptions of local groups (fisher, fish farmer and ecotourism operators) regarding the establishment of the Anambas MPA. Following a data-driven inductive approach that was suggested by Boyatzis [33] and Fereday and Muir-Cochrane [34], thematic analyses were used for qualitative data from an open-ended questionnaire of the perception of local community groups to the establishment of the Anambas MPA. This qualitative analysis was used to determine possible links between the vulnerability risks and the perception of local groups regarding the designation of the Anambas area as an MPA, as well assess as their support for the Anambas MPA conservation efforts. NVIVO 10 for Windows was used to create a consistent theme categorisation system based on the perceptions of local community groups regarding the MPA establishment. After the coding was finalised, a matrix coding comparison was used to compare the perceptions of the three local groups based on the created themes and nodes. This qualitative analysis served as a triangulation method to confirm the results of the quantitative analysis that was performed previously.
3. Results
3.1. Livelihood Vulnerability of Anambas Local Community Groups
3.1.1. Seasonality (Cycles)
In terms of the seasonality risks, 73% of fishers agreed that seasonal climate was very influential, compared with 50% of fish farmers and 60% of ecotourism respondents. The percentage was confirmed with the highest seasonal climate LVI index value being scored by fisher households, which was categorised as highly vulnerable. Fish farmers and ecotourism operators were categorised as moderately vulnerable, as seasonal climatic conditions had less influence on their daily livelihood activities (Table 3).
Table 3.
Comparison of seasonal LVI index values for three different household groups.
Daily weather also posed a higher vulnerability risk to fishers compared to fish farmers and ecotourism households. However, the level of vulnerability risk that was caused by daily weather changes was not as severe as seasonal weather and was consistently categorised as moderately vulnerable across the household groups. The lower risk of severe daily weather was depicted in a relatively low percentage of respondents from each group (<25%) who thought that the risk was very influential to their livelihood. All respondents from the three groups agreed that the effect of heavy rain diminishes in a few days compared with the effect of the southern monsoon season that brings strong winds and can last at least 3 months.
In terms of market seasonality, the three household groups had relatively similar vulnerability risks, with all of them falling into the moderately vulnerable category. Despite this, the fish farmer households had the highest LVI index values compared with the fisher and ecotourism households (Table 3). Corresponding to the LVI index values, 44% of fish farmer respondents stated that market seasonality was very influential compared with 40% of the ecotourism and 23% of the fisher households.
3.1.2. Trends
Among the group trend indicators, fishers expressed the most vulnerability regarding increased costs of food and health services, as well as biodiversity loss, whereas fish farmers commented on three environmental-related factors (pollution increase, ecosystem health and climate change) and one economic-related indicator (parts price increase). The ecotourism operators felt that a fuel price increase was the highest vulnerability risk to their livelihood (Table 4).
Table 4.
Comparison of the trend LVI index values for three different household groups.
In total, 47% of the respondents from the fishers group expressed that they were very concerned with the consistent year-by-year price increase of main food items, such as rice, cooking oil, eggs and meat. In contrast, only 40% of ecotourism operators and 28% of fish farmers were concerned about these price increases. However, the LVI index values for the fisher, fish farmer and ecotourism households were similar and categorised as moderately vulnerable.
Ecotourism households scored the highest LVI index values for fuel price increase compared to fishers and fish farmers (Table 4). Up to 80% of ecotourism households expressed that the fuel price hike has reduced the number of local and foreign tourists visiting the tourism sites. Fishers (63%) also stated that the fuel price increase contributed strongly to the cost of production (catching fish and transportation). However, significant fuel discounts for fishers, as part of a national policy for sustaining fisheries activity, forced the potential vulnerability risk of the fuel price increase downwards [35]. Fish farmers had less dependency on fuel which could be correlated to the lowest LVI index value, with 44% of respondents stating that the fuel price hike had a moderate influence on their livelihood.
The three household groups had similar attitudes towards the influence of price increases of machinery spare parts and materials on their livelihood activities. The LVI index values among the groups were similar and classified as moderately vulnerable. The slightly higher LVI index values for fish farmers may have been due to their livelihood being highly dependant on materials. The LVI index values for fisher and ecotourism households were lower, as both groups seldom experienced broken machinery or price increases. Nevertheless, only 28% of fish farmers and 26% of fishers stated that price increases in machinery parts were very influential to their livelihood compared to 40% of ecotourism respondents.
Only a small percentage of respondents from the three household groups (15%) expressed that the health service was very important in influencing their livelihood. The very low LVI index values of the three groups (low vulnerability) confirmed the relatively low vulnerability that was associated with increased health service prices (Table 4). Free healthcare provided by the Anambas Government changed the perception of the groups despite the poor quality of the public clinic service.
Of the three groups, fish farmer households exhibited the strongest response to the effect of water pollution on their livelihood, followed by fisher and ecotourism households (Table 4). For this indicator, 50% of the fish farmer respondents expressed that increased water pollution exerted a high vulnerability risk on their livelihood activities compared with only 23% of fisher and 20% of ecotourism respondents.
Fisher and fish farmer households both expressed that biodiversity degradation posed a high vulnerability risk to their livelihood compared with ecotourism (which depended mostly on non-extractive activities). Fish farmers were the most vulnerable for this indicator, followed by fisher and ecotourism households (Table 4). This high risk was also translated to more than 84% of fishers and 94% of fish farmers, who said that biodiversity degradation was very influential to their livelihood, compared with only 20% of ecotourism respondents. The very high LVI index values of both fish farmer and fisher groups (most vulnerable) stemmed from concerns such as the illegal operation of trawl nets and the scarcity of fish seeds and fish stocks. A common vulnerability risk that was shared by the three groups was the increased degradation of coral reef systems around their island due to cyanide and unfriendly fishing practices.
The term ‘climate change’ was unfamiliar to all respondents and had to be explained in great detail; the local signs of climate change included prolonged drought or wet seasons, unnatural local temperature variations or possible local sea-level rise. All respondents unanimously indicated the threat of climate change to their livelihood was very low. The indication was confirmed by the low LVI index values for all groups (least vulnerable) (Table 4) and the low average percentage (<7.9%) of respondents who stated that climate change was very influential. All groups perceived that the mentioned signs were absent in their area.
3.1.3. Shocks
The overall shock composite index values showed that both fisher and fish farmer households had a higher vulnerability (most vulnerable) than ecotourism (moderately vulnerable). Among the shock indicators, fishers were constantly classified as the most vulnerable group, except for the local political change indicator (Table 5). Sudden bad weather posed high vulnerability to fishers and ecotourism operators, with similar LVI index values (highly vulnerable), compared with fish farmers (moderately vulnerable). In total, 70% of fisher and 80% of ecotourism respondents reported that bad weather could prevent them from carrying out their livelihood activities. In contrast, only 33% of fish farmer respondents reported that bad weather could prevent them from conducting their occupation.
Table 5.
Comparison of shock LVI index values for three different household groups.
In terms of local political change, fish farmers expressed higher vulnerability compared with fishers and ecotourism operators (Table 5). A total of 61% of fish farmer households expressed that political change seldom benefits them because local candidates always target fisher households, the dominant population, in their political agenda. Despite being the least dominant population, ecotourism households expressed that change in the local political leader brings more changes to the development of community-based tourism in the Anambas MPA.
Both fishers and fish farmers expressed a higher vulnerability risk to their livelihood due to the establishment of the Anambas MPA due to access restrictions and imposed MPA regulations. On the other hand, ecotourism operators considered that the MPA regulations and objectives did not increase their vulnerability; the regulations benefited their livelihood due to the conservation of environmental resources. Conflict regarding resource use, particularly with illegal fishers operating in Anambas MPA waters, was a bigger influence on LVI index values for fish farmers and fishers (high vulnerability) compared with those in ecotourism (low vulnerability) (Table 5). Both fishers and fish farmers consistently faced conflict with non-local and foreign fishers (mostly illegal). Ecotourism households seldom experienced conflict over resources, except land disputes in tourism sites. The ecotourism households had difficulty getting leasing permission from landowners who controlled the already limited land in the Anambas MPA.
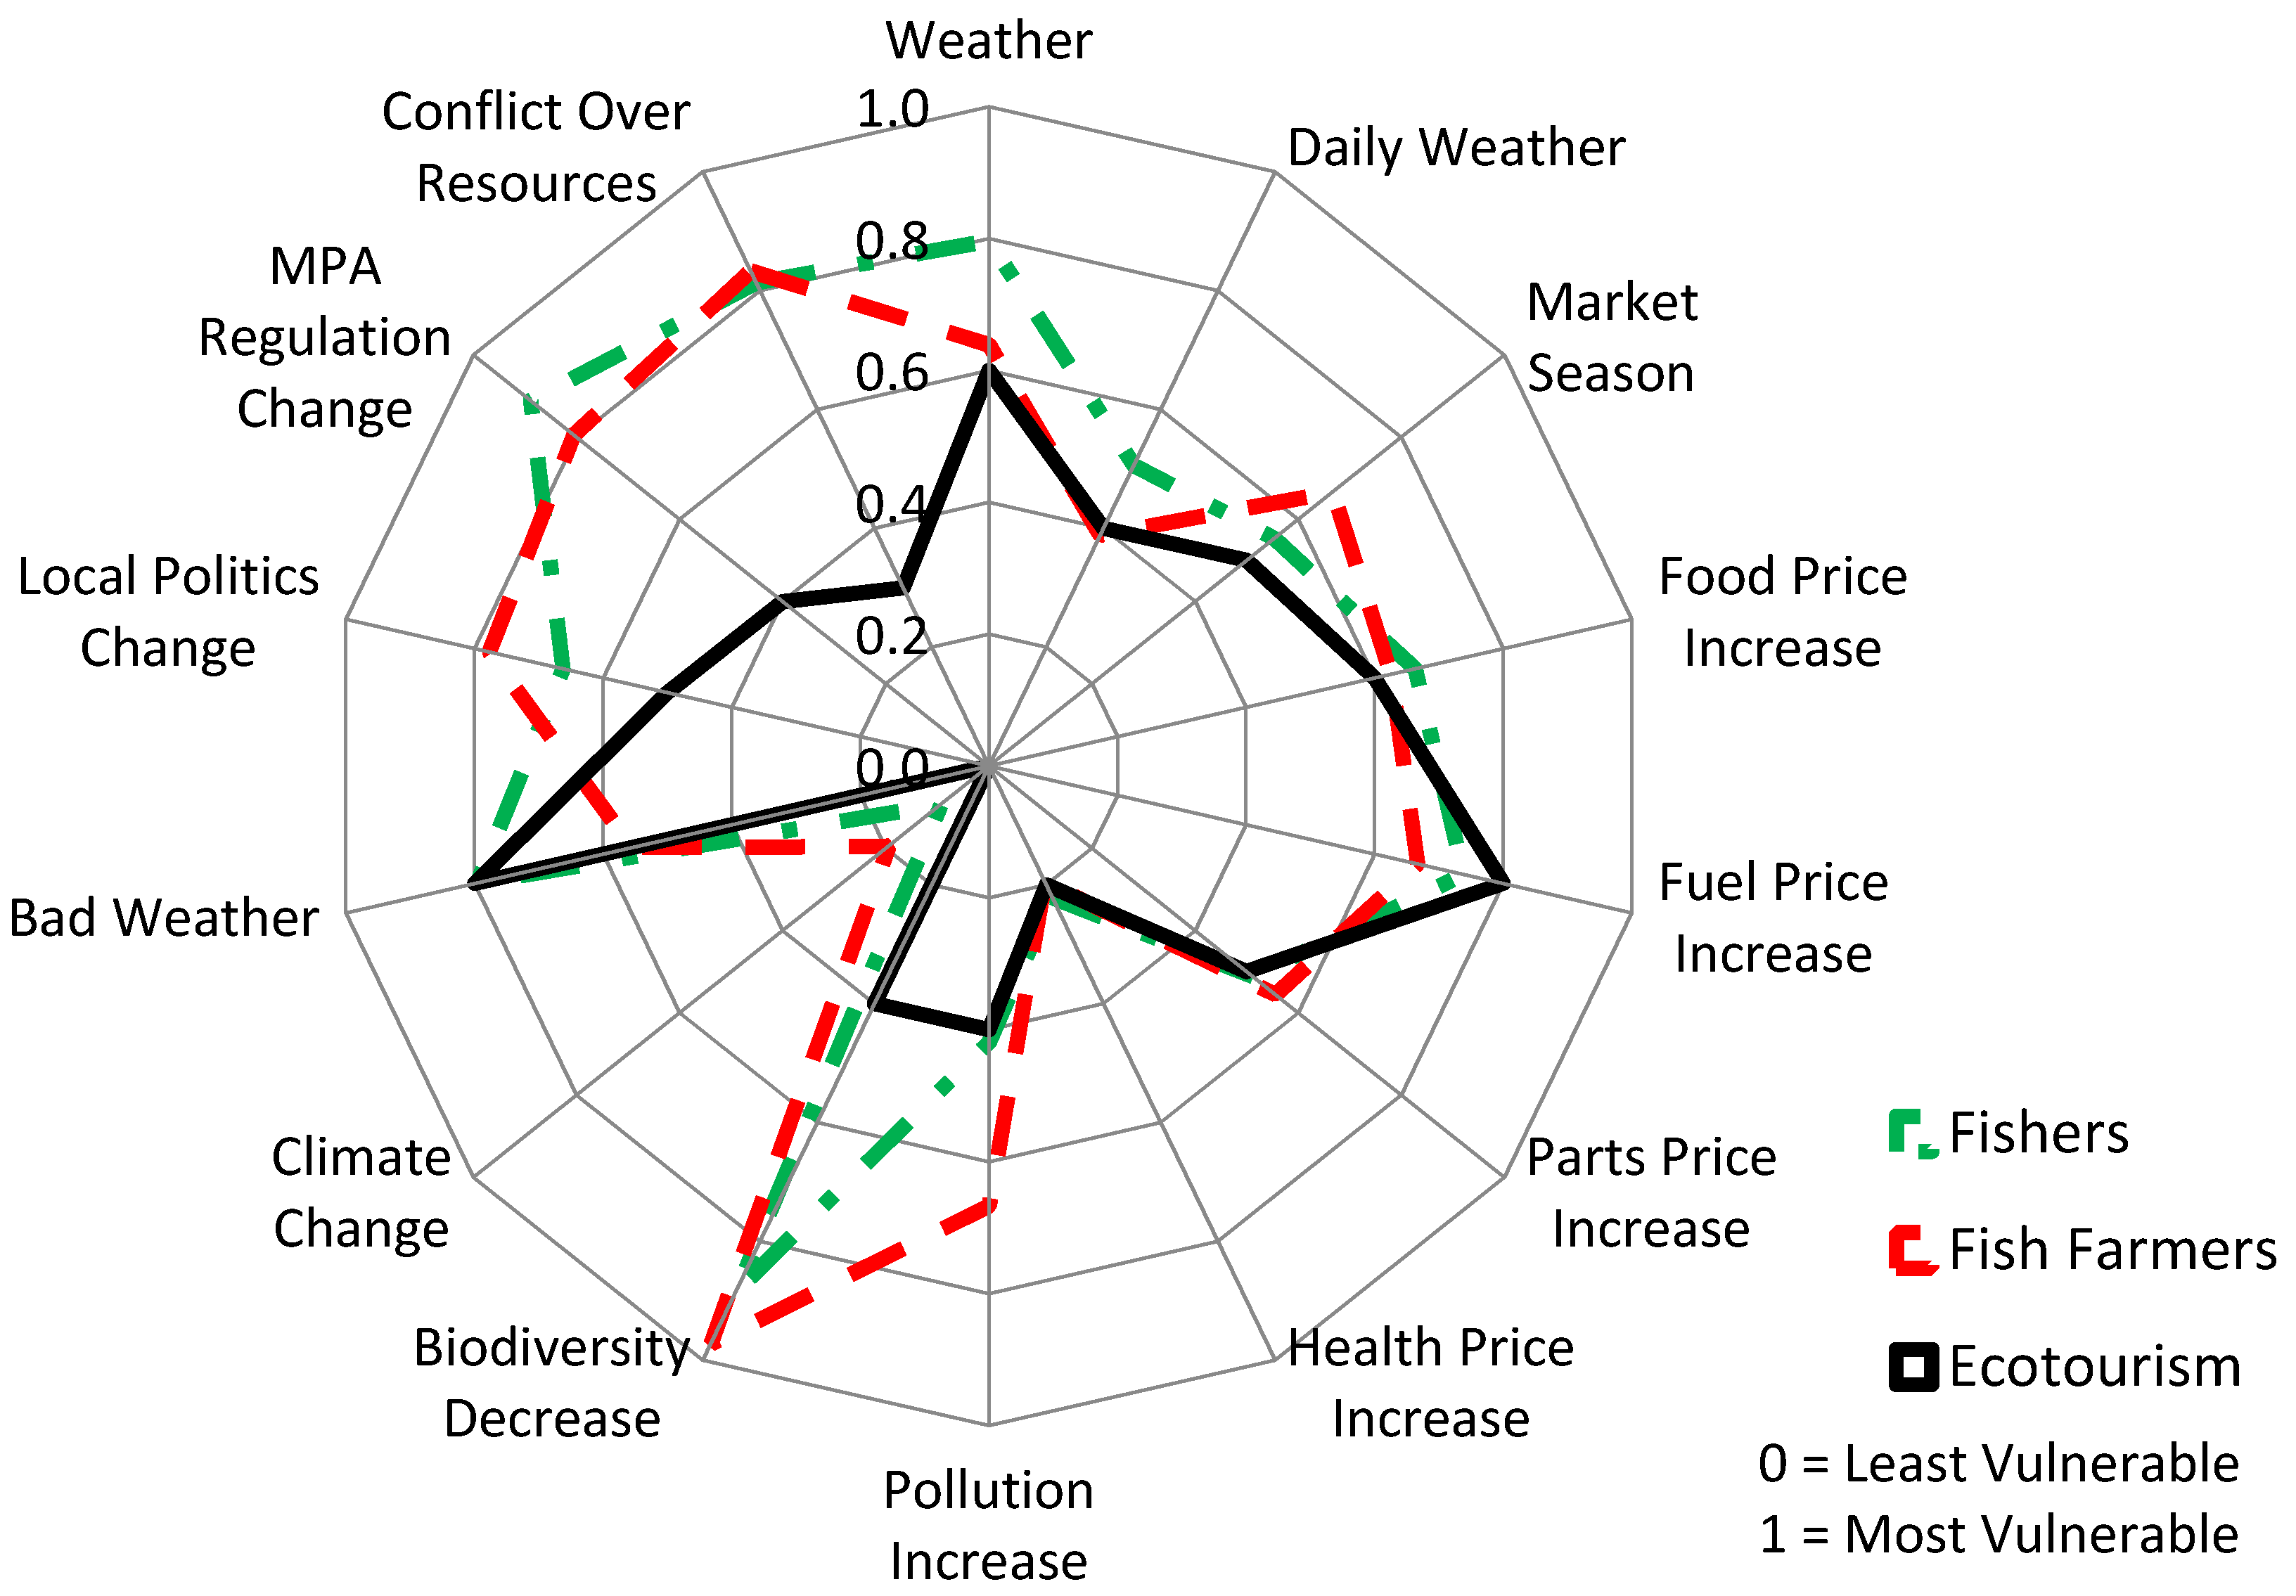
The average LVI composite index values of the three groups showed that fisher and fish farmer households were more vulnerable compared with ecotourism households (Figure 2). Fishers and fish farmers expressed a high vulnerability risk related to the decrease in the biodiversity on which they depend, as is typically experienced by resource-based livelihood activities. The low vulnerability risk that was faced by ecotourism households was mostly attributed to less dependence on natural resources, more local political support and being less affected by seasonal climate and conflicts over resource use in the area.
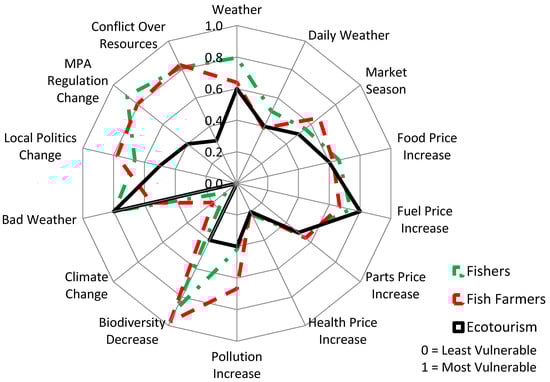
Figure 2.
Vulnerability diagram of the LVI index values for different household groups.
3.2. Small-Scale Community Groups’ Perspectives Regarding the Anambas MPA
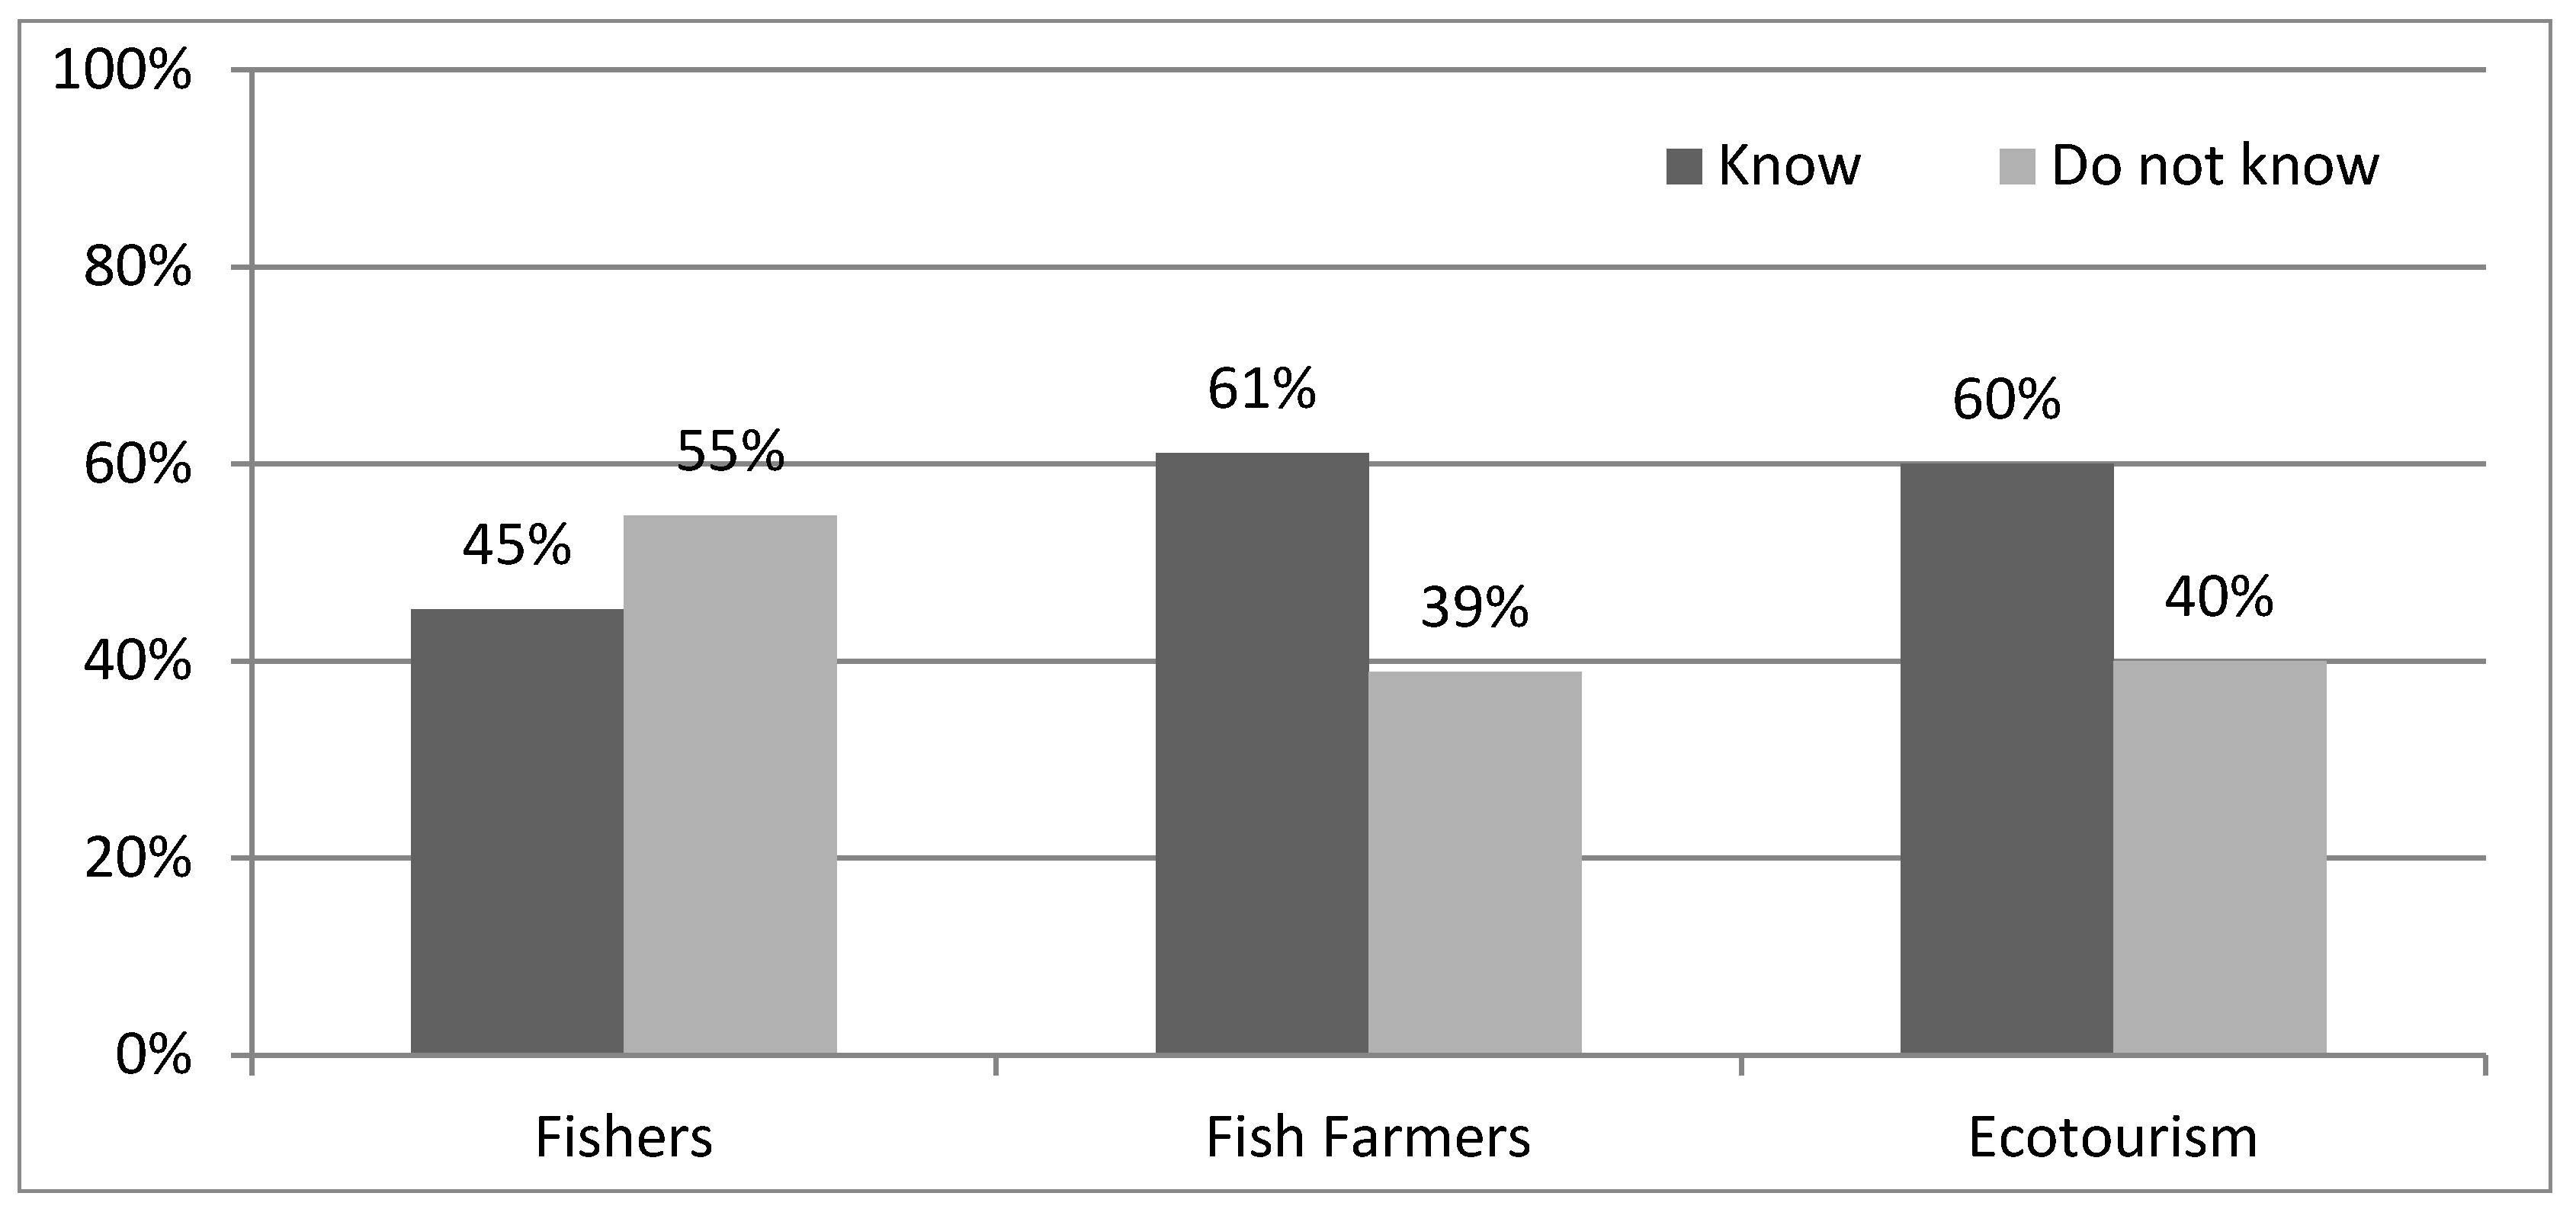
The three household groups had contrasting views about the designation of the Anambas MPA and how it affect their livelihood. The study found that both fish farmers and ecotourism respondents were more knowledgeable regarding the designation of their area as an MPA (Figure 3). At least 60% of the respondents from both groups of households knew that Anambas was designated as an MPA compared with only 46.5% of respondents from fisher households.
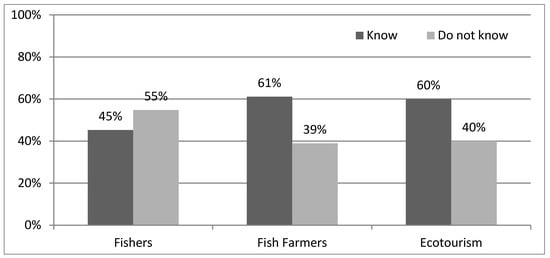
Figure 3.
Percentages of respondents who knew the designation of the Anambas MPA.
Based on the NVIVO matrix coding comparison, the reason for the respondents’ lack of knowledge was similar across all household groups: not being invited to or present in the village during the dissemination processes. Formally attending dissemination meetings, word of mouth from their peers and field visits and training were the main contributing factors for respondents from household groups who knew about the designation of Anambas MPA (Table 6).
Table 6.
NVIVO matrix coding comparison of ‘knowingness’ and types of involvement of respondents.
Furthermore, there was a high level of agreement on the designation of the Anambas MPA between the household groups (Table 7). One exception was in fisher households, where unconsulted respondents (26%) showed significant disagreement. The responses of those who agreed with the designation of the Anambas MPA from the three household groups (44%) related their argument with the importance of protected zones as fish banks. Interestingly, a combined 24% of respondents from the three household groups indicated that they would support the MPA designation and objectives. However, they would act accordingly only after they were convinced that the majority of the community would do the same.
Table 7.
Combination of responses of agreement about the designation of the Anambas MPA and reasons for agreement based on the matrix coding comparison.
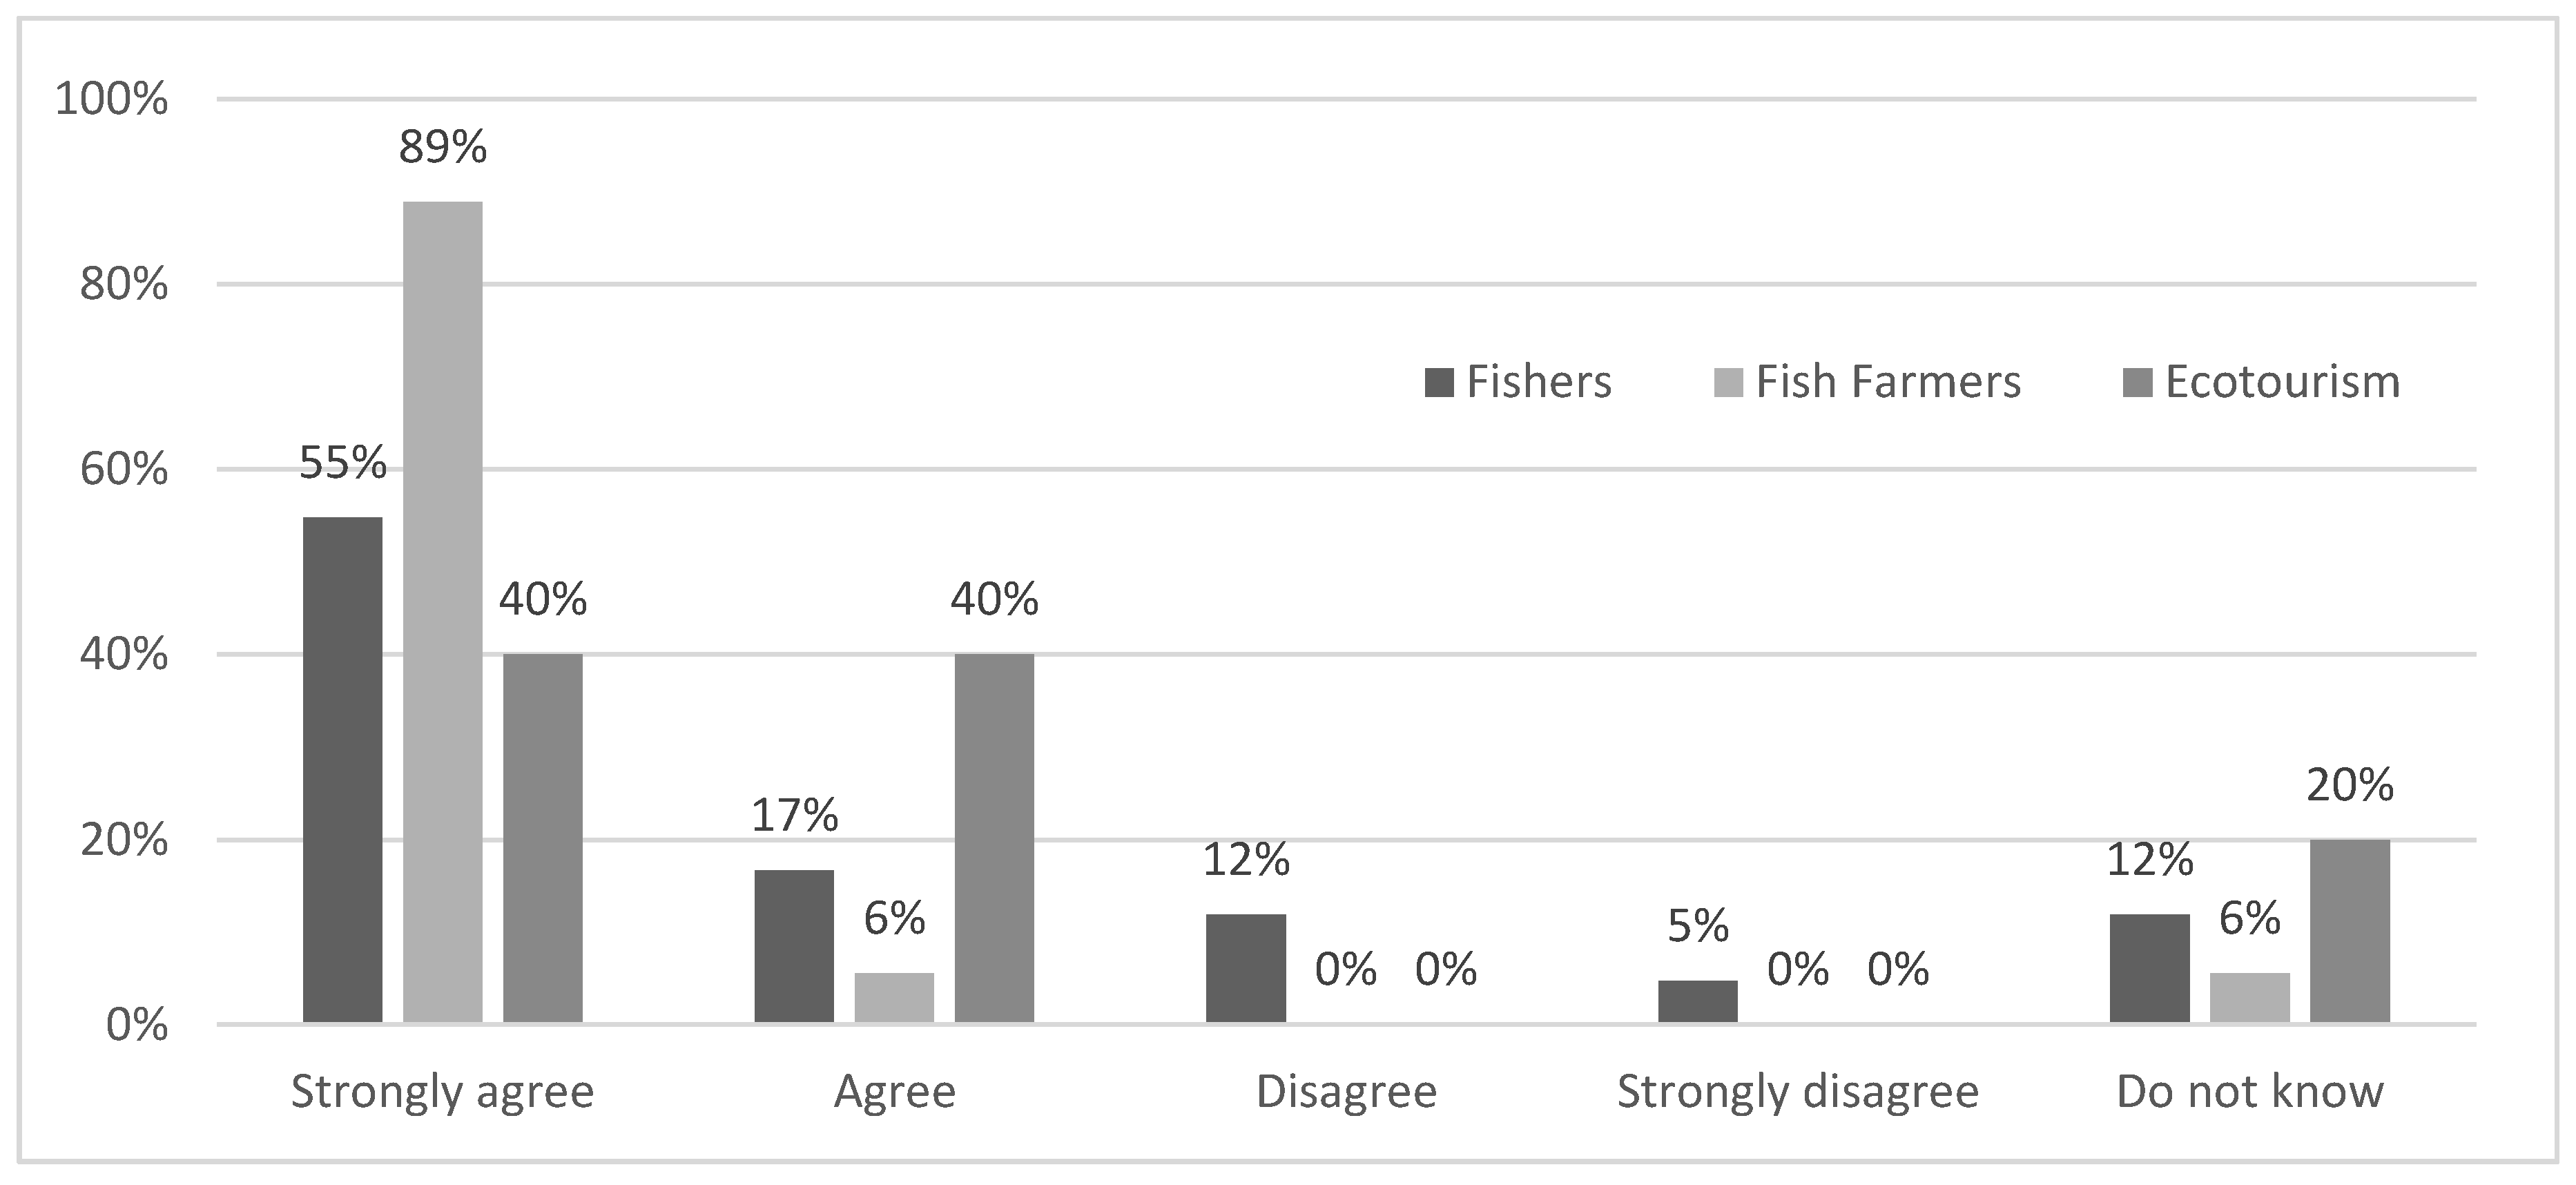
Most of the three household groups strongly agreed that the Anambas MPA will give some benefits for the island community (Figure 4), even though some of the respondents stated or indicated that they did not know of the existence of the Anambas MPA at the beginning. A significant number of fishers (25%) also disagreed with the establishment of the Anambas MPA, yet the majority of them (72%) agreed with the potential benefits of the MPA. Fish farmers and ecotourism operators also expressed a change in attitude towards the benefits of the MPA, although not as strongly as in fisher households. The shift of responses among the household groups in favour of the MPA was clearly evident throughout the interview process.

Figure 4.
Level of agreement among the household regarding the potential benefits of the Anambas MPA to the local people’s livelihoods.
4. Discussion
4.1. Livelihood Vulnerability of Small-Scale Community Groups
The influence of seasonal vulnerability risk on the activities of small island communities is arguably higher than for land-based activities [7,13]. This is due to the high-risk nature of small island environmental conditions and the highly unpredictable occurrence of those risks where the local communities reside and depend upon [4,7]. This study found that the effects of seasonal vulnerability risks on the household groups were significant. Vulnerability risks of fishing during daily and seasonal bad weather conditions forced most fishers and some fish farmers to suspend their activities. The effect is so severe that fishers have to work on government construction projects in their villages or become unemployed during this period. This cutoff period forced fishers to depend more on social safety networks; for example, borrowing money and getting daily necessities from intermediaries or other patrons [11,36], which will be repaid when fishing activities can be resumed. Fish farmers also have a similarly high seasonal vulnerability risk, particularly with the seasonality of the market. Market access and information are controlled by the buyers from Hong Kong and their operatives (intermediaries) in Anambas. Local intermediaries and fish farmers are highly dependent on boat visits from Hong Kong that currently come in only twice a month. In order to accommodate fish products from non-member fish farmers, Hong Kong buyers and their local intermediaries set up a quota system for fish (10–30 kg/visit) for the non-member fish farmers, provided the fish farmers who are members have met their quota. Two Indonesian Ministry of Marine Affairs and Fisheries (MMAF) regulations concerning the collection of live reef fish trade and collector vessels [37,38] have also tightened restrictions on the already limited market of fish in Anambas by restricting the quota, direct access to mariculture areas and number of visitations from and to overseas locations. The latter regulation was replaced with the new regulation [39] that relaxes the limit of access to mariculture centres and the number of vessel visitations. However, the effects of the previous regulation and the same red tape requirements have significantly reduced the capacity of the fish farmers in Anambas. Ecotourism households felt less affected by nature-based seasonality risks due to them partly operating on land. However, this group has a high dependency on intervention from formal institutions, such as governments or non-governmental organisations (NGOs). Ecotourism households reported a significant increase in revenue by up to 400% during government-backed activities in the tourism sites. The annual school holiday season also contributed to the increase in visitors to tourism sites, although not as significant as the government-sponsored events. Other than those, the market season of tourism in Anambas is relatively stable but low in visitation numbers. It was demonstrated that out of 11 main factors of reducing tourism vulnerability, six factors can be linked to interventions by the governments or formal institutions [40].
The relative isolation and long distance from economic centres typify small island communities [7,41]. These disadvantages, in particular, have put more stress on the economic and ecological resilience of local island communities compared to non-isolated mainland coastal communities. These disadvantages are clearly represented by the trend vulnerability indicator for fuel price increases, which affected ecotourism operators and fisher households more than fish farmers. For example, fishers have to spend 40 to 74% of the total fishing trip cost on fuel, despite the government fuel subsidies given to fishers [35]. With more fishers relying on motorised boats, an increase in fuel price will either reduce the profit per fishing trip and force fishers to shorten trips or they will need to concentrate fishing efforts near the shore [42]. For ecotourism, fuel price rises mean more expensive transportation; coupled with the remoteness, this discourages the flow of mass tourism in the area [43]. Fish farmers are less vulnerable to fuel price rises because fish farming, especially at a small scale, requires less consumption of fuel, and fish trading usually occurs near or at the farming site.
Continuous biodiversity degradation that is caused by coral mining, cyanide and illegal fishing within Anambas MPA has continued, despite it being declared an MPA [44]. This trend particularly hit fishers harder, as the total capture near shore has significantly decreased and forced them to fish further out to sea. Some fishers with boats above 1 gross tonnage have to travel between 100–200 miles to fishing grounds. Although most fish farmers do not have to travel that far, they also catch fewer fish seeds to supply their fixed net cages. The ecotourism households expressed low vulnerability in terms of biodiversity degradation, despite the current rate of biodiversity degradation in the Anambas MPA. One possible reason to explain this unusual finding is that ecotourism households still view the resource as an object rather than an asset that has to be protected and managed [45]. Similar results were also reported by Walpole and Goodwin [46], where a local community involved in ecotourism in Komodo National Park showed low support for the conservation effort. This implies that local ecotourism operators do not realise that ecotourism vulnerability is strongly dependent on the health of the protected ecosystem [47].
The perceived high levels of vulnerability on LVIs related to natural resource use were clearly expressed by fishers and fish farmers. Conflicts with foreign and local fishers, MPA fishing limitations, sudden bad weather and biodiversity degradation have been difficult to anticipate by both households. The inability to respond and adapt to these shock indicators might increase the sensitivity of the livelihood to other types of vulnerability risks [40]. Fish farmers are, in some ways, affected similarly to fishers because part of their daily routines involves fishing as an alternative livelihood. Furthermore, the apparent low vulnerability that was felt by ecotourism households on these LVIs was predominantly due to their activities being unrelated to fisheries resources.
Conflict over resources also had comparable effects to bad weather for fisher households. Not only did it significantly decrease the total fish capture, but also caused psychological damage, especially for small-scale fishers. Increased job loss and poverty were the results of psychological damage among small-scale fishers due to their inability to compete with illegal fishers [48]. Most of the fishers interviewed in this study were afraid and felt helpless when meeting with illegal poachers at sea. This was especially felt towards foreign fishers because the small ships operated by local fishers were intentionally rammed and sunk by the foreign vessels. Some of the fisher respondents said that attempts to drive these illegal fishing boats out were dangerous, as the foreign fishing crews carried firearms on board. This account is similar to that of conflicts between fishers commonly using firearms in ‘fish wars’ in the South China Sea [48]. In contrast, ecotourism households reported almost no conflicts regarding natural resource use. Insignificant conflicts regarding the land use of tourism sites that were owned by a few individuals were resolved through government intervention. For example, the government facilitated a tourism-revenue-sharing scheme between landowners and ecotourism operators in Padang Melang Beach, Jemaja Island. Landowners allowed small-scale tourism operators to build permanent guest houses and restaurants on their beaches in return for small fees.
The study findings showed that the three household groups expressed minimal vulnerability risk posed by climate change, which might uncover a hidden fact. It is likely that the knowledge discrepancy regarding climate change impacts on the Anambas coastal communities was the underlying reason these views were held by all household groups. This might be caused by the observed low level of education among the communities and the absence of information and mitigation plans regarding climate change impacts on coastal communities. Being the most vulnerable communities to the impacts of climate change [49], these three groups are facing greater risk due to their unawareness and their dependency on natural resources for their livelihood. However, fisher households might have better resilience in facing vulnerability to climate change impacts compared to the other two households. Fishers have developed a more sophisticated social safety net (social capital) with other fishers that provide help during hard times [32,50].
4.2. Communities’ Acceptance of the Anambas MPA Establishment
Most of the problems characterising the Anambas MPA until now are local community-related problems, such as MPA regulation compliance, conflicts among MPA resource users and alternative livelihoods for the local community [51]. This study found that the household groups viewed the establishment of the Anambas MPA differently. These differences, in turn, influenced regulation compliance and the level of resource use and livelihood development of the small island communities in the area.
The higher percentage of fishers that were unaware of the Anambas MPA’s existence compared to fish farmers and ecotourism operators was intriguing, as fishers are the dominant community group and directly access marine resources. One possible reason for this could be the absence of some fishers at the time of the dissemination process, as they have to travel at sea for days to catch fish. The study findings concurred with this, as most fishers operating boats above 1 gross tonnage reported fishing trips from 3–14 days at sea, with just one or two days on land before a subsequent trip. In contrast, fish farmers and ecotourism operators had slightly better knowledge about the Anambas MPA establishment because they operate on or near land. They had a better chance of attending the meetings or receiving information that the fisher groups missed. Tam [52] highlighted this by stating that community consultation has to consider the mobility of coastal communities to ensure a broad representation and thus guarantee the acceptance of an MPA regime. This might partly explain some fisher communities lacking knowledge of an MPA established by formal institutions in the studies by Cinner et al. [50] and Kusumawati and Huang [53]. However, it is not always the lack of active community participation driving this. It is more rooted in the use of top-down approaches, weak informal ties with fisher groups, strong community elite representatives and a lack of funding that prevents better information dissemination of MPA establishment.
In terms of the potential benefits of the MPA, all household groups seemed to relate their reasoning to their livelihood. Most of the fishers mentioned the important functions of the MPA as a ‘fish bank,’ preventing illegal fishing activity (non-local and foreign) and regulating the fishing activity of their own peers. The latter is particularly important to the fishers, indicating that distrust is not only between the local communities and MPA management authorities in Indonesia [53]. This distrust also occurred between members or groups of a local community, who demand equitable and fair access and compliance in MPA multiple-use zones. Interestingly, most fish farmers and ecotourism operators indicated that the main benefit of the Anambas MPA was the function of a fish bank. The three household groups referred to a fish bank as fishing grounds where fish are left to flourish and restock the surrounding areas through a spillover effect. During the interviews, some points regarding the possible benefits of the MPA were mentioned, but no fish bank term or spillover effects were explicitly mentioned. This interesting finding could be attributed to their experience of catching fewer fish near the shore or that they were informed during the dissemination process of the Anambas MPA.
5. Conclusions
Efforts to measure the livelihood vulnerability of small island communities have been mostly based on economic and ecological approaches. Sometimes these studies are impossible to carry out due to the unavailability of hard data in less developed countries. This study successfully measured and compared the livelihood vulnerability of three small-scale community groups in the Anambas MPA using a set of socially constructed LVIs. The study also determined the groups’ perceptions regarding the establishment of the MPA, which has, in some ways, affected their livelihood.
This study confirmed that the livelihood vulnerability risk that is faced by small-scale community groups in small-island MPAs can be categorised as moderately vulnerable. Despite their similar vulnerability, fisher households were the most vulnerable among the groups, followed by fish farmers and ecotourism households. Natural risks, which were categorised using seasonal and shock indicators, severely affected the Anambas fisher and fish farmer groups. Particularly for fisher groups, the vulnerability risks will likely increase if the MPA regulations impose common fishing restrictions. The government could intervene by increasing the fishing efficiency of fisher groups by supporting their alternative livelihoods during times when fishing is not possible due to poor seasonal weather or other reasons. Fish farmer groups can cope with the pressures of natural risks better than fisher groups because the fish farmers can be more flexible and obtain alternate livelihood inputs. Ecotourism households were the least vulnerable in the Anambas MPA due to their non-extractive activity. Further government intervention to promote the MPA as a tourist destination and gradually reducing the dependency of ecotourism households on government-backed programs will strengthen the resilience of this community group.
The three household groups had similar general views that the MPA provided benefits that were directly related to their livelihoods, such as improving fish stocks and preventing illegal fishing. However, the government and MPA authority might have to invest more effort and resources to increase fisher compliance to the MPA regulations. In addition, issues of trust between the members of the groups should be a concern for the MPA authority. The view that someone’s obedience to the law is someone else’s chance to break it is still pervasive within the three household groups, especially with fishers. With the limited resources and staff available in most Indonesian MPAs, building trust between community members that are similarly dependent on the MPA resources is a great challenge that is yet to be resolved.
The findings from this study indicated that small-scale mariculture in Indonesia has been integrated within the MPA regulation framework. The findings also showed that small-scale mariculture was economically and culturally important to small-island MPA communities and had a sustainability profile comparable to ecotourism and small-scale fisheries. Nevertheless, the current regulatory framework lacked a means to formally designate mariculture zones within multi-use MPAs. In order to solve this issue, a site suitability framework could be used to determine mariculture zones for small-scale mariculture in a multi-use MPA. We acknowledge that this study has limitations in terms of sample size and the opinions influenced by the presence of a third person during the face-to-face interviews. Both limitations were unavoidable but minimally affected the results of the study.
Supplementary Materials
The following are available online at https://www.mdpi.com/article/10.3390/su132212897/s1.
Author Contributions
Conceptualisation, H.A. and J.S.; methodology, H.A.; software, H.A.; validation, H.A. and J.S.; formal analysis, H.A.; investigation, H.A.; resources, H.A. and J.S.; data curation, H.A.; writing—original draft preparation, H.A.; writing—review and editing, H.A. and J.S.; visualisation, H.A.; supervision, J.S.; project administration, H.A.; funding acquisition, H.A. and J.S. All authors have read and agreed to the published version of the manuscript.
Funding
This research was funded by the Australia Award and Annual National Fund of the Center for Fisheries Research-MMAF.
Institutional Review Board Statement
The study was conducted according to and approved by the Human Research Ethics Committee (HREC) of the University of New South Wales, Sydney (Provisionally approved on 10 July 2014, #08/2014/42 and fully approved on 21 June 2017, HC14191).
Informed Consent Statement
Informed consent was obtained from all subjects involved in the study.
Data Availability Statement
The data presented in this study are available on request from the corresponding author. The data are not publicly available due to the copyright of the research, which belongs to the University of New South Wales, Sydney, Australia.
Acknowledgments
The authors thank Damon Bolton and Jenny Beer for their assistance during the research. The authors also thank the support from the community and the interviewees of the Anambas Archipelago MPA during the field research campaigns.
Conflicts of Interest
The authors declare no conflict of interest. The funders had no role in the design of the study; in the collection, analyses or interpretation of data; in the writing of the manuscript; or in the decision to publish the results.
References
- Turvey, R. Vulnerability Assessment of Developing Countries: The Case of Small-island Developing States. Dev. Policy Rev. 2007, 25, 243–264. [Google Scholar] [CrossRef]
- Dolan, A.H.; Walker, I.J. Understanding Vulnerability of Coastal Communities to Climate Change Related Risks. J. Coast. Res. 2006, 1316–1323. [Google Scholar]
- Adger, W.N. Vulnerability. Glob. Environ. Chang. 2006, 16, 268–281. [Google Scholar] [CrossRef]
- Schwarz, A.M.; Béné, C.; Bennett, G.; Boso, D.; Hilly, Z.; Paul, C.; Posala, R.; Sibiti, S.; Andrew, N. Vulnerability and resilience of remote rural communities to shocks and global changes: Empirical analysis from Solomon Islands. Glob. Environ. Change 2011, 21, 1128–1140. [Google Scholar] [CrossRef]
- Briguglio, L. Small island developing states and their economic vulnerabilities. World Dev. 1995, 23, 1615–1632. [Google Scholar] [CrossRef]
- Sullivan, C.; Meigh, J. Targeting attention on local vulnerabilities using an integrated index approach: The example of the climate vulnerability index. Water Sci. Technol. 2005, 51, 69–78. [Google Scholar] [CrossRef] [PubMed]
- Adrianto, L.; Matsuda, Y. Developing economic vulnerability indices of environmental disasters in small island regions. Environ. Impact Assess. Rev. 2002, 22, 393–414. [Google Scholar] [CrossRef]
- Kerr, S.A. What is small island sustainable development about? Ocean Coast. Manag. 2005, 48, 503–524. [Google Scholar] [CrossRef]
- Rasheed, A.R.; Abdulla, A.; Zakariyya, N.I. Vulnerability of different types of fishers to potential implementation of a management plan in a Marine Protected Area (MPA) in the Maldives. Mar. Policy 2016, 74, 195–204. [Google Scholar] [CrossRef]
- Masud, M.M.; Kari, F.; Yahaya, S.R.B.; Al-Amin, A.Q. Livelihood Assets and Vulnerability Context of Marine Park Community Development in Malaysia. Soc. Indic. Res. 2016, 125, 771–792. [Google Scholar] [CrossRef]
- Ferse, S.; Glaser, M.; Neil, M.; Manez, K.S. To cope or to sustain? Eroding long- term sustainability in an Indonesian coral reef fishery. Reg. Environ. Change 2014, 14, 2053–2065. [Google Scholar] [CrossRef]
- Ferrol-Schulte, D.; Gorris, P.; Baitoningsih, W.; Adhuri, D.S.; Ferse, S.C.A. Coastal livelihood vulnerability to marine resource degradation: A review of the Indonesian national coastal and marine policy framework. Mar. Policy 2015, 52, 163–171. [Google Scholar] [CrossRef]
- Allison, E.H.; Ellis, F. The livelihoods approach and management of small-scale fisheries. Mar. Policy 2001, 25, 377–388. [Google Scholar] [CrossRef]
- Bennett, N.; Dearden, P. Why local people do not support conservation: Community perceptions of marine protected area livelihood impacts, governance and management in Thailand. Mar. Policy 2014, 44, 107–116. [Google Scholar] [CrossRef]
- Ainsworth, C.H.; Pitcher, T.J.; Rotinsulu, C. Evidence of fishery depletions and shifting cognitive baselines in Eastern Indonesia. Biol. Conserv. 2008, 141, 848–859. [Google Scholar] [CrossRef]
- Kelly, P.M.; Adger, W.N. Theory and Practice in Assessing Vulnerability to Climate Change and Facilitating Adaptation. Clim. Change 2000, 47, 325–352. [Google Scholar] [CrossRef]
- Erenstein, O.; Hellin, J.; Chandna, P. Poverty mapping based on livelihood assets: A meso-level application in the Indo-Gangetic Plains, India. Appl. Geogr. 2010, 30, 112–125. [Google Scholar] [CrossRef]
- Birkmann, J. Measuring vulnerability to promote disaster-resilient societies: Conceptual frameworks and definitions. In Measuring Vulnerability to Natural Hazards: Towards Disaster Resilient Societies; Birkmann, J., Ed.; United Nations University Press: New York, NY, USA, 2006; pp. 55–77. [Google Scholar]
- Scoones, I. Sustainable Rural Livelihoods: A Framework for Analysis, IDS Working Paper 72; IDS: Brighton, UK, 1998. [Google Scholar]
- Department for International Development. Sustainable Livelihoods: Guidance Sheets; DFID: London, UK, 2001.
- Ellis, F. Rural Livelihoods and Diversity in Developing Countries; Oxford University Press Inc.: Oxford, UK; New York, NY, USA, 2000. [Google Scholar]
- Allison, E.H.; Horemans, B. Putting the principles of the Sustainable Livelihoods Approach into fisheries development policy and practice. Mar. Pol. 2006, 30, 757–766. [Google Scholar] [CrossRef]
- Natale, F.; Carvalho, N.; Paulrud, A. Defining small-scale fisheries in the EU on the basis of their operational range of activity the Swedish fleet as a case study. Fish. Res. 2015, 164, 286–292. [Google Scholar] [CrossRef]
- Afero, F.; Miao, S.; Perez, A. Economic analysis of tiger grouper Epinephelus fuscoguttatus and humpback grouper Cromileptes altivelis commercial cage culture in Indonesia. Aquacult. Int. 2010, 18, 725–739. [Google Scholar] [CrossRef]
- Cater, E. Ecotourism in the third world: Problems for sustainable tourism development. Tour. Manag. 1993, 14, 85–90. [Google Scholar] [CrossRef]
- Donohoe, H.M.; Needham, R.D. Ecotourism: The Evolving Contemporary Definition. J. Ecotourism. 2006, 5, 192–210. [Google Scholar] [CrossRef]
- Erenstein, O.; Hellin, J.; Chandna, P. Livelihoods, Poverty and Targeting in the Indo-Gangetic Plains: A Spatial Mapping Approach; International Maize and Wheat Improvement Center (CIMMYT): El Batán, Mexico, 2007. [Google Scholar]
- Jones, B.; Andrey, J. Vulnerability index construction: Methodological choices and their influence on identifying vulnerable neighbourhoods. Int. J. Emerg. Manag. 2007, 4, 269–295. [Google Scholar] [CrossRef]
- Ranganathan, C.; Singh, N.; Bantilan, M.; Padmaja, R.; Rupsha, B. Quantitative assessment of Vulnerability to Climate Change: Computation of Vulnerability indices. Unpublished work. 2009. [Google Scholar]
- Carifio, J.; Perla, R.J. Ten common misunderstandings, misconceptions, persistent myths and urban legends about Likert scales and Likert response formats and their antidotes. J. Soc. Sci. 2007, 3, 106–116. [Google Scholar] [CrossRef] [Green Version]
- Eakin, H.; Bojórquez-Tapia, L.A. Insights into the composition of household vulnerability from multicriteria decision analysis. Glob. Environ. Chang. 2008, 18, 112–127. [Google Scholar] [CrossRef]
- Hahn, M.B.; Riederer, A.; Foster, S. The Livelihood Vulnerability Index: A pragmatic approach to assessing risks from climate variability and change-A case study in Mozambique. Glob. Environ. Change-Human Policy Dimens. 2009, 19, 74–88. [Google Scholar] [CrossRef]
- Boyatzis, R.E. Transforming Qualitative Information: Thematic Analysis and Code Development; SAGE Publications: London, UK; Thousand Oaks, CA, USA, 1998. [Google Scholar]
- Fereday, J.; Muir-Cochrane, E. Demonstrating rigor using thematic analysis: A hybrid approach of inductive and deductive coding and theme development. Int. J. Qual. Methods 2006, 5, 80–92. [Google Scholar] [CrossRef]
- Muchlisin, Z.A.; Fadli, N.; Nasution, A.M.; Astuti, R. Analysis of fuel subsidy (diesel) for fishermen in Aceh Besar District, Aceh Province. DEPIK J. 2012, 1, 107–113. [Google Scholar]
- Adhuri, D.S.; Rachmawati, L.; Sofyanto, H.; Hamilton-Hart, N. Green market for small people: Markets and opportunities for upgrading in small-scale fisheries in Indonesia. Mar. Policy 2015, 63, 198–205. [Google Scholar] [CrossRef]
- Ministry of Marine Affairs and Fisheries. MMAF Decree regarding Conservation Status of Humpback Wrasse (Cheilinus undulatus). In 37/KEPMEN-KP/2013; MMAF: Jakarta, Indonesia, 2013. [Google Scholar]
- Ministry of Marine Affairs and Fisheries. MMAF Decree regarding Life Reef Fish Collector Vessels. In 15/PERMEN-KP/2016; MMAF: Jakarta, Indonesia, 2016. [Google Scholar]
- Ministry of Marine Affairs and Fisheries. MMAF Decree regarding Life Reef Fish Collector Vessels. In 15/PERMEN-KP/2020; MMAF: Jakarta, Indonesia, 2020. [Google Scholar]
- Calgaro, E.; Lloyd, K.; Dominey-Howes, D. From vulnerability to transformation: A framework for assessing the vulnerability and resilience of tourism destinations. J. Sustain. Tour. 2014, 22, 341–360. [Google Scholar] [CrossRef]
- Abecasis, R.C.; Schmidt, L.; Longnecker, N.; Clifton, J. Implications of community and stakeholder perceptions of the marine environment and its conservation for MPA management in a small Azorean island. Ocean Coast. Manag. 2013, 84, 208–219. [Google Scholar] [CrossRef]
- Sumaila, U.; Teh, L.; Watson, R.; Tyedmers, P.; Pauly, D. Fuel price increase, subsidies, overcapacity, and resource sustainability. ICES J. Mar. Sci. 2008, 65, 832–840. [Google Scholar] [CrossRef] [Green Version]
- Hampton, M.P.; Jeyacheya, J. Power, ownership and tourism in small islands: Evidence from Indonesia. World Dev. 2015, 70, 481–495. [Google Scholar] [CrossRef]
- Mustika, P.L.; Gunawan, T.; Erdmann, M.V. (Eds.) Kajian Cepat Kelautan (Marine Rapid Assessment—MRAP) di Taman Wisata Perairan Kepulauan Anambas 3–31 Mei 2012; Kementerian Kelautan dan Perikanan, Lembaga Ilmu Pengetahuan Indonesia (LIPI), Pemerintah Daerah Kabupaten Anambas, The Nature Conservancy, Conservation International Indonesia: Denpasar, Indonesia, 2013.
- Goodwin, H. Local Community Involvement in Tourism around National Parks: Opportunities and Constraints. Curr. Issues Tour. 2002, 5, 338–360. [Google Scholar] [CrossRef]
- Walpole, M.J.; Goodwin, H.J. Local attitudes towards conservation and tourism around Komodo National Park, Indonesia. Environ. Conserv. 2001, 28, 160–166. [Google Scholar] [CrossRef]
- Ross, S.; Wall, G. Evaluating ecotourism: The case of North Sulawesi, Indonesia. Tour. Manag. 1999, 20, 673–682. [Google Scholar] [CrossRef]
- Pomeroy, R.; Parks, J.; Pollnac, R.; Campson, T.; Genio, E.; Marlessy, C.; Holle, E.; Pido, M.; Nissapa, A.; Boromthanarat, S.; et al. Fish wars: Conflict and collaboration in fisheries management in Southeast Asia. Mar. Policy 2007, 31, 645–656. [Google Scholar] [CrossRef]
- McGranahan, G.; Balk, D.; Anderson, B. The rising tide: Assessing the risks of climate change and human settlements in low elevation coastal zones. Environ. Urban. 2007, 19, 17–37. [Google Scholar] [CrossRef]
- Cinner, J.E.; McClanahan, T.R.; Wamukota, A. Differences in livelihoods, socioeconomic characteristics, and knowledge about the sea between fishers and non-fishers living near and far from marine parks on the Kenyan coast. Mar. Policy 2010, 34, 22–28. [Google Scholar] [CrossRef]
- LKKPN-Pekanbaru. Rencana Pengelolaan dan Zonasi Wisata Perairan Kepulauan Anambas dan Laut Sekitarnya; LKKPN Pekanbaru, KP3K, MMAF: Pekanbaru, Indonesia, 2013; p. 228. [Google Scholar]
- Tam, C.-L. Timing exclusion and communicating time: A spatial analysis of participation failure in an Indonesian MPA. Mar. Policy 2015, 54, 122–129. [Google Scholar] [CrossRef]
- Kusumawati, I.; Huang, H.-W. Key factors for successful management of marine protected areas: A comparison of stakeholders’ perception of two MPAs in Weh island, Sabang, Aceh, Indonesia. Mar. Policy 2015, 51, 465–475. [Google Scholar] [CrossRef]
Publisher’s Note: MDPI stays neutral with regard to jurisdictional claims in published maps and institutional affiliations. |
© 2021 by the authors. Licensee MDPI, Basel, Switzerland. This article is an open access article distributed under the terms and conditions of the Creative Commons Attribution (CC BY) license (https://creativecommons.org/licenses/by/4.0/).