2.2. Concrete Mix Properties
Concrete beams with dimensions of 60 × 60 × 220 mm
3 were cast using a self-consolidating mix composition, specified in
Table 2. The effectiveness of the healing agents was assessed in a capillary water absorption test set-up, and this beam size was chosen for the ease of handling during the test [
26]. A total of three repetitions were included for each type of healing agent investigated (the code name for each healing agent is listed in
Table 1), as well as for a series of uncracked (REF UNCR) and cracked (REF CR) reference specimens. The mix used CEM I 52.5 N cement with a water to cement ratio of 0.45 and limestone filler with a particle size < 125 µm. Aggregates no larger than 8 mm were included so that they would easily pass between the glass network and the walls of the mold. To improve workability and allow the fresh concrete to flow around the vascular network, a superplasticizer was included in the mix design (Master Glenium 27 concentration of 20%, BASF, Waterloo, Belgium).
One batch of concrete was prepared in a vertical shaft mixer with a capacity of 50 L and rotating pan (Eirich, Germany). After the dry components were mixed for 1 min, water was added and mixing continued for 3 min. The superplasticizer was added 30 s after the water was added. A first layer of fresh concrete was slowly added around the glass tubes (see
Section 2.3) to ensure there were no voids underneath the glass networks, after which the remaining fresh concrete was added. To ensure the mix was fully compacted in the molds, the molds were vibrated on a vibrating table at a low speed for no more than 20 s.
The slump flow, density and air content were determined on the fresh concrete, and 150 × 150 × 150 mm3 cubes were cast to determine the compressive strength. These tests on the mix yielded a slump flow of 57.5 cm, an average density of 2341 kg/m3 and an air content of 2.5%. The compressive strength at 28 days was 80.25 MPa, with a standard deviation of 1.14 MPa.
After casting, the specimens were stored in a curing room with a temperature of 20 °C and a relative humidity of >95%. The specimens were demolded one day after casting and immediately placed back in the curing environment until testing.
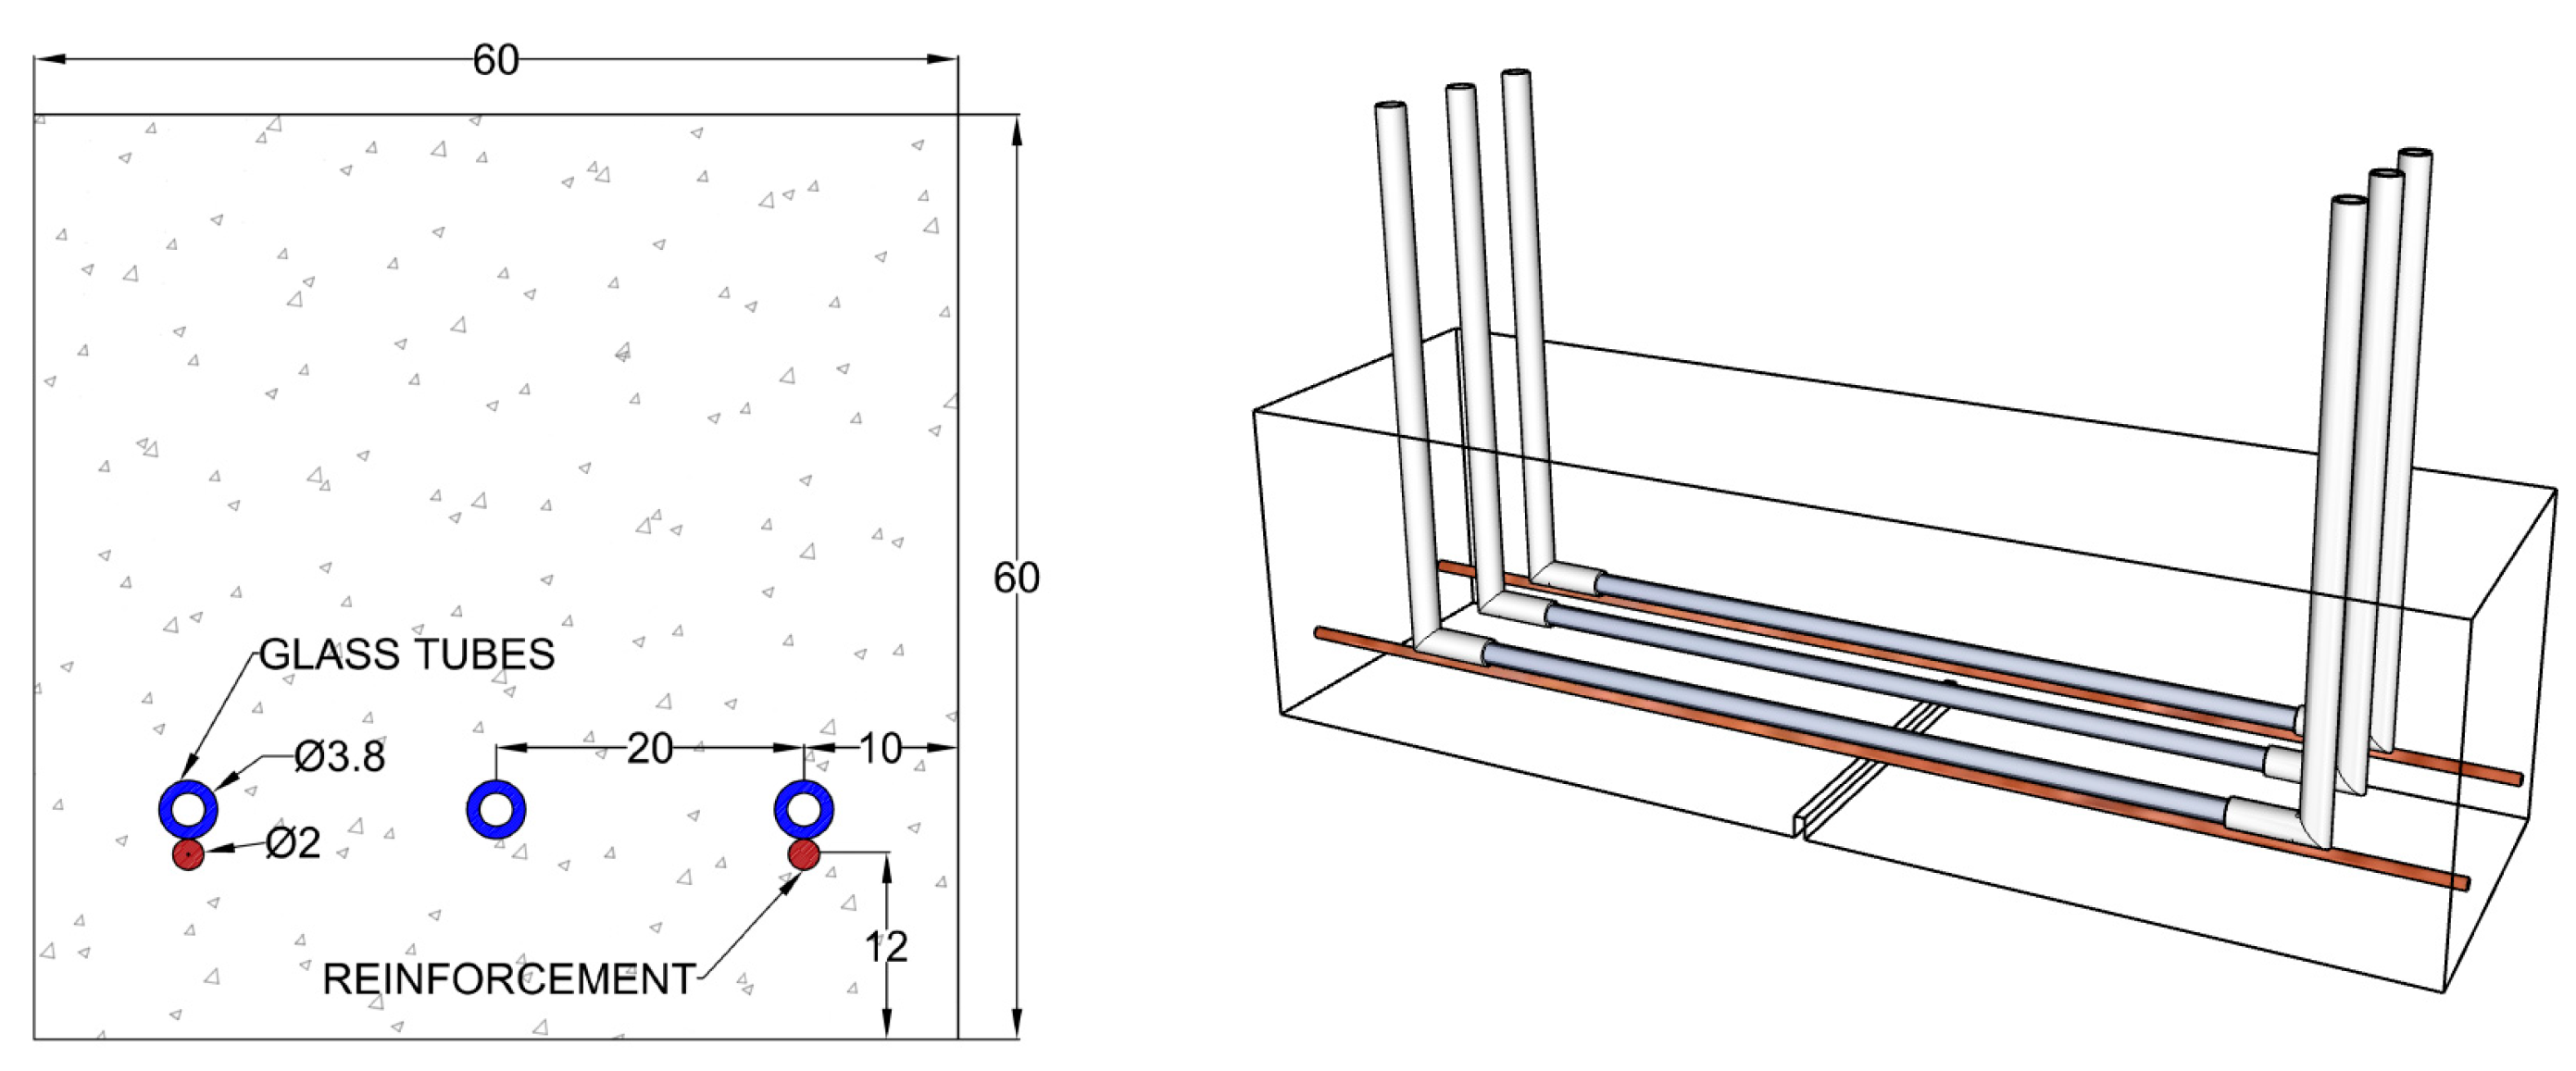
Two copper-coated steel wires with a diameter of 2.0 mm were added (
Figure 1) to achieve a realistic loading behavior as well as prevent a total failure of the beams during loading. The wires were manually sanded to promote bonding to the concrete matrix.
A linear vascular system, rather than an optimized configuration, was chosen to assess the performance of the individual healing agents in this study. Three glass tubes with a length of 150 mm, an outer diameter of 3.8 mm and a wall thickness of 0.8 mm were placed in the molds equally spaced on spacers, so that they rested just above the reinforcement. The ends of the glass tubes were connected to silicone tubes to facilitate the healing-agent pumping, and the beams were notched at their midspan on the bottom side with a saw cutter to a depth of 4 mm after curing (
Figure 1).
2.5. Evaluation of the Self-Healing Efficiency
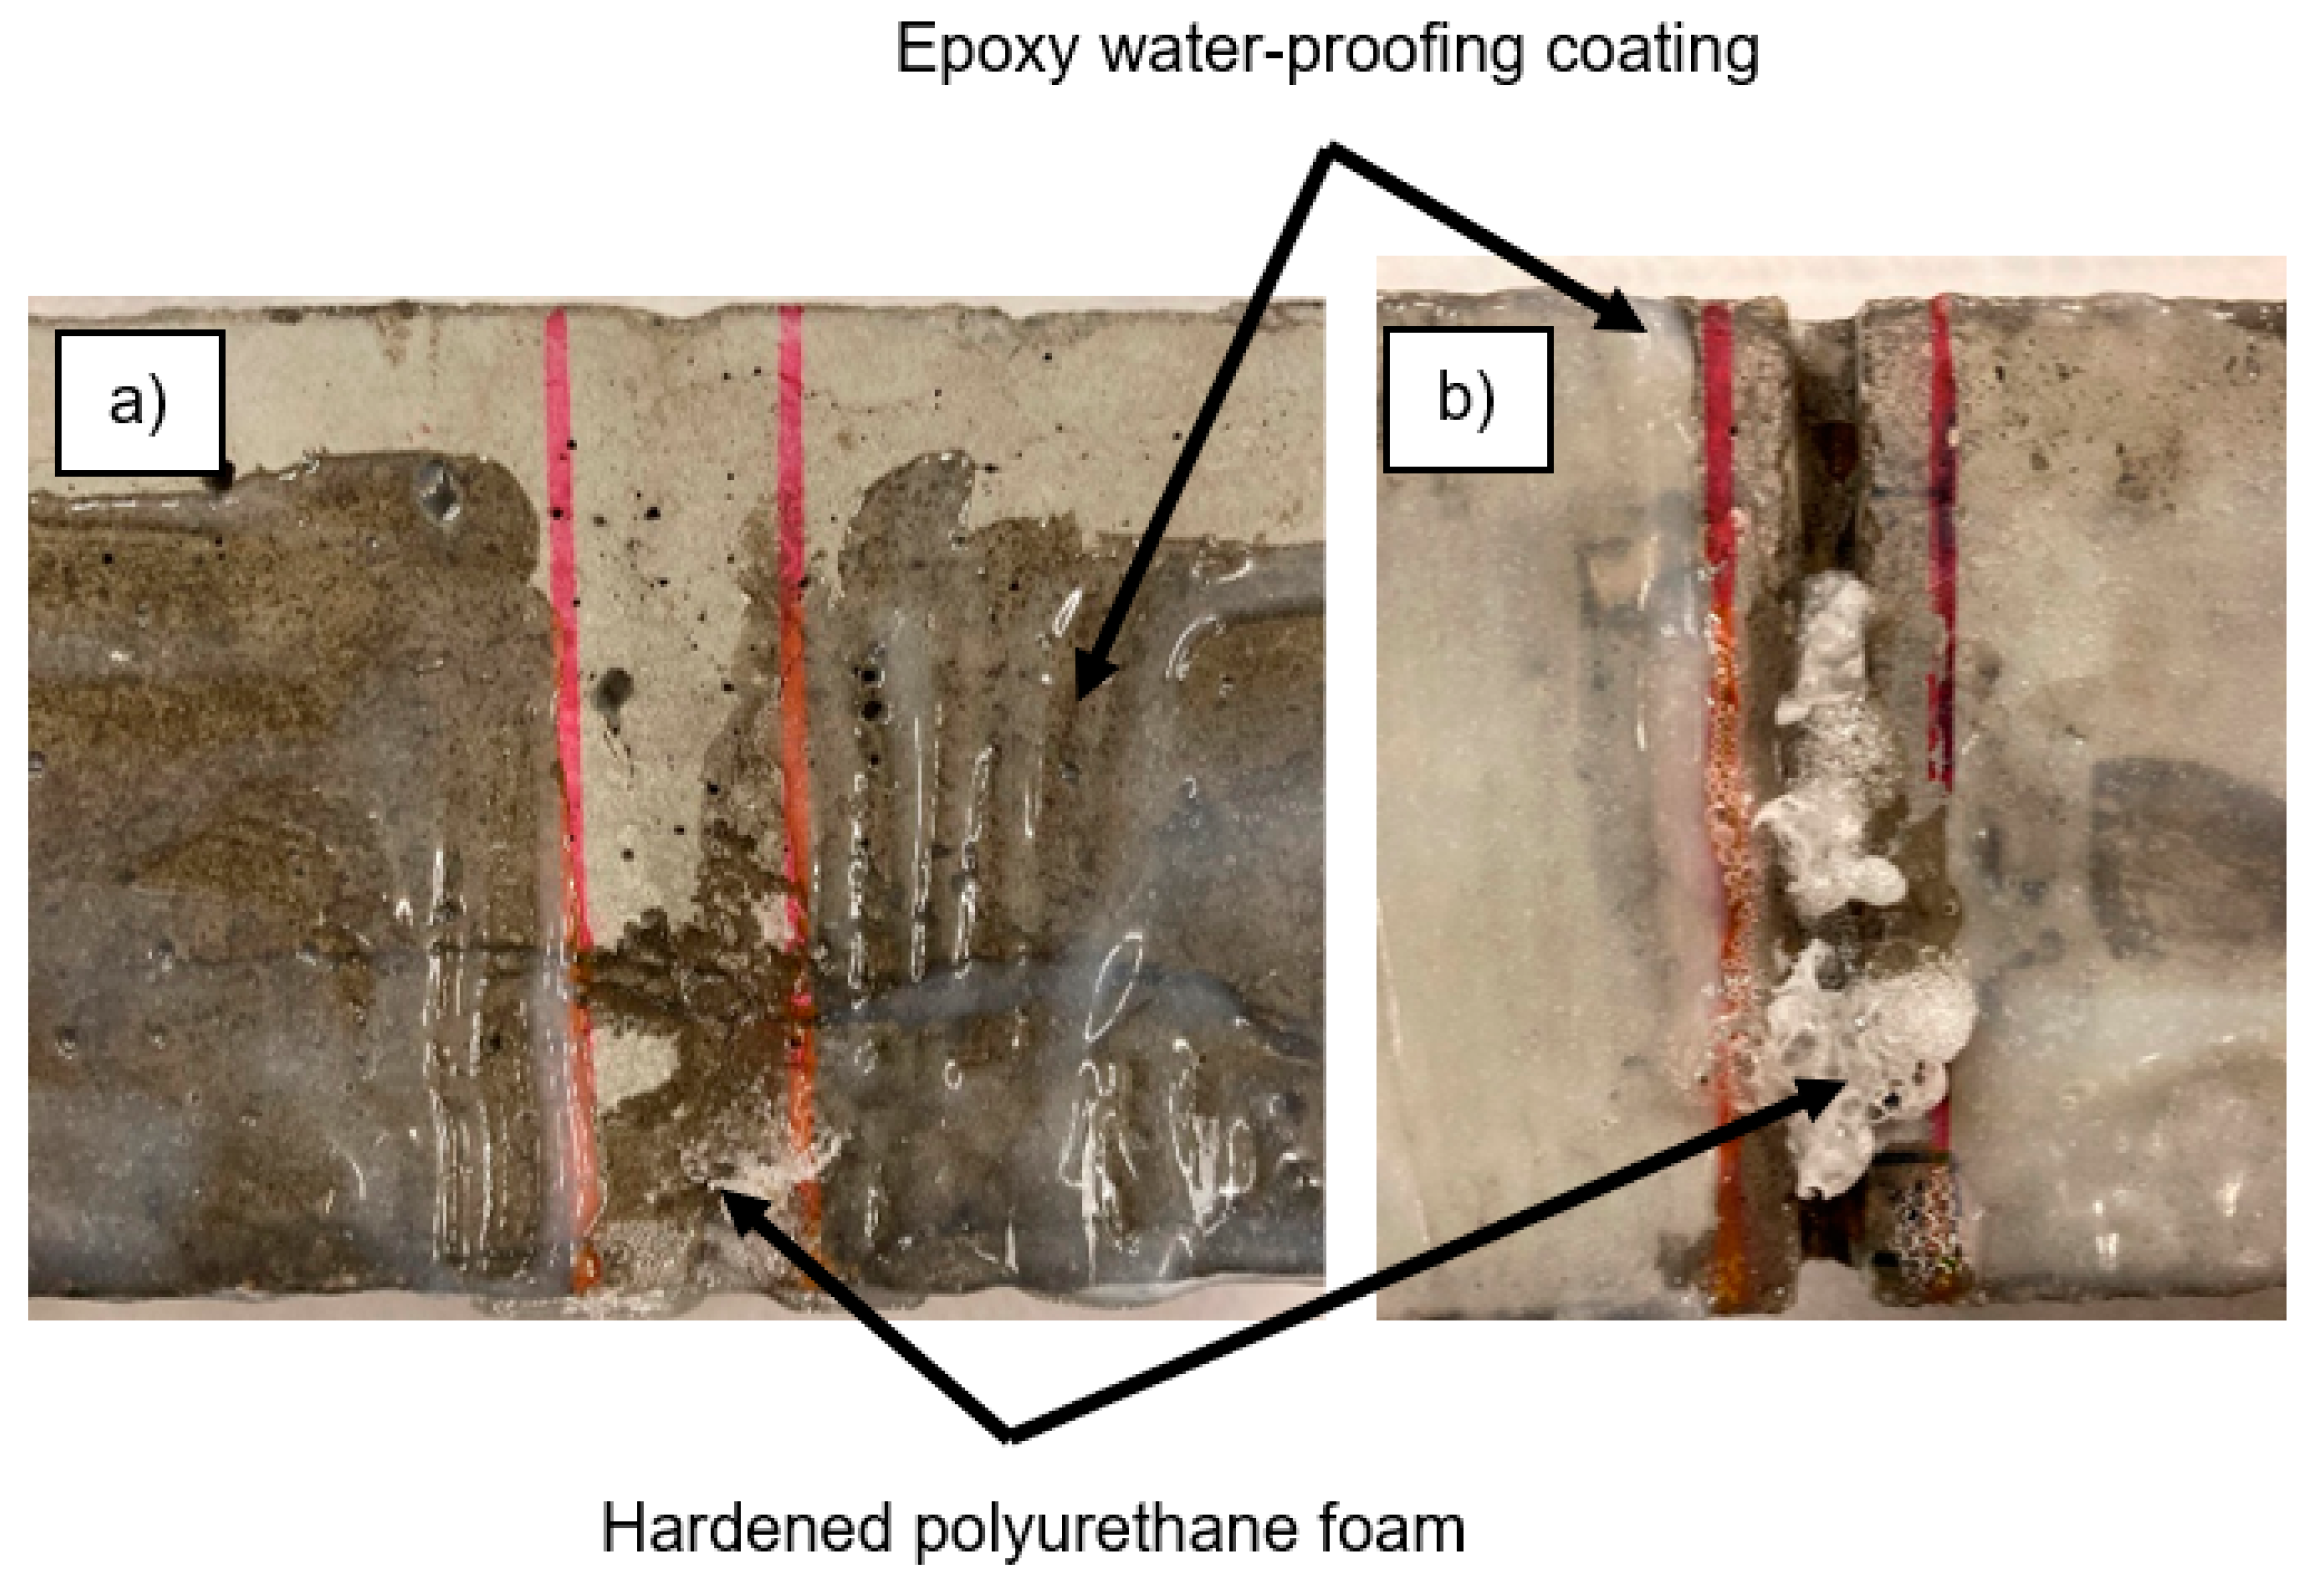
Two capillary water absorption tests were performed, one before and one after supplying a healing agent through the network. After crack formation, the cracked and uncracked specimens were placed in an oven at 40 ± 5 °C until constant mass was achieved, which occurred after 5 days. The standard EN 13057 defines constant mass as a weight change not greater than 0.2% in 2 h. This may not be a strict enough criterion; therefore, constant mass in this study was defined as having no more than a 0.1% difference over a 24-h period. The samples were then removed from the oven, and two coatings of an epoxy resin sealer were applied with a brush, keeping a 14-mm exposed strip centered on the crack along the bottom and the sides of the specimen. The sides of the specimen were covered up to a height of 40 mm (except for the strip centered on the crack). The two-component epoxy resin sealer, Episol
® Designtop SF [
28], was used to waterproof the samples to allow for more homogeneous results for this test [
29]. The samples were first dried without an epoxy coating until they reached constant mass. The epoxy coating was then applied, and once cured, the samples were returned to the oven at 40 ± 5 °C for a minimum of 5 days until constant mass was achieved again.
During the capillary water absorption test, the cracked specimens were set on two non-absorbing supports in a box containing water, so that they were immersed in water 3 ± 1 mm above the notch. The specimens were weighed to determine the weight gain with time after 10 min, 20 min, 30 min, 1 h, 1 h 30 min, 2 h, 3 h, 4 h, 6 h, 8 h and 24 h. A pre-wetted cloth was used to remove any excess moisture on the surface of the specimen before recording its mass. An instruction video produced by an interlaboratory study for this procedure is provided in [
30].
After the first water absorption test, the samples were dried again for a minimum of 10 days until constant mass was achieved. They were then pumped with a healing agent, and a second water absorption test was executed in the following day. An exception was made for the sodium silicate samples, as they have a longer curing time. While most studies suggest a curing time of 28 days for sodium silicate to allow it to react with calcium hydroxide (CH) in the cement matrix when exposed to water and form calcium silicate hydrate (C-S-H) gels, during this experimental campaign this healing agent was observed to have hardened after 24 h. While this hardening could be considered a healing product, it did not appear to have fully reacted with the cementitious matrix. These samples were healed immediately after the first water absorption test to allow the excess water to aid in the reaction, and then stored in an oven (40 ± 5 °C) for a total of 40 days prior to their second water absorption test. A 28-day curing period was originally planned for these samples. However due to unforeseen repair works involving the laboratory equipment, the curing and drying period for these samples were extended to 40 days. This separate series also included its own set of cracked and uncracked reference samples.
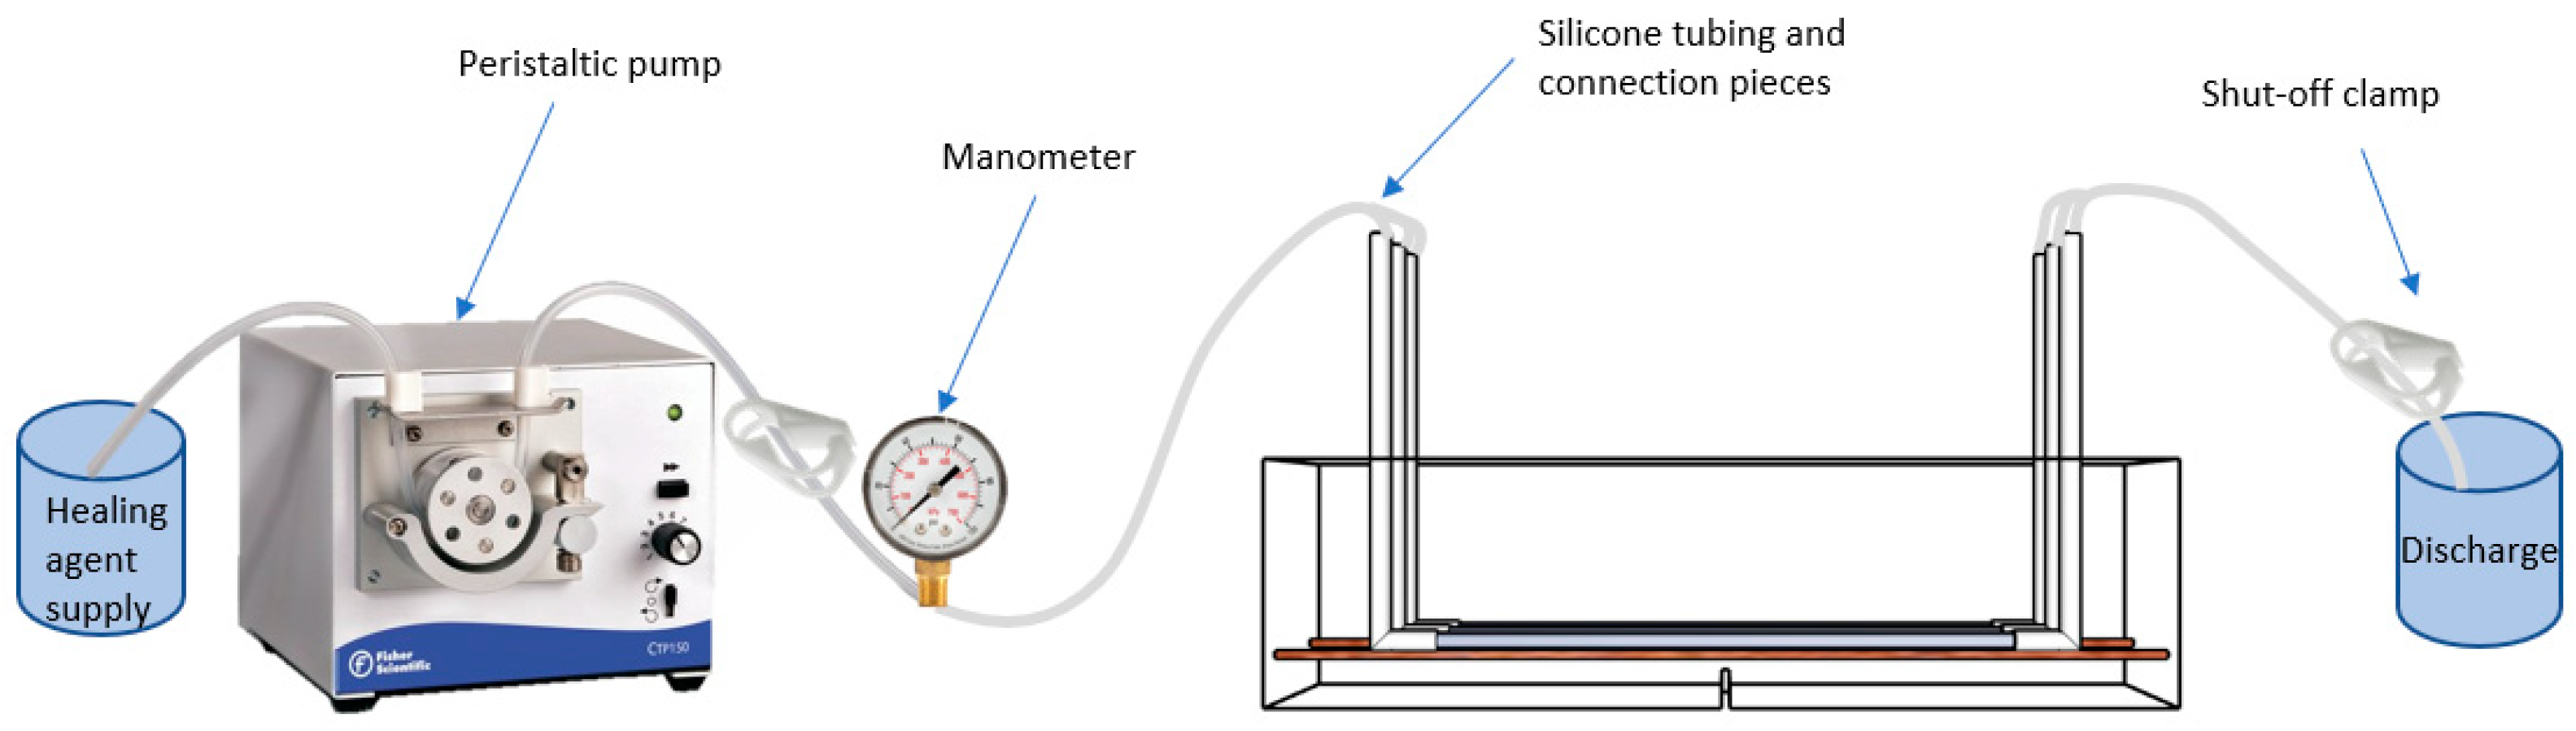
A peristaltic pump (Fisherbrand pump model #CTP150) (
Figure 4) was chosen for administering the healing agent to eliminate the possibility of cross-contamination among healing agents; the pumping action relies on positive displacement within the interchangeable tubes to move the fluid through the system.
For each specimen with a supplied healing agent, the fluid was pumped at a low rate until the fluid was seen coming out of the outlet, at which point the valve was shut at the outlet. Pumping was left on until a pressure of 1.5 bar was reached, or until any flow was seen coming from the crack mouth, at which point the valve at the inlet was shut. The pressure gauge was monitored for two minutes while visually checking for seepage around the crack and at the bottom of the specimen. After the two minutes, both valves were released and air was pumped through the silicone tubes until any remaining fluid inside the glass tubes of the vascular network was flushed out as much as possible.
It was investigated if the network channels were blocked after a healing cycle, and verified if any additional healing agent could still be pumped through the network. This was achieved by pumping water through the embedded networks in the beams, which done immediately before the second loading test (and well beyond the curing of the agents). An additional series of specimens were used to pump a healing agent (using PU1) through the network and subsequently flushed out with a high-pressure air compressor (up to 6 bar) to investigate the effect of a high-pressure flushing procedure, and if it would reduce the amount of hardened healing agent blocking the channels. Water was also flushed through these samples as previously described.
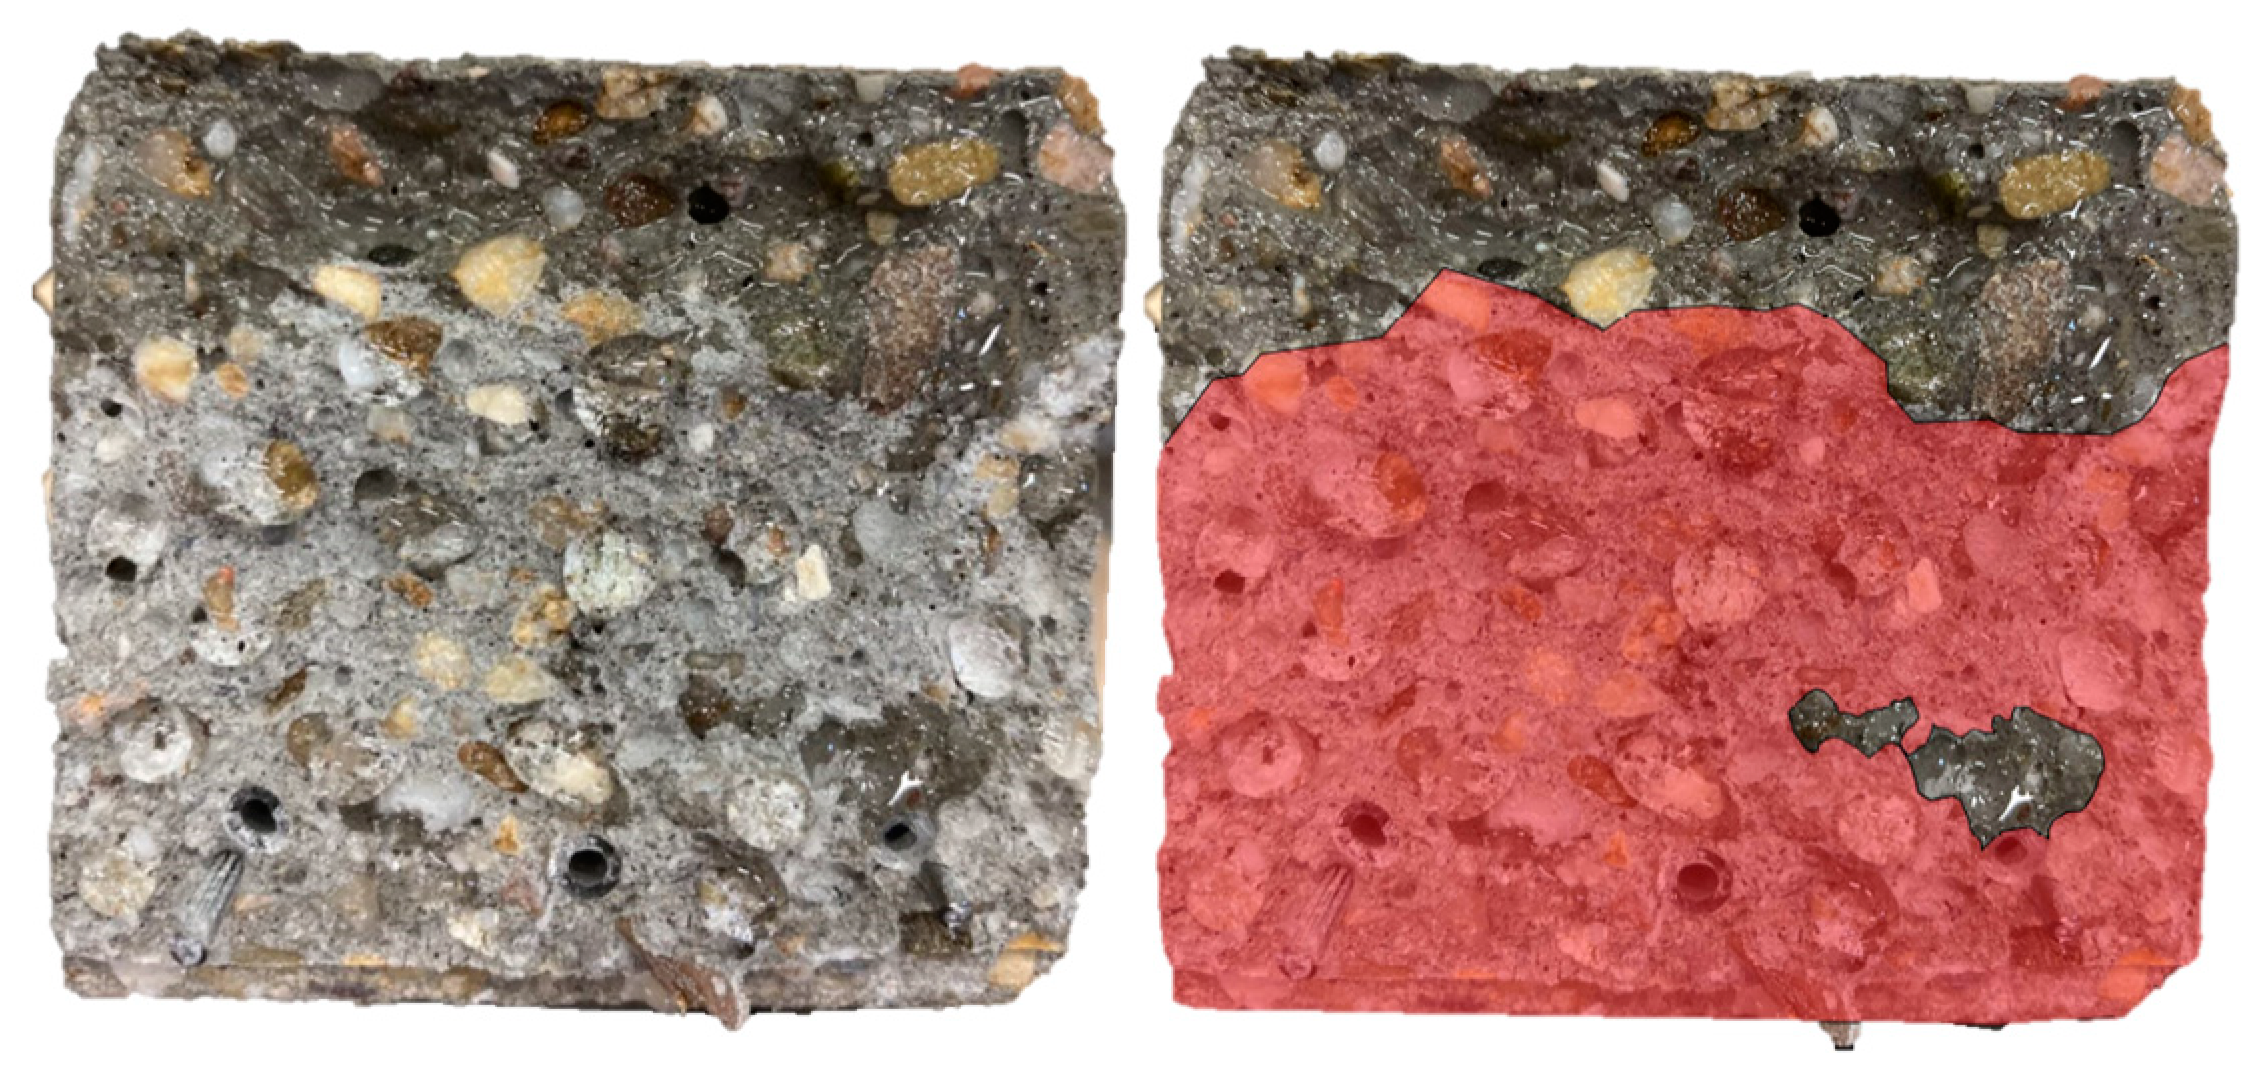
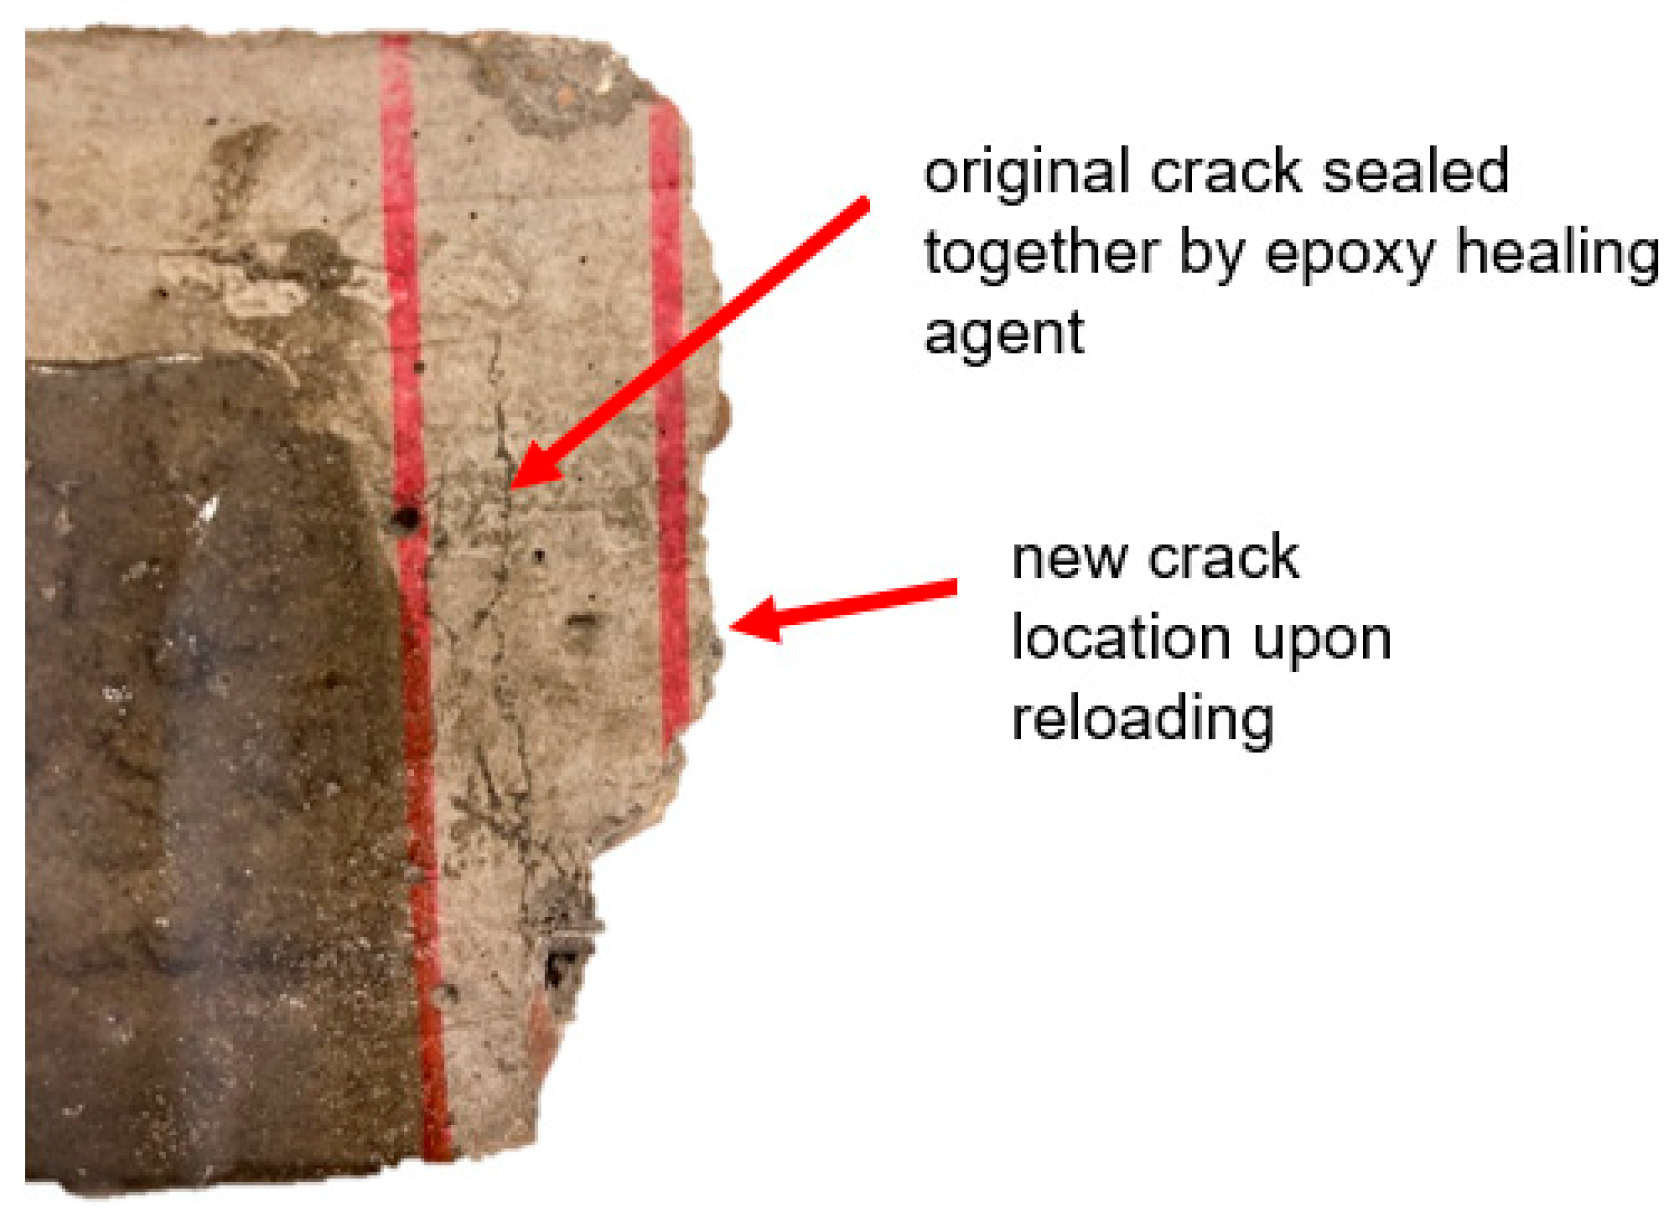
Three days after the second capillary water absorption test, the samples were reloaded under the same loading scheme so that a regain in mechanical strength could be evaluated. Once complete, the samples were completely broken to investigate the spread of the fluid on the crack surfaces.
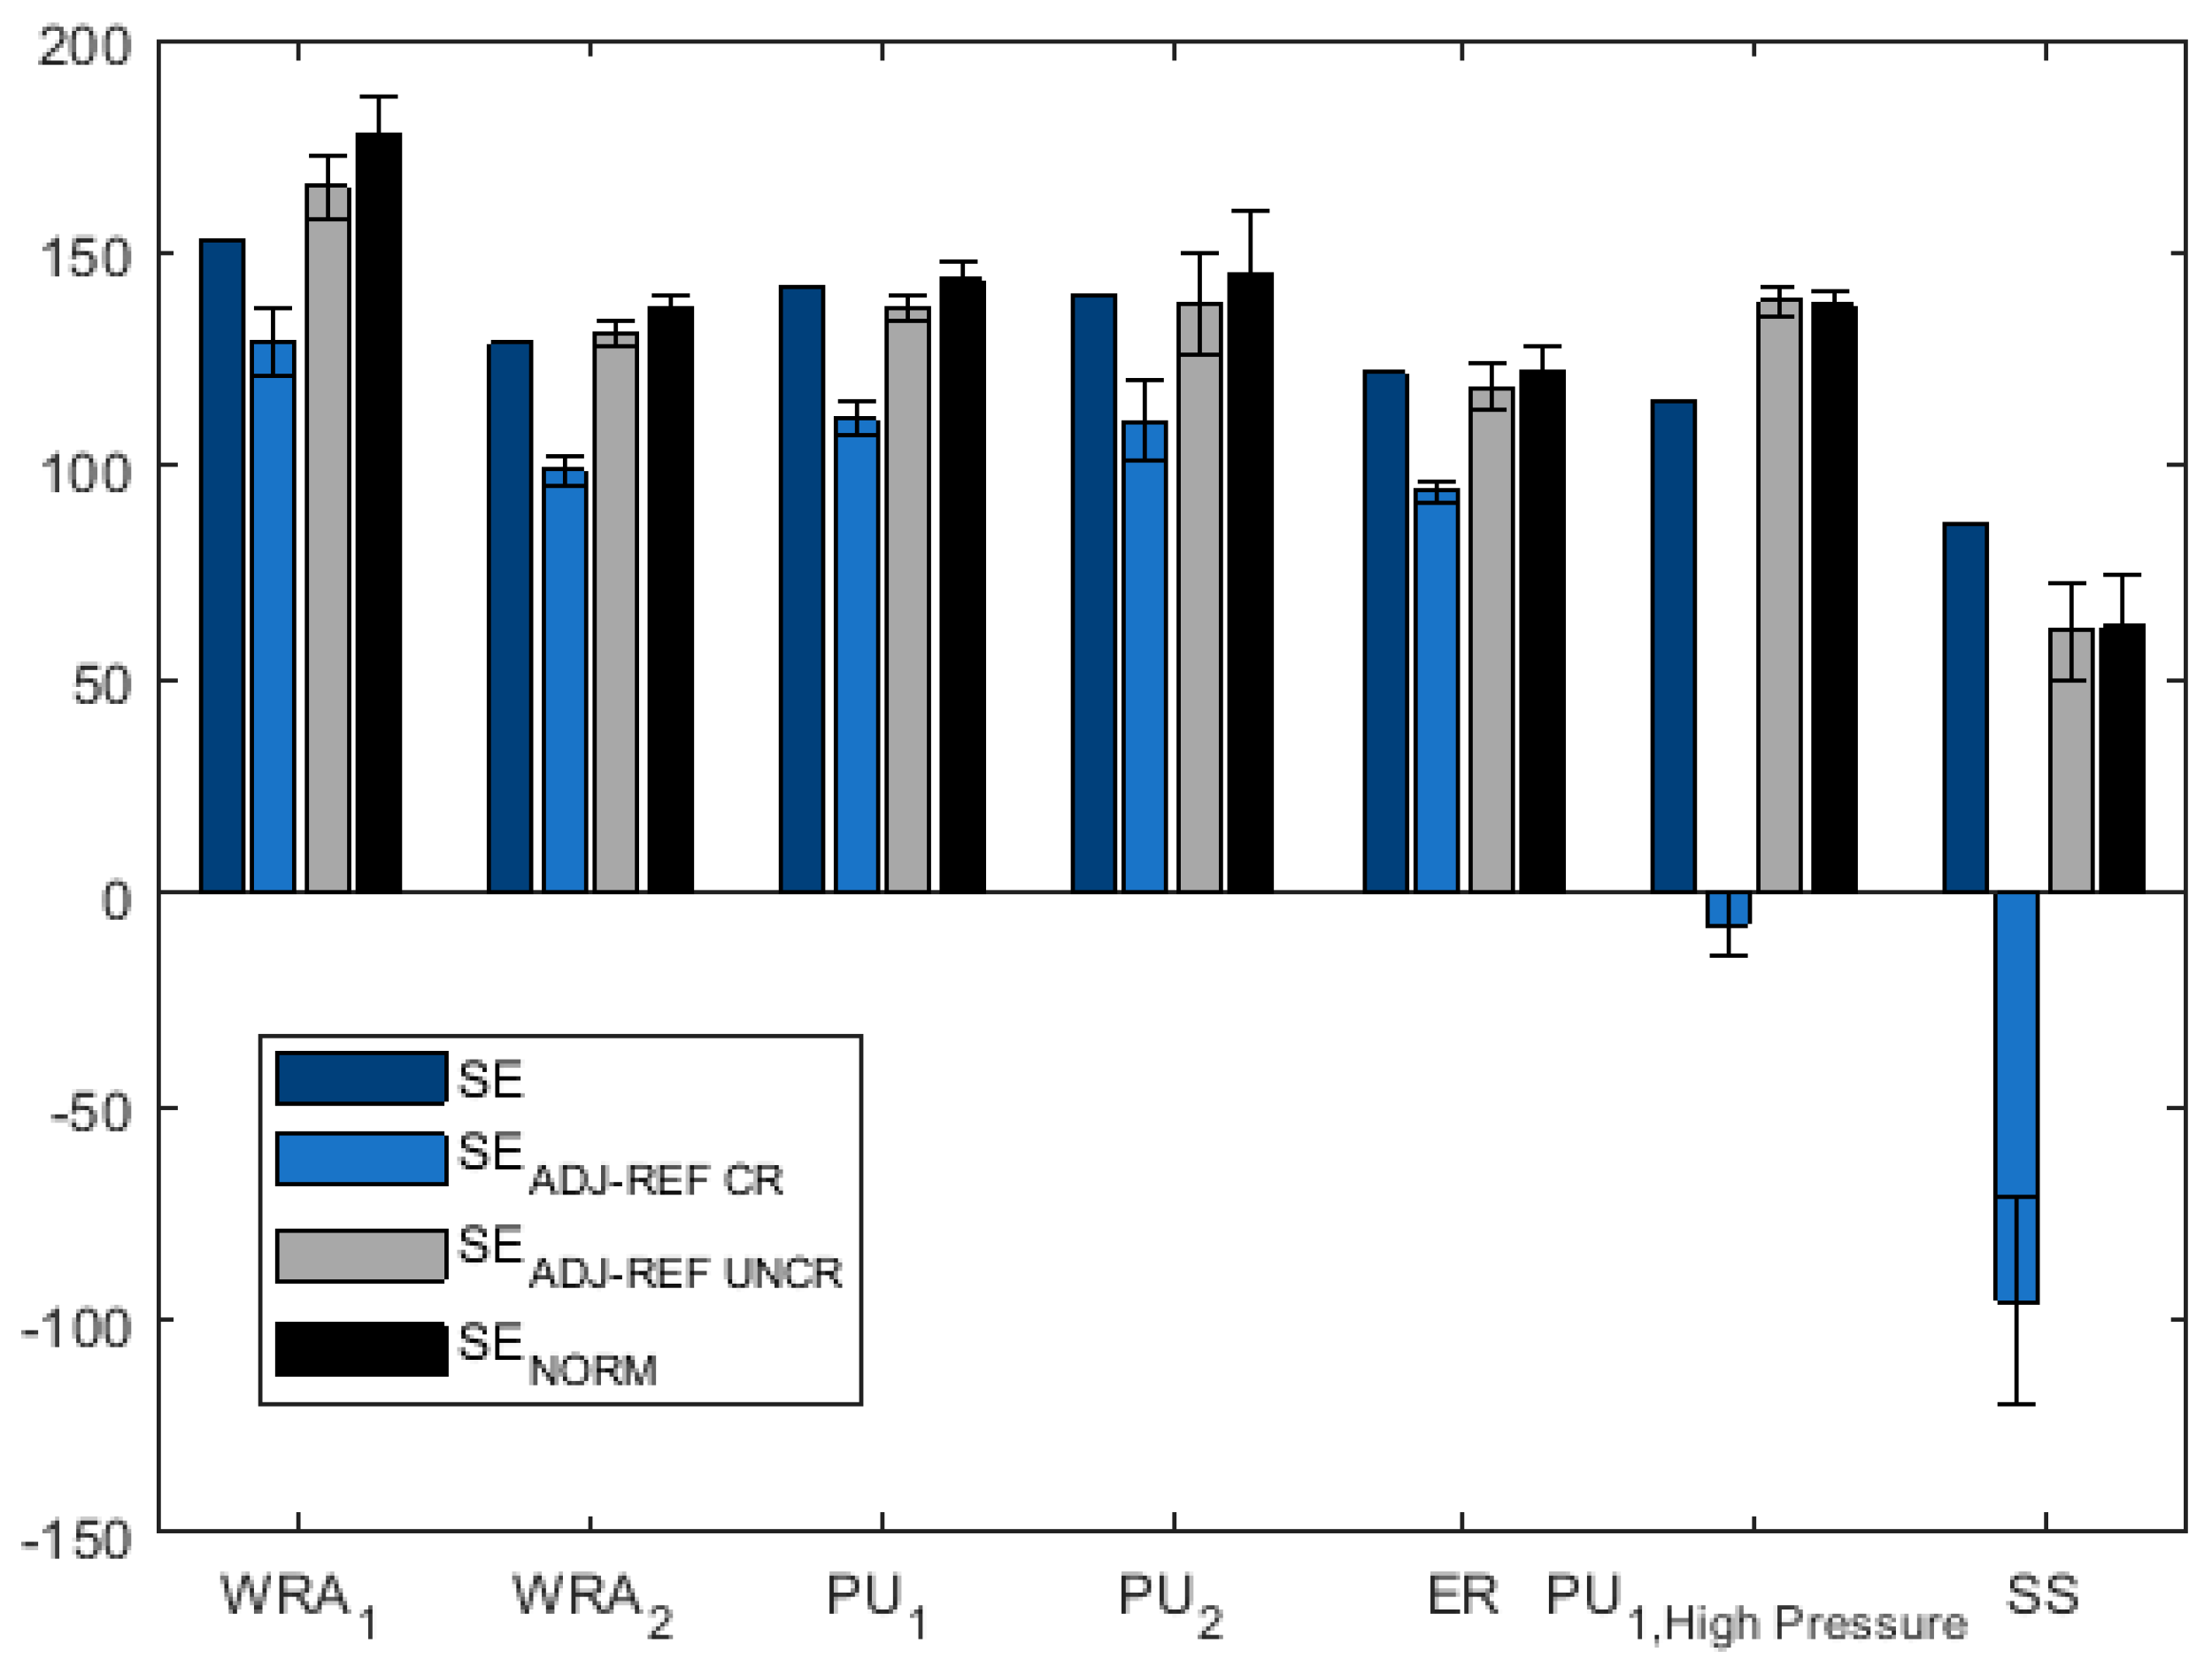
Different methods of calculating the sealing efficiency (SE) are explored in this paper. Typically, it is defined as a percentage by the following equation [
26]:
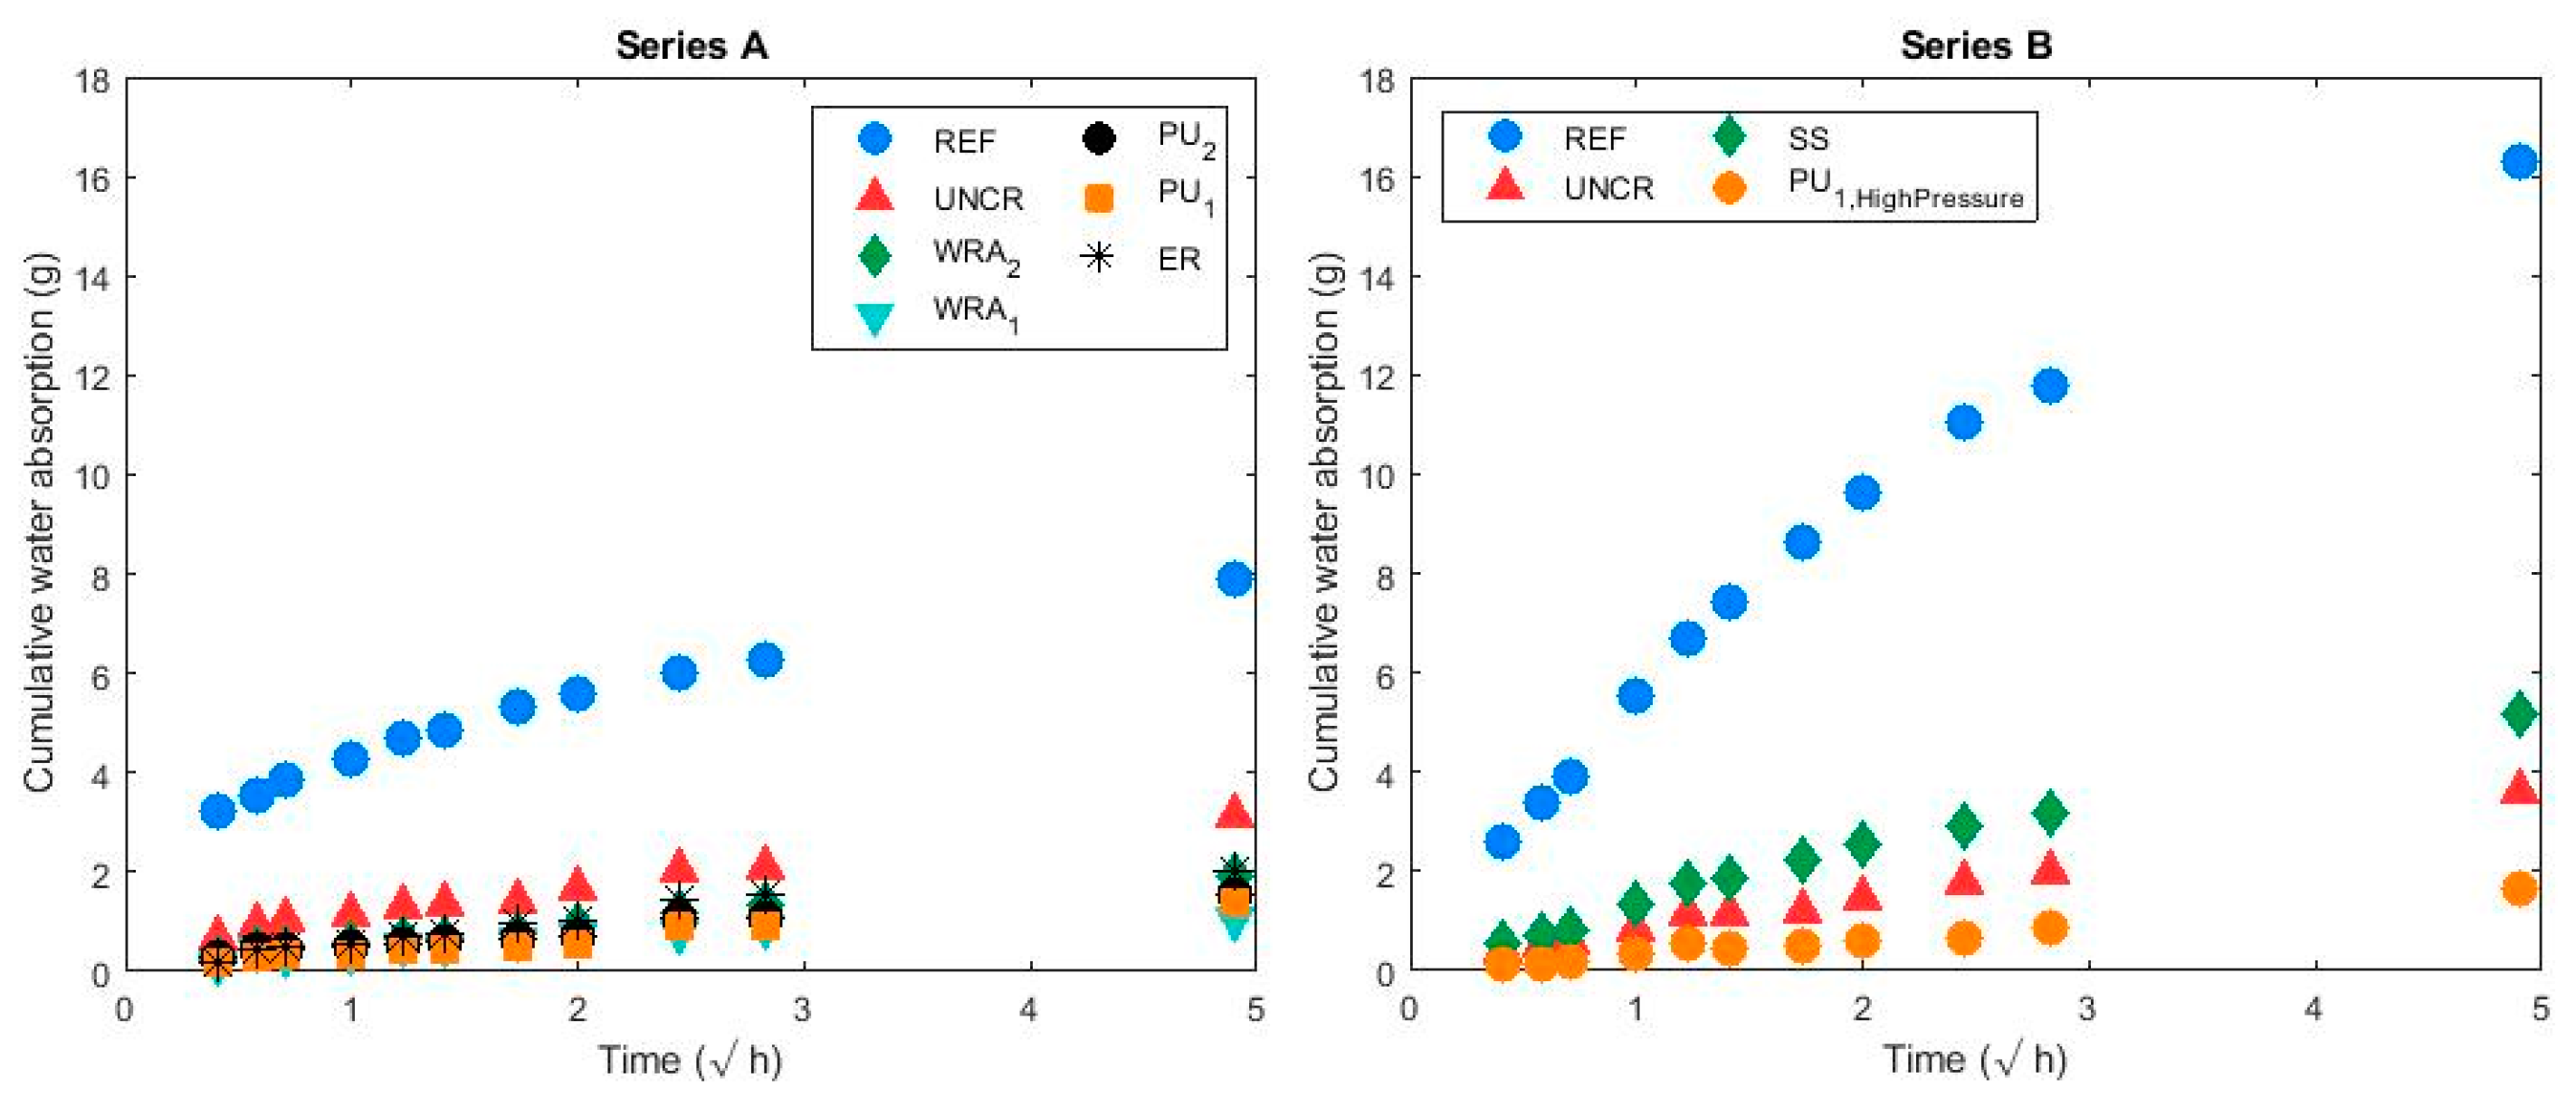
where SC represents a sorption coefficient obtained by the linear slope line for the cumulative mass gain over the square root of time graphs; all values for this equation would be taken from the second water absorption test.
represents the average SC of the cracked reference series (g/√h),
represents the average SC of the uncracked reference series (g/√h) and
represents the average SC of the healed specimens (g/√h).
Since performing two water absorption tests (one before and one after healing) allows for a comparison of unique individual samples before and after healing, an adjustment in the sealing efficiency calculation can be done. For this study, two groups of samples (A and B) were included to (1) allow for a longer curing period for the sodium silicate specimens, (2) investigate the effect of a longer drying period on the sealing efficiency calculations, and (3) verify that pumping a healing agent at a higher pressure to flush out the networks would not negatively impact the sealing and healing efficiency. Series A included samples healed with PU1, PU2, ER, WRA1 and WRA2. As mentioned previously, the drying period prior to each capillary water absorption test was 10 days. Series B included samples healed with SS and PU1; PU1 was flushed out at a pressure of approximately 6 bar. For Series B, the drying period for the first water absorption test was 10 days, and for the second test it was 40 days.
Since a difference in sorption coefficients was observed for all samples between the two water absorption tests, a correction factor would be needed to calculate the sealing efficiency more accurately when two tests are performed. The second sealing efficiency calculation is proposed in Equation (2) as SE
ADJ-REF CR (%), which uses SC values from the first water absorption test, but incorporates a linear adjustment factor
in the SC
Healed, 2nd test value based on the change with time in average SCs for the cracked reference samples:
where SC
Unhealed, 1st test represents the SC for an unhealed sample during the first water absorption test (g/√h), SC
Healed, 2nd test represents the SC during the second water absorption test (which is performed after the sample had been healed (g/√h)), SC
REF CR, 1st test represents the average SCs of the cracked reference specimens during the first water absorption test (g/√h), SC
REF CR, 2nd test represents the average SCs of the cracked reference specimens during the second water absorption test (g/√h) and SC
REF UNCR, 1st test represents the average SCs of the reference uncracked samples during the first water absorption test (g/√h).
Equation (3) is similar to Equation (2), but uses the difference between the SCs of the uncracked specimens
to adjust the SC
Healed, 2nd test value rather than the cracked specimens to investigate its suitability as a correction factor:
where SC
REF UNCR, 2nd test represents the average SCs of the reference uncracked samples during the second water absorption test (g/√h).
An additional correction method would be to normalize the sorption coefficient values rather than reduce them by a linear factor. Equation (4), SE
NORM, is similar to the original equation to calculate sealing efficiencies (Equation (1)), except that each SC is normalized by the average SC of the uncracked samples for the same test (i.e., the SC
unhealed values would be normalized by the SC
UNCR from the first water absorption test, and SC
healed values would be normalized by the SC
UNCR from the second test).
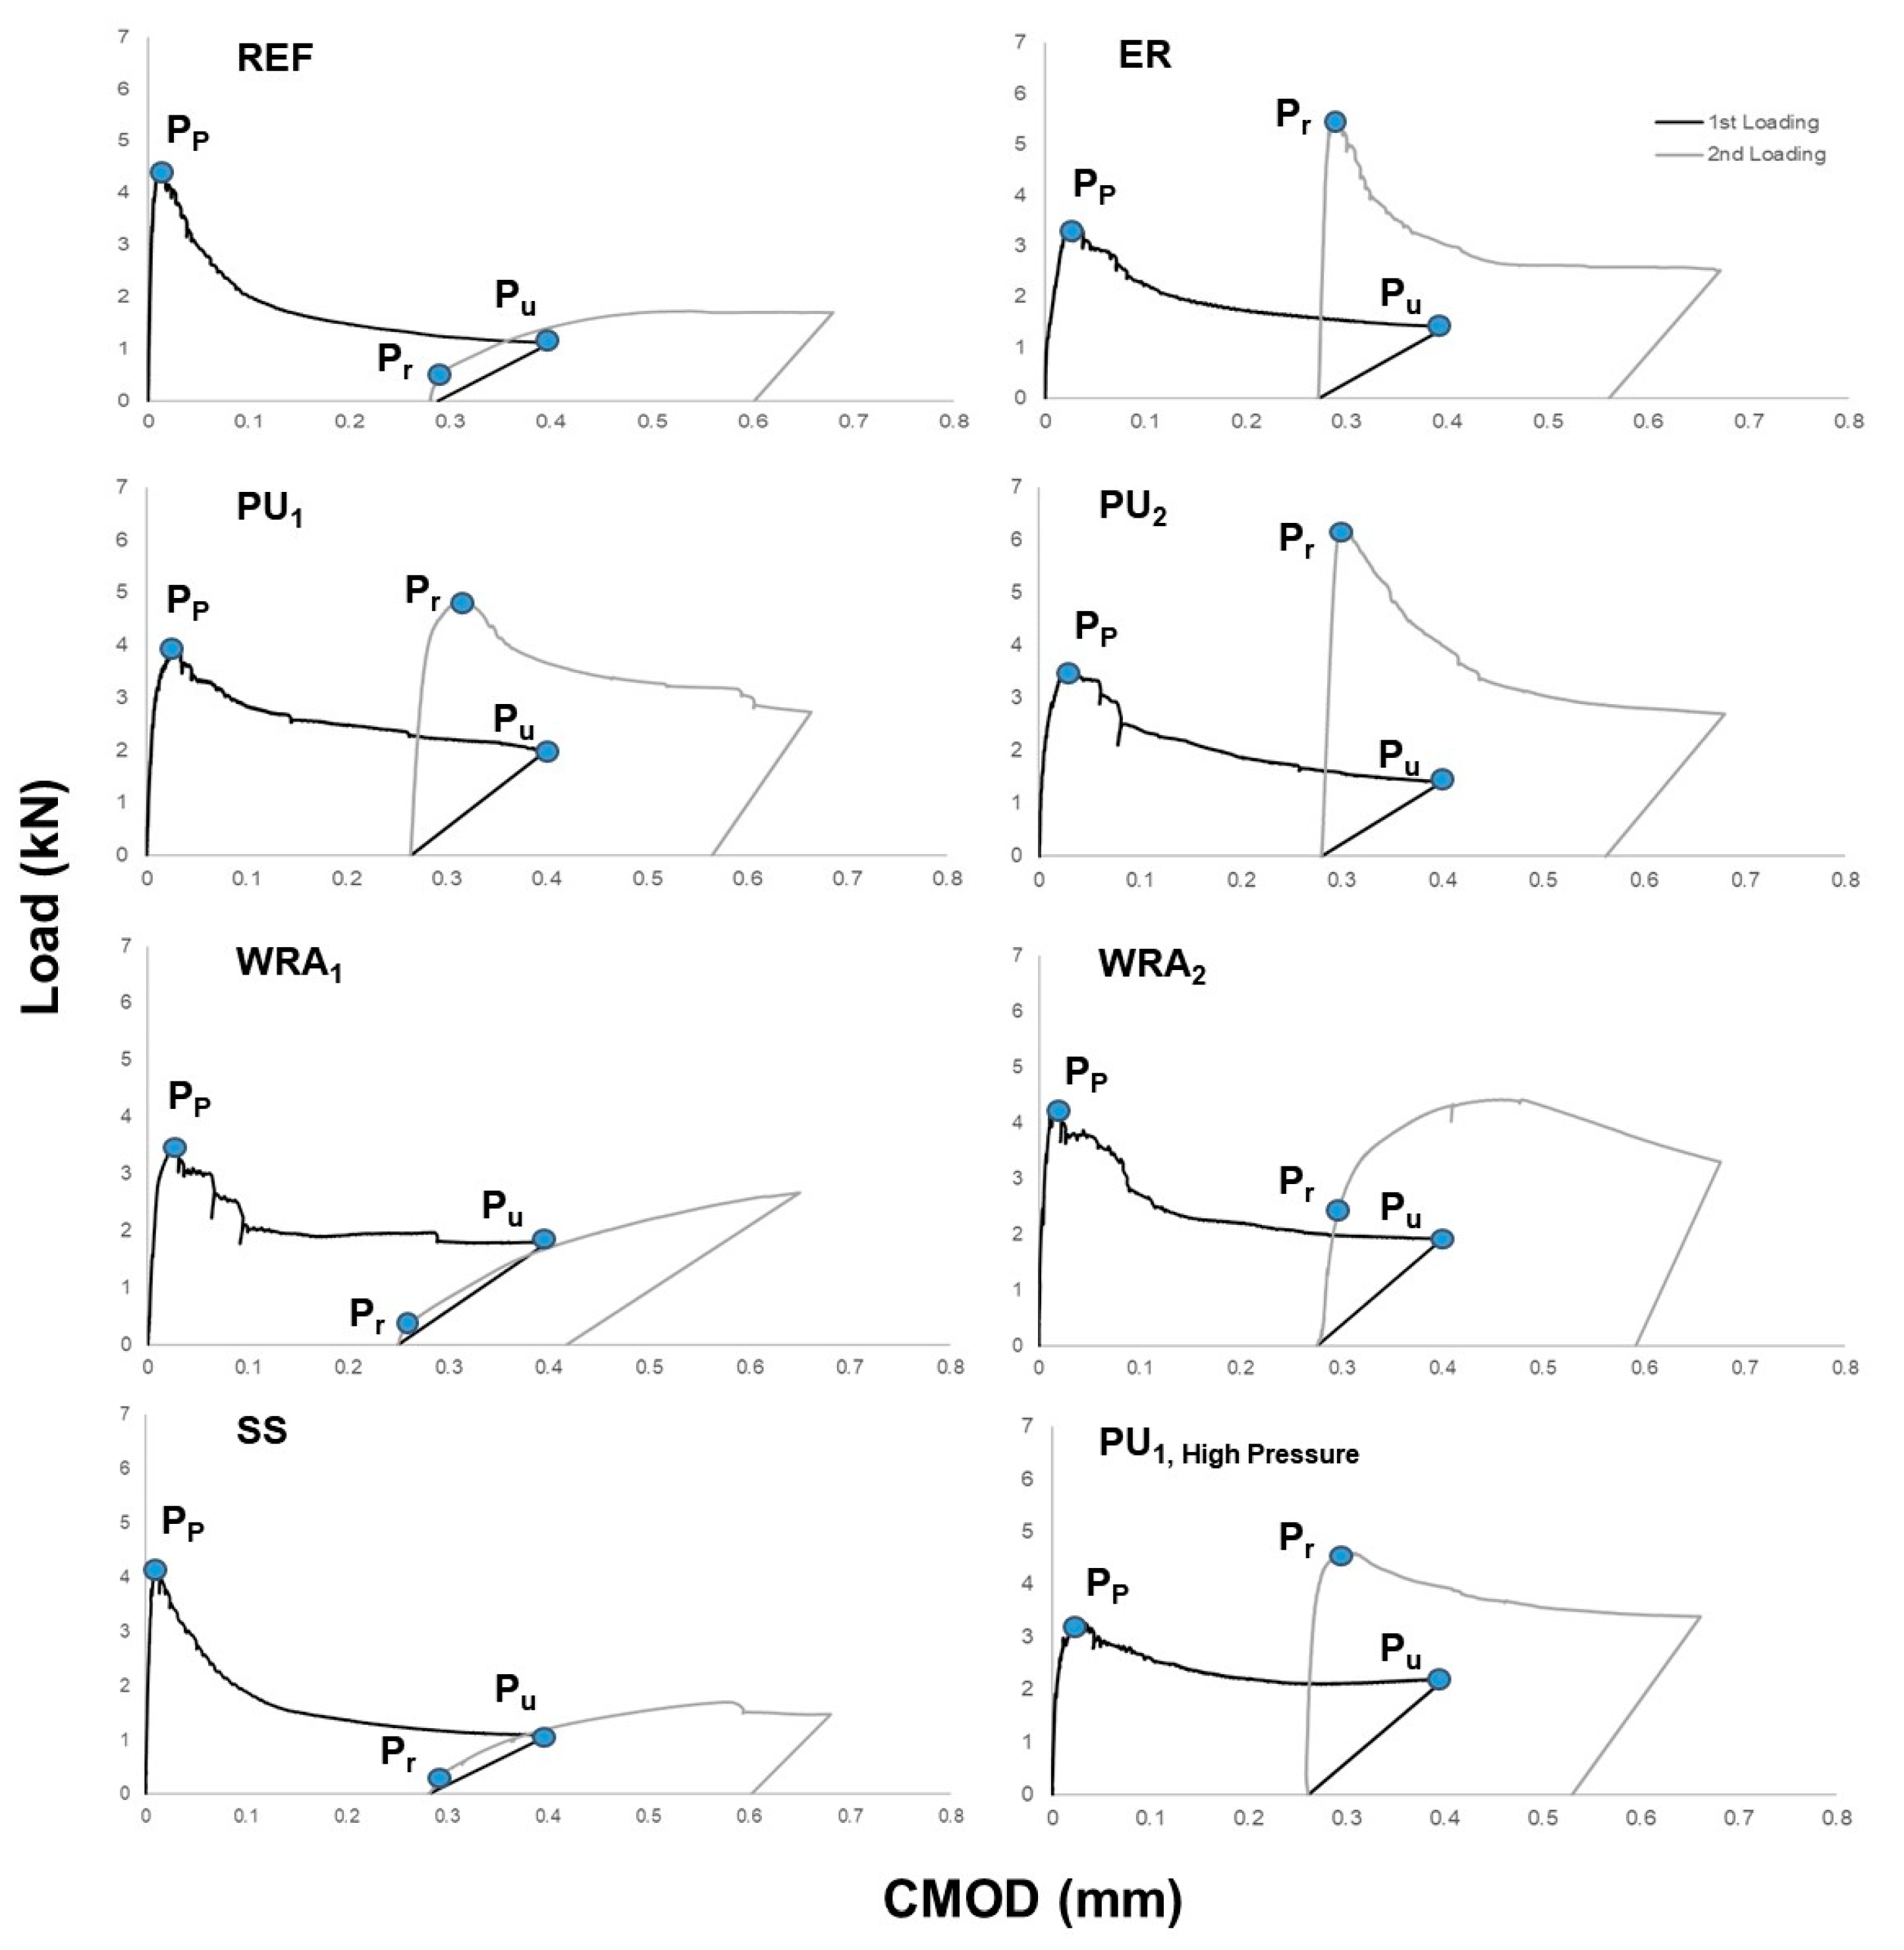
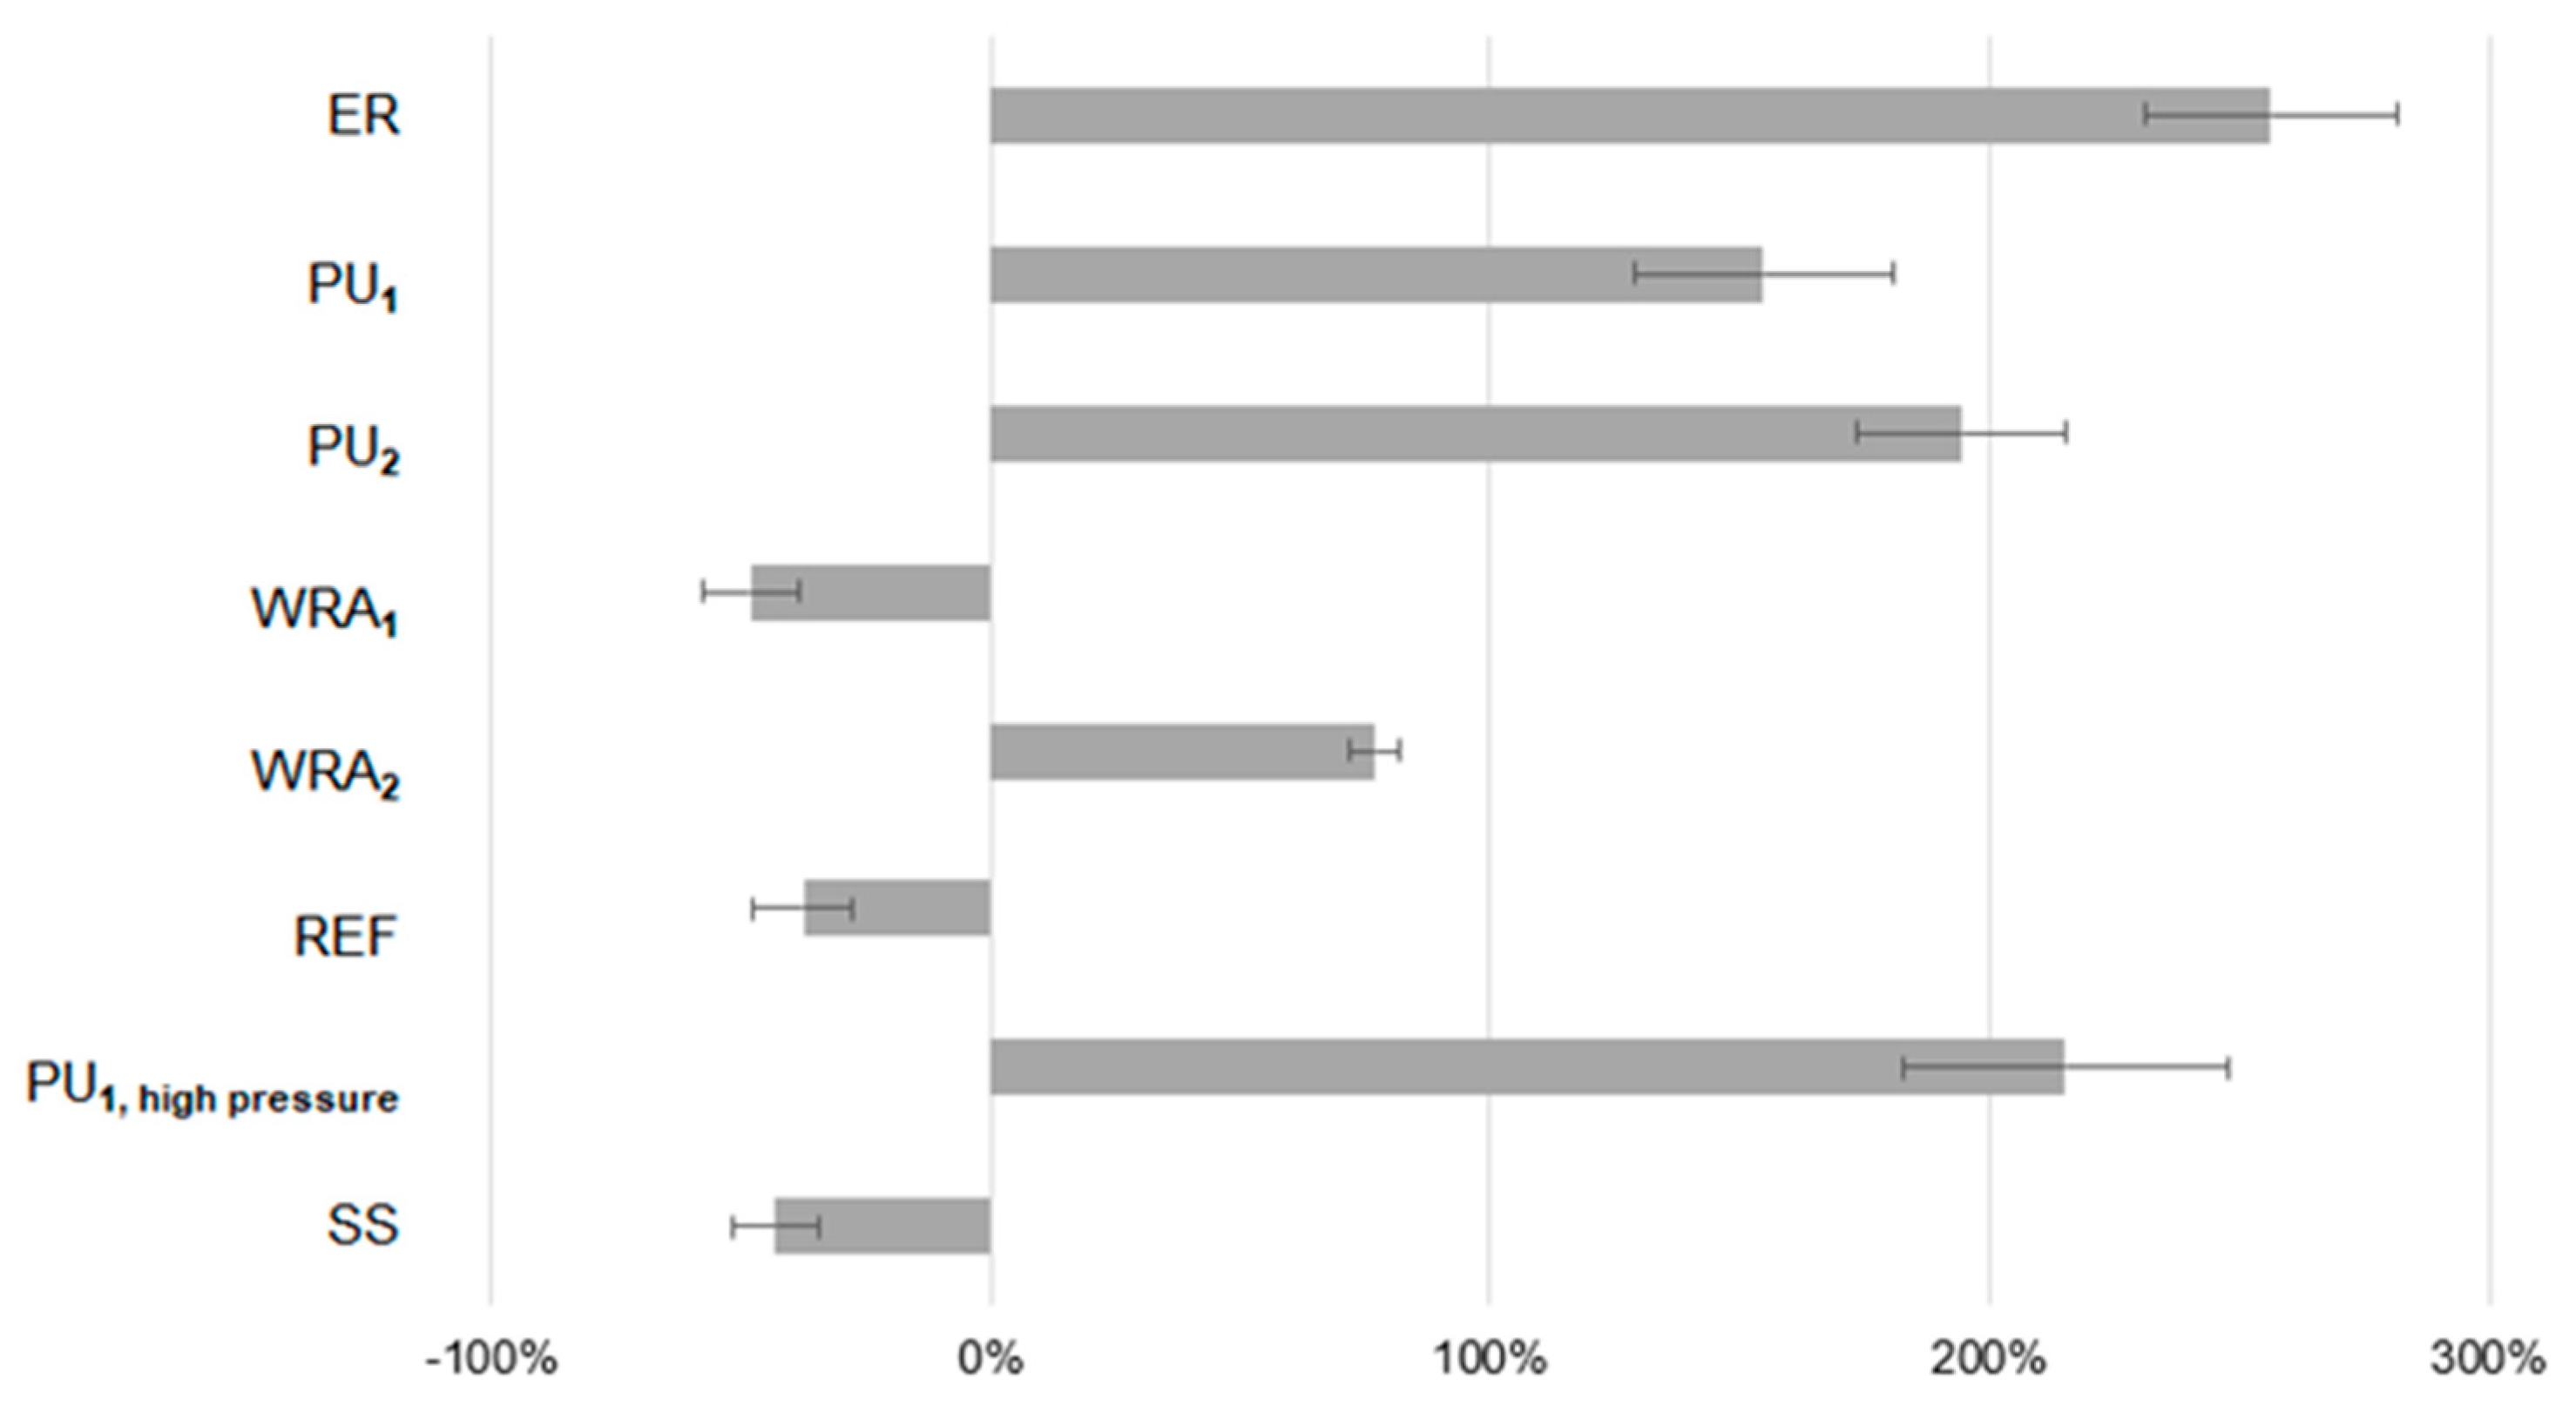
The recovery in strength was evaluated by a load regain index (LRI) defined by [
31,
32] as:
where P
r (kN) is the peak (maximum) load attained during reloading, P
p (kN) is the peak load during the first loading and P
u (kN) is the residual load obtained at the moment of unloading during the first loading cycle. If no clear peak was achieved upon reloading, P
r was taken to be the load at the point along the curve where the slope started to reduce (illustrated graphically in
Section 3.2).


