1. Introduction
Public transportation (PT) plays an important role in the promotion of sustainable mobility in urban areas [
1]. Many statistics have proven that more and more people live in urban areas: in 2018 more than 50% of citizens lived in big cities and their suburbs, by 2050 this proportion is expected to increase to 68% [
2]. Despite of this, the number of private vehicle (PV) users has increased, resulting in traffic congestion, accidents and various environmental issues [
2].
Previous studies mostly focused on PT users [
3,
4,
5,
6] and non-users [
7] in evaluating public transportation service quality. However, an understanding of the perception of PV users is also required (at least perception of who have some knowledge about public transport services quality) [
8,
9,
10,
11].
Several developed countries, for example, Germany and Japan, strongly support urban PT as a main transport mode, because it plays a significant role in the movement of citizens in a more environmentally friendly manner compared to PV transport [
12]. Another study concluded that encouraging PV users to move toward PT needs service planning, new policy, and infrastructure improvement [
12]. For instance, during the COVID-19 pandemic in Budapest, Hungary public transport usage has greatly declined [
13].
Researchers have used public transport satisfaction surveys to increase the number of PT customers [
14]. Another study found that the perception of service quality is the main driver behind enhancing PT service quality [
15]. In addition, literature has explored the relationship among service quality aspects [
6].
However, the interrelationship among service quality attributes is a complicated topic [
2]. Furthermore, it is limited, especially within Eastern Europe. Thus, more research is still needed to add the existing knowledge [
13,
16,
17]. For instance, some scholars have recommended the examination of new interrelation theory among service quality attributes in different contexts [
18].
In addition to these limitations, examining the relationship between public transport service quality and social demographic characteristics is crucial for PT service providers [
19,
20]. Both gender and age groups are the main factors that impact on the behaviour of passengers [
21].
Consequently, a more accurate understanding of the service quality attributes has been suggested as a future research area to improve Budapest PT and attract more private vehicle users, and this has been the core objective of this research [
13,
16].
So far, scholars have applied various different techniques such as, Importance Performance Analysis (IPA) [
22], structural equation modeling (SEM) [
4,
23,
24], partial least squares–structural equation modeling (PLS-SEM) [
25,
26,
27], discrete choice model (DCM) [
5,
8,
28], and multi-criteria decision making (MCDM) groups [
29], Bayesian Network (BN) [
6,
18,
30]. SEM has been successfully applied to examine the relationships between variables [
31]. This paper applied PLS-SEM the selection of which is based on different criteria, including nature of the research, type of data, sample size and gap analysis.
There is a general agreement for increasing the number of PT users and striving to reduce the number of PV users. Finding the main attribute that affects people satisfaction and contributes to attracting PV users to PT users is an important consideration for researchers and authorities, since providing a high quality of service is essential to encourage PV users to increase their utilization of public transport [
32]. However, it is not always guaranteed to contribute to satisfying people [
33].
Concerning the shortages discussed in the literature, this study aims to fill the gaps using empirical data from a PV user’s perspective to contribute in the following ways:
Applying an effective PLS-SEM approach to test, analyze, and develop three new service constructs for use during COVID-19 which take account of practical implications [
13].
Discover the interrelation between perceived service quality and satisfaction regarding public transport service performance, from the private vehicle usage point of view, which has been recommended recently [
16,
17].
Investigate the differences in perception between men and women, as well as among different age groups, as suggested in the literature [
16,
30,
34,
35].
Finally, this study can help transport service providers to identify and improve the specific issues among different service attributes, especially during the COVID-19 pandemic. The remainder of this article is organized as follows:
Section 2 provides the theoretical background and hypotheses development. The analysis methods and survey design are presented in
Section 3, followed by the results in
Section 4. The discussions and implications are presented in
Section 5. In the last section, concluding remarks are drawn and some recommendations are made for future study.
2. Literature Review and Research Hypotheses
In this section the details of selected methods and three main aspects (perceived service quality, accessibility, safety and security) are described based on theoretical background.
In light of previous studies to examine PT service quality, structural equation model (SEM) has been applied for analyzing the causal relationships between service quality and satisfaction [
23]. Naturally, the SEM was divided into covariance-based applications (CB-SEM), using AMOS and those using partial least squares structural equation modeling (PLS-SEM) using SmartPLS 3.0 [
31]. Much consideration was given to the use of PLS-SEM which is widely used in different social science studies, for example in business, market studies, education, and tourism [
31,
36], and in construction management [
37]. In addition, PLS-SEM has been applied in transportation planning research and analysis of the heterogeneity [
25,
38]. A review article concluded that PLS-SEM has a significant role in operation research [
39]. This method is capable of providing a higher level of statistical robustness even with a small sample size [
31,
40,
41]. Additionally, PLS-SEM does not require normally distributed data [
42]. A recent comparison study between CB-SEM and PLS-SEM found that both techniques are applicable in social science, however, CB- SEM requires normal data in a distribution [
43].
PLS-SEM is a non-parametric approach, it works with ordinal and scale data. Moreover, PLS-SEM is used as an alternative technique to CB-SEM, because the PLS-SEM technique can deal with both reflective and formative models. Conversely, CB-SEM can only deal with reflective models [
26,
44]. Regarding the analyzing of heterogeneity and using segmentation, methods such as structural equation model-multi-group analysis (SEM-MGA) have been used between two groups [
27]. Structural equation model–multiple indicator multiple cause (SEM-MIMIC) ordinal Probit was proposed to investigate the heterogeneity of perception of passengers [
45]. A study revealed that the traditional SEM methods can only show the heterogeneity partially and unobserved heterogeneity (e.g., by age or gender) cannot be accurately examined [
46]. On the other hand, other research stated that applying the finite mixture partial least squares (FIMIX-PLS) methodology can be suitable for transport operators, as this technique considers different segmentations and contributes to a more specific intervention [
38]. Thus, the current study performed a rigorous PLS-SEM method and PLS-MGA for private vehicle users who have knowledge about PT service quality.
Service quality is one of the main predictors of satisfaction [
47]. Recently, customer satisfaction linked to perceived PT service quality, accessibility and safety has been widely studied which is important in understanding the cause-and-effect relationship towards sustainable transport [
45,
48]. Traffic externality issues (i.e., noise, environmental pollution) may be exacerbated by excessive usage of PVs and less use of PT [
49,
50,
51]. Therefore, the main aim of transport operators and service providers is to increase the accessibility and safety for PT passengers [
52].
In order to achieve the aim of service providers, further study is required, because some concepts are still hidden and it may be inaccurate to generalize the results [
2,
53]. Further, the concept of service quality and satisfaction are analyzed differently [
25,
47]. There is a general agreement between scholars that examination of PT service quality by considering the perspective of PT passengers is an appropriate method for transport service providers [
28,
54,
55,
56]. Although, several studies in practice identified and suggested differences between satisfaction and perceived service quality, both of these terms are used interchangeably because they relate to the perception of the individual. For example, the judgment for service quality is quite specific, but the judgment for satisfaction is more general. Previous research argued that the perceived service quality influences the examination of satisfaction level [
57]. Further studies claimed that where an assessment suggests improvement of perceived service quality this also results in improved satisfaction [
58,
59]. Based on the above discussion, perceived service quality was hypothesized to influence PV user satisfaction as follows:
Hypotheses 1 (H1). Perceived service quality has a positive effect on the satisfaction level of private vehicle users.
Many studies agreed that working together is crucial for the development of sustainable transportation that is more accessible to those people with physical or other impairment problems [
1]. Some scholars mentioned that the objective of transport operators is to provide a service which facilitates easy movement for disabled people and provides an accessible connection between land use, transportation movement and potential interactions, [
60,
61,
62]. Another author showed that accessibility has a crucial influence on individual choice [
63]. In addition, another study found that the accessibility attribute can determine the impact of the transport network [
64]. However, there are few practical studies that have investigated this topic [
52]. As a result, the following hypothesis of relationships between perceived accessibility and PV passenger satisfaction is proposed:
Hypotheses 2 (H2). Perceived accessibility has a positive impact on the satisfaction of private vehicle users.
Looking at the terms of safety and security, perceptions of both safety and security are measured as critical issues that strongly impact public transport users [
27]. Many studies concluded that the perception of safety is a major factor contributing to PT customer satisfaction [
65,
66]. Furthermore, another study claimed that safety can be achieved by providing reliable service, including professional staff, and cleanliness and comfort inside the vehicle, however, where public transport has lower quality of service this probably increases risk and negatively influences feelings of personal safety [
52]. In the papers of the European Commission, the security issue is related to three major problems: safety from both crime and accidents, and the perceptions of citizens in terms of security [
27,
67]. Some researchers have used safety and security with all quality indicators [
66,
68]. However, another study utilized the aspects separately to assess the service quality of public transportation [
69]. According to a report on crime concern for the United Kingdom department of transport approximately 10% of citizens would reconsider using of public transport if their safety fears could be addressed [
70]. Consequently, increasing PT safety (for example by achieving a reduced number of crimes and likelihood of accidents) is crucial to attracting more passengers to use public transport [
71]. Thus, based on the facts in the literature we propose the following hypothesis to address this gap, especially during the COVID-19 pandemic.
Hypotheses 3 (H3). Perceived safety and security are positively related to private vehicle users’ satisfaction.
Figure 1 shows the theoretical framework for the research model which is proposed by the authors. The authors expect that perceived service quality, accessibility, safety and security will contribute to satisfaction of PV users. Hence, in the current study, three hypotheses are formulated for these relationships.
3. Materials and Methods
Due to the complexity of the proposed model, partial least squares-structural equation modeling (PLS-SEM) was employed for data analysis in this study. Several benefits and motivations are mentioned in the literature, suggesting that PLS-SEM well suited for exploration in this research. As a result, SPSS 24.0 and SmartPLS 3.0 were used to analyze the data. A systematic procedure for data analysis included demographic information, measurement model evaluation, assessment of the structural model and, finally, the heterogeneity analysis between different groups.
3.1. Analysis Methods
The PLS-SEM approach contains principal component analysis with ordinary least squares regression, to examine the association between manifest (observed) variables and latent (unobserved variables). The PLS path model is described by two models as follows [
72,
73]:
Equation (1) presents the reflective measurement, in which each manifest variable (MV) is related to the latent variable (LV), which is represented by simple regression, where X
h is the manifest variable, π
h is the loading corresponding to the manifest variable; ξ is the latent variable to which the manifest variables (X
h) are related, and ε
h is the error term.
Equation (2) shows a formative measurement, which assumes that the latent variable is generated by manifest variables. Thus, the latent variable is a linear function of its manifest variables plus a residual term, where Wh is the weight corresponding to (MV) and δ is the residual term.
- 2.
The structural model (also referred to as the inner model): This model illustrates the interrelationships among the constructs, which can be dependent (endogenous) or independent (exogenous) variables, by determining the path coefficients. Thus, the PLS-SEM model is illustrated in Equation (3):
where ξ
j is the jth unobserved variable with ‘i’ number of unobserved variables; β is the regression coefficient term for unobserved variables; v
j is the error term related to ξ
j [
6].
As we have shown previously, this study performed PLS-SEM to test the proposed model as presented in
Figure 1. To analyze the model, SmartPLS 3.0 was utilized, as an appropriate software for analysis of both formative and reflective models which was developed by Christian M. Ringle, Sven Wende, and Jan-Michael Becker [
74]. Additionally, the nature of the study is explanatory, thus, PLS-SEM has been fitted for the analysis [
75]. For PLS-SEM, as presented in a review article, the minimum sample size is determined by the 10 times rule
’ as proposed by Barclay in 1995 [
76]. On the other hand, it has also been recommended to use G*Power to determine the sample size [
76]. The calculation process to identify the sufficient sample size was performed at a 5% level of significance and 80% power with 0.15 effect size and a maximum of 3 predictors.
Findings from the power analysis show that a sample size of 77 is required for the proposed model. This confirms that the sample size used for analysis in this research is sufficient. Moreover, to cope with the higher heterogeneity, in the last step, multi-group analysis (MGA) was employed to examine the significant difference between two gender groups (male vs. female) and two different age groups (18–44 vs. ≥45). The segmentation of samples using MGA makes it possible to simultaneously fit the model to data from multiple groups which is in line with Sarstedt’s et al. recommendation [
77]. It is worth mentioning that MGA is a useful method to examine the moderation among various relationships and to find the heterogeneity across groups [
36].
3.2. Sample Design and Survey Location
A comprehensive screening procedure was conducted, as a part of the preparation for data analysis. The data was tested for any potential statistical error, for instance, normality, outliers, missing values common method variance, correlation and multicollinearity test. However, there were very few missing values that were excluded from data analysis. As the regression analysis does not work with missing values, we have to have a complete case analysis. Since we are dealing with 5-Point-Likert scale data, we have not conducted outlier analysis, as it might not make much sense. Moreover, in this study, the analysis data and discuss research results begin with a short explanation of the research case study and socio-demographic characteristics. The survey contains two parts, first a brief description of socio-demographic attributes of participants including their age, gender, income, education level and mobility and second the perception of PV users regarding PT service provided in the area. Additionally, a basic statistical analysis was conducted.
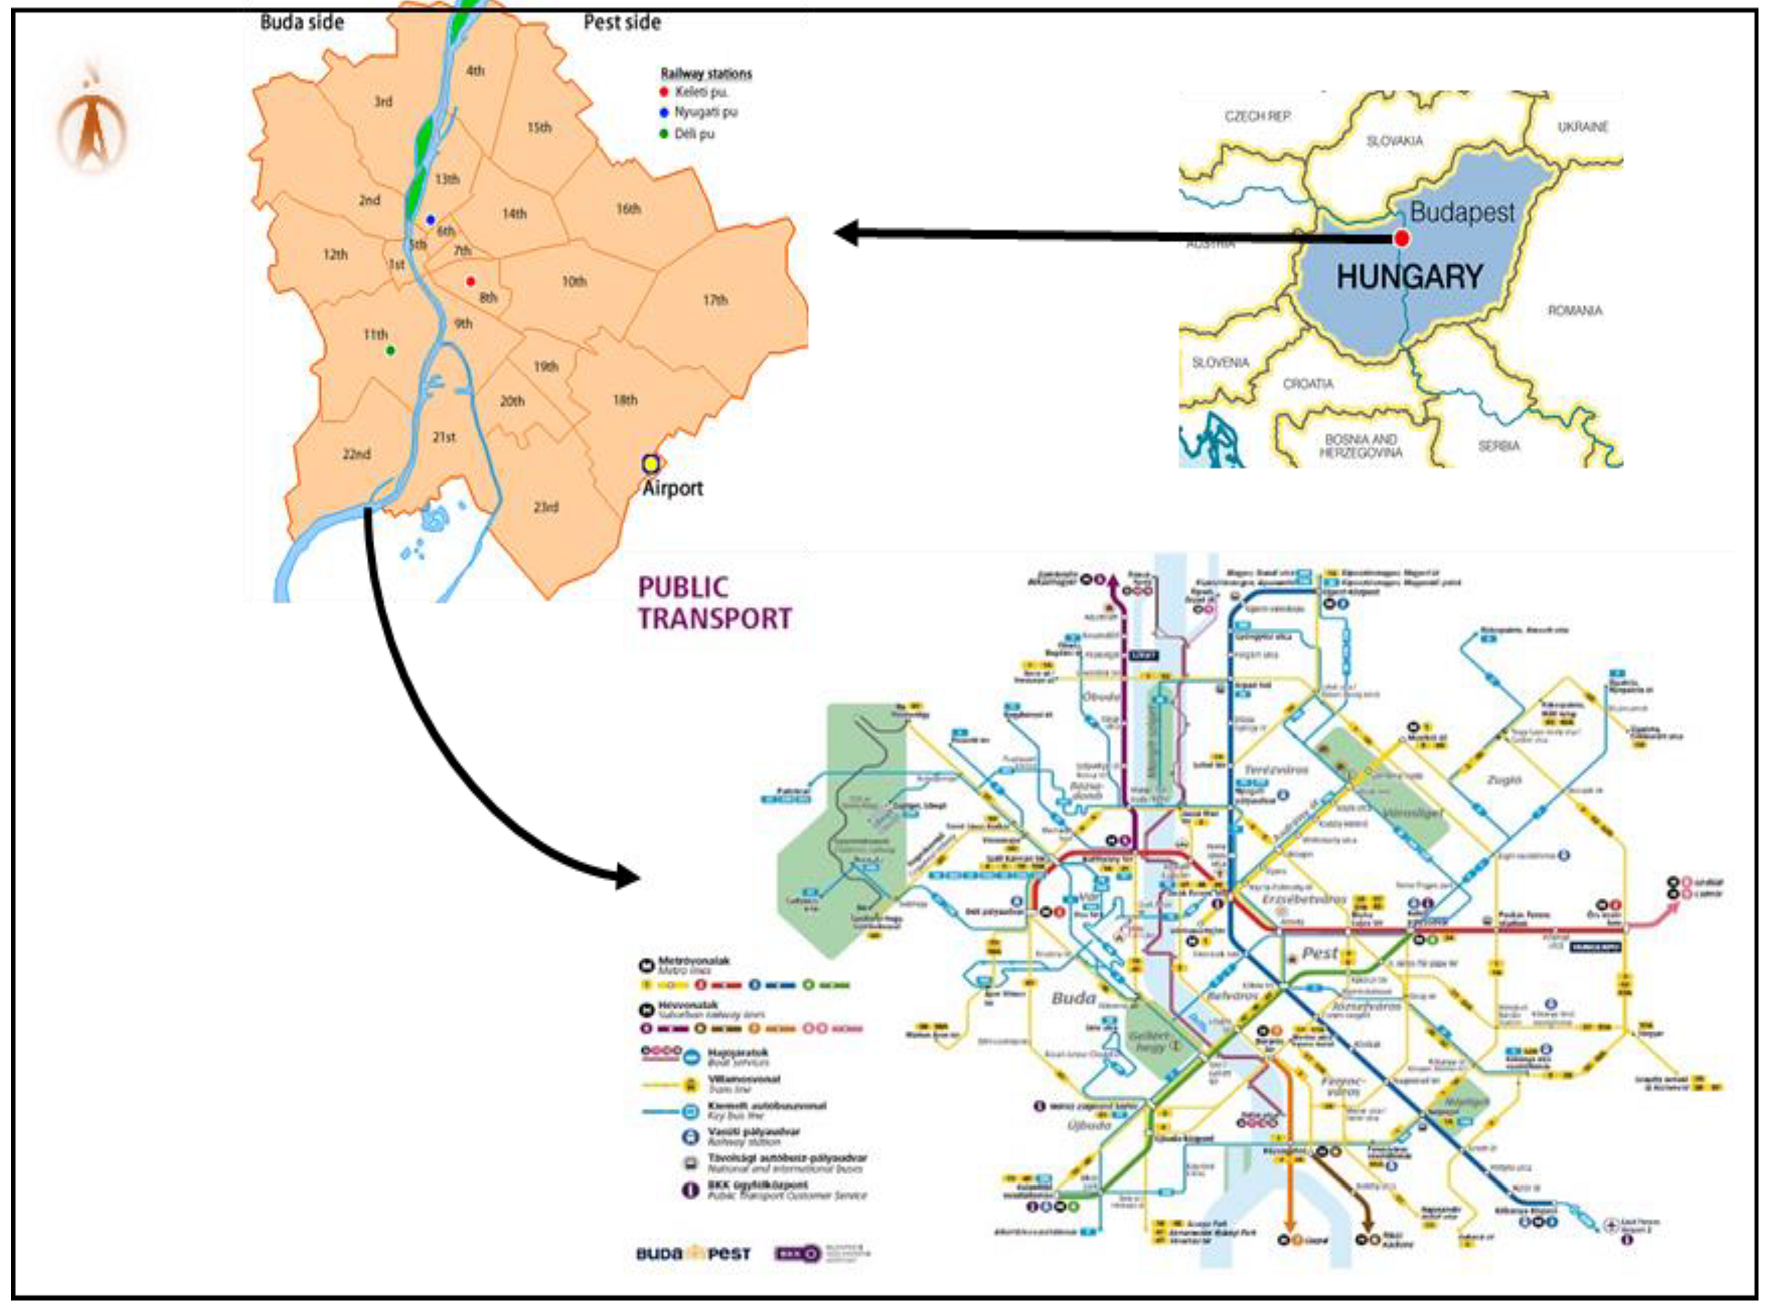
The data on perception of PV users gathered in this study was limited to the capital city of Budapest, Hungary. It is one of the developed and congested cities located in Eastern Europe. Furthermore, according to the Hungarian central statistical office, Budapest city covered an area of 525.2 km
2 with a population of approximately 1.7 million in 2020 [
78]. It is divided by the River Danube into the Buda and Pest parts areas. Budapest city contains 23 districts see
Figure 2, and the data was collected in all districts. The public transportation service is provided by transport operator (BKK) for day and nighttime including metro, tram, bus and train [
79]. Budapest is a hub for business and education in Hungary and, in addition to that, it is an attractive tourist destination within Europe with unique cultural and socio-economic significance. Increasing demand for traveling was a key driver for conducting this study in Budapest city. However, more accurately understanding the service quality attributes recommended to improve Budapest PT and attract more PV users has been the core objective of this research [
16].
The collected data used for analysis in this study were obtained from an online panel and printed questionnaire survey carried out in Budapest, Hungary in October and November 2020 during the COVID-19 pandemic in both English and local (Hungarian) languages.
Table 1 and
Table 2 show details of the survey and characteristics of the data. In this study, the survey targeted a total of 100 private vehicle users without missing values. The PV users were asked to score their perception of the satisfaction level associated with the PT service provided. For this reason, for each service attribute, a 5-point Likert scale ranging from 1 to 5 was utilized (where 1 meant ‘‘very unsatisfied’’ and 5 meant ‘‘very satisfied’’). The survey included male (52%), female (48%); the majority of participants were aged 25–44 (49%), followed by 45–64 (27%), and 18–24 (18%), while only 6% were over 65 years old; and 43% were employed.
Furthermore,
Table 2 illustrates that the majority of participants (66%) earned a low income less than 563,000 HUF, which is equivalent to around 1600 Euro, 23% of participants had an income ranges of 1600–4000 Euro, and only small number of participants (7%) earned a high income. The majority of private vehicle users were educated with a university degree (81%). Regarding the current occupation, the proportion of participants who were employed, students, self-employed, working at home, unemployed or retired were 43%, 32%, 11%, 6%, 5%, and 3%), respectively.
It is worth mentioning that the questions were asked of those people who were familiar with the provided service or at least had some knowledge about the service and were hence in a position to make a valid judgment of public transportation service quality. Thus, many of the participants in the survey (49%) had been living in the area for few years 31% of them had lived in the area for less than one year, and 20% had lived in the area for their whole life.
Table 2 illustrates three main constructs including 14 PT service attributes and 1 item (overall satisfaction). All indicators were obtained from the recent study [
8]. Private vehicle users scored a satisfaction level regarding the PT service of 3.65 which was above the average of the quality-of-service attributes scores (3.39). Service hours and individual space showed the highest average scores (3.92 and 3.92), followed by frequency (3.84) and proximity (3.80). Interestingly, temperature and cleanliness had the lowest average scores (2.48 and 2.68, respectively). For more detail, we have presented several figures to show the distribution of scores for each attribute (see
Figure A1 in the
Appendix A). These figures show that the data is not normally distributed.
4. Results
In this section, we present the initial tests and results of identifying the main attributes that impact satisfaction and movement towards using public transportation from the private vehicle users’ point of view.
4.1. Preliminary Tests
Correlation analysis among independent variables was adopted to verify the degree to which two variables are related. Based on the results in
Table 3 (variance-covariance matrix), it can be seen that service hours (SQ1) have a higher correlation coefficient with proximity and frequency (SQ2 and SQ3, respectively), followed by proximity (SQ2) and frequency (SQ3). In addition, a higher correlation can also be seen between temperature (SS1) and cleanliness (SS2). This suggests that there may be some degree of collinearity among independent variables. However, the findings of the multicollinearity test in
Table 4, show that there is no issue regarding multicollinearity of data because the variation inflation factors (VIFs) for almost all variables are less than or equal to 5 which is the recommended cut-off value [
80]. In addition to that, the VIF value in PLS-SEM was also assessed for further investigation. Results between 1.81 and 1.95 were obtained at factor level, which is less than the suggested threshold value of 3.3, indicating there is no method bias with the data [
81].
4.2. Common-Method Variance Bias Test
From the methodological issues, the common method bias refers to measurement error. For instance, having a common measurement scale (e.g., 5-point Likert scale) for all survey questions may lead to common method bias. In this study, to identify the likely presence of common method variance bias among variables, we utilized Harman’s single factor test, which is widely used. This involved entering all items of the measurement scale into a principal component analysis. The total variance explained by the single factor is only 47.5% which is below the recommended cut-off of 50%. Based on this result, in this research, the common method bias is not a problem, and the collected data is suitable for further analysis.
4.3. Assessment of Measurement Model
The reliability and validity were tested by using Composite Reliability (CR) to evaluate internal consistency and Average Variance Extracted (AVE) to assess convergent validity [
82,
83].
Table 5 shows that the assessment applied in this model is reliable [
82,
83,
84]. The AVE of all latent variables was > 0.5, indicating high convergent validity among constructs.
The first step, Fornell-Larcker criterion was performed to find the discriminant validity, the results are shown in
Table 6. Recently, the Heterogtrait-Monotrait (HTMT) ratio correlation has been introduced for assessing discriminant validity [
85], the outcomes presented in
Table 7 that are below the threshold of 0.85.
In summary, according to the results presented here, discriminant validity has been established. Thus, the measurement model is reliable and valid.
4.4. Structural Model
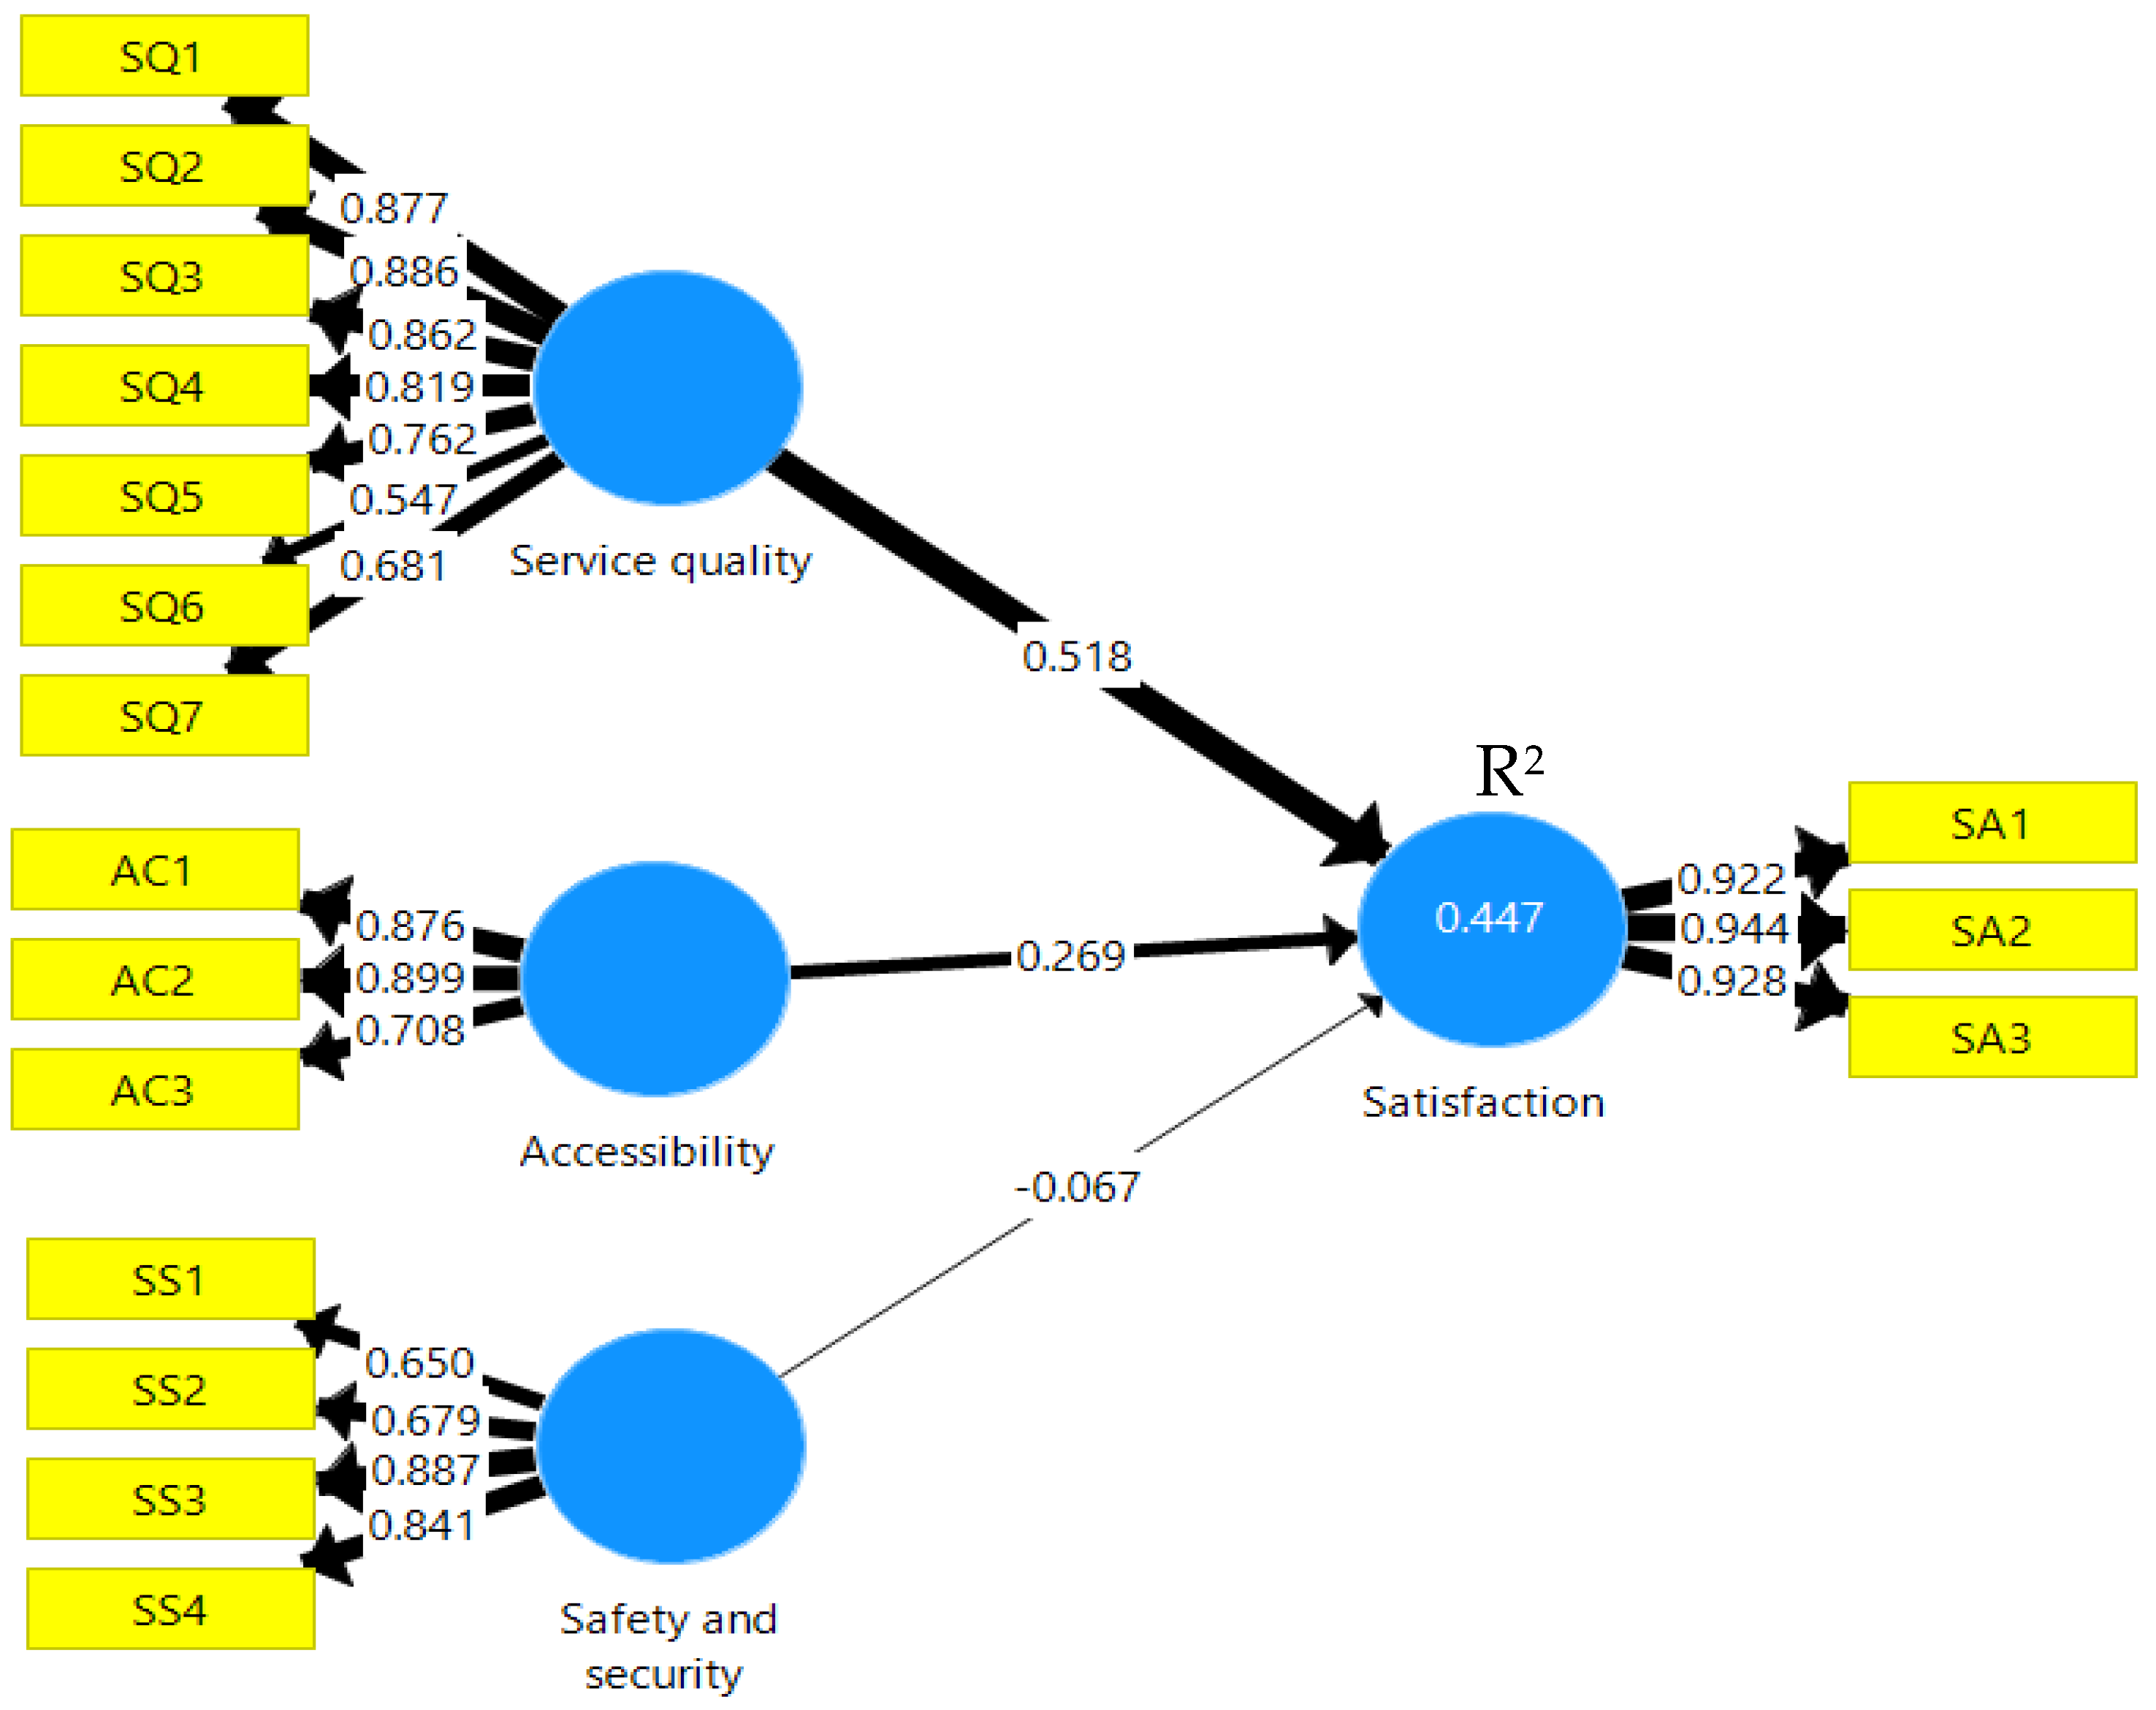
Having established reliability and validity in the assessment of the measurement model, the structural model was applied using the bootstrapping technique with 5000 subsamples. The objective was to examine the relationship between dependent (endogenous) and independent (exogenous) variables, and also to test the significance of path coefficients (β-values). The assessment of PLS-SEM includes path coefficients to evaluate the significance of structural model relationships, R
2 value is estimated the model is an accuracy, and f
2 to assess the significant impact of the independent variable on a dependent variable [
83]. The findings of the path model are displayed in
Figure 3 and
Table 8.
The value of R
2 in
Figure 3 indicates that the PV customers’ satisfaction has 44.7% of explanatory power with R
2 = 0.447 which is considered as a moderator [
82]. Moreover, as the results in
Table 7 show, that the service quality (β = 0.518; t-value = 4.079;
p-value = 0.000) is significant predictor of PV users’ satisfaction at level
p < 0.05 and positive, providing to support H1. Similarly, H2 has been supported by the relationship between accessibility and satisfaction (β = 0.269; t-value = 2.489;
p-value = 0.013) as accessibility is also a significant predictor of PV users’ satisfaction to PT service. However, H3, concerning the relationship between safety and security with satisfaction (β = -0.067; t-value = 0.509;
p-value = 0.611), is not supported, with a non-significant predictor of PV user satisfaction to PT service (value of 0.611 being > 0.05). Hence, H1 and H2 are accepted while, H3 is rejected. For a better understanding of the proposed model, effect size values (f
2) were measured. An f
2 value above 0.15 is considered as a good enough effect (moderate effect), less than 0.02 is considered a small effect, and anything above 0.35 is a large effect [
86]. The findings for f
2 also can be seen in
Table 8, and it is demonstrated that the path of service quality has the largest effect size on PV users’ satisfaction with (f
2 = 0.252) followed by accessibility (f
2 = 0.072) as a small effect on the dependent variable, but safety and security have a very small effect on the PV satisfaction to PT service quality (f
2 = 0.004).
4.5. Predictive Evaluation
Predictive accuracy and relevance tests of the model are the main steps in assessing application of PLS-SEM. As we have shown, the predictive accuracy according to the coefficient of determination (R
2 value), was at a moderate level (0.447 being > 0.33) [
87]. On the other hand, in SmartPLS 3.0 using the blindfolding procedure, the predictive relevance was tested to calculate Q
2. Based on the recommendation in the literature, Q
2 > 0 indicates predictive relevance in the model among endogenous attributes [
88]. The findings present that the total Q
2 is positive (0.365) and all other Q
2 values are generated as positive from construct cross-validated redundancy. Thus, it is indicated that the proposed model in this study has sufficient predictive relevance.
4.6. Goodness of Fit (GoF)
PLS-SEM does not create general Goodness of Fit (GoF), however, R
2 value as an essential method can be considered to examine the explanatory power of the model [
72]. Previous research used the GoF index for PLS-SEM to evaluate the model fit [
89]. The GoF is assessed by utilizing the AVE value obtained from the measurement model and the average R
2 value. This can be calculated using the following equation, GoF = √(AVE × R
2). The following cut-off values are reported in the literature for measuring the results of GoF analysis: GoFsmall = 0.1; GoFmedium = 0.25; GoFlarge = 0.36 [
89]. On the basis of this guideline, we have calculated the GoF index of the model presented in this research, which is shown in
Table 9. According to the result presented, the conceptual model utilized in this study generates a GoF index value of 0.556, pointing toward a very good (GoFlarge) model fit. Thus, it can be concluded that from the complete analysis, both measurement models and structural models are validated. Furthermore, the results show that the conceptual model of this research has a significant predictive, as well as explanatory power.
4.7. Partial Least Square Multi-Group Analysis (PLS-MGA)
Before running the test for multi-group analysis, testing the measurement invariance of composite models (MICOM) is required with three steps (to make it clear for readers we created
Figure 4) [
36,
72]. Moreover, having carried out the data preparation with 52 samples for males and 48 samples for females, data groups were generated for both groups to make a comparison. Correspondingly, for the two different age groups 67 respondents were between 18–44 years old and 33 respondents were above 45 years old.
After running the permutation with 5000 subsamples, and 300 iterations in two tail testing 5% level of significance, the results indicated that the MICOM was successfully established for step one. Additionally, step two was established, because the original correlations were larger than 5% and p values > 0.05). Next, in step three part a) the assessment of equality of composite mean only for service quality was not falling between 2.5% and 97.5% and the permutation p-value was less than 5%, meaning there was a significant difference the between two groups (male and female) for this latent variable. In contrast, accessibility, safety and security were established, by comparing mean original difference (male-female), to be within the lower (2.5%) and upper (97.5%) boundaries. Furthermore, in part b) the variance of original differences for (male-female) fell between the 2.5% and 97.5% boundaries established. Consequently, in step three not all the composite equalities were established, and only partial measurement invariance was supported.
Finally, the results from the analysis and interpreting permutations revealed that only one of the relationships showed a statistically significant difference, i.e., between males and females, which is the relationship between safety and security with satisfaction (p-value < 0.05).
To find the specific differences (heterogeneity) among groups (male vs. female), as well as age groups (18–44 vs. ≥45) the MGA using SmartPLS was considered for further analysis. Findings in
Table 10 show that in the accessibility relationship with satisfaction (path coefficient/B = −0.005 for gender groups and B = −0.044 for age groups,
p-value = 0.978 and
p-value = 0.806, respectively) there were no significant differences between males and females and different age groups. Similarly, results for the service quality and satisfaction (path coefficient/B = −0.347 and B = 0.234,
p-value = 0.174 and
p-value = 0.349 for gender and age groups, respectively) display non-significance among them to predict PV user satisfaction about PT service. In contrast, in the case of the safety and security relationship with satisfaction, there was a significant difference between both gender and age groups (path coefficient/B = 0.610 and B = −0.500,
p-value = 0.014 and
p-value = 0.027, respectively) as the p-value is less than 0.05 level of confidence.
6. Conclusions and Future Research Direction
In summary, this paper investigated several key factors, namely perceived service quality, accessibility, safety and security that estimate that influence the overall satisfaction level of PV usage in Budapest, Hungary. This is the first research investigating this relationship using PV users’ perception data from an Eastern European country and during COVID-19 by applying the PLS-SEM approach. The paper highlighted, that some satisfaction issues became more significant, while the importance of others was mitigated due to the unusual circumstances.
The results of this study contribute to enhance knowledge of both theoretical and practical implications. Concerning the theoretical part, this paper expands the essential knowledge in this field. In addition, the proposed model provides a better understanding of the relationship between different perceived constructs and satisfaction. As a further novelty, PLS-MGA was implemented to test the difference in perception among age and gender groups on the formation of PV user satisfaction.
In terms of the practical implications, the findings in the presented research are helpful for both public transport operators and decision-makers aiming to enhance their efficiency plan to attract PV users toward more sustainable transportation. The results indicate which manifest (observed) variables have a high weight on the latent (unobserved) variable. Based on these results, the authorities and decision-makers can focus on those variables more likely to improve the satisfaction of PV passengers.
Undoubtedly, it has been observed that the aim of this study was successfully fulfilled, contributing several benefits for theoretical and practical implications. Nevertheless, this research is not without limitations, which may provide research direction for future studies, and need to be acknowledged. From a transport planning perspective, first, in this study the sample size is comparatively small compared with the target of Budapest citizens and public transportation firms. Therefore, future studies should expand the sample size and involve more participants to enhance the results and make better decisions. Second, the data was collected during COVID-19 in Budapest in October and November 2020. Further study could address a longitudinal survey to find the main factors influencing PV users’ satisfaction and make a comparative analysis. Third, the effect of gender and age groups in this paper have been examined in the formulation of satisfaction of PV users. Thus, future research is recommended to understand the impact of other individuals’ socio-economic characteristics, for example, a comparison among education level, and income groups.
On the other hand, from the methodology point of view, it is also worth mentioning that combining both observed heterogeneity (PLS-MGA) and unobserved heterogeneity (FIMIX, PLS), or use of necessary condition analysis (NCA) with large data might give more robust results. A possible further study may also consider the combination between discrete choice models for example; the ordered logit model and PLS-MGA to conduct a more in-depth heterogeneity analysis. Moreover, a hybrid approach is suggested between Structural Equation Models (SEMs) and Multi-Criteria Decision Making (MCDM) techniques, to find comparisons and differences [
99]. However, the survey procedures for both SEM and MCDM techniques are quite different. Recently, several researchers recommended employing an integrated approach between Bayesian Network (BN) with SEM, and BN with PLS-SEM as a powerful tool that can be utilized to enhance new theories or frameworks in any field of knowledge [
18,
100]. Especially, a combination of BN and PLS-SEM for determining the interrelationship between service quality factors and dealing with the heterogeneity analysis is recommended [
30,
34].


