Abstract
This paper aims to explore the importance of the direct-payments scheme as a tool for supporting the sustainable development of agriculture in Poland, and to assess the effects of the 2015 Common Agricultural Policy reform in this context. In particular, the study attempts to investigate the impact of different fund-allocation criteria on the regional distribution of direct payments. The research employs a simulation method in the form of variant analysis (the “what if” model)—a mathematical method with elements of statistical description, based on the complete dataset. For the purposes of one of the variants, a multi-criteria composite indicator was constructed, including stimulants and destimulants of the level of environmental sustainability of agricultural plant production. The analysis was conducted at the NUTS 2 level (voivodeships). The timeframe of the study covered the period 2010–2019. The data published by Statistics Poland and the Agency for the Restructuring and Modernisation of Agriculture were used as the source material. The analysis indicated that the 2015 Common Agricultural Policy reform redistributed public funds away from sustainable agricultural management principles. Applying some basic sustainability criteria in order to internalise environmental externalities would lead to a radical redistribution of first-pillar Common Agricultural Policy payments. The paper concludes that a real greening of the European Union’s agricultural policy is a task still to be accomplished.
1. Introduction
The dynamic economic development in the second half of the 20th century was associated with a clear increase in prosperity in many developed countries, but it also led to the “accelerated consumption” of natural resources, and the impoverishment of some populations, despite the rise in average incomes. The concept of sustainable development was meant to provide a response to these problems [1]. This concept is especially important in the case of agriculture—a sector whose economic performance strongly depends on natural, climatic, and weather conditions.
The signals which agricultural producers receive from the market (both from the supply side of the factor market and from the demand side of the agricultural-products market) seem to generally favour the processes of production specialisation and concentration. As regards the factor market, production specialisation enables the generation of a higher return on investment, and a sufficiently large scale of production (concentration) determines the effectiveness of investment projects. As regards the agricultural-products market, the recipients of agricultural products usually expect large, uniform batches of goods.
The excessive concentration of production puts greater pressure on the natural environment (and the capability of ecosystems to neutralise the effects of human activity is limited). It also poses a threat to biodiversity (monocultures), plant and animal health, and animal welfare. On the other hand, diversification and a greater dispersal of production result in a greater mosaic of crops, a lower risk of pest infestations, and a reduced use of plant-protection products.
While it should be noted that the ability of agricultural holdings to self-finance certain investments and other measures conducive to sustainable production, e.g., manure plates and disinfection mats, the provision of veterinary care for animals and the regular testing of soil samples (in order to develop a more rational fertilisation plan) increases as the scale of production expands. In line with the concept of sustainable development, the development component aimed at achieving environmental objectives should act as the counterbalance to the primacy of economic objectives, which can pose a threat to the natural environment.
The above considerations indicate that in order to implement the triad of objectives of the sustainable development of agriculture, the country’s intervention is indispensable. In the European Union (EU), an important role in this area is played by the Common Agricultural Policy (CAP), whose objectives have evolved towards supporting the sustainable management of natural resources, limiting the adverse impact of agricultural production on natural resources, and counteracting climate change.
The range of CAP instruments was reformed throughout this process. Direct payments (the first pillar of the CAP) became “greener”—at present, they are not only a tool for supporting farmers’ income (societal objectives), but they are also a form of rewarding farmers for conducting their activities in an environmentally friendly manner, constituting compensation for the income lost due to the reduction in production intensity, or the cost incurred due to the application of agricultural practices beneficial for the environment and the climate (environmental objectives).
The induction of the mechanism of economic impact on the entities using the environment took place in 2004 by establishing the rule that farmers who do not meet the requirements on public, animal, and plant health; animal welfare; and the environment, i.e., those who do not meet the requirements and standards of the cross-compliance, receive reduced direct payments or are excluded from these payments [2]. In addition, in 2015, payment for agricultural practices beneficial for the climate and the environment was introduced. Inclusion of the ecological component in the first pillar of the CAP, for which each Member State of the EU obligatorily allocates 30% of the national ceiling, was supposed to ensure the uniform application of environmental practices across the Union [3]. Regardless of this, the Member States have the possibility to support agricultural production sectors of significant environmental importance (e.g., the cultivation of protein crops) under the so-called voluntary coupled support, allocating for this purpose a specific part of the national ceiling within the limits set out in EU legislation.
The purpose of this article is to explore the importance of the direct-payments scheme as a tool for supporting the sustainable development of agriculture in Poland, and to assess the effects of the CAP reform implemented in 2015 in this context.
This goal can be converted into the following general research questions:
- To what extent is the method of allocating funds among farms used in Poland consistent with the distribution of support according to the degree of sustainability of agricultural production?
- Has the CAP reform implemented in 2015 made the distribution of funds between farms closer to the distribution of support according to the degree of sustainability of agricultural production?
Therefore, the study concerns the practice of applying the CAP in one of the Member States of the EU—a country with high agricultural production potential, where agriculture plays an important role in the sectoral employment structure.
This study, apart from its cognitive values, has potential policy implications. The conclusions from the research may serve to support the decision-making process in the field of agricultural policy at the EU and national levels. Moreover, due to the proposed indicator of environmental sustainability of plant production, which can be applied at the regional level, it is a voice in the discussion on the construction of practical measures of the degree of agricultural sustainability. Thus, the article is also important from the standpoint of the research methodology development in this area.
The originality of the study is evidenced by the fact that the existing relevant literature lacks publications presenting the results of empirical research aimed at recognising the importance of the direct-payments scheme in supporting the sustainable development of agriculture. There are, however, descriptive studies and studies of the content of legal acts and other documents issued by various EU and state institutions. The prior empirical analyses focus mainly on the impact of introducing payment for agricultural practices beneficial for the climate and the environment (or the implementation of individual practices by farms) on the level of production, the prices of agricultural products or agricultural income, and environmental indicators. In turn, this study has a wider scope—it refers to all direct payments (and not only the environmental component of the direct-support system).
The remainder of the paper is organised as follows. The next section provides a review of the relevant literature on sustainable agricultural development. The methodological framework of the study and the details of the data-selection procedures are presented in Section 3. Section 4 presents and discusses the results of the empirical analyses. The paper ends with conclusions summarising its main findings along with policy implications.
2. Literature Review
A clear-cut definition of sustainable agriculture is a very complex issue. More than 70 meanings of sustainable agriculture can be found in the literature [4]. Difficulties in defining this concept arise from the various methods for describing and measuring the phenomena occurring in agriculture, and also from the considerable organisational and functional complexity of agriculture; production diversity; the regional variations in farming conditions; and the complexity of economic, demographic, and societal processes—unheard of in other types of economic activity [5].
Agricultural production is fully dependent on natural resources, and its impact on the environment is clearly noticeable. Primarily negative impacts are noted [6,7] and indicate the enormous pressure that food production causes on the environment [8]. This includes water contamination and eutrophication and air and soil pollution, which results, inter alia, in a decline in ecosystem biodiversity [9,10].
The state of natural capital determines the delivery of ecosystem services. The basic component of natural capital engaged in agricultural production is soil. The soil state is essential for the provision of services to human society [11]. The mitigation of soil threats—such as the loss of organic matter and the problems of erosion, compaction, salinization, sealing, and contamination—is increasingly challenging for the global community [12]. The productivity goals of agriculture can negatively influence environmental sustainability, because of the intensive use of natural resources and agricultural practices depleting soil reproduction functions. Taking the above into consideration, agriculture is responsible for the quality and quantity of ecosystem services, but, on the other hand, it is dependent on these services. This means that a lack of care for these services may decrease the sector’s production capacity [12,13].
It can be said that sustainable agriculture entails conducting agricultural production with due respect for natural resources, by organising this production in accordance with the local conditions for agricultural activity. Environmentally friendly agriculture practices involve various methods, including organic farming, that use land, water, labour, knowledge, and technology to both grow crops and reduce environmental impacts like pesticide pollution, soil erosion, and greenhouse gas emissions. The following elements form the basis for environmentally friendly agricultural practices: skillful plant rotation (preventing soil erosion), multidirectional production (e.g., ensuring crop diversity), and moderate production intensity (avoiding excessive pressure on the natural environment) [14,15]. The maintenance or reconstruction of the natural resources of an agricultural holding is considered to be of the utmost importance [14,16,17,18,19].
Ensuring sustainable development in agriculture requires the use of the proecological technologies. These ensure that the degradation of the natural environment is avoided, by maintaining moderate levels of exploitation in line with the standards of nature-resources protection. This is the kind of development which ensures the economic viability and societal acceptability of agriculture along with the attaining of ecological objectives [20,21]. Allen et al. [22] proposed an expanded conceptualisation of sustainability that focuses on the entire food and agriculture system at the global level, and which also includes environmental, economic, and societal equity.
A precise answer to the question regarding the model of agricultural development that can be considered sustainable poses many difficulties, and—depending on the approach—involves placing differing levels of emphasis on the importance of particular components and features of sustainability. In general, researchers share the view that we can talk about sustainable agriculture when economic, environmental, and societal objectives are pursued in harmony [23,24].
Economic objectives are implemented through the operation of the market mechanism. In order to depart from the primacy of economic objectives, the state needs to apply instruments influencing the choices of economic entities, which in this case are agricultural holdings. In the short-term perspective, this means a decline in the economic effectiveness of these entities (and thus of the whole sector), while in the long-term perspective, this is intended to ensure that the agricultural sector, without excessive use of the natural environment, will be capable of pursuing production for many generations to come, without detriment to natural resources and without posing any threat to the preservation of ecosystems. Agricultural-policy instruments may, therefore, be aimed at hindering some production-organisation tendencies induced by market processes, so long as they pose threats to the environment or to the stability of the societal system. Any state interference, the purpose of which is to neutralise the consequences of the so-called market failure with regard to the volume and structure of production, can be perceived as conforming to the concept of sustainable development.
The occurrence of the positive and negative external effects of agricultural activity on the environment leads to a misallocation of resources [2]. The former is related to the fact that market prices do not reflect the full costs of production, which triggers higher production and consumption than the optimal level, from the point of view of the entire community. Moreover, those who consume fewer environmentally harmful products or products made using environmentally harmful methods are often equally affected by their negative impact. In turn, those who pursue production activities in an environmentally friendly manner may be less competitive than those who use production methods which are harmful to the environment but which allow production to be pursued at lower costs [25].
Negative externalities are borne by society, and economists try to quantify them in order to support decision-making processes at the policy level [26,27]. Estimating the negative external effects helps to determine the magnitude of their consequences, which can be followed by devising solutions to internalise them [28]. Attempts have been made in the literature to characterise the economic-policy instruments relating to environmental issues [29].
Pigou proposed that private benefits and costs may be equalised with social benefits and costs through taxes and government regulations [30]. Further consideration of the negative effects of external costs was conducted by Coase, who argued for solving the resulting problems by developing voluntary transactions between entities that bear these costs [31]. An important point was made by Ou-Yang regarding the measurement of external costs. The author argued that taking different measurements may produce different results, despite using the same data sets [32].
When implementing the concept of the sustainable development of agriculture, the objective is for agricultural producers to be guided in their production decisions not only by the current market situation, but also by taking into consideration the impact of their decisions (e.g., concerning the choice of production techniques) on the natural environment and the sustainability of the societal system. The implementation of societal objectives is to be fostered, in particular, by actions aimed at reducing the income gap and the quality-of-life differences across social groups. It is also of the essence to shape societal attitudes which would facilitate environmental objectives to be achieved simultaneously.
The specific conditions of agricultural activity are perceived by farmers as arguments justifying the maintenance of the public income-support scheme, facilitating the implementation of particular economic interests [33]. The most important factors determining the specificity of agricultural production include the natural conditions of the activity conducted, the high risk from unpredictable agrometeorological conditions, and the economic conditions, which include, above all, low prices of manufactured goods requiring high labour and investment outlays [34]. The premises for state intervention in agriculture include the weak bargaining position of agricultural producers towards contractors (resulting from the asymmetric market structure which is unfavourable from the point of view of farmers), the higher risk of running a business compared to other sectors of the economy and the underdevelopment of insurance and credit markets in the agricultural environment, the need to create incentives to increase the production of public goods accompanying agricultural activity (environmental and socio-cultural goods), and the importance of ensuring that the production potential of domestic agriculture guarantees an appropriate level of food security [35]. The loss of income associated with less intensive, proenvironmental production is another argument for the provision of financial support to farmers from public resources.
Progress in reducing the negative impact of agriculture on the natural environment and in stimulating the production of environmental public goods by this sector depends, to a large extent, on the attitudes and motivation of farmers towards implementing environmentally friendly practices. Identifying the determinants of the proenvironmental measures taken by farmers has been the subject-matter of numerous empirical studies (e.g., [36,37]). According to Wąs et al. [38], the effective involvement of farmers in proenvironmental measures requires strong financial stimulation, supported by measures to raise environmental awareness.
The concept of the sustainable development of agriculture has materially changed the ways of perceiving family holdings, which are not only production units but also places where farming families live. Under this approach, an agricultural holding is a specific agri-socio-ecological system operating in specific societal, economic, environmental, and political-institutional conditions. Janker et al. [39] state that the scientific discourse on sustainable agriculture addresses small-scale and family farmers as one of several vulnerable groups of rural inhabitants who need to be empowered.
In assessing the importance of supporting small agricultural holdings via the direct-payments scheme, it can be stated that it has contributed to the modernisation of production methods, which involves replacing labour with capital. This, in turn, has contributed to the increased ability of agricultural holdings to generate income and has improved production profitability. Indirectly, this has also encouraged farmers to continue agricultural activities and has counteracted the depopulation process in rural areas, thus having a positive impact on the socio-economic balance of rural areas [40].
The implementation of the societal objective of sustainable rural and agricultural development should contribute to enhancing the societal potential of rural areas by increasing the quality of human capital and entrepreneurship. Specific measures are concentrated, inter alia, on raising the level of education, qualifications, skills, and professional mobility of rural residents; digital integration; supporting the creation of non-agricultural jobs using the endogenous potential of rural areas; preventing societal exclusion; and fostering the societal and economic activation of rural residents. In terms of improving the living conditions in rural areas, particular attention should be paid to supporting the development of the communication and societal infrastructure to increase access to public, educational, and cultural goods and services [41,42]. Nonetheless, the underlying objective in this category is to ensure food security [43].
3. Materials and Methods
In order to investigate the importance of the direct-payments scheme as a tool for supporting the sustainable development of agriculture in Poland the following partial tasks were implemented:
- (1)
- determining the extent to which the actual distribution of funds under the direct-support scheme as applied in Poland differs from the distribution based on the principle of the proportionality to the land input (i.e., the area of agricultural land used for agricultural activities);
- (2)
- determining how the amount of funds absorbed by individual voivodeships, being NUTS 2 regions (NUTS 2 refers to regions belonging to the second level of the Nomenclature of Territorial Units for Statistics of the EU [44,45]), would change if:
- -
- an alternative single-criterion principle of the distribution of funds, referring to the effects of agricultural activity, i.e., to the value of the agricultural market output, were employed;
- -
- the criterion for the distribution of funds was the value of crop-market output adjusted to match the degree of the environmental sustainability of this production;
- (3)
- assessing which of the analysed options for the distribution of funds under the direct-support scheme (distribution in proportion to the area of the utilised agricultural land, distribution in proportion to the value of the agricultural market output) would result, at the regional level, in an inter-regional distribution of support that would be closest to the distribution based on the principle of the proportionality to the value of the crop-market output obtained by observing environmental sustainability;
- (4)
- determining whether the CAP reform implemented in 2015 has changed the way in which the funds distributed under this scheme are allocated, in terms of promoting sustainable agricultural production.
In connection with the implementation of the assumed goal, a mathematical method with elements of statistical description was employed, using complete data. More specifically, it was a simulation method based on variant analysis, which can be described as the “what if” technique. For the purposes of one of the variants, a multi-criteria indicator was constructed, including stimulants and destimulants of the level of environmental sustainability of agricultural plant production. As the amount of support granted is determined not only by the degree of sustainability of agricultural production, but also by the production volume, and the transfer of direct payments reduces the income gap between farmers and other occupational groups, this simulation covered all three components of sustainable development.
In spatial terms, the study covered Poland. Polish agriculture is characterised by a significant fragmentation of farms, a high number of employees, and a predominance of soils of medium and low agricultural usefulness. Poland is a country with high biological diversity and is characterised by the diversity of its habitats and natural landscapes. A significant portion of farmers, especially those with small-area farms, carry out production using traditional methods, which they then allocate in significant part to the self-supply of their families [46]. Despite this, Poland is a significant supplier of a number of agricultural, horticultural, and animal products to the world and to Europe.
Poland is one of the leading producers of berries, mainly currants (2nd in the world (W), 1st in the EU), raspberries (5th W, 1st EU), and strawberries (9th W, 2nd EU), and is also one of the largest producers of apples (4th W, 1st EU), cauliflower (9th W, 3rd EU), and cabbage (10th W, 1st EU). Poland is also a significant producer of rye (2nd W, 2nd EU), potatoes (10th W, 4th EU), and chicken (12th W, 1st EU) [47].
According to the results of the 2020 General Agricultural Census, there are approximately 1.317 million farms in Poland, of which 99.4% are individual farms [48]. Most of them are located in central and eastern Poland, and the minority are in voivodeships in the west of the country. The structure of farms is highly fragmented. In 2020, the largest proportion were farms between 1 and 5 ha (50.4%, 50.2% in 2010), followed by farms over 10 ha (25.8%, 25.9% in 2010), 5–10 ha (21.9%, the same in 2010), and farms up to 1 ha (1.9%, 2.0% in 2010). The structure of farms in the EU was analysed at the same time: up to 5 ha—6.1%; 5–10 ha—5.1%; and over 10 ha—88.8% (including over 100 ha—52.7%) [49]. According to the data from Statistics Poland, about 30% of farms persist mainly from agriculture. Characteristic for Polish agriculture is the large regional diversification of the average size of farms. The average size of an individual farm in 2020 was 11.20 ha (9.8 ha in 2010). In the south of Poland, a medium-sized farm has an area of approximately 5 ha, in the north-west over 20 ha.
In 2020, the division of the most important crops was: cereals, 69% (73.3% in 2010); rape and turnip rape, 9.1% (9.0% in 2010); sugar beets, 2.3% (1.8% in 2010); potatoes, 2.1% (3.7% in 2010); and field vegetables, 1.3% (the same in 2010).
The soil and climatic conditions, the location of the processing industry, and the traditions in individual regions determine the specialisation of production. In the case of plant production, rape and turnip rape is grown on a larger scale in the western and north-western part of the country, while sugar beet cultivation is concentrated in Kuyavia-Pomerania, Greater Poland, and Lublin. Orchards and fruit plantations are located mainly in the Masovia and Lublin voivodeships. Animal production is carried out mainly in the Podlassia and Greater Poland voivodeships (cattle), Greater Poland (pigs), and Greater Poland and Masovia (poultry) [48].
The analysis was conducted at the regional level, taking into account the administrative division of Poland into sixteen voivodeships (NUTS 2 regions). The time frame of the study covered the period 2010–2019, divided into two equal sub-periods to capture the influence exerted by the CAP reform implemented in 2015.
The impact of agricultural holdings on the quality of the natural capital of rural areas was determined by using a variety of statistics, such as the proportion of cereals in the sown area; the number of crop groups; the degree of arable-land coverage with vegetation during winter; the stocking density expressed as the number of large animals per hectare of agricultural land; the data enabling an assessment of the ability to manage soil, organic matter, and nutrients of mineral, natural, or organic origin; and the use of lime fertilisers and plant-protection products [5,14,15,50,51,52]. The selected determinants of environmental sustainability corresponded with crop production organisation at the farm level, which was the important attribute of their evaluation in this regard, irrespective of farms’ location and the natural landscape specificity where the agricultural production was conducted. The selection of the presented indicators enabled us to evaluate all farms with agricultural land [50] in a uniform manner. This is a particularly important issue, because in the population evaluation of farms, the indicators applied should correspond with their organisation, reflecting the farmers’ decisions regarding the agricultural production conducted.
Besides the approach adopted, other factors are also important in the evaluation of agricultural sustainability and the implementation of ecoinnovation at the farm level that are determined by farms’ location, e.g., high-nature-value areas, ecological-focus areas, forests, and permanent grasslands [53,54,55]. However, in this research, all farms were included and the environmental sustainability indicators concerned all farms with crop production, independently of their location. The universal indicator list allowed us to present the regional diversity based on the fundamental determinants of farms’ sustainability, resulting from agricultural production organisation. The specialisation of regions was reflected in the values of the indicators, providing information about the potential pressure they put on the environment. The second premise of the selection of indicators was the direct-payment scheme, which was mainly based on area payments. The third important determinant of the established scope of indicators was the access to data, collected in a uniform manner from the farm level by public statistical institutions.
For the purposes of the study, a composite indicator of environmental sustainability of crop production in the NUTS 2 region (i.e., voivodeship) was established on the basis of the following six sub-indicators:
- (1)
- the proportion of cereals in the sown area (in %)—determines the correctness of crop rotation and the degree of agronomic biodiversity. Narrow specialisation of crop production (crop monoculture or crop production with low species diversity) shows that such agricultural practices are far from those included in the principles of sustainable agricultural development [56]. A high share of cereals in the crop structure means that they must be sown after each other throughout a period of two, three, or more years. Such agricultural practices prevent the use of proper crop rotation, resulting, among other things, in the spread of diseases among crops, the growth of weeds, a higher threat of infestation by pests, or the impoverishment of organic matter in the soil [57]. The consequence of consecutive cereal crop production for several years is a marked decline in their performance, which depends largely on the cultivated species, habitat conditions, and the level of agricultural technology [58]. The share of cereals should not exceed 2/3 (the reference value) of the area [59].
- (2)
- the proportion of winter crops in the sown area (in %)—a composite indicator for the assessment of land-resources use, the balance of ecosystems, and the degree of implementation of a sustainable production system in agriculture. Vegetation cover should be at least 1/3 of the crop area. Vegetation cover during the winter prevents the negative impact of climatic factors such as rain and wind on soil. Growing plants on arable land during the period between the two main crops reduces water pollution (by reducing the risk of nitrate leaching) and protects the soil from erosion [59,60].
- (3)
- the proportion of small-seed papilionaceous plants and leguminous plants in the sown area (in %)—reflects the systematic enrichment of the soil with humus. Proper organisation of crop production should be based on multifunction crop rotation, with soil reproductive crops, whose principal functions include providing the soil with suitable physicochemical and biological properties (fertility), thus generating good conditions for the growth and yield of plants, protecting against soil erosion, preventing nutrient leaching (primarily nitrogen into groundwater and drainage), and reducing weeds and crop pathogens, so that crop productivity can be less dependent on the use of chemical crop protection [61].
- (4)
- the consumption of mineral fertilisers (in kilograms per hectare of agricultural land)—the level of fertilisation is the source of information on the impact of agriculture on environmental conditions, which is a consequence of the intensity and efficiency of agricultural production measured by the level of mineral fertilisation. Nitrogen and phosphorus compounds are considered the most serious threat generated by agriculture, as they can enter groundwater and surface water and, in the case of nitrogen, can also escape into the atmosphere. Unsustainable fertiliser management poses a serious threat to the health of humans and animals. High doses of mineral fertilisers increase the risk of their non-absorption by cultivated plants, and thus also increase the risk of their penetration into groundwater or their release into the atmosphere, in the case of nitrogen compounds [8,39,40,41].
- (5)
- the consumption of lime fertilisers (in kilogram per hectare of agricultural land)—the main factor that regulates soil acidity. Most soils in Poland are by nature strongly or moderately acidic—such unfavourable conditions for agricultural production also escalate the processes of anthropogenic acidification [62]. The environmental effect of soil acidification is a spatial reduction of the root system, leading to plant dysfunction in the entire soil profile. As a consequence, increased leaching of nitrates, chlorides, sulphates, and difficulty in the uptake of cations, mainly calcium and magnesium, occurs. This is particularly dangerous when unfavourable proportions of nitrogen, phosphorus, and potassium are used in mineral fertilisers, to the detriment of phosphorus and potassium, which underline the significance of lime use [63].
- (6)
- the cost of plant-protection products (in EUR per hectare of agricultural land)—one of the main important indicators that provides information about the intensity of agricultural practices. The use of plant-protection products is associated with environmental risks. Responsible use of pesticides is one of the most important issues of the European Green Deal that underlines the negative pressure of chemicals on the natural environment components [54].
The selection of indicators was dictated by substantive factors, and by the availability of data in the public statistics. At this point, it is worth mentioning that having more detailed information on environmentally friendly farming practices in individual farms would require face-to-face interviews (see for example [64]). However, our study focused on the regional (NUTS 2) level, and the index of environmental sustainability of agricultural production captured the environmental sustainability of crop production in the entire region. The individual sub-indicators making up the composite indicator were not assigned ranks.
Three of the above-mentioned sub-indicators, i.e., the proportion of winter crops in the sown area, the proportion of small-seed papilionaceous plants and leguminous plants in the sown area, and the consumption of lime fertilisers, were considered stimulants, as, with the rise in the value of each of these indicators ceteris paribus, the degree of the environmental sustainability of plant production was also increased. A positive significance was ascribed to crops which counteract soil erosion and which positively influence the quantity and quality of organic matter, and also to lime fertilisation, as it allows soil pH to be regulated.
The other three sub-indicators, i.e., the proportion of cereals in the sown area, the consumption of mineral fertilisers, and the cost of plant-protection products, were considered to be destimulants, as increasing them negatively affected the level of the environmental sustainability of crop production. A large proportion of soil-degrading crops, coupled with the excessive consumption of mineral fertilisers and plant-protection products, adversely affected the quality of individual components of the rural environment.
The heterogeneity of the parameters and the directions of the influence of the sub-indicators of the environmental sustainability of crop production called for their standardisation. The unification process consisted of the following transformations:
- (1)
- for stimulants:
- (2)
- for destimulants:
The standardised values of the sub-indicators were averaged for the two sub-periods 2010–2014 and 2015–2019. These average values were then used to calculate the value of the composite indicator of environmental sustainability of crop production for the two indicated periods, using the formula below:
where:
- —the level of environmental sustainability of the i-th region (voivodeship);
- —the number of voivodeships (i = 1, 2, …, n; where n = 16);
- —the number of diagnostic variables, i.e., sustainability measures (sub-indicators) (j = 1, 2, …, m, where m = 6);
- —the standardised value of the j-th variable in the i-th object (voivodeship).
The composite indicator value ranged from 0 to 1, and the higher its value, the greater the environmental sustainability of crop production in a given region. This made it a useful tool in the comparative analysis of the environmental sustainability of crop production in the regions.
The indicator of the environmental sustainability of crop production was used to calculate the proportion of individual voivodeships in the value of crop-market output, adjusted to match the degree of its sustainability.
A thematic map and a cartogram were used to present the results. The thematic map outlined the results of the simulation of the consequences of applying three alternative criteria for the distribution of funds under the direct-support scheme, i.e.,:
- the criterion based on the proportionality to the agricultural area;
- the criterion based on the proportionality to the value of the crop market output;
- the criterion based on the proportionality to the value of the crop-market output adjusted to match the degree of the environmental sustainability of this production.
The cartogram, in turn, was used to illustrate the impact of the CAP reform implemented in 2015 on the inter-regional distribution of funds under the direct-support scheme.
The third of the aforementioned criteria combined the triad of sustainable development goals: supporting farmers’ income (societal component) by means of payments linked to the value of commercial agricultural production (economic component), according to the degree of environmental sustainability of production (environmental component).
A limitation of the simulation method which was employed in this study was that it disregarded the fact that a change to the distribution principles itself would initiate corresponding adjustments to the agricultural holdings oriented towards maximising the economic result, which would influence, to some extent, inter-regional distribution. In other words, within the framework of the simplified simulation study, we established what would happen if some alternative allocation criteria were applied, ignoring the feedback between agricultural policy and the form/parameters of behavioural functions manifested by the agricultural holdings.
The research was based on the data published by Statistics Poland and the Agency for the Restructuring and Modernisation of Agriculture, which is a payment agency responsible for the implementation of direct payments to farmers in Poland. The data on agricultural land area by voivodeship and the share of individual voivodeships in the value of commercial crop production were extracted from Statistics Poland, and the data on the amounts of funds paid in the form of direct payments to farmers from individual voivodeships were acquired from the Agency for Restructuring and Modernization of Agriculture. The calculation of the composite indicator of environmental sustainability of crop production for individual regions was based on the data published by Statistics Poland.
4. Results and Discussion
In Poland, in the last year covered by the analysis, i.e., 2019, the relatively (per unit of agricultural area) greater support given to smaller agricultural holdings, compared with large-scale holdings, resulted from the following elements in the direct-support scheme:
- (1)
- the redistributive payment—granted in respect of the number of hectares used for agricultural purposes within the land forming part of the holding, falling within the range (3, 30] (Article 14 of [65]);
- (2)
- the payment reduction mechanism—whereby the amount of the single-area payment made for a given year to a given beneficiary may not exceed EUR 150,000 (Article 19(1) of [65]);
- (3)
- area limits—applied in the case of payments to young farmers (50 ha) (Article 13 of [65]) and fodder plants area payment implemented under the so-called coupled payments (75 ha) (Article 15(2b) of [65]);
- (4)
- rate degression—applied in the case of grain legumes area payment made under the so-called coupled payments (the rate doubled up to an area not exceeding 75 ha) (§ 1 point 1 of [66]);
- (5)
- size limits—applied in the case of certain instruments implemented under the so-called coupled payments in the animal-production sectors (the maximum number of supported animals per holding is 20—both in the case of payments for young cattle (Article 16(3) of [65]) and payments for cows (Article 16(4) of [65]).
The importance of individual instruments, and the scope and strength of their impact on agricultural holdings, varies to a great extent. For example, in 2019, the application of the redistribution payment was beneficial to agricultural holdings with an area of more than 5.9 ha but less than 54.8 ha [67], and the payment-reduction mechanism affected holdings with an area exceeding 1392.5 ha [67].
The presented solutions serve both the implementation of societal objectives (ensuring decent income for small agricultural holdings, closing the income gap among farmers) and environmental objectives (reducing production concentration).
In terms of accomplishing the environmental objectives, the following elements of the direct-support scheme are also important:
- (1)
- payment for agricultural practices beneficial for the climate and the environment (crop diversification, maintaining existing permanent grassland, and having ecological focus area on the agricultural area [68]) by means of the so-called greening payment;
- (2)
- grain legumes area payment;
- (3)
- fodder plants area payment;
- (4)
- so-called cross compliance—which was incorporated into the direct support system in 2004 in order to motivate farmers to conduct production activities in a way that reduces the negative impact of these activities on the environment [2].
Gocht et al. [69] conducted, using the Common Agricultural Policy Regionalized Impact Modelling System (CAPRI) model, simulation studies to assess the effects of the introduction of payment for agricultural practices beneficial for the climate and the environment and individual practices. According to them, CAP greening will lead to a simultaneous small increase in prices and a small decrease in production. The ecological-focus-area measure and the grassland measure tended to induce slightly higher economic effects relative to the crop diversification measure. Similarly to economic effects, the environmental impacts of CAP greening were small, although some regions may see greater effects than others. The crop-diversification measure tended to have the lowest environmental impact, while the grassland measure had mixed (both positive and negative) effects on the reported environmental indicators. The ecological-focus-area measure had positive impacts on most environmental indicators, except for soil erosion. Similarly, after conducting research with the same method, but only for Ireland and Spain, Bubbico et al. [70] found that the greening measures had positive but minor effects on both the environment and the economy. Furthermore, there were considerable differences in the impact at a regional level in Ireland and Spain. These differences stemmed from the diverse structures in the regional agricultural sector and the distinct types of farming.
In turn, Díaz-Poblete et al. [71] conducted an ex post facto study limited to Spain using the statistical technique difference in differences (DiD), concluding that greening had a limited impact, its efficiency for meeting its goal was questionable, and that it was not a sound precedent for building the new green architecture of the CAP. According to Louhichi et al. [72] the CAP greening effect on farm income was rather small at the aggregate level, which was the result of the fact that the majority of farms had complied with the greening requirements from the starting point. The same conclusion, but with reference to Poland, was previously formulated by Czekaj et al. [73]—since the majority of Polish farms already complied with the greening requirements from the very beginning, the impact of adaptation of the remaining farms on the income generated by the entire farm sector was negligible. In addition, a study by Louhichi et al. [74] showed a marginal impact of greening on farmers’ incomes and total agricultural production. Research into one of the agricultural practices (crop diversification) also showed a rather small impact on the farming sector [75].
On the other hand, the results of the research on Italian specialised arable farms by Cortignani et al. [76] indicated the greater importance of this instrument. According to them, while the impact of the greening practices was limited in terms of land use, there were positive effects on environmental indicators. Moreover, the system for reducing green payments and levying administrative penalties in case of non-compliance was effective and ensured compliance with practices in almost all farms.
In 2019 in Poland, EUR 1035.15 million was allocated to greening payment, EUR 51.76 million for grain legumes area payment and EUR 17.25 million for fodder plants area payment [77].
Table 1 and Table 2 present the descriptive statistics of the sub-indicators (components) forming the composite indicator of environmental sustainability of crop production in the region.

Table 1.
The average non-standardised values of the sub-indicators of the crop production sustainability regarding the sown area structure.
Table 2.
The average non-standardised values of the sub-indicators of the crop production sustainability regarding production intensity.
Table 1 presents the values of the components characterising the sown-area structure, and Table 2 shows the values of the components indicating the level of intensity of crop production. These are average values for individual sub-periods before their standardisation using Formulas (1) and (2).
A favourable trend in the analysed period was the increasing share of winter crops and a slight reduction in the share of cereals in the sowing structure in Poland. This was evidenced by an increase in the maximum values in 2015–2019 relative to 2010–2014. The quality of natural resources in Poland was also positively affected by a decrease in mineral fertilisation, with a significant increase in calcium fertilisation. In the sub-periods in question, however, the share of leguminous and papilionaceous plants in the sowing structure in Poland decreased slightly, which was a trend that adversely affected the natural capital of the countryside. On the other hand, the costs of plant protection increased considerably, but in this case it should be remembered that this unfavourable tendency could result from price increases. Individual voivodeships were characterised by large deviations in each of the factors which were taken into account in the construction of the environmental sustainability index of production. However, the province with the lowest environmental sustainability of crop production both in 2010–2014 and 2015–2019 was Silesia. On the other hand, the province with the highest environmental sustainability of crop production both in 2010–2014 and 2015–2019 was Warmia-Masuria, followed by West Pomerania.
The values of the composite indicator of the environmental sustainability of crop production for individual regions in separate sub-periods are summarised in Table 3.
Table 3.
The values of the composite indicator of environmental sustainability of crop production for individual voivodeships in the analysed sub-periods.
Based on the compiled data, it can be concluded that Silesia displayed the lowest level of environmental sustainability of crop production in both sub-periods, 2010–2014 and 2015–2019. In turn, Warmia-Masuria was characterised by the highest level of the environmental sustainability of crop production in both these sub-periods.
The results of the simulation of the effects of applying alternative criteria for the distribution of funds under the direct-payment scheme on the amounts of support absorbed by individual regions are visually presented on the thematic map shown in Figure 1. The abbreviations should be interpreted as follows:
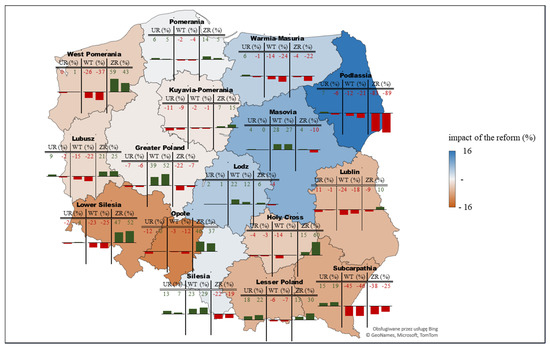
Figure 1.
The impact of the 2015 CAP reform on the absorption of the support distributed under the direct-payment scheme in regional terms, and the simulation of the effects of applying alternative criteria for the distribution of funds. Source: the authors, based on data provided by Statistics Poland and the Agency for the Restructuring and Modernisation of Agriculture.
- UR—the criterion for the distribution of funds based on the proportionality to the agricultural area;
- WR—the criterion for the distribution of funds based on the proportionality to the value of the crop-market output;
- ZR—the criterion for the distribution of funds based on the proportionality to the value of the crop-market output adjusted to match the degree of the environmental sustainability of this production.
As part of the simulation, we determined the amount by which the value of direct payments absorbed by farmers operating in a given region (voivodeship) would have changed had the above-mentioned alternative distribution criteria been applied. For each of the voivodeships, the map displays two numbers referring to a given criterion, and bars with heights proportional to the absolute values of these numbers. For positive values, these bars are green-coloured, and are located above the horizontal axis, while for negative values, they are red-coloured, and are located below the horizontal axis. The bars with corresponding values relating to a given criterion which are located on the left-hand side refer to the period 2010–2014, while those located on the right-hand side describe the period 2015–2019.
Based on the data presented on the thematic map, the following conclusions can be drawn:
- The application of the principle of the distribution of funds based on the principle of the proportionality to the land input (UR) would lead to relatively small changes (in the case of most voivodeships, no more than a few percent) in the levels of funds absorbed by individual regions. In 2010–2014, the maximum decrease (12%) would involve Opole, and the maximum increase (18%), Lesser Poland. In turn, the application of this principle in the period 2015–2019 would cause the sharpest decrease (9%) in the level of funds absorbed by farmers from Kuyavia-Pomerania, while the highest increase (22%) would apply to, as in the case of the first analysed sub-period, farmers from Lesser Poland.
- The distribution of funds proportional to the value of crop-market output (WT) would result in significant changes (in the case of most voivodeships, by more than 10%) in the level of funds absorbed by individual regions. In both periods, 2010–2014 and 2015–2019, the biggest negative change (by about 45%) would pertain to Subcarpathia, and the biggest positive change (by 39% and 52%, respectively) to Greater Poland.
- The application of the criterion of the distribution of funds based on the proportionality to the value of the crop-market output adjusted to match the degree of the environmental sustainability of this production (ZR) would result in significant changes (up to almost 90%) in the amounts of direct payments absorbed by individual regions. West Pomerania, Lower Silesia, and Opole would benefit most from the application of this criterion, while it would prove unfavourable for Podlassia, Subcarpathia, and Silesia (though to a slightly lesser extent for the latter two regions).
- The principle of the distribution of funds based on the proportionality of the granted support to the value of the crop-market output (WT), as well as the principle based on the proportionality of the granted support to the agricultural area (UR), in the case of most voivodeships would lead to changes to the absorbed amounts of funds in the opposite direction to the principle based on the proportionality to the value of the crop-market output adjusted to match the degree of the environmental sustainability of this production (ZR).
In turn, the cartogram shown in Figure 1 reveals that the CAP reform, in the form that was implemented in Poland in 2015, was not generally conducive to supporting sustainable crop production—in many regions, the application of this reform induced changes to the absorbed amounts of funds in the opposite direction to the changes which would have occurred if the principle of the proportionality of allocated funds to the value of the crop-market output adjusted to match the degree of the environmental sustainability of this production (ZR) had been applied. More specifically, Podlassia was the biggest beneficiary of the reform, while the distribution of funds proportional to the value of the crop-market output adjusted to match the degree of the environmental sustainability of this production (ZR) would mean a significantly lower total level of support for farmers operating in this region—both in the five-year period preceding the reform and in the period 2015–2019. However, the sharpest relative “loss” of absorbed funds caused by the reform was recorded in Opole and Lower Silesia, for which the application of the criterion based on the degree of the sustainability of the crop-market output would result in significantly higher amounts of absorbed funds (in both analysed sub-periods).
The results of the present study indicate that the direct-support system has a great potential for becoming an important policy instrument supporting sustainable agricultural development. Overall, our findings are consistent with the conclusions of Scown et al. [82], who argued that more support for environment- and climate-friendly practices is required and called for the introduction of results-oriented payments, better monitoring, and more reliable evaluation of the instruments.
5. Conclusions
The balancing of economic, societal, and environmental objectives, which is intended to ensure the appropriate conditions for the long-term growth of society’s prosperity, constitutes the essence of the concept of sustainable development. The triad of sustainable-development objectives can be formulated by referring to particular sectors of the economy, including agriculture, and economic-policy instruments, including agricultural policy, are also subject to assessment in terms of the extent to which they contribute to the implementation of the sustainable-development concept.
The CAP, including the direct-payments scheme, is intended, inter alia, to facilitate the sustainable management of natural resources, and to counteract climate change. In consequence, it should mitigate the adverse effects of market incentives which indirectly lead to the excessive pressure of agriculture on the natural environment.
Based on the conducted research, it was found that there was a huge potential for improving the direct-support scheme dedicated to farmers, so that it would foster sustainable agriculture. The analysis at the regional level showed that the method of allocating funds among farms used in Poland is far from the distribution of support according to the degree of plant-production sustainability. Moreover, the CAP reform implemented in 2015 did not bring the actual distribution of aid closer to the model of distribution that took into account the degree of sustainability of agricultural production. Nonetheless, it appears that a possible reformulation of the scheme in such a manner that it would become more conducive to the sustainable management of resources in agriculture should be preceded by establishing a composite indicator of agricultural-production sustainability (also including animal production), which would be both meaningful and practical in its application. It is, nevertheless, anticipated that the application of a criterion for the distribution of funds based on such an indicator would increase the administrative costs borne by both the payment agency and the agricultural holdings themselves (inter alia, in connection with extended information obligations and a wider scope of inspection).
A limitation of the simulation method used in this study was the omission of feedback between the agricultural policy and the behaviours of farm holdings—changes in the criteria for allocating funds cause appropriate adjustments on the part of farms, as a result of which the amounts of funds absorbed by farmers from individual regions change. However, adjustments by entities in response to changes in agricultural policy proceed in the same direction, and differ only in pace (the more flexible a farm, the faster it reacts to policy changes). Moreover, this effect at the regional level is less significant than at the level of the unit (farm). For these reasons, it can be expected that the application of this simplified method did not significantly affect the quality of the results. Regardless of the indicated limitations of the simulation method used, it should be noted that the agricultural production sustainability index used was limited only to plant production. By undertaking further research in this area, one should try to overcome these limitations. It would be valuable to extend the spatial scope of the analysis according to a uniform methodology, which would make it possible to conduct comparative research between countries. A barrier to the use of very content-rich sustainability indicators is the limited scope of data collected as part of public statistics.
Author Contributions
Conceptualisation, A.S.; methodology, A.S., W.W. and K.S.-A.; validation, A.S., S.M., A.M.-B., W.W., K.S.-A., A.B. and M.A.; formal analysis, A.S., W.W. and K.S.-A.; investigation, A.S., W.W. and K.S.-A.; writing—original draft preparation, A.S., A.M.-B., W.W., K.S.-A., A.B., M.A. and S.M.; writing—review and editing, A.S., W.W., K.S.-A., A.M.-B., A.B., M.A. and S.M.; visualisation, A.S.; supervision, A.S.; project administration, A.S.; funding acquisition, A.S. and A.B. All authors have read and agreed to the published version of the manuscript.
Funding
This research received no external funding.
Institutional Review Board Statement
Not applicable.
Informed Consent Statement
Not applicable.
Conflicts of Interest
The authors declare no conflict of interest.
References
- Baum, R. Sustainable development of agriculture and its assessment criteria. J. Agribus. Rural Dev. 2008, 7, 5–15. [Google Scholar]
- Sadłowski, A. Płatności obszarowe jako instrument polityki ochrony środowiska [Direct payments as an instrument of the environmental policy]. J. Agribus. Rural Dev. 2011, 4, 145–151. [Google Scholar]
- Milanowska, D. Płatność za zazielenienie w nowym modelu dopłat bezpośrednich. Studia Iurid. Agrar. 2015, 13, 7–18. [Google Scholar] [CrossRef][Green Version]
- Streimikis, J.; Baležentis, T. Agricultural sustainability assessment framework integrating sustainable development goals and interlinked priorities of environmental, climate and agriculture policies. Sustain. Dev. 2020, 28, 1702–1712. [Google Scholar] [CrossRef]
- Matuszczak, A. Wskaźniki zrównoważonego rozwoju rolnictwa: Przesłanki teoretyczne i propozycja pomiaru w regionach UE [Indicators for sustainable development of agriculture: Theoretical premises and proposed measurement in regions of the EU]. Wieś I Rol. Village Agric. 2013, 1, 101–119. [Google Scholar]
- Mysterud, I. The rise and fall of the third chimpanzee: By jared diamond. London: Radius. J. Soc. Evol. Syst. 1993, 16, 357–360. [Google Scholar] [CrossRef]
- Gołębiewska, B.; Pajewski, T. Positive and negative externalities of management illustrated by the case of agricultural production. J. Agribus. Rural Dev. 2018, 48, 113–120. [Google Scholar] [CrossRef]
- Pingali, P.L. Green revolution: Impacts, limits, and the path ahead. Proc. Natl. Acad. Sci. USA 2012, 109, 12302–12308. [Google Scholar] [CrossRef]
- Cambers, G.; Sibley, S. Cambridge IGCSE Geography Coursebook; Cambridge University Press: Cambridge, UK, 2010; ISBN 978-0-521-75784-3. [Google Scholar]
- Foley, J.A.; DeFries, R.; Asner, G.P.; Barford, C.; Bonan, G.; Carpenter, S.R.; Chapin, F.S.; Coe, M.T.; Daily, G.C.; Gibbs, H.K.; et al. Global consequences of land use. Science 2005, 309, 570–574. [Google Scholar] [CrossRef]
- Dominati, E. Natural capital and ecosystem services of soils. In Ecosystem Services in New Zealand—Conditions and Trends; Dymond, J.R., Ed.; Manaaki Whenua Press: Lincoln, New Zealand, 2013; pp. 132–142. [Google Scholar]
- Schwilch, G.; Bernet, L.; Fleskens, L.; Giannakis, E.; Leventon, J.; Marañón, T.; Mills, J.; Short, C.; Stolte, J.; van Delden, H.; et al. Operationalizing ecosystem services for the mitigation of soil threats: A proposed framework. Ecol. Indic. 2016, 67, 586–597. [Google Scholar] [CrossRef]
- Wrzaszcz, W.A.; Prandecki, K. Private farming development in the context of preservation of soil ecosystem services. Zagadnienia Ekon. Rolnej/Probl. Agric. Econ. 2019, 360, 54–88. [Google Scholar] [CrossRef]
- Smędzik-Ambroży, K. Resources and Sustainable Agricultural Development (Zasoby a Zrównoważony Rozwój Rolnictwa); PWN: Warsaw, Poland, 2018; ISBN 978-83-01-19980-7. [Google Scholar]
- Matuszczak, A.; Smędzik-Ambroży, K. Próba ocen współzależności pomiędzy zrównoważeniem środowiskowym a wynikami ekonomicznymi gospodarstw rolnych na przykładzie regionu Wielkopolska i Śląsk [An attempt to assess the interdependence of environmental sustainability and the economic performance of agricultural holdings, based on the example of the Wielkopolska and Silesia regions]. In Z Badań Nad Rolnictwem Społecznie Zrównoważonym Nr 19 [Studies of Socially-Sustainable Agriculture No. 19]; Zegar, J.S., Ed.; Institute of Agricultural and Food Economics—National Research Institute (IERiGŻ) Publishing Press: Warsaw, Poland, 2013. [Google Scholar]
- Andreoli, M.; Rossi, R.; Tellarini, V. Farm sustainability assessment: Some procedural issues. Landsc. Urban Plan. 1999, 46, 41–50. [Google Scholar] [CrossRef]
- Andreoli, M.; Tellarini, V. Farm sustainability evaluation: Methodology and practice. Agric. Ecosyst. Environ. 2000, 77, 43–52. [Google Scholar] [CrossRef]
- Daly, H.E.; Cobb, J.B. For the Common Good: Redirecting the Economy toward Community, the Environment, and a Substainable Future; Beacon Press: Boston, MA, USA, 1989; ISBN 0-8070-3702-3. [Google Scholar]
- van Loon, G.W.; Patil, S.G.; Hugar, L.B. Agricultural Sustainability, Strategies for Assessment; SAGE Publications: New Delhi, India; SAGE Publications: Thousand Oaks, CA, USA; SAGE Publications: London, UK, 2005; ISBN 0-7619-3340-9. [Google Scholar]
- Bastan, M.; Ramazani Khorshid-Doust, R.; Delshad Sisi, S.; Ahmadvand, A. Sustainable development of agriculture: A system dynamics model. Kybernetes 2017, 47, 142–162. [Google Scholar] [CrossRef]
- Wilkin, J. Wielofunkcyjność rolnictwa i obszarów wiejskich [Multi-functionality of agriculture and rural areas]. In Wyzwania Przed Obszarami Wiejskimi I Rolnictwem W Perspektywie Lat 2014–2020 [Challenges Facing Rural Areas and Agriculture within the 2014–2020 Perspective]; Kłodziński, M., Ed.; Institute of Rural and Agricultural Development at the Polish Academy of Sciences: Warsaw, Poland, 2008; ISBN 83-89900-24-6. [Google Scholar]
- Allen, P.; Dusen, D.V.; Lundy, J.; Gliessman, S. Integrating social, environmental, and economic issues in sustainable agriculture. Am. J. Altern. Agric. 1991, 6, 34–39. [Google Scholar] [CrossRef]
- Stępień, S.; Guth, M.; Smędzik-Ambroży, K. Rola Wspólnej Polityki Rolnej w kreowaniu dochodów gospodarstw rolnych w Unii Europejskiej w kontekście zrównoważenia ekonomiczno-społecznego [The Role of the Common Agricultural Policy in Creating Agricultural Incomes in the European Union in the Context of Socio-Economic Sustainability]. Zesz. Nauk. SGGW W Warszawie Probl. Rol. Swiat. Sci. J. Wars. Univ. Life Sci. SGGW. Probl. World Agric. 2018, 18, 295–305. [Google Scholar]
- Zegar, J.S. Współczesne Wyzwania Rolnictwa. Paradygmaty—Globalizacja—Polityka [Contemporary Challenges for Agriculture. Paradigms—Globalisation—Policy]; PWN: Warszawa, Poland, 2012; ISBN 978-83-01-16824-7. [Google Scholar]
- Schläpfer, F. External costs of agriculture derived from payments for agri-environment measures: Framework and application to Switzerland. Sustainability 2020, 12, 6126. [Google Scholar] [CrossRef]
- Pretty, J.N.; Brett, C.; Gee, D.; Hine, R.E.; Mason, C.F.; Morison, J.I.L.; Raven, H.; Rayment, M.D.; van der Bijl, G. An assessment of the total external costs of UK agriculture. Agric. Syst. 2000, 65, 113–136. [Google Scholar] [CrossRef]
- Jongeneel, R.; Polman, N.; van Kooten, G.C. How Important Are Agricultural Externalities? A Framework for Analysis and Application to Dutch Agriculture; Working Papers; University of Victoria, Department of Economics, Resource Economics and Policy Analysis Research Group: Victoria, BC, Canada, 2016. [Google Scholar]
- Tegtmeier, E.M.; Duffy, M.D. External costs of agricultural production in the United States. Int. J. Agric. Sustain. 2004, 2, 1–20. [Google Scholar] [CrossRef]
- Pirard, R.; Lapeyre, R. Classifying market-based instruments for ecosystem services: A guide to the literature jungle. Ecosyst. Serv. 2014, 9, 106–114. [Google Scholar] [CrossRef]
- Pigou, A.C. The Economics of Welfare; Classics in Economics Series; Routledge: London, UK; Routledge: New York, NY, USA, 2017; ISBN 978-1-351-30435-1. [Google Scholar]
- Coase, R.H. The problem of social cost. J. Law Econ. 1960, 3, 1–44. [Google Scholar] [CrossRef]
- Ou-Yang, K. Lexical measures of social inequality: From Pigou-Dalton to Hammond. Rev. Income Wealth 2019, 65, 657–674. [Google Scholar] [CrossRef]
- Nedergaard, P. Market failures and government failures: A theoretical model of the common agricultural policy. Public Choice 2006, 127, 393–413. [Google Scholar] [CrossRef]
- Lin, J.; Lei, J.; Yang, Z.; Li, J. Differentiation of rural development driven by natural environment and urbanization: A case study of kashgar region, Northwest China. Sustainability 2019, 11, 6859. [Google Scholar] [CrossRef]
- Sadłowski, A. Przyczyny i ograniczenia interwencjonizmu państwowego w rolnictwie [The causes and limitations of state interventionism in agriculture]. Zesz. Nauk. Państwowej Wyższej Szkoły Zawodowej W Płocku. Nauk. Ekon. 2018, 27, 167–185. [Google Scholar] [CrossRef]
- Batáry, P.; Dicks, L.V.; Kleijn, D.; Sutherland, W.J. The role of agri-environment schemes in conservation and environmental management. Conserv. Biol. 2015, 29, 1006–1016. [Google Scholar] [CrossRef]
- Lastra-Bravo, X.B.; Hubbard, C.; Garrod, G.; Tolón-Becerra, A. What drives farmers’ participation in EU Agri-environmental schemes? Results from a qualitative meta-analysis. Environ. Sci. Policy 2015, 54, 1–9. [Google Scholar] [CrossRef]
- Wąs, A.; Malak-Rawlikowska, A.; Zavalloni, M.; Viaggi, D.; Kobus, P.; Sulewski, P. In search of factors determining the participation of farmers in agri-environmental schemes—Does only money matter in Poland? Land Use Policy 2021, 101, 105190. [Google Scholar] [CrossRef]
- Janker, J.; Mann, S.; Rist, S. What is sustainable agriculture? Critical analysis of the international political discourse. Sustainability 2018, 10, 4707. [Google Scholar] [CrossRef]
- Volkov, A.; Balezentis, T.; Morkunas, M.; Streimikiene, D. Who benefits from CAP? The way the direct payments system impacts socioeconomic sustainability of small farms. Sustainability 2019, 11, 2112. [Google Scholar] [CrossRef]
- Knapik, W. Wybrane aspekty rozwoju polskich obszarów wiejskich na tle koncepcji zrównoważonego rozwoju oraz zakorzenionych rynków [Selected aspects of development of the rural areas on the basis of sustainable development and nested markets]. Ann. Pol. Assoc. Agric. Agribus. Econ. 2014, 16, 109–113. [Google Scholar]
- Żmija, D. Zrównoważony rozwój rolnictwa i obszarów wiejskich w Polsce [Sustainable development of agriculture and rural areas in Poland]. Studia Ekon. 2014, 166, 149–158. [Google Scholar]
- Webb, J. Food Security: Threat Factors, Policies and Challenges; Nova Science Publishers: New York, NY, USA, 2017; ISBN 978-1-5361-2248-0. [Google Scholar]
- Glossary: Nomenclature of Territorial Units for Statistics (NUTS). Available online: https://ec.europa.eu/eurostat/statistics-explained/index.php?title=Glossary:Nomenclature_of_territorial_units_for_statistics_(NUTS) (accessed on 5 November 2021).
- The History of the NUTS Classification. Available online: https://stat.gov.pl/en/regional-statistics/classification-of-territorial-units/classification-of-territorial-units-for-statistics-nuts/the-history-of-the-nuts-classification/ (accessed on 5 November 2021).
- Powszechny Spis Rolny 2020. In Raport z wyników [National Agricultural Census 2020. Report on the Results]; Statistics Poland: Warsaw, Poland, 2021. Available online: https://Stat.Gov.Pl/Obszary-Tematyczne/Rolnictwo-Lesnictwo/Psr-2020/Powszechny-Spis-Rolny-2020-Raport-z-Wynikow,4,1.Html (accessed on 11 November 2021).
- Food and Agriculture Organization. Available online: https://Www.Fao.Org/Faostat/En/#data/QCL (accessed on 11 November 2021).
- Bank Danych Lokalnych [Local Data Bank]; Statistics Poland. Available online: https://Bdl.Stat.Gov.Pl/BDL/Dane/Podgrup/Temat/34/626 (accessed on 11 November 2021).
- Matthews, A. Farm Consolidation Continues. Available online: http://Capreform.Eu/Farm-Consolidation-Continues/ (accessed on 11 November 2021).
- Wrzaszcz, W. Poziom Zrównoważenia Indywidualnych Gospodarstw Rolnych W Polsce [The Level of Sustainability of Individual Agricultural Holdings in Poland]; Studia i Monografie [Studies and Monographs]: Warsaw, Poland, 2012; ISBN 978-83-7658-353-2. [Google Scholar]
- Kuś, J.; Kopiński, J. Gospodarowanie glebową materią organiczną w kontekście zmian zachodzących w polskim rolnictwie [Management of organic soil material in the context of changes occurring in Polish agriculture]. In Z Badań Nad Rolnictwem Społecznie Zrównoważonym [Studies of Socially-Sustainable Agriculture]; Institute of Agricultural and Food Economics—National Research Institute (IERiGŻ) Publishing Press: Warsaw, Poland, 2011. [Google Scholar]
- Matuszczak, A. Zróżnicowanie Rozwoju Rolnictwa W Regionach Unii Europejskiej W Aspekcie Jego Zrównoważenia [Diversification of Agriculture Development in EU Regions in Terms of Sustainability]; PWN: Warsaw, Poland, 2013. [Google Scholar]
- Kemp, D.R.; Michalk, D.L. Towards sustainable grassland and livestock management. J. Agric. Sci. 2007, 145, 543–564. [Google Scholar] [CrossRef]
- Prandecki, K.; Wrzaszcz, W.; Zieliński, M. Environmental and climate challenges to agriculture in Poland in the context of objectives adopted in the European green deal strategy. Sustainability 2021, 13, 10318. [Google Scholar] [CrossRef]
- Dudek, M.; Wrzaszcz, W. On the way to eco-innovations in agriculture: Concepts, implementation and effects at national and local level. The case of Poland. Sustainability 2020, 12, 4839. [Google Scholar] [CrossRef]
- Faber, A. Przegląd wskaźników rolnośrodowiskowych zalecanych do stosowania przez OECD, UE i wybrane kraje członkowskie. Studia I Rap. IUNG—PIB 2007, 5, 9–24. [Google Scholar] [CrossRef]
- Grabiński, J. Problemy Gospodarstw Zbożowych [Problems of Cereal Farms]. Wieś Jutra 2011, 3–4, 12–13. [Google Scholar]
- Smagacz, J. Skutki Długotrwałego Stosowania Płodozmianów Zbożowych [Long-Term Effects of Crop Rotation]. Wieś Jutra 2011, 3–4, 23–25. [Google Scholar]
- Wrzaszcz, W. Changes in farms’ environmental sustainability in Poland—Progress or regress? AgBioForum 2021, 2, 107–126. [Google Scholar]
- Krasowicz, S. Cechy rolnictwa zrównoważonego [Features of sustainable agriculture]. In Koncepcja Badań Nad Rolnictwem Społecznie Zrównoważonym [The Concept of Research on Socially Sustainable Agriculture] (IERiGŻ-PIB Report No. 11); Zegar, J.S., Ed.; IERiGŻ-PIB: Warsaw, Poland, 2005; ISBN 83-89666-24-3. [Google Scholar]
- Majewski, E. Trwały Rozwój I Trwałe Rolnictwo: Teoria a Praktyka Gospodarstw Rolniczych [Sustainable Development and Sustainable Agriculture: Theory and Practice of Farms]; Wydawnictwo SGGW: Warsaw, Poland, 2008; ISBN 978-83-7244-961-0. [Google Scholar]
- Filipek, T.; Skowronska, M. Aktualnie dominujące przyczyny oraz skutki zakwaszenia gleb użytkowanych rolniczo w Polsce [Current dominant causes and effects of acidification of soils under agricultural use in Poland]. Acta Agrophysica 2013, 20, 283–294. [Google Scholar]
- Kopiński, J.; Wrzaszcz, W. Management of nutrients from mineral fertilizers in the Polish agriculture—Selected issues. Pol. J. Agron. 2020, 43, 11–25. [Google Scholar] [CrossRef]
- Siqueira, T.T.D.S.; Galliano, D.; Nguyen, G.; Bánkuti, F.I. Organizational forms and agri-environmental practices: The case of Brazilian dairy farms. Sustainability 2021, 13, 3762. [Google Scholar] [CrossRef]
- Ustawa z dnia 5 lutego 2015 r. o płatnościach w ramach systemów wsparcia bezpośredniego (Dz. U. z 2018 r. poz. 1312 i z 2019 r. poz. 201) [Act of 5 February 2015 on Payments under Direct-Support Schemes (Journal of Laws of 2018, Item 1312 and of 2019, Item 201)]. Available online: http://isap.sejm.gov.pl/isap.nsf/DocDetails.xsp?id=WDU20150000308 (accessed on 2 September 2021).
- Rozporządzenie Ministra Rolnictwa i Rozwoju Wsi z dnia 7 października 2019 r. w sprawie stawek płatności związanych do powierzchni upraw za 2019 r. (Dz. U. poz. 1970) [Regulation of the Minister of Agriculture and Rural Development of 7 October 2019 on the Rates of Coupled Payments Related to the Crop Area for 2019 (Journal of Laws, Item 1970)]. Available online: http://isap.sejm.gov.pl/isap.nsf/DocDetails.xsp?id=WDU20190001970 (accessed on 2 September 2021).
- Sadłowski, A. The effects of the application of alternative options of redistributive payment for farmers in Poland—Simulation research. In Proceedings of the 5th International Conference on European Integration 2020, Ostrava, Czech Republic, 3–4 December 2020; pp. 755–766. [Google Scholar]
- Regulation (EU) No 1307/2013 of the European Parliament and of the Council of 17 December 2013 Establishing Rules for Direct Payments to Farmers under Support Schemes within the Framework of the Common Agricultural Policy and Repealing Council Regulation (EC) No 637/2008 and Council Regulation (EC) No 73/2009 (OJ L 347, 20.12.2013). pp. 608–670. Available online: https://eur-lex.europa.eu/legal-content/EN/TXT/?uri=CELEX%3A02013R1307-20210101&qid=1637757383296 (accessed on 2 September 2021).
- Gocht, A.; Ciaian, P.; Bielza, M.; Terres, J.M.; Röder, N.; Himics, M.; Salputra, G. Economic and Environmental Impacts of CAP Greening: CAPRI Simulation Results; Joint Research Centre, European Commission, Publications Office of the European Union: Luxembourg, 2016. [Google Scholar] [CrossRef]
- Bubbico, A.; Martínez, P.; Blanco, M.; Breen, J. Impact of CAP green payment on different farming systems: The case of Ireland and Spain. In Proceedings of the Agricultural Economics Society of Ireland Conference, Dublin, Ireland, 1 January 2016. [Google Scholar]
- Díaz-Poblete, C.; García-Cortijo, M.C.; Castillo-Valero, J.S. Is the Greening Instrument a Valid Precedent for the New Green Architecture of the CAP? The Case of Spain. Sustainability 2021, 13, 5705. [Google Scholar] [CrossRef]
- Louhichi, K.; Ciaian, P.; Espinosa, M.; Perni, A.; Gomez y Paloma, S. Why Individual Farm Decision Model Can Better Capture the Effects of CAP Post 2013? Insights from the Greening Measures Using the IFM-CAP Model. In Proceedings of the Paper Prepared for Presentation in SFER Colloque: “Politiques Agricoles et al. Imentaires: Trajectoires et Réformes”, Montpellier, France, 20–21 June 2018. [Google Scholar]
- Czekaj, S.; Majewski, E.; Wąs, A. “Nowe zazielenienie” WPR i jego wpływ na wyniki ekonomiczne polskich gospodarstw rolnych [Impacts of CAP “New Greening” on Economic Results of Polish Farms]. Zagadnienia Ekon. Rolnej/Probl. Agric. Econ. 2014, 338, 39–56. [Google Scholar]
- Louhichi, K.; Ciaian, P.; Espinosa, M.; Perni, A.; Gomez y Paloma, S. Economic impacts of CAP greening: Application of an EU-Wide individual farm model for CAP analysis (IFM-CAP). Eur. Rev. Agric. Econ. 2018, 45, 205–238. [Google Scholar] [CrossRef]
- Louhichi, K.; Ciaian, P.; Espinosa, M.; Colen, L.; Perni, A.; y Paloma, S.G. Does the crop diversification measure impact EU farmers’ decisions? An assessment using an individual farm model for CAP analysis (IFM-CAP). Land Use Policy 2017, 66, 250–264. [Google Scholar] [CrossRef]
- Cortignani, R.; Severini, S.; Dono, G. Complying with greening practices in the new CAP direct payments: An application on Italian specialized arable farms. Land Use Policy 2017, 61, 265–275. [Google Scholar] [CrossRef]
- Wysokość Płatności Bezpośrednich Stosowanych w 2019 r. [The Amount of Direct Payments Applied in 2019]. Available online: https://www.gov.pl/web/rolnictwo/wysokosc-platnosci-bezposrednich-stosowanych-w-2019-r (accessed on 5 November 2021).
- Niszczota, S.; Rafa, W.; Miziołek, D.; Dziubiński, K.; Ruszkowska, Z.; Kupidura, A.; Milewski, T.; Figaj, H.; Cieślak, A.; Wątroba, E.; et al. Użytkowanie Gruntów, Powierzchnia Zasiewów I Pogłowie Zwierząt Gospodarstwach W 2011 Roku [Land Use, Sown Area, and Farm Animals in 2011]; Statistics Poland: Warsaw, Poland, 2012.
- Dubieniecka, H.; Dziubiński, K.; Kupidura, A.; Milewski, T.; Miziołek, D.; Rafa, W.; Ruszkowska, Z.; Siestrzewitowska, A.; Wieczorkowski, R. Użytkowanie Gruntów I Powierzchnia Zasiewów W 2014 Roku [Land Use and Sown Area in 2014]; Statistics Poland: Warsaw, Poland, 2015.
- Dubieniecka, H.; Dziubiński, K.; Kupidura, A.; Milewski, T.; Miziołek, D.; Pacuszka, R.; Rafa, W.; Ruszkowska, Z.; Siestrzewitowska, A.; Wieczorkowski, R. Użytkowanie Gruntów I Powierzchnia Zasiewów W 2016 Roku [Land Use and Sown Area in 2016]; Statistics Poland: Warsaw, Poland, 2017.
- Niszczota, S.; Dziubiński, K.; Kupidura, A.; Miziołek, D.; Pacuszka, R.; Rafa, W.; Siestrzewitowska, A.; Wieczorkowski, R. Użytkowanie Gruntów I Powierzchnia Zasiewów W 2019 Roku [Land Use and Sown Area in 2019]; Statistics Poland: Warsaw, Poland, 2020.
- Scown, M.W.; Brady, M.V.; Nicholas, K.A. Billions in misspent EU agricultural subsidies could support the sustainable development goals. One Earth 2020, 3, 237–250. [Google Scholar] [CrossRef]

Publisher’s Note: MDPI stays neutral with regard to jurisdictional claims in published maps and institutional affiliations. |
© 2021 by the authors. Licensee MDPI, Basel, Switzerland. This article is an open access article distributed under the terms and conditions of the Creative Commons Attribution (CC BY) license (https://creativecommons.org/licenses/by/4.0/).