Article

Research on Truck Traffic Volume Conditions of Auxiliary Lanes on Two-Lane Highways

1
School of Traffic and Transportation, Northeast Forestry University, Harbin 150040, China
2
School of Civil Engineering, Changchun Institute of Technology, Changchun 130012, China
3
State Key Laboratory of Mechanical Behavior and System Safety of Traffic Engineering Structures, Shijiazhuang 050043, China
4
Key Laboratory of Traffic Safety and Control of Hebei Province, Shijiazhuang Tiedao University, Shijiazhuang 050043, China
*
Author to whom correspondence should be addressed.
Sustainability 2021, 13(23), 13097; https://doi.org/10.3390/su132313097
Submission received: 25 October 2021 / Revised: 20 November 2021 / Accepted: 23 November 2021 / Published: 26 November 2021

Abstract

:
The larger the proportion of truck traffic volume, the greater the impact on traffic efficiency, and overtaking behavior will also have an impact. Therefore, in order to clarify the truck traffic volume of the freight two-lane highway due to the difficulty of overtaking, an actual vehicle test is carried out. This involves selecting the appropriate two-lane test section, recording each moment and speed in the driver’s overtaking behavior, performing multiple regression analysis to examine the relationship between the overtaking conflict time and design speed and traffic volume, determining a reasonable evaluation series of two-lane road overtaking risk and the corresponding overtaking conflict time threshold by the Fisher optimal segmentation method, and giving an overtaking behavior risk evaluation method based on conflict time. Finally, according to the overtaking conflict time model, different truck traffic conditions are obtained. The research results show that overtaking conflict time is negatively correlated with the traffic volume and design speed of the lane. Through the risk assessment of the corresponding overtaking behavior, the three levels of serious conflict, general conflict and non-conflict are determined, and the freight traffic volume corresponding to different conflict levels at different speeds is calculated, which provides a reference for setting auxiliary lanes for the two-lane freight highway.

1. Introduction

At the end of 2019, the national highway mileage of Grade 4 or above was 4.6987 million kilometers, which laid a foundation for China’s cargo road transport. Road transport came in the late 19th century with the birth of modern cars. Initially, mainly short-distance transportation business was undertaken. In recent years, China’s economy has been constantly developing, the connection between various regions has been continually strengthened, transportation facilities are steadily being improved, and the logistics industry has also developed rapidly. The freight system plays an important role in the road transport network. However, with the development of road freight, the number of traffic accidents involving trucks has also increased year by year. Due to the related factors of trucks, such as their long body, poor acceleration and deceleration performance, and so on, the proportion of freight accidents is high, including truck accidents off road. These account for relatively high fatality rates, which seriously affect citizens’ life and property rights and interests, and affects the safety of production and orderly development of the transportation system.
Compared with Western developed countries, China’s road freight generally has problems with high safety risks and low efficiency. The freight transportation network is an essential backbone for supporting the industrial activities and economic development of the nation in addition to global trade [1]. Heavy vehicle transportation continues to grow internationally, yet crash rates are high, and the risk of injury and death extends to all road users [2]. Gregory Rowangould believes that, as goods movement continues to increase, it is expected to outpace infrastructure capacity in the United States [3]. As proposed by Quan Yuan, the significant growth in freight traffic and relevant crashes has aroused increasing concerns about road safety threats in local communities [4]. In the United Stated, 8% of all road deaths have been attributed to heavy vehicle crashes. The incidents seriously affected the efficiency of the road [5]. The occurrence of truck accidents exposes the deficiencies and problems existing in production safety in the goods transportation industry. However, from the perspective of the cause theory of traffic accidents, effective transportation safety precautions should not only consider the control of transportation enterprises, but also road design optimization and traffic management of key sections should be carried out simultaneously. The two-lane highway is the most common form of highway in the Chinese highway traffic network. Its main feature is that each lane can only provide traffic in one direction. Therefore, an overtaking maneuver on a two-lane undivided road is one of the most cognitively demanding and challenging tasks while driving. The overtaking maneuver is considered to be a complex and demanding driving task associated with increased mental workload requirements [6,7]. The overtaking maneuver is strongly associated with a high risk of crashing, since the driver endangers the lead vehicle as well as the oncoming traffic, creating a high chance of a side-swipe collision, a head-on collision, or a combination of both [8]. Compared with other traffic accidents, overtaking often results in more serious casualties [9]. At the same time, due to the operation of trucks, the risk of overtaking increases. Drivers need to continuously monitor the slow-moving lead vehicle and oncoming traffic to carry out the overtaking maneuver [10]. Driver errors and misjudgments have been identified as the primary causation factors in overtaking crashes. Drivers make risky decisions with increasing time pressure to complete the driving task, even at the expense of their own safety, which exposes them to a high likelihood of crashes [11]. Polus et al. [12] and Llorca et al. [13] used video observation methods to analyze various parameters in the overtaking process. Carlson et al. [14] and Garcia et al. [15] used a test car to observe the overtaking behavior and collect the data. On the other hand, Farah et al. [16] and Jenkins et al. [17] used simulators to evaluate the influence of driver factors on overtaking behavior, but they did not verify its effectiveness through measured data. One key factor from a safety and traffic operation point of view is the duration of the overtaking maneuver [18,19].
In summary, there are few studies on the risk assessment of overtaking behavior in freight two-lane highways in China and abroad, let alone the impact of traffic flow on overtaking behavior. In addition, these studies are usually based on data obtained by simulation means, and they lack calibration of measurement data. Therefore, on the basis of previous studies, this paper conducted a reasonable real vehicle test, constructed a traffic volume model through multiple regression analysis, and conducted a corresponding risk assessment. Through risk assessment, the risk level of overtaking is determined. Combined with the traffic volume model, the traffic volume conditions of trucks with auxiliary lanes on a freight two-lane highway is calculated, which provides support for setting auxiliary lanes in two-lane freight roads.

2. Research Methodology

Based on the existing research, this paper summarizes and formulates a reasonable test scheme.

2.1. Determination of Test Elements

Overtaking on a two-lane highway can only be completed by overtaking on opposite lanes, so the real vehicle test is more dangerous. In the actual driving process, the complexity of traffic conditions may be different, but the road traffic system is composed of four elements: human, vehicle, road and environment. Therefore, the test influence analysis will be carried out from the four aspects of people, vehicles, roads, and environment.

2.1.1. Driver

The most complex factor in the road traffic system is the driver. The driver’s own characteristics will have a series of impacts on driving behavior, especially driving skills and technical quality. Due to the risks involved in the real vehicle test, 15 drivers were selected under 45 years of age and with over 10 years of driving experience.

2.1.2. Vehicle

The test vehicle must have good acceleration ability and good braking performance. Therefore, it is necessary to choose good dynamic performance, braking performance and good controllability to ensure that the car can run smoothly in different conditions.

2.1.3. Highway

The main body of this paper concerns overtaking behavior on a two-lane highway. Due to the low grade of the road surface on the two-lane highway, the traffic volume of the route selected in this experiment is reasonable, the alignment of the road is straight, and the driver is easily able to complete the overtaking maneuver.

2.1.4. Environment

Environmental factors mainly include weather conditions and road conditions. The actual vehicle test requires relatively strict environmental conditions. Poor driving environment and road conditions will affect the smooth progress of the test. In this study, the weather and road conditions were good when the overtaking test was completed.

2.1.5. Test Apparatus

The test vehicle was a small car equipped with a vehicle navigation display system, which was convenient for the co-pilot test personnel to record the speed of each characteristic moment. At the same time, the vehicle has good power, braking and handling stability. Before the test, the fuel and water level were checked to ensure the normal operation of the vehicle and meet the test requirements. Digital cameras were used to observe and record the traffic environment of the overtaking behavior, namely traffic volume and traffic composition; a stopwatch was used to record each characteristic moment in the overtaking process; a pen and test record table were used to record each characteristic moment and overtaking vehicle speed in the overtaking process.

2.2. Test Plan

Through the analysis of overtaking behavior and various test elements, the test vehicle was a small passenger car with 2 test personnel sitting in the front passenger seat and the back seat, respectively. The front-row tester was responsible for recording the characteristic time t and speed during the overtaking process, recording the characteristic time through the stopwatch, and recording the corresponding speed of each characteristic time through the vehicle navigation system; the rear-row tester watched the traffic volume and headway of the opposite lane through the camera during the overtaking.
On the test section, the driver under test drove a small passenger car from the starting point of the test section. When an overtaking behavior was observed, the front row tester started to record it. The test steps were as follows:
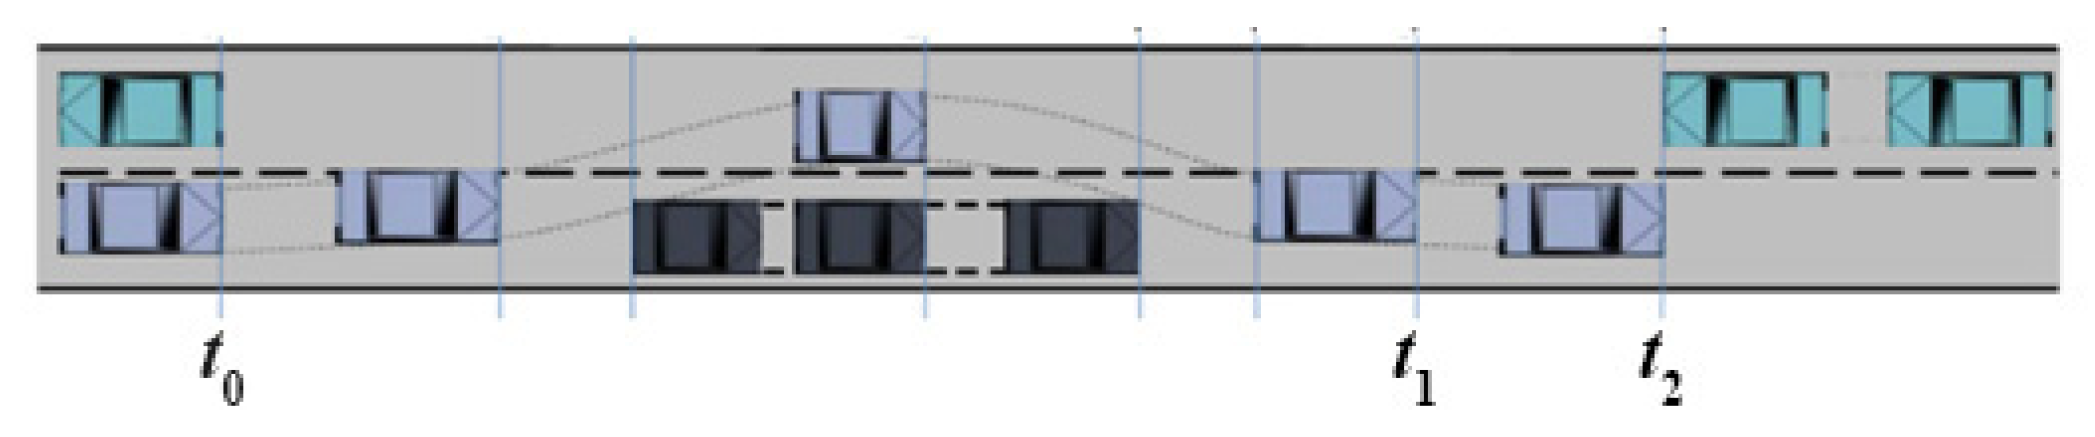
  • When the driver is preparing to overtake, he reports this to the recorder. When the rear of the oncoming vehicle meets the front of the vehicle, the rear tester records the time t0 and the speed v0;
  • When the driver starts to overtake and enters the opposite lane, the co-pilot tester records the speed v1 and the vehicle type being overtaken;
  • When the driver changes lanes to the right and returns to his own lane after overtaking, the co-pilot tester records time t1 and vehicle speed v2;
  • When the test vehicle meets the vehicle in the opposite lane, the co-pilot tester records time t2;
  • The co-pilot tester calculates the driver’s overtaking time T2 = t2t0, and the overtaking conflict time Tc = t2t1;
  • The rear tester calculates the headway T = (t2t0) + (v1 + v2)/2v0 × (t2t0) in the opposite lane;
  • When the next overtaking behavior is observed, repeat steps 1~6 until the end of the test section;
  • Test the next driver and repeat steps 1~7 until all test samples are tested. The test process is shown in Figure 1.

2.3. Data Analysis

Through real-vehicle tests, 300 sets of overtaking behavior data were obtained, and the overtaking models, overtaking time, and overtaking conflict time were analyzed and counted. The proportion of each vehicle is shown in Figure 2 and the characteristic parameters of overtaking are shown in Table 1.
By calculating the average overtaking time, it was found that the average overtaking time of passenger cars is shorter than that of freight cars. The average overtaking time shows that the larger the vehicle, the faster the overtaking speed and the faster the speed of driving back to the original lane, indicating that truck overtaking conflict is more serious, which can also be verified by the average overtaking time.

2.4. Regression Analysis

2.4.1. Regression Fit

Overtaking Process Analysis

Regarding vehicles on the two-way, two-lane highway, the front vehicle speed is lower than the speed of the rear vehicle, the rear vehicle can only passively follow, and the current vehicle maintains a stable low speed. The speed of the rear vehicle is too different from the expected speed of the vehicle, beyond the acceptance of the rear driver, so the rear vehicle will find the right time to overtake. Firstly, the rear vehicle will observe the traffic condition of the opposite lane. When there is a suitable gap, the rear vehicle will accelerate to the opposite lane, and then pass the front vehicle at a high speed. Finally, it will drive back to the lane and continue to advance at a suitable expected speed.

Modeling

Through the analysis of overtaking behavior and various test variables on the two-lane highway, this paper uses the headway of the opposite direction as the basis when constructing the model. Through the 1.2 test plan 6, the calculation method of the headway in the opposite lane is the sum of the time required for overtaking and the running time of the vehicle in the opposite lane, that is,
3600 Q = ( t 2 t 0 ) + v 1 + v 2 2 v 0 ( t 2 t 0 )
In the formula, ‘Q’, is the traffic volume.
According to the actual vehicle test:
T c = t 2 t 1
T c = a 3600 Q × 2 v 0 v 1 + v 2 + 2 v 0 ( t 1 t 0 )
In the formula, ‘a’ is the undetermined coefficient (constant).
The overtaking time is related to the speed v0, v1, v2, assuming their relationship is:
t 1 t 0 = b v 0 + v 1 + v 2 3
In the formula, ‘b’ is the undetermined coefficient (constant).
Therefore, the balanced equation when overtaking is completed is:
T C = a 3600 Q × 2 v 0 v 1 + v 2 + 2 v 0 3 b v 0 + v 1 + v 2

2.4.2. Parameter Estimation

Take the overtaking conflict time as the dependent variable and take v0, v1, v2, and Q as the independent variable. In order to facilitate parameter estimation, let 3600 Q = A ,   2 v 0 v 1 + v 2 + 2 v 0 = B , 1 v 0 + v 1 + v 2 = C ;   a = n ,   3 b = p , resulting in a simplified relational model:
T c = n × A × B p C
The following uses SPSS software to perform regression analysis on the experimental data.
It can be seen from Table 2 that the model retains the variables A, B and C, indicating that A, B and C are significant influencing factors. According to the estimated values of the parameters in Table 3, the regression relationship model can be obtained as:
T c = 1.820 A × B 633.073
The coefficient of determination of the model is 0.992, indicating that the fitting effect is better.
Incorporating A = 3600 Q ,   B = 2 v 0 v 1 + v 2 + 2 v 0 ,   C = 1 v 0 + v 1 + v 2 into Formula (6), we can see that the relationship between overtaking conflict time, overtaking speed, and traffic volume is:
T c = 1.820 3600 Q × 2 v 0 v 1 + v 2 + 2 v 0 633.073 1 v 0 + v 1 + v 2
According to the statistical analysis of actual vehicle test data, it can be seen that the driving speed of the vehicle during actual driving is about 80% of the design speed, and the driving speed of the vehicle during overtaking is about 85% to 90% of the design speed. Therefore, the normal driving speed in Equation (8) can be equivalent to 80% of the design speed, the overtaking speed is equivalent to 85% of the design speed, and the speed of returning to the original lane after overtaking is equivalent to 90% of the design speed. Therefore, the formula is transformed into:
T c = 3129.313 Q 248.264 v

2.5. Risk Assessment Method

2.5.1. Applicability of Fisher Optimal Partition Method

The Fisher optimal segmentation method is used to classify the overtaking conflict time data to obtain a two-lane overtaking risk classification scheme, including the optimal number of classifications and the corresponding risk index thresholds for each level. The principle of Fisher’s optimal segmentation method is to find several grouping points by recursion, so that the sum of squares of deviations within the group is the smallest and the sum of squares of deviations between groups is the largest [20]. Therefore, when grouping the data, this method can divide the data well into categories with similar indicators in several groups.
The Fisher optimal segmentation method only classifies similar samples with a small discrete degree and large discrete degree between classes, that is, the samples that constitute a class have roughly the same dispersion degree from the mean. However, for the ordered samples with certain trends, the mean has no practical significance and the trend between samples is masked. This shows that the application scope of the optimal segmentation method is suitable for the classification of ordered samples with different dispersion degrees around the mean.
The overtaking conflict time is between ordered samples with different degrees of dispersion around the mean, so the Fisher optimal segmentation method is used to determine the optimal classification number.

2.5.2. Fisher Optimal Segmentation Step

Defining Sample

Based on the 315 groups recorded in the actual vehicle test, the overtaking conflict time Tc is sorted and numbered from largest to smallest, and an ordered sample of the conflict time Tc is generated, which is recorded as y i ( i = 1, 2, …, 315).

Definition and Calculation of Class Diameter

In the Fisher optimal segmentation method, because of the differences in classification, the diameter is used to distinguish the differences in the classes. The smaller the difference, the smaller the class diameter. If the sample is classified as x type, C z 1 x 1 classification method can be obtained. Assuming that a class D i j contains samples { y i , y i + 1 , · · · , y j }   ( 1 i < j ) with a class diameter P ( i , j ) that will be the sum of squared deviations of the medium sample D i j , then the diameter of this class is:
P ( i , j ) = i = 1 j ( y i y ¯ i j ) T ( y i y ¯ i j )
In the formula, y i is the standardized sample value, and y ¯ i j   is the average value of the samples from i   to   j .

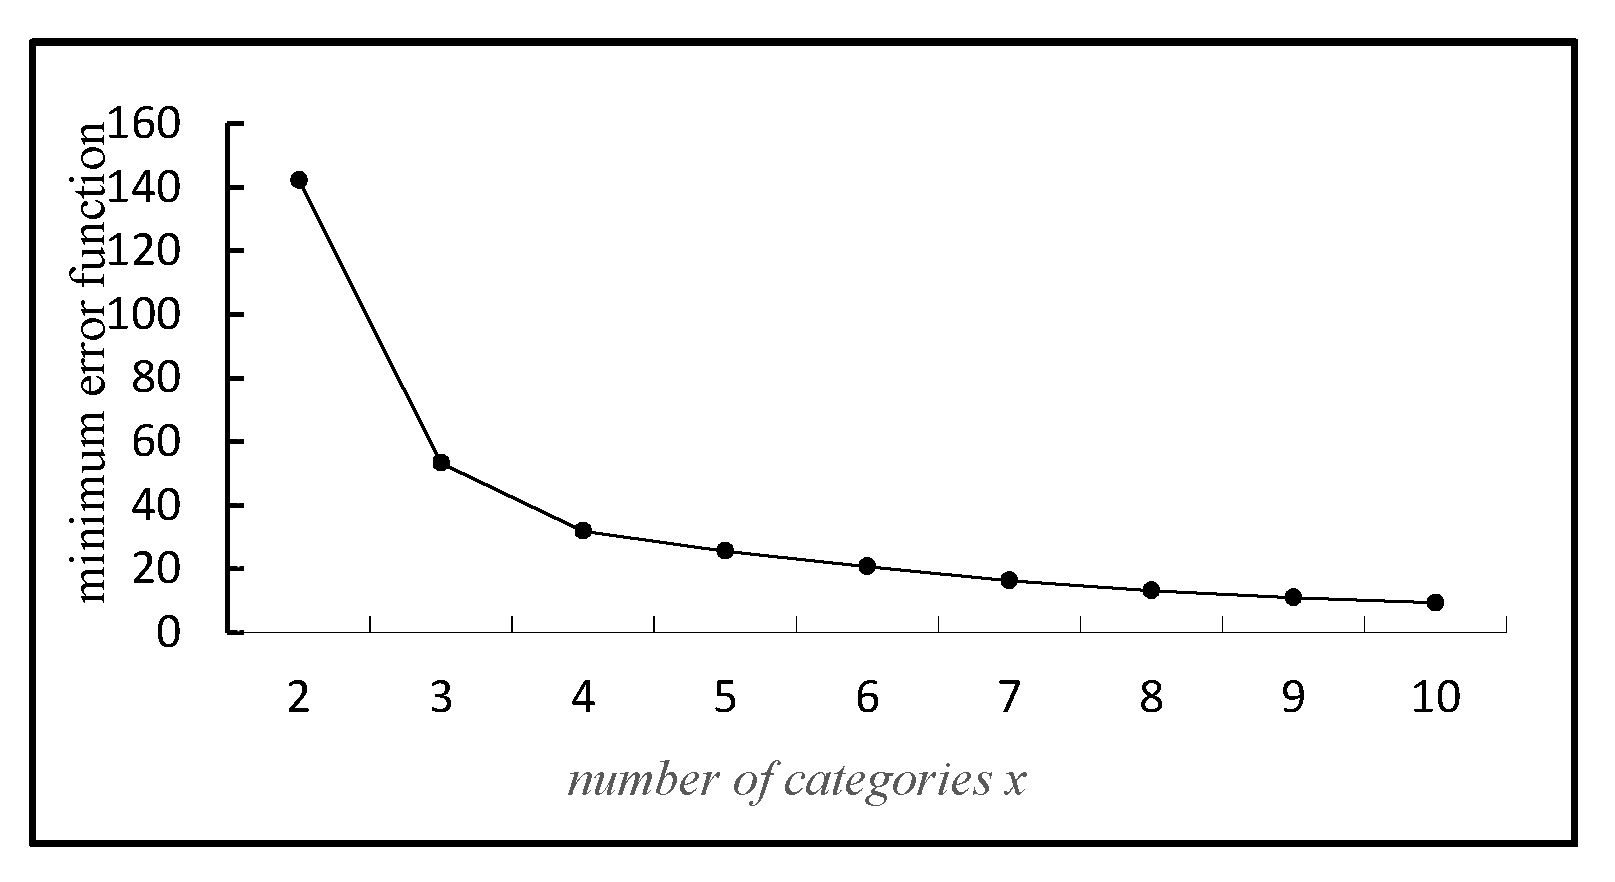
Calculating the Classification Error Function

If n ordered samples are divided into x categories, the error function corresponding to the classification method is [21]:
H [ b ( n , x ) ] = d = 1 x P ( i d , i d + 1 1 )
It can be seen that H [ b ( n , x ) ] is the sum of various diameters under this classification method. The smaller the value of H [ b ( n , x ) ] , the smaller the sum of the diameters of the classification, indicating that the classification is better.

Determining the Optimal Solution

When x = 2, it is divided into 2 categories. At this time, the error function of the optimal classification is:
H [ b ( n , 2 ) ] = m i n 2 i n { P ( 1 , i 1 ) + P ( i , n ) }
When x > 2, the error function of the corresponding optimal x classification at this time is:
H [ b ( n , x ) ] = m i n 2 i n { H [ b ( i 1 , x 1 ) ] + P ( i , n ) }

Determining the Number of Optimal Solution Categories

The optimal classification number x is determined by the relationship curve between H [ b ( n , x ) ] and x. From the relationship curve between the two, where the curvature of the curve changes significantly, the corresponding x value is the optimal classification number. When there are many obvious changes in the curvature of the minimum error function and the classification number curve, the determination of the optimal classification number x can be further determined by the calculated value. The larger the calculated value, the better the classification effect. Thus, x is the optimal classification number [22].
β ( x ) = H [ b ( n , x ) ] / H [ b ( n , x + 1 ) ]

3. Result and Discussion

3.1. Results of Regression Analysis

From Formula (9), it can be seen that the overtaking conflict time Tc has a negative linear correlation with the traffic volume Q and the design speed v.
From Formula (9), the expression of Q is:
Q = 3129.313 T c + 248.264 v

3.2. Results of Risk Assessment

According to the previously defined ordered samples, combined with the steps of the Fisher optimal segmentation classification method, MATLAB software is used to write the calculation code, and the diameter of the classification sample and the minimum error function value are calculated through the program; then, the minimum error function and the classification number x are drawn. The change relationship curve is shown in Figure 3.
As shown in Figure 3, when the classification number x is 3 or 4, the curvature of the minimum error function changes significantly, and then the value of the sum is calculated according to the formula. The results are shown in Table 4.
By calculating β ( 3 ) and β ( 4 ) , it can be found that the optimal classification result is when the classification number x = 3. According to the data in Table 4, the indicator threshold corresponding to the overtaking conflict time on the two-lane highway is determined. Based on the above research, combined with the overtaking conflict time, the overtaking risk level of the two-lane highway is evaluated, as shown in Table 5.

3.3. The Freight Traffic Conditions of Setting Auxiliary Lanes

According to the two-lane overtaking risk evaluation standard, when the degree of traffic conflict reaches a serious level, it means that overtaking on the two-lane highway is already very dangerous. It is recommended that auxiliary lanes be set up for slow vehicles to facilitate the safe completion of overtaking behaviors by express vehicles.
Based on Formula (15), the traffic volume conditions of auxiliary lanes can be obtained, and the value of overtaking conflict time can be determined according to different conflict levels. When the design speeds are different, the traffic volume values corresponding to different design speeds can be obtained, as shown in Table 6.
Table 6 shows the traffic volume conditions for setting up auxiliary lanes. When the traffic volume of a road section reaches the limit of general conflict and severe conflict, auxiliary lanes can be considered for the road section.
According to the serious conflict traffic volume conditions under each design speed condition in Table 6, the threshold of different freight car proportions can be given. The proportion of trucks ranges from 5 % to 95 %, with an increase of 5% for each level. The conversion coefficient is 2.7 according to the specification and actual situation. The freight car traffic volume is shown in Table 7.
In this paper, the risk assessment of overtaking behavior on the freight two-lane highway was carried out. However, due to the rapid development of the logistics industry, the number of freight cars participating in traffic accidents is also increasing year by year. Therefore, traffic accidents on freight highways should be investigated, and then accident risk assessments should be carried out.

4. Conclusions

(1)
The paper takes the overtaking conflict time of the two-car highway as the risk evaluation index, selects suitable test sections for actual vehicle testing, analyzes the relationship between each test parameter and overtaking conflict time, constructs the two-lane highway overtaking conflict time Tc, and designs the relationship model between speed and traffic volume.
(2)
The paper defines an ordered sample of the overtaking conflict time Tc. The Fisher optimal partition method is used to evaluate the overtaking risk of a two-lane highway. According to the calculation results, the overtaking risk is divided into three levels: serious conflict, general conflict and non-conflict.
(3)
Through the constructed overtaking conflict time model, the relationship expression of traffic volume with conflict time Tc and design speed v is obtained, and different specific truck traffic conditions of different design speed and different risk levels are obtained.

Author Contributions

Methodology; Funding acquisition, G.C.; writing—original draft preparation, C.M.; Investigation; Funding acquisition L.X.; Resources; Funding acquisition, X.K. All authors have read and agreed to the published version of the manuscript.

Funding

This research was funded by the Fundamental Research Funds for the Central Universities (22572021CP01), the Natural Science Foundation of Jilin Province of China (YDZJ202101ZYTS184), the National Natural Science Foundation of China (51778063), S&T Program of Hebei (20557673D) and the Hebei Natural Science Foundation (E2019210305).

Institutional Review Board Statement

Not applicable.

Informed Consent Statement

Informed consent was obtained from all subjects involved in the study.

Data Availability Statement

Data are not publicly available, though the data may be made available on request from the corresponding author.

Acknowledgments

Thanks to the teachers who helped me during the test.

Conflicts of Interest

The authors declare no conflict of interest.

References

  1. Jansuwan, S.; Chen, A.; Xu, X. Analysis of freight transportation network redundancy: An application to Utah’s bi-modal network for transporting coal. Transp. Res. Part A Policy Pract. 2021, 151, 154–171. [Google Scholar] [CrossRef]
  2. Stevenson, M.; Sharwood, L.N.; Wong, K.; Elkington, J.; Meuleners, L.; Ivers, R.Q.; Grunstein, R.R.; Williamson, A.; Haworth, N.; Norton, R. The Heavy Vehicle Study: A case-control study investigating risk factors for crash in long distance heavy vehicle drivers in Australia. BMC Public Health. 2010, 10, 162. [Google Scholar] [CrossRef] [PubMed] [Green Version]
  3. Rowangould, G. Public financing of private freight rail infrastructure to reduce highway congestion: A case study of public policy and decision making in the United States. Transp. Res. Part A 2013, 57, 25–36. [Google Scholar] [CrossRef]
  4. Yuan, Q.; Wang, J. Goods movement, road safety, and spatial inequity: Evaluating freight-related crashes in low-income or minority neighborhoods. J. Transp. Geogr. 2021, 96, 103186. [Google Scholar] [CrossRef]
  5. Kanazawa, H.; Suzuki, M.; Onoda, T.; Yokozawa, N. Excess workload and sleep-related symptoms among commercial long-haul truck drivers. Sleep Biol. Rhythm. 2006, 4, 121–128. [Google Scholar] [CrossRef]
  6. Choudhari, T.; Budhkar, A.; Maji, A. Modeling overtaking distance and time along two-lane undivided rural highways in mixed traffic condition. Transp. Lett. 2020, 1–9. [Google Scholar] [CrossRef]
  7. Cantin, V.; Lavallière, M.; Simoneau, M.; Teasdale, N. Mental workload when driving in a simulator: Effects of age and driving complexity. Accid. Anal. Prev. 2009, 41, 763–771. [Google Scholar] [CrossRef]
  8. Khan, A.M. Bayesian-Monte Carlo Model for Collision Avoidance System Design of Cognitive Connected Vehicle. Int. J. Intell. Transp. Syst. Res. 2012, 11, 23–33. [Google Scholar] [CrossRef]
  9. Clarke, D.D.; Ward, P.J.; Jones, J. Overtaking Road-accidents: Differences in Maneuver as a Function of Driver Age. Accid. Anal. Prev. 1998, 30, 455–467. [Google Scholar] [CrossRef]
  10. Kim, S.; Song, T.-J.; Rouphail, N.M.; Aghdashi, S.; Amaro, A.; Gonçalves, G. Exploring the association of rear-end crash propensity and micro-scale driver behavior. Saf. Sci. 2016, 89, 45–54. [Google Scholar] [CrossRef]
  11. Pawar, N.M.; Velaga, N.R. Investigating the influence of time pressure on overtaking maneuvers and crash risk. Transp. Res. Part F Psychol. Behav. 2021, 82, 268–284. [Google Scholar] [CrossRef]
  12. Polus, A.; Livneh, M.; Frischer, B. Evaluation of the Passing Process on Two-Lane Rural Highways. Transp. Res. Rec. J. Transp. Res. Board 2000, 1701, 53–60. [Google Scholar] [CrossRef]
  13. Llorca, C.; García, A. Evaluation of Passing Process on Two-lane Rural Roads in Spain with New Methodology Based on Video Data. Transp. Res. Record 2011, 2262, 42–51. [Google Scholar] [CrossRef]
  14. Carlson, P.J.; Miles, J.D.; Johnson, P.K. Daytime High Speed Passing Maneuvers observed on Rural Two-Lane, Two-Way Highway: Findings and Implications. Transp. Res. Record 2006, 1961, 9. [Google Scholar] [CrossRef]
  15. Stefansson, E.; Jiang, F.J.; Nekouei, E.; Nilsson, H.; Johansson, K.H. Modeling the decision-making in human driver overtaking. IFAC-PapersOnLine 2020, 53, 15338–15345. [Google Scholar] [CrossRef]
  16. Farah, H. Age and Gender Differences in Overtaking Maneuvers on Two-lane Rural Highways. Transp. Res. Record 2011, 2248, 30–37. [Google Scholar] [CrossRef]
  17. Jenkins, J.M.; Rilett, L.R. Application of Distributed Traffic Simulation for Passing Behavior Study. Transp. Res. Rec. J. Transp. Res. Board 2004, 1899, 11–18. [Google Scholar] [CrossRef]
  18. Clarke, D.D.; Ward, P.J.; Jones, J. Processes and countermeasures in overtaking road accidents. Ergonomics 1999, 42, 846–867. [Google Scholar] [CrossRef]
  19. Molla, S.; Lopez, G.; Rasch, A.; Dozza, M.; García, A. Modelling duration of car-bicycles overtaking manoeuvres on two-lane rural roads using naturalistic data. Accid. Anal. Prev. 2021, 160, 106317. [Google Scholar] [CrossRef]
  20. Fisher, W.D. On Grouping for Maximum Homogeneity. J. Am. Stat. Assoc. 1958, 53, 789–798. [Google Scholar] [CrossRef]
  21. Cheng, G.Z.; Cheng, R.; Xu, L.; Zhang, W.H. Risk assessment of roadside accidents based on occupant injury analysis. J. Jilin Univ. 2020, 51, 875–885. [Google Scholar]
  22. Zhang, C.; Yang, S.X.; Feng, Y.W.; Xu, T.; Zhang, K.L. Expressway dyna mic risk discrimination method based on risk update theory. J. Chang. Univ. 2021, 41, 115–126. [Google Scholar]
Figure 1. Recorded time in experiment.
Sustainability 13 13097 g001
Figure 2. Car representative model ratio.
Sustainability 13 13097 g002
Figure 3. Relationship between the minimum error function and the classification number.
Sustainability 13 13097 g003
Table 1. The average overtaking time and the average overtaking conflict time.
Car Representative ModelAverage Time for Overtaking (s)Average Overtaking Speed (m/s)Average of v2Overtaking Conflict Average Time (s)
Passenger car3.154.664.15.2
Medium car3.157.364.04.9
Oversize vehicle4.365.276.64.6
Artic5.471.579.83.4
Table 2. The variables entered or removed.
ModelInput VariablesVariables RemovedMethod
1C, A, B-Input
Table 3. Parameter estimation.
ParametersEstimation95%
Confidence Interval
Lower LimitUpper Limit
n1.8201.7851.855
p633.073580.275685.870
Table 4. Classification result.
CategoryxMinimum Error
Function Value
Classification
Ordered samples of overtaking conflict time2142.125{1~72}{73~315}-
353.271{1~55}{56~72}{73~315}1.69
431.856{1~32}{33~55}
{56~72}{73~315}
1.47
525.624{1~17}{18~32}{33~55}
{56~72}{73~315}
-
Table 5. Risk assessment standard for overtaking on two-lane highway.
Risk LevelConflict Time ThresholdConflict Level
I(3 s~6 s]Serious conflict
II(6 s~9 s]General conflict
III(9 s~21 s]No conflict
Table 6. The conditions of traffic volume of setting auxiliary lane on two-lane highway (pcu/h).
Traffic Conflict LevelDesigned Speed (km/h)
80604030
Serious conflict>344>309>256>219
General conflict259~344238~309206~256181~219
No conflict<259<238<206<181
Table 7. Truck traffic volume at different speeds.
The Design Speed80 (km/h)60 (km/h)40 (km/h)30 (km/h)
The Volume of Truck Traffic
Truck Ratio
5%16141210
15%41373126
20%51463833
25%60544538
30%68615144
35%75685648
40%82746152
45%88796556
50%93846959
55%98887362
60%102927665
65%106957968
70%110998270
75%1131028472
80%1171058774
85%1201078976
90%1221109178
95%1251129380
Publisher’s Note: MDPI stays neutral with regard to jurisdictional claims in published maps and institutional affiliations.

