Article

What Is the Impact of Microplastics and Lipid Regulators on Marine Meiofauna? Case Study of Polyvinyl Chloride, Atorvastatin, and Simvastatin

1
LR01ES14 Laboratory of Environment Biomonitoring, Coastal Ecology and Ecotoxicology Unit, Faculty of Sciences of Bizerte, University of Carthage, Zarzouna 7021, Tunisia
2
Department of Biology, College of Sciences, Taif University, P.O. Box 11099, Taif 21944, Saudi Arabia
3
National Institute of Research and Development for Biological Sciences, 060031 Bucharest, Romania
*
Author to whom correspondence should be addressed.
These authors contributed equally to this publication.
Sustainability 2021, 13(23), 13190; https://doi.org/10.3390/su132313190
Submission received: 30 October 2021 / Revised: 17 November 2021 / Accepted: 18 November 2021 / Published: 29 November 2021
(This article belongs to the Special Issue Ecology of Aquatic Communities)

Abstract

:
A microcosm experiment was carried out to provide a deeper insight into the toxic mechanisms exerted by two lipid regulator agents, as well as their interactions with the polyvinyl chloride microplastic on marine meiofauna. Two concentrations of Atorvastatin “A” and of Simvastatin “S”, (i.e., 0.6 mg.kg−1 and 6 mg.kg−1), as well as a single dosage of polyvinyl chloride microplastics “P” at 20 mg.kg−1, separately and their combined mixtures (“AP” and “SP”) were used on coastline dwelling marine meiofauna, with a main focus on nematodes. The results showed a significant reduction in meiofauna abundance in treatments compared to control. SIMPER analysis highlighted a significant decrease in the abundance of epigrowth feeders (2A), which possess conical (co) tails, and indistinct (id) amphideal foveas compared to control microcosms, reflected mainly in the decrease in abundance of the species Prochromadorella longicaudata. Furthermore, the contamination with microplastic affected only the omnivores-carnivores guild. Another finding of the current experiment is that the mixtures of microplastic with drugs lead to synergic interactions that increased their toxic effects on marine nematode communities.

1. Introduction

Seafood adequate quality and safety is a major challenge in food sciences and in most fisheries and aquaculture research departments [1]. The ecotoxicological effects of pollutants in marine habitats represent a topic of growing concern. An important class of such chemicals comprises the over-the-counter and prescription drugs by humans at an alarmingly increasing rate. It was reported that up to 90% of these drugs end in aquatic habitats via human egesta through wastewater, leaks from septic tanks, and landfills [2].
The increasing consumption of cardiovascular drugs and lipid regulator is currently recorded at alarming rates in western countries, such as Germany, UK, and Canada [3,4,5]. In the USA, the most widespread lipid regulator agents are Simvastatin “S” (hereafter S) and Atorvastatin “A” (hereafter A) [6,7]. Statins comprise lipid regulators that inhibit the cholesterogenesis in liver, hence reducing the cholesterol production in the human body [8]. These compounds are known to induce toxic effects on aquatic invertebrates too, as it was proved for A [9] and S [10], respectively. Moreover, these compounds are absorbed by other organic compounds in marine sediments [11,12].
Another major class of emerging pollutants in marine habitats are the microplastics. Whereas plastic particles >5 mm in diameter can be consumed by marine biota [13], smaller particles, defined as microplastics [14,15], are not easily removable from the marine environment [16]. The microplastics represent nowadays one of the most undesirable and widespread types of contaminants in marine habitats [17,18,19,20]. Of special concern is the polyvinyl chloride (hereafter P), which adsorbs a variety of other pollutants, such as drugs and heavy metals [21,22,23,24].
Free-living marine nematodes comprise a very diverse and abundant group of benthic organisms [25]. These worms represent a key-group essential for the wellbeing of marine benthic habitats; hence their wide usage as bioindicators in routine environmental biomonitoring programs [26,27,28,29,30]. Their small body-size and fast life cycle, associated with the ease of their maintenance in laboratory conditions, makes this group very useful in ecotoxicological studies [31,32,33]. Our aim was to investigate the multifaceted effects of single (i.e., A, S and P, respectively), as well as of their combined (i.e., AP and SP) interactions on the abundance, diversity, and potential changes in the ratio of functional traits of typical coastline dwelling nematode communities. We expected polyvinyl chloride and lipid regulators to induce visible negative effects on all meiobenthic taxa, as well as for their mixture. Another working hypothesis is that the effect would be of additive nature given no chemical interactions are known among the tested xenobiotics.

2. Material and Methods

2.1. Collecting Site and Sediment Manipulation

Sediments were collected on 1 December 2020 from a subtidal site (37°16′435″ N, 9°52′ 453″ E) within the harbor of Bizerte, Tunisia. Multiple hand cores (10 cm2 area) were employed to sample the top layer (i.e., 5 cm) of sediment at 50 cm below water surface, according to Hedfi [34]. The sampling was restricted to the first 5 cm of sediment because, in most coastal habitats with fine sediments, more than 90% of the meiofauna are found in the surface 1–2 cm [34]. The collected sediment was stored in a room with fixed lighting (10.5 h light/13.5 h dark) and temperature (21 °C/16 °C) for three days of acclimatization. The room temperature used in the current experiment was based on the temperature recorded (http://www.infoclimat.fr accessed on 30 November 2020) for the previous month (i.e., November 2020).

2.2. Sediment Contamination and Experiment Set-Up

Before the experiment, a part of the collected sediments was defaunated by repeated freezing (3 times) at −20 °C and thawing (12 h/48 h), according to Schratzberger et al. [35]. Following the removal of coarser particles by sieving (1 mm), the rest of the sediment was kept for acclimatization for one week. Simultaneously, a stock solution (2 g.L−1) of A and S (Sigma-Aldrich) was diluted in dimethyl sulfoxide (DMSO) and kept in dark at room temperature. The stock solution was used to enrich 100 g of defaunated sediment for sediment concentrations of 0.6 mg.kg−1 of A1 and S1 and 6 mg.kg−1 of A2 and S2, respectively. The sediment concentrations of A and S were chosen based on invertebrates LC 50/96 h used in toxicological studies [9,10]. The experiment lasted for one month [31,32,33]. Spherical particles of microplastics (>40 µm; MW = 48,000 g.mol−1, 16 mmol of Cl. g−1, 99%) were added as such as to contaminate 100 g of defaunated sediment with a concentration of 20 mg.kg−1 [36].
Overall, 30 sets were prepared (three replicates for each set) using a factorial design approach: one set comprised the control, one set of sediment was contaminated with P, two sets of sediments were contaminated with the employed concentrations of A, and the other two with S. Moreover, two sets were contaminated with a mixture of P and each of the A concentrations; two sets of sediments contaminated by a mixture of P and each of the S concentrations.
Each microcosm was filled with 200 g of sediment with natural meiofauna mixed with 100 g of contaminated defaunated sediment and topped with one liter of filtered water (40 μm). The control experimental set “C” was obtained by mixing 100 g uncontaminated defaunated sediment with 200 g of natural sediment. Each system consisted of a 2-litre glass bottle, which was constantly aerated through an aquarium pump throughout the experiment [34,36].

2.3. Meiofauna Analyses

The meiofauna was removed from the sediment using two sieves with mesh sizes of 1 mm and 40 µm, respectively [37], then stained with Rose-Bengal (0.2 g.L−1) [38] and fixed in 4% formalin [35]. Afterwards, 100 randomly collected nematodes per replicate were removed under a dissecting microscope and transferred into 21% glycerol vials [39]. Species identification was done using the taxonomic keys of Platt and Warwick [40,41], Warwick et al. [42], as well as the Ghent University database [43]. Five functional traits were also quantified in the current experiment:
Feeding groups classified according to Wieser [44] as follows: selective deposit feeders (1 A), epigrowth feeders (2 A), and omnivores/predators (2 B), non-selective deposit feeders (1 B).
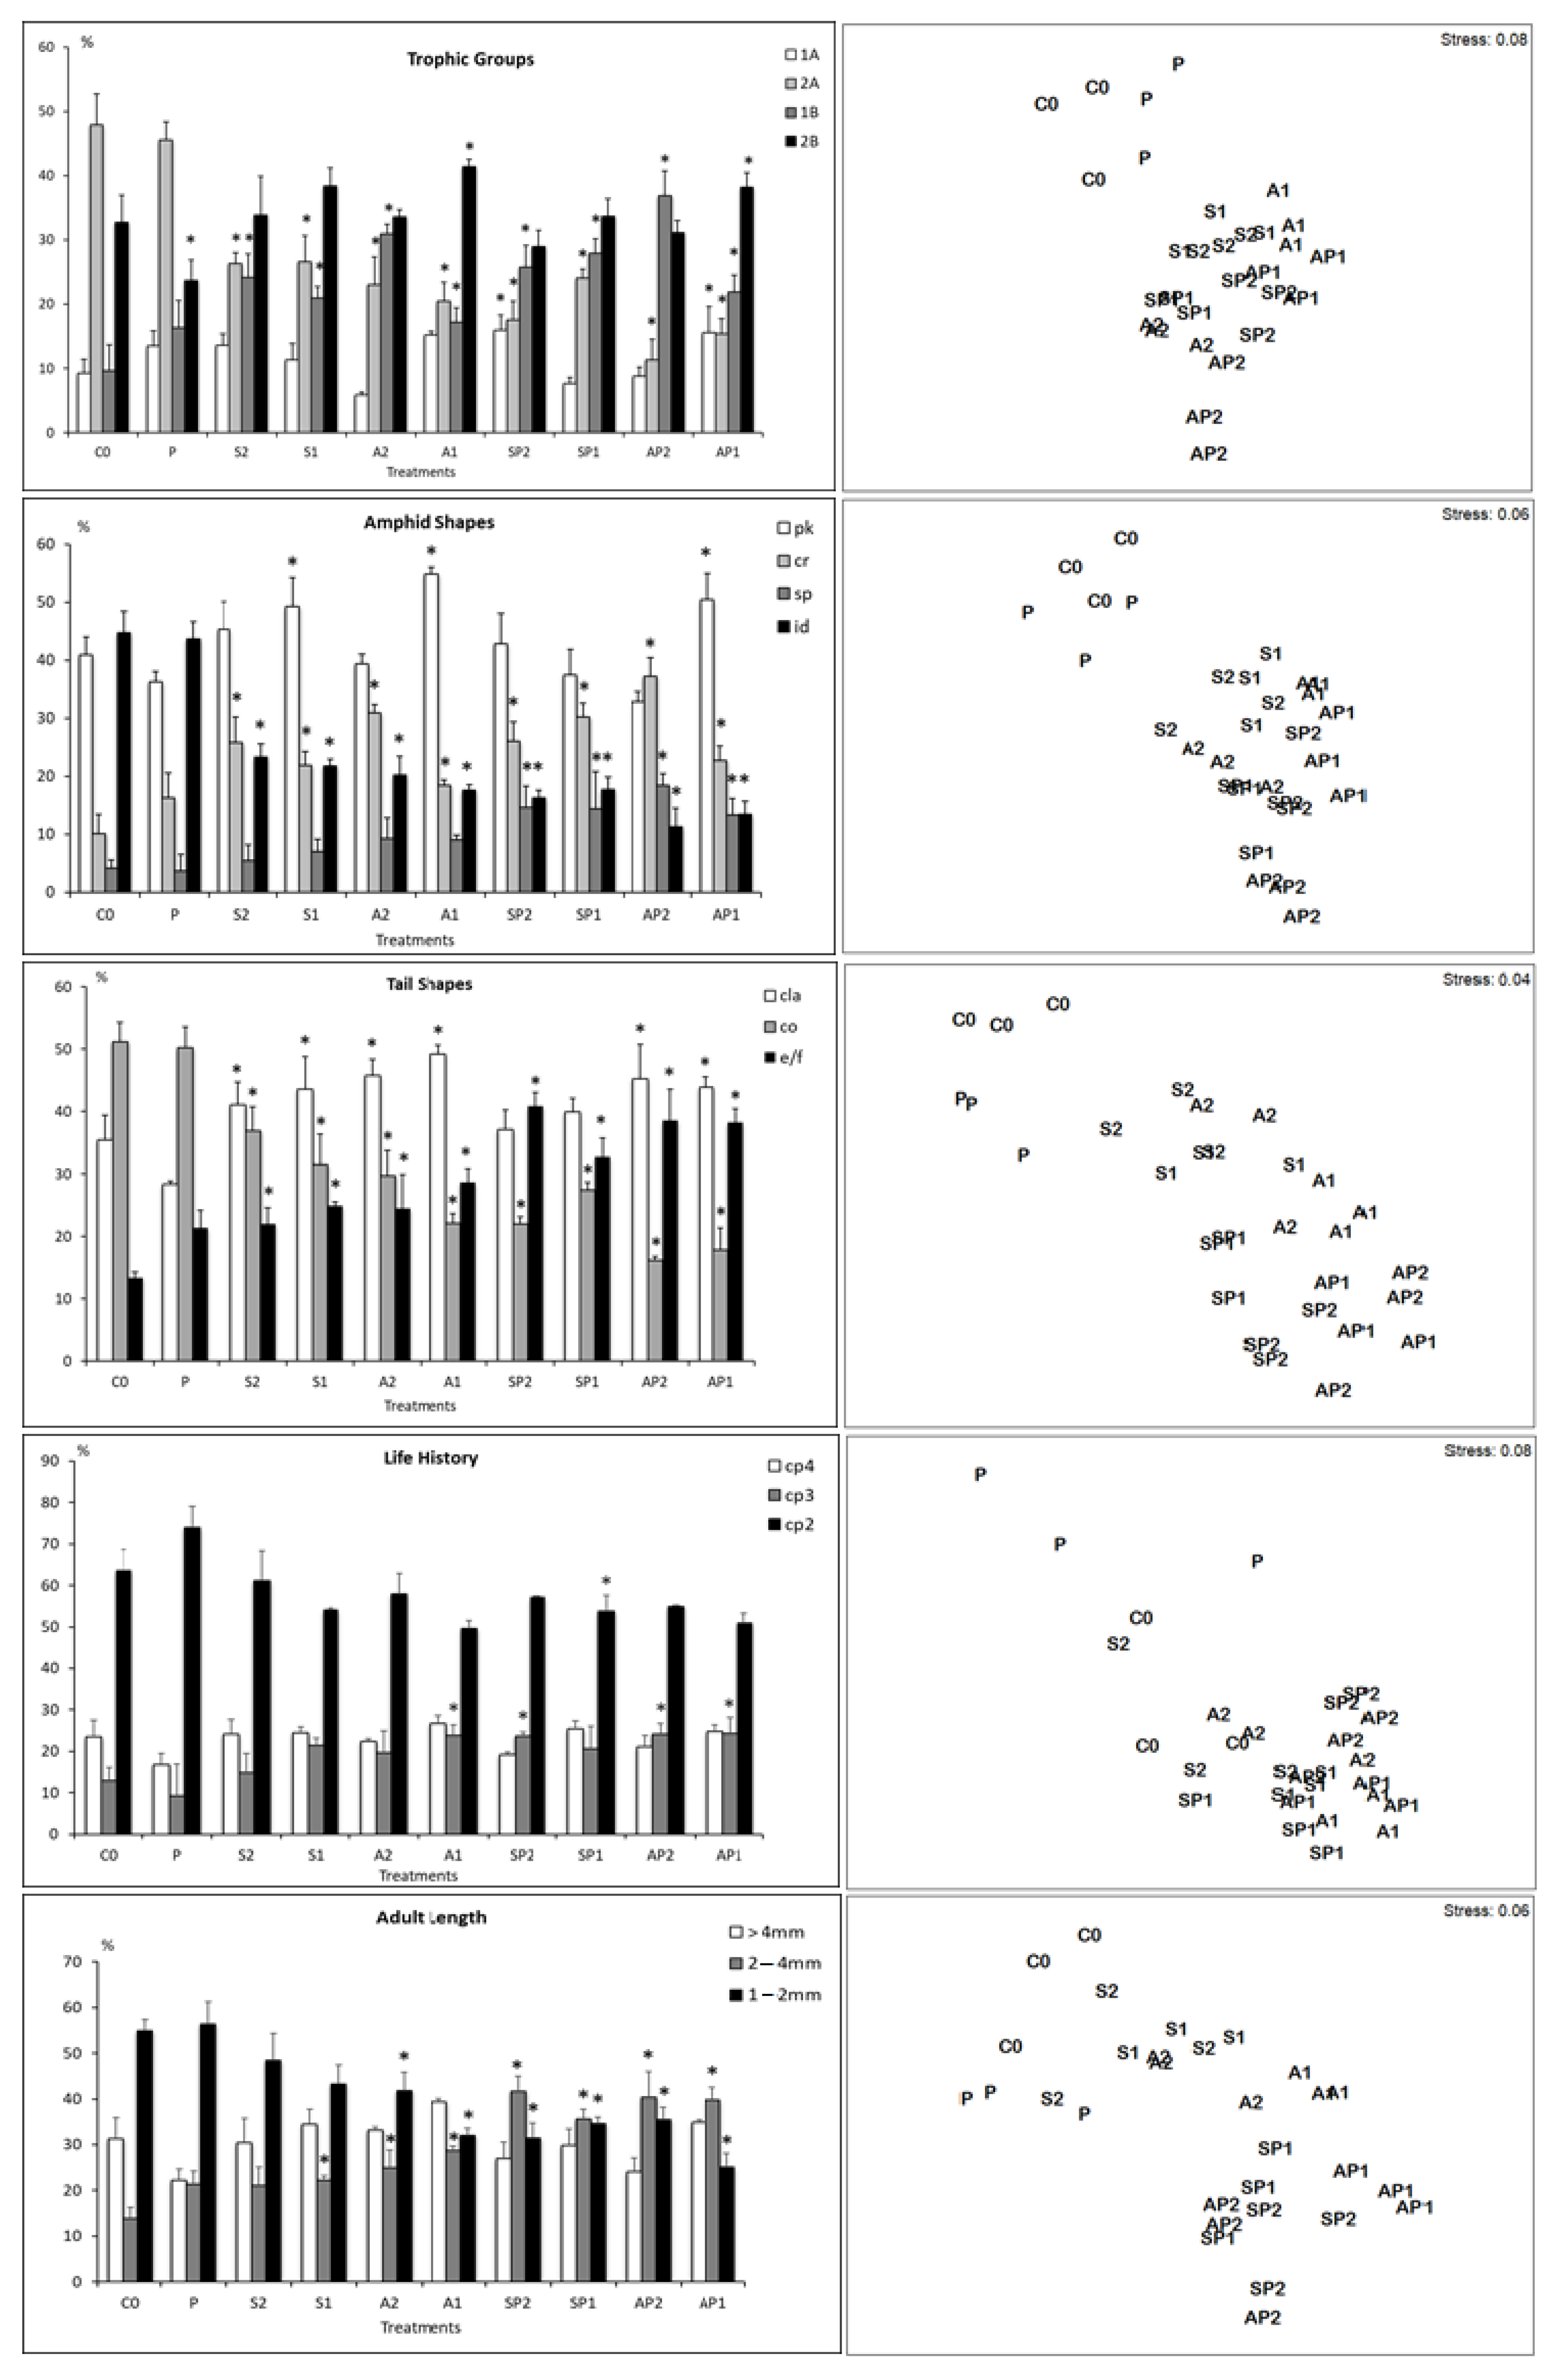
  • The shape of tails, according to Thistle et al. [45] as follows: conical (co), short/round (s/r), clavate/conico-cylindrical (cla), and elongated/filiform (e/f).
  • The shape of amphideal fovea, according to Semprucci et al. [29], as follows: spiral (Sp), circular (Cr), indistinct (Id), and pocket (Pk).
  • The life history (c–p scores), according to Bongers et al. [46] ranked from 1 to 5.
  • The length of adults, according to Schratzberger et al. [47] divided in the following size-classes: 1–2 mm, 2–4 mm, and ˃4 mm. The body-size was measured using a Nikon DS-Fi2 camera coupled with a Nikon microscope (Image Software NIS Elements Analysis Version 4.0 Nikon 4.00.07ebuild 787e64 bit).

2.4. StatisticalAanalyses

The abundance of nematodes (N), taxonomic richness (S), the Shannon-Wiener index (H’), and Pielou’s evenness (J’) were calculated using PRIMER v5.0 software [48,49], after data normalization (Kolmogorov–Smirnov test) and assessing the homogeneity of variance (Bartlett test). A log10 (x + 1) transformation was applied to data for parametric analyses [48,50]. One-way ANOVA, followed by multiple post hoc comparison Tukey HSD tests were performed in STATISTICA (v5.1) to check the differences of the measured metrics among treatments. Multidimensional non-metric ordination (nMDS) was performed using species abundance data, following their square roots transformation, and was based on Bray-Curtis similarity matrix. ANOSIM analysis was used to determine possible significant differences between the nematode assemblages from different types of microcosms. SIMPER analysis (similarity percentage) allowed the identification of most contributing species to the dissimilarity/similarity among control and treatments. Another nMDS ordination was performed to identify which functional traits influenced the response of various species to treatments.

3. Results

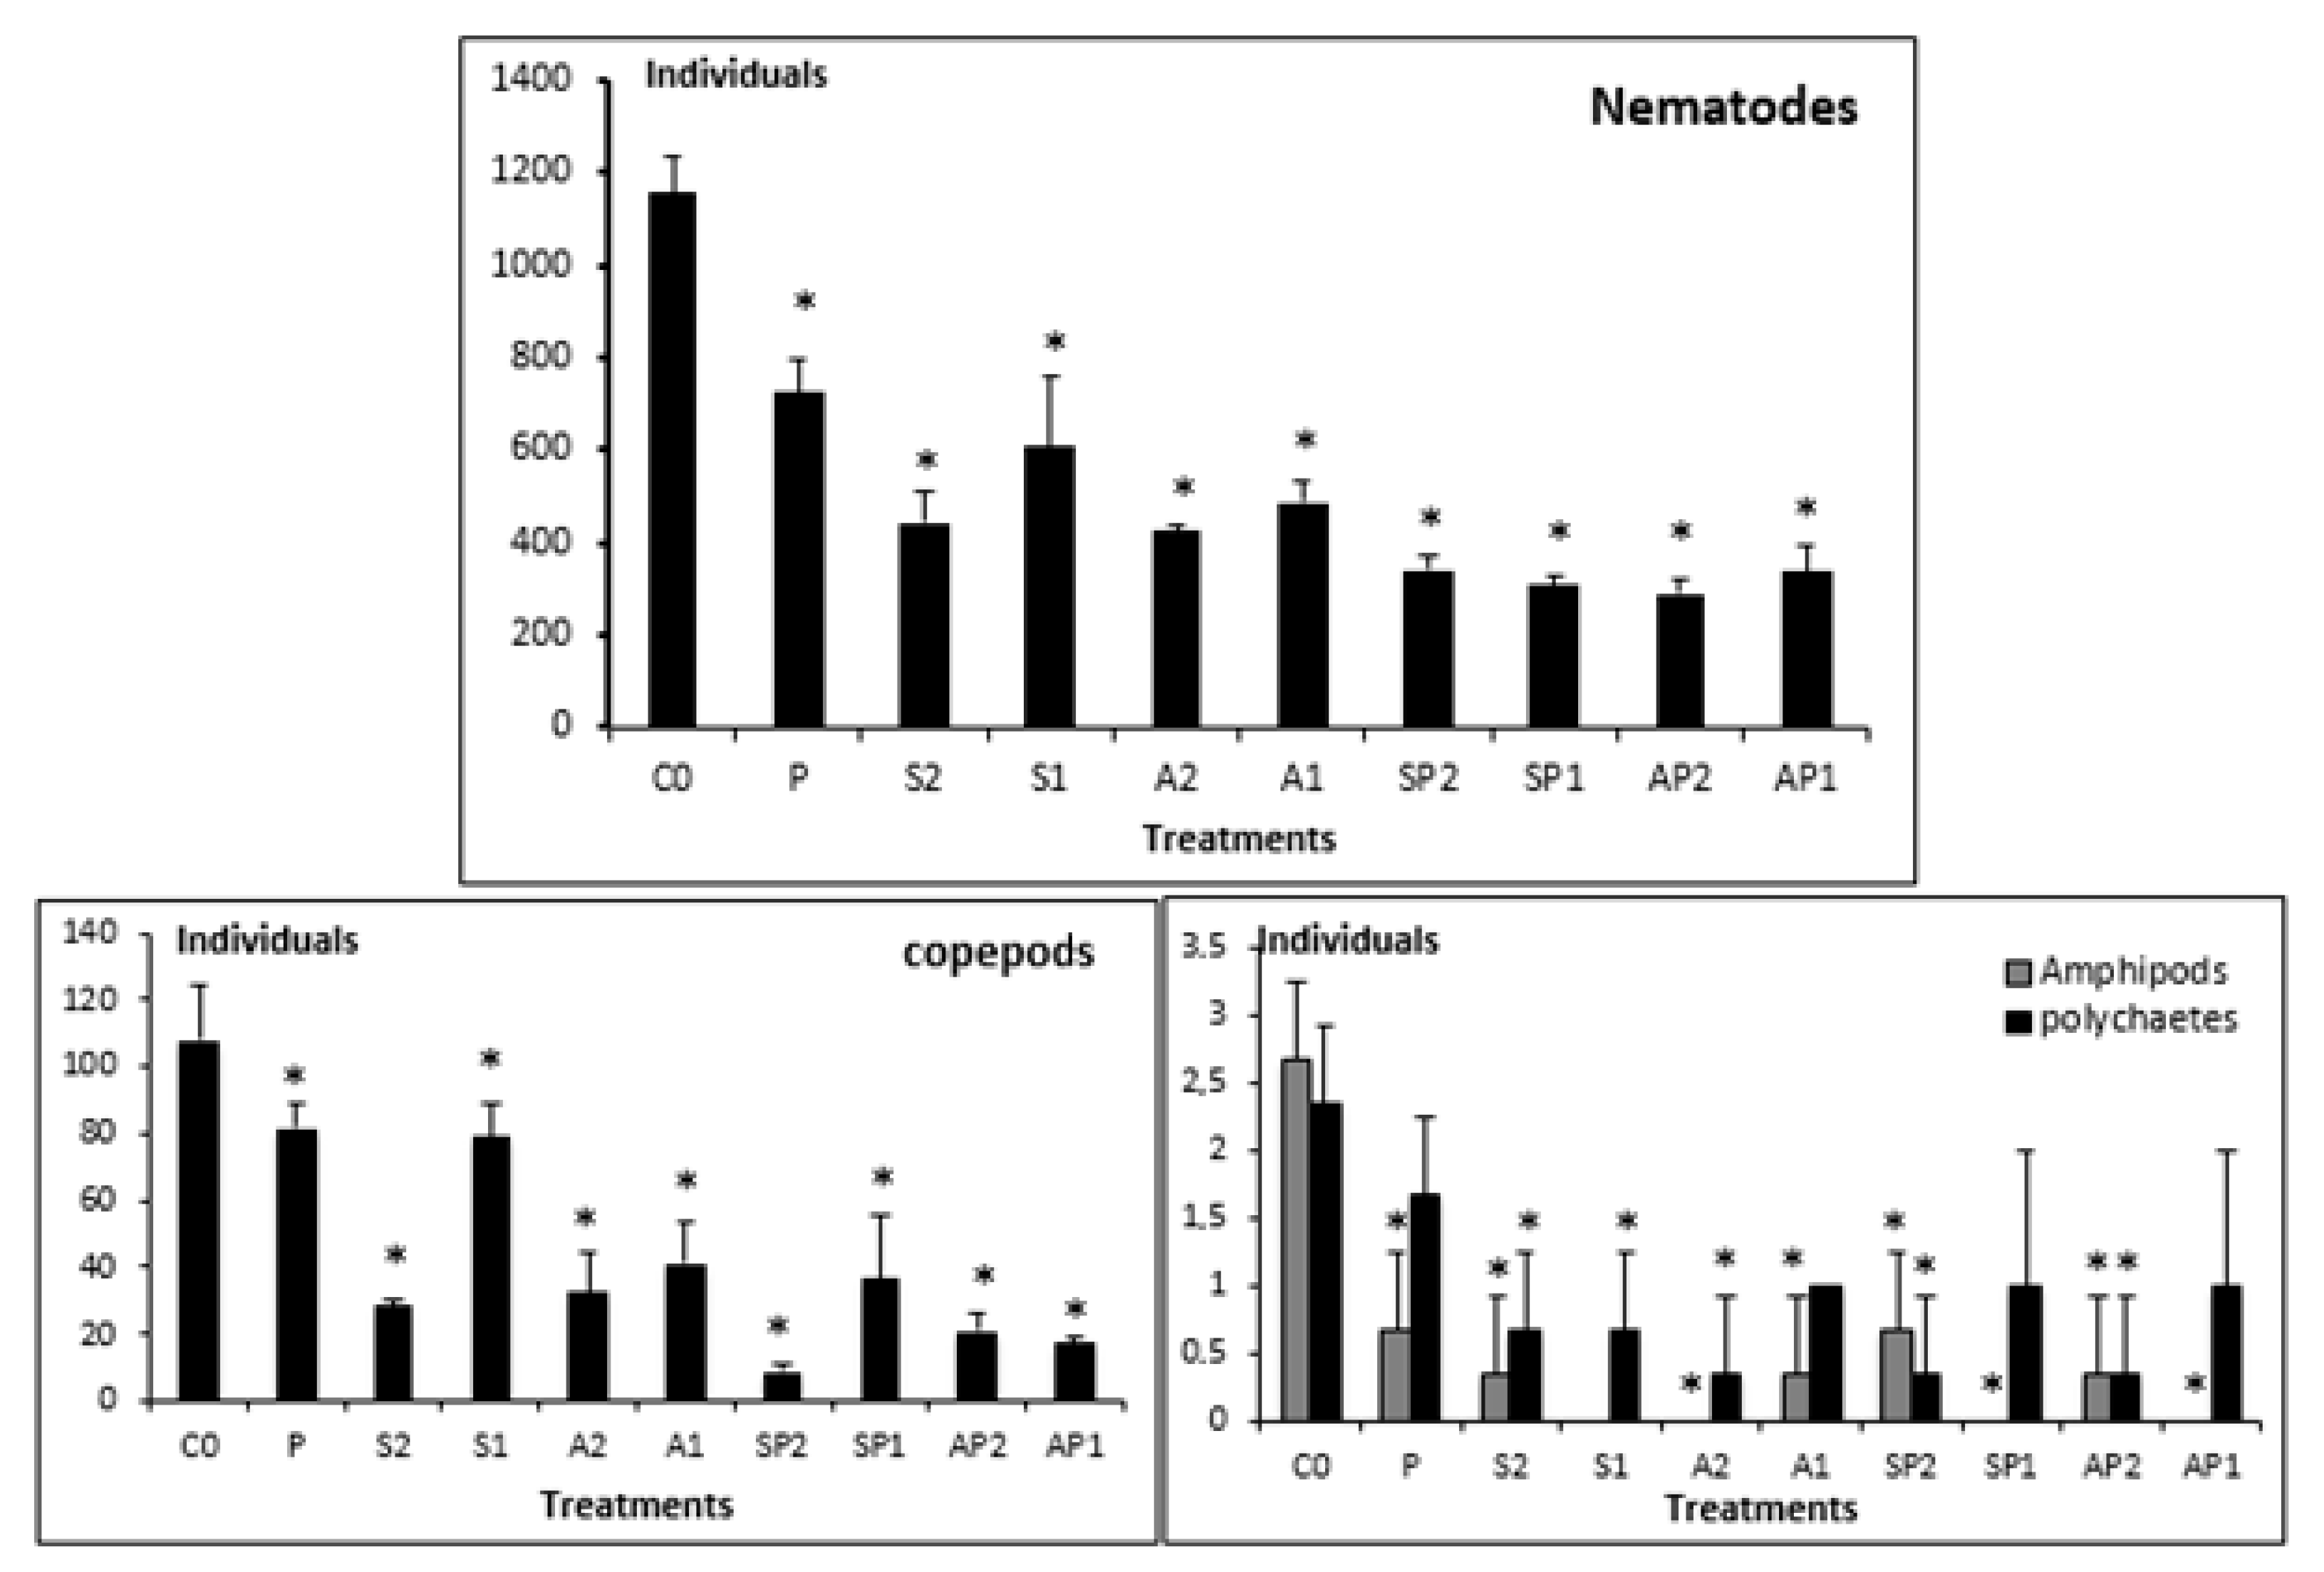
3.1. Meiofaunistic Abundances

The control microcosms were dominated by the end of the experiment by free-living marine nematodes (1154.66 ± 79.54 individuals/microcosm) (ind.mic−1). The second most abundant group was the copepods (108 ± 16.64 ind.mic−1), followed by amphipods (2.66 ± 0.57 ind.mic−1), and polychaetes (2.33 ± 0.57 ind.mic−1) (Figure 1).
Compared to control experimental sets, a significant reduction (p < 0.05, Tukey’s HSD test, Figure 1) in nematodes’ abundance was observed, mainly in treatment AP2 (290.33 ± 31.34 ind.mic−1), which showed the lowest abundance. Likewise, the copepod abundance showed a significant decrease in all treatments, mainly in SP2 (9 ± 2 ind.mic−1). The abundance of polychaetes and amphipods followed a similar pattern (Figure 1).

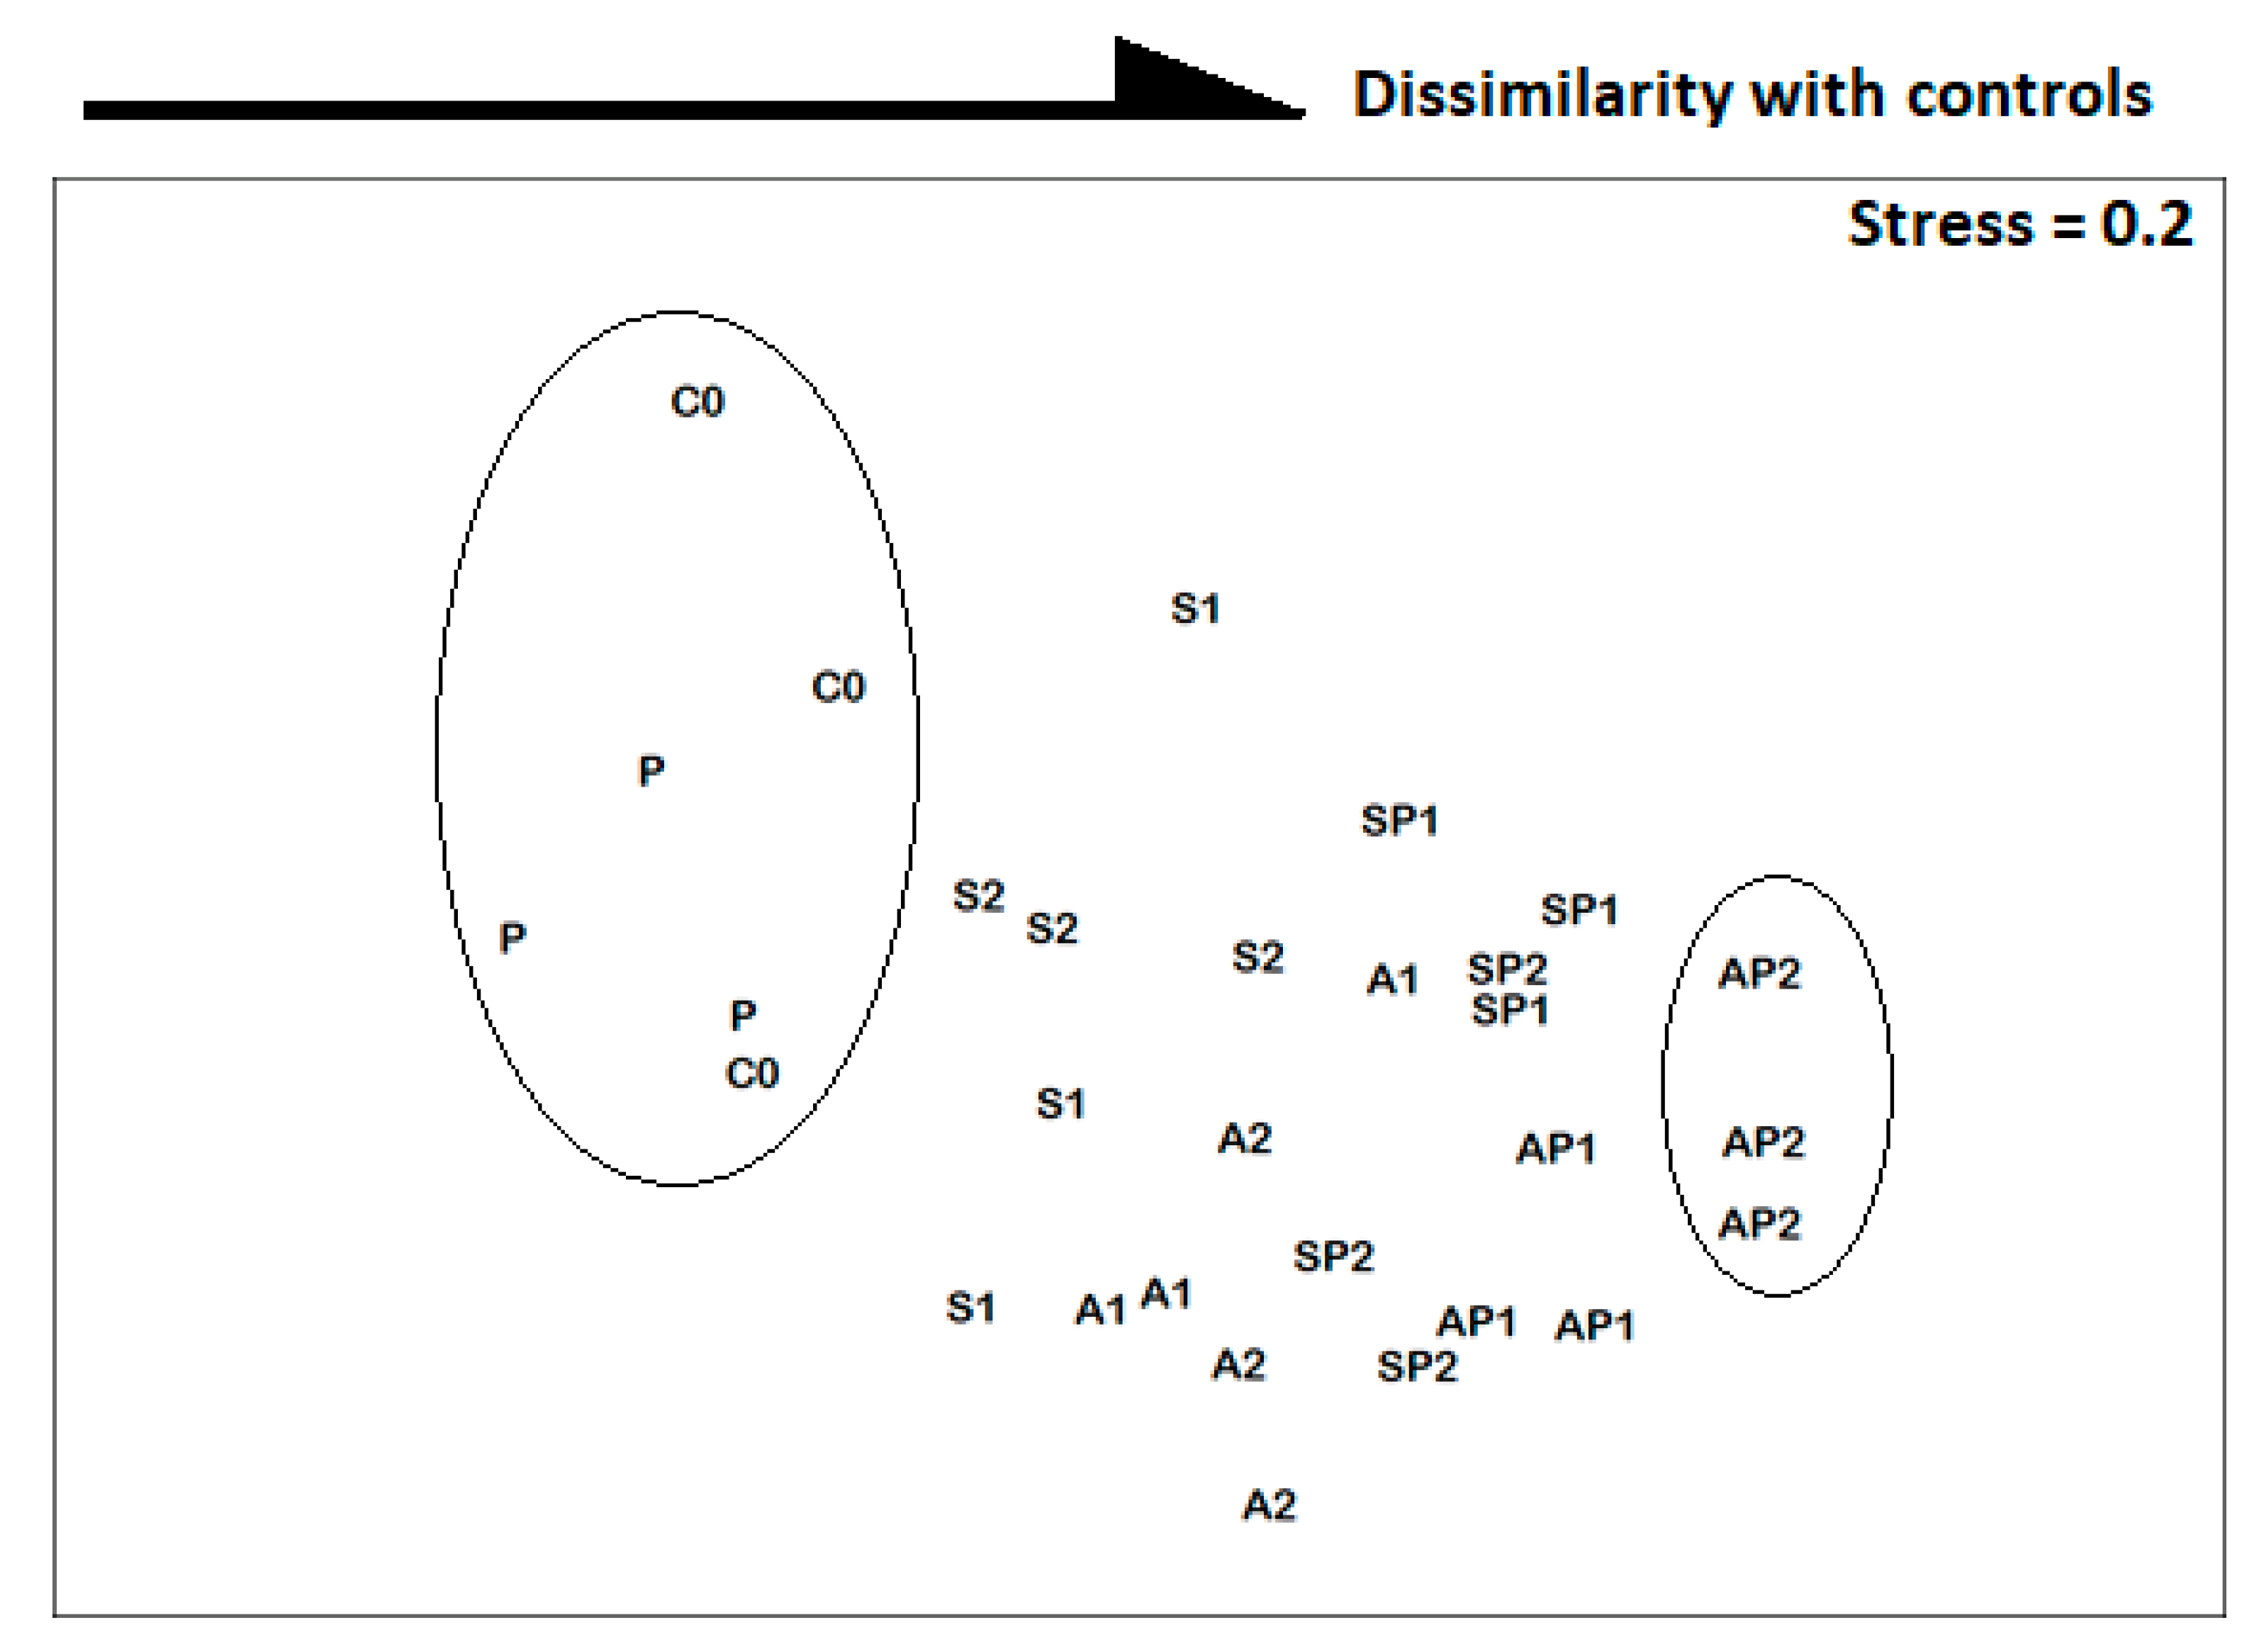
3.2. Taxonomic Diversity of Nematodes

The free-living marine nematodes comprised 20 species spanning 5 orders, 12 families, and 18 genera; the families Xyalidae and Oncholaimidae were dominant (Table 1).
By the end of the experiment the control treatment (C0) was dominated by Prochromadorella longicaudata (30.67 ± 1.53%), Oncholaimus campylocercoides (16.67 ± 1.15%), Anticoma eberthi (6 ± 1%), and Metalinhomoeus numidicus (6 ± 1%), respectively, comprising less than 5% of the nematofauna after one month-exposure. In treatments P, a similar trend was observed for the diversity indices, the community being dominated by P. longicaudata (28.33 ± 1.53%). The treatments S2 (17.67 ± 3.21%), S1 (18.67 ± 1.53%), A2 (16.67 ± 0.58%), and A1 (21 ± 1%) were dominated by O. campylocercoides. The same species dominated the treatments SP2 (15.33 ± 0.58%), SP1 (16.33 ± 1.53%), AP2 (16.67 ± 0.58%) and “AP1” (21 ± 1%) (Table 1).
The species richness (S) and diversity indices (d and H’) revealed significant differences compared to C0 (p < 0.05, Tukey’s HSD test, Figure 2), revealing a surprisingly increase of the overall nematode diversity (Figure 2).
The nMDS output indicated a significant effect induced by S, A, and P alone or by their mixtures on species distribution within the ordination space (stress = 0.2). The AP2 treatment was most dissimilar compared to C0, whereas the P community was the closest to control (Figure 3).
The average dissimilarity value increased following the pattern “P” → “S1” → “S2” → “A2” → “A1” → “SP1” → “SP2” → “AP1” → “AP2” (Table 2). The ANOSIM results (R-statistics = 0.422−1, p-value < 0.05, Table 2) indicated the presence of various taxonomic categories of nematodes, confirming the trends noticeable in the nMDS representation (Figure 3).
SIMPER results indicated that the abundance of P. longicaudata decreased in all treatments except for “P”, whereas the abundance of the nematode Marylynnia puncticaudata increased in the combined treatments, driving most of the noticed dissimilarity noticeable in the MDS graphic representation (Table 2).

3.3. Functional Diversity of Nematodes

The C0 nematofauna was dominated by epigrowth feeders (2A) and omnivores carnivores (2B), with conical (co) and clavate (cla) tails, indistinct (id), pocket-like (pk) amphids, life history groups c-p 2, and length intervals 1–2mm. Except for treatment P, the contamination led to a significant modification of feeding groups, amphid shape, tail shape, life history, and adult length composition, respectively (Figure 4).
SIMPER results revealed a significant decrease in the abundance of the epigrowth guild (2A), with conical (co) tails, and indistinct (id) amphids compared to C0. Conversely, SIMPER results also revealed a significant increase in nematodes’ abundance with a c-p score of 3, compared to C0. To a lesser extent, some treatments showed an increase in the number of taxa belonging to 1B and 2B guilds, with circular (cr) and pocket-like (pk) amphids, respectively (Table 2).
The nMDS second-stage ordination showed that the responses of nematode species to the different treatments depended mainly on their shapes of amphids (86.45%), tails (83.21%), and composition of trophic guilds (82.39%) (Figure 5).

4. Discussion

The control community was dominated by small-sized (1–2 mm), epigrowth feeding species (2A), dominated by P. longicaudata, along with larger (>4 mm), omnivore-carnivore (2B) species, which was dominated by O. campylocercoides. The contamination with P showed no clear changes in the taxonomic composition of the nematode communities, except for the guild2B, which slightly decreased during the experiment. Species belonging to this trophic guild have large mouth openings and also ingest small grains as part of their diet [51], hence temptingly leading to a potential correlation between the level of contamination with microplastics and mortality rate of this group.
The knowledge of toxic effects of A on benthic invertebrates is scant. Previous investigations reported concentrations as low as 76 ng.L−1 in raw wastewater and 37 and 22.4 ng.L−1, respectively, in wastewater treatment plant outlets [52]. These concentrations of A imposed however little risk for benthic invertebrates [9]. The employed concentrations of A from the current experiment closely followed those previously reported for the marine amphipod Hyalella azteca LC50 [9]. Previous studies reported S in the inlet of Canadian wastewater treatment plants concentrations of 4 ng.L−1 and 1 ng.L−1, in the outlets, respectively. Previous experimental essays reported high toxic (LC50) effects of S on harpacticoid copepods and larval grass shrimp for 96 h contaminations at 0.81 mg.L−1 and 1.18 mg.L−1, respectively [53]. The exposure to sublethal levels, reported by the same authors, showed several important consequences on the growth and development rate of harpacticoid copepods and assumed that S might have had negative effects on growth-related traits. The current study showed a significant negative effect of S on meiofauna abundance and on most measured functional traits of nematodes. The effects of S contamination were comparable to that induced by A. These results also corroborate the comparable LC50s of these drugs observed on small amphipods.
Overall, the combined treatments AP and SP had stronger negative effects on the meiofauna community than each contaminant acting alone. These findings suggest that there was a synergic effect between polyvinyl chloride and these drugs. The increased surface to volume ratio of microplastics usually leads to high adsorption rates for various contaminants [23], such as heavy metals [22], antibiotics [24], and organic pollutants [21]. These chemicals bond with microplastics and penetrate living organisms following their ingestion, leading to toxicologic effects [54]. This could, at least in part, explain the significant decrease of meiofauna abundance in these treatments. However, according to the univariate indices, neither the A nor S contamination alone, nor their combinations with P, significantly influenced the nematode diversity. Still, the taxonomic composition of the nematode communities differed in treatments compared to control in terms of functional traits. Contrary to our expectations, at first glance it seems that the contamination actually proved to be beneficial for some taxa.
According to the SIMPER results (Table 2) M. puncticaudata was dominant in AP and SP treatments, but the abundance of P. longicaudata significantly decreased, in most treatments, except for P. Despite both species sharing several similarities it is possible that the differences in their body-size and life cycles to have led to the replacement of the latter group by the former. Likewise, the SIMPER results also indicated that Family Xyalidae (i.e., Theristus flevensis and Paramonohystera wieseri) mostly benefited from S treatment, same as Anticoma eberthi (in A1) and Metalinhomoeus numidicus (in A2) (Table 2).
The nMDS second stage (Figure 5) indicated that the shape of amphids’ shape, followed by tail shape and feeding type, were the most important parameters affected in treatments. The amphid shape underwent a strong change with the decrease of indistinct shape (id) and the increase of circular (cr) and spiral (sp) shapes. Wakkaf et al. reported that the relative dominance of circular amphids’ shape could explain their ability to detect and avoid pollutant.

5. Conclusions

Despite the wealth of ecotoxicological studies based on marine meiofauna as bioindicators, a considerable paucity of work related to the impact of microplastics on this diverse group is still present. To our knowledge, the current experiment is the first that investigated the effects of lipid regulators on meiofauna, with a main focus on free-living marine nematodes. Additionally, this study provided a better insight into the intimate interactions between atorvastatin, simvastatin, and microplastics, respectively.
The results of the current experiment revealed a significant toxic effect on meiofauna abundances. Interestingly, the Shannon index values for all treatments were close to control. However, SIMPER analysis reported significant modifications of nematodes diversity and identified the main functional traits that contributed most to the dissimilarity among control and treatments, namely that of epigrowth feeders (2A), with conical (co) tails and indistinct (id) amphids. Contamination with microplastics had noticeable impact only on the 2B trophic group, while the interactions between lipid regulator agents and microplastics revealed synergic interactions, resulting in increased toxicity of drugs.

Author Contributions

Conceptualization, M.A. (Mohamed Allouche), S.I. and F.B.; methodology, B.A. and M.A. (Mohamed Allouche); validation, A.H., M.B.A. and F.B.; formal analysis, B.A., M.A. (Mohamed Allouche), A.H. and M.B.A.; investigation, A.N. and F.B.; writing-original draft preparation, M.A. (Mohamed Allouche) and S.I.; writing—review and editing, M.A. (Mohammed Almalki), S.I., F.B. and O.P.; supervision, F.B.; project administration, B.A. and M.A. (Mohammed Almalki) All authors have read and agreed to the published version of the manuscript.

Funding

This work was supported by the Tunisian Ministry of the High Education and Scientific Research. The authors are grateful to the Deanship of Scientific Research for funding this article by Taif University Research Supporting Project number (TURSP-2020/301), Taif University, Taif, Saudi Arabia. O.P. was supported by the National Core Program—Romanian Ministry of Research and Innovation Program, project 25 N 2019 BIODIVERS 19270103.

Institutional Review Board Statement

Not applicable.

Informed Consent Statement

Not applicable.

Data Availability Statement

The data are not shared due to restrictions, e.g., privacy and regulation.

Conflicts of Interest

The authors declare no conflict of interest.

References

  1. Selamoglu, M. Importance of the cold chain logistics in the marketing process of aquatic products: An update study. J. Surv. Fish. Sci. 2021, 8, 25–29. [Google Scholar]
  2. Cunningham, V.L.; Buzby, M.; Hutchinson, T.; Mastrocco, F.; Parke, N.; Roden, N. Effects of human pharmaceuticals on aquatic life: Next steps. Environ. Sci. Technol. 2006, 40, 3457–3462. [Google Scholar] [CrossRef] [Green Version]
  3. Gore, M.; Sadosky, A.; Leslie, D.; Sheehan, A.H. Selecting an appropriate medication for treating neuropathic pain in patients with diabetes: A study using the UK and Germany Mediplus databases. Pain Pr. 2008, 8, 253–262. [Google Scholar] [CrossRef] [PubMed]
  4. Grimmsmann, T.; Schwabe, U.; Himmel, W. The influence of hospitalisation on drug prescription in primary care–a large-scale follow-up study. Eur. J. Clin. Pharmacol. 2007, 63, 783–790. [Google Scholar] [CrossRef] [PubMed]
  5. Ghoshdastidar, A.J.; Fox, S.; Tong, A.Z. The presence of the top prescribed pharmaceuticals in treated sewage effluents and receiving waters in Southwest Nova Scotia, Canada. Environ. Sci. Pollut. Res. 2015, 22, 689–700. [Google Scholar] [CrossRef] [PubMed]
  6. Fuentes, A.; Pineda, M.; Venkata, K. Comprehension of top 200 prescribed drugs in the US as a resource for pharmacy teaching, training and practice. Pharmacy 2018, 6, 43. [Google Scholar] [CrossRef] [Green Version]
  7. Mc Namara, K.; Alzubaidi, H.; Jackson, J.K. Cardiovascular disease as a leading cause of death: How are pharmacists getting involved? Integr. Pharm. Res. Pract. 2019, 8, 1–11. [Google Scholar] [CrossRef] [Green Version]
  8. Wilson, S.; Simari, R.D.; Best, P.J.; Peterson, T.E.; Lerman, L.O.; Avirman, M.; Nath, K.A.; Holmes, D.R., Jr.; Lerman, A. Simvastatin preserves coronary endothelial function in hypercholesterolemia in the absence of lipid lowering. Arterioscler. Thromb. Vasc. Biol. 2001, 21, 122–128. [Google Scholar] [CrossRef] [Green Version]
  9. Dussault, E.B.; Balakrishnan, V.K.; Sverko, E.D.; Solomon, K.R.; Sibley, P.K. Toxicity of human pharmaceuticals and personal care products to benthic invertebrates. Environ. Toxicol. Chem. 2008, 27, 425–432. [Google Scholar] [CrossRef]
  10. Key, P.B.; Hoguet, J.; Reed, L.A.; Chung, K.W.; Fulton, M.H. Effects of the Statin Antihyperlipidemic Agent Simvastatin on Grass Shrimp, Palaemonetes pugio. Environ. Toxicol. 2008, 23, 153–160. [Google Scholar] [CrossRef]
  11. Chen, X.Q.; Cho, S.J.; Li, Y.; Venkatesh, S. Prediction of Aqueous Solubility of Organic Compounds Using a Quantitative Structure–Property Relationship. J. Pharm. Sci. 2002, 91, 1838–1852. [Google Scholar] [CrossRef] [PubMed]
  12. Estimation Program Interface (EPI) Suite. Available online: https://www2.epa.gov/tsca-screening-tools (accessed on 7 November 2020).
  13. Strungaru, S.A.; Jijie, R.; Nicoara, M.; Plavan, G.; Faggio, C. Micro-(nano) plastics in freshwater ecosystems: Abundance, toxicological impact and quantification methodology. TrAC Trends Anal. Chem. 2019, 110, 116–128. [Google Scholar] [CrossRef]
  14. Tagg, A.S.; Sapp, M.; Harrison, J.P.; Ojeda, J.J. Identification and quantification of microplastics in wastewater using focal plane array-based reflectance micro-FT-IR imaging. Anal. Chem. 2015, 87, 6032–6040. [Google Scholar] [CrossRef] [PubMed] [Green Version]
  15. de Souza Machado, A.A.; Kloas, W.; Zarfl, C.; Hempel, S.; Rillig, M.C. Microplastics as an emerging threat to terrestrial ecosystems. Glob. Chang. Biol. 2018, 24, 1405–1416. [Google Scholar] [CrossRef] [PubMed] [Green Version]
  16. Eerkes-Medrano, D.; Thompson, R.C.; Aldridge, D.C. Microplastics in freshwater systems: A review of the emerging threats, identification of knowledge gaps and prioritisation of research needs. Water. Res. 2015, 75, 63–82. [Google Scholar] [CrossRef]
  17. Aytan, U.; Valente, A.; Senturk, Y.; Usta, R.; Esensoy Sahin, F.B.; Mazlum, R.E.; Agirbas, E. First evaluation of neustonic microplastics in Black Sea waters. Mar. Environ. Res. 2016, 119, 22–30. [Google Scholar] [CrossRef]
  18. Andrady, A.L. The plastic in microplastics: A review. Mar. Pollut. Bull. 2017, 119, 12–22. [Google Scholar] [CrossRef]
  19. Öztekin, A.; Bat, L. Microlitter Pollution in Sea Water: A Preliminary Study from Sinop Sarikum Coast of the Southern Black Sea. Turk. J. Fish. Aquat. Sci. 2017, 17, 1431–1440. [Google Scholar] [CrossRef]
  20. Silva, A.B.; Bastos, A.S.; Justino, C.I.L.; da-Costa, J.P.; Duarte, A.C.; Rocha-Santos, T.A.P. Microplastics in the environment: Challenges in analytical chemistry-a review. Anal. Chim. Acta. 2018, 1017, 1–19. [Google Scholar] [CrossRef]
  21. Heskett, M.; Takada, H.; Yamashita, R.; Yuyama, M.; Ito, M.; Geok, Y.B.; Ogata, Y.; Kwan, C.; Heckhausen, A.; Taylor, H.; et al. Measurement of persistent organic pollutants (POPs) in plastic resin pellets from remote islands: Toward establishment of background concentrations for international pellet watch. Mar. Pollut. Bull. 2012, 64, 445–448. [Google Scholar] [CrossRef] [PubMed]
  22. Jasna, M.L.; Jelena, L.; Pero, T.; Varezić, D.B.; Šiljić, J.; Pribudić, J. Levels of trace metals on microplastic particles in beach sediments of the island of Vis, Adriatic Sea, Croatia. Mar. Pollut. Bull. 2018, 137, 231–236. [Google Scholar]
  23. Hale, R.C.; Seeley, M.E.; La Guardia, M.J.; Mai, L.; Zeng, E.Y. A global perspective on microplastics. J. Geophys. Res. Ocean. 2020, 125. [Google Scholar] [CrossRef]
  24. Yu, Q.; Hu, X.; Yang, B.; Zhang, G.; Wang, J.; Ling, W. Distribution, abundance and risks of microplastics in the environment. Chemosphere 2020, 249, 126059. [Google Scholar] [CrossRef] [PubMed]
  25. Warwick, R.M.; Price, R. Ecological and metabolic studies on free-living nematodes from an estuarine sand flat. Estuar. Coast. Mar. Sci. 1979, 9, 257–271. [Google Scholar] [CrossRef]
  26. Guo, Y.; Somerfield, P.J.; Warwick, R.M.; Zhang, Z. Large-scale patterns in the community structure and biodiversity of free living nematodes in the Bohai Sea, China. J. Mar. Biol. Assoc. U.K. 2001, 81, 755–763. [Google Scholar] [CrossRef] [Green Version]
  27. Balsamo, M.; Albertelli, G.; Ceccherelli, V.U.; Coccionia, R.; Colangeloc, M.A.; Curini-Gallettid, M.; Danovaroe, R.; D’Addabbof, R.; De Leonardisf, C.; Fabianob, M.; et al. Meiofauna of the Adriatic Sea: Present knowledge and future perspectives. Chem. Ecol. 2010, 26, 45–63. [Google Scholar] [CrossRef]
  28. Moreno, M.; Semprucci, F.; Vezzulli, L.; Balsamo, M.; Fabiano, M.; Albertelli, G. The use of nematodes in assessing ecological quality status in the Mediterranean coastal ecosystems. Ecol. Indic. 2011, 11, 328–336. [Google Scholar] [CrossRef]
  29. Semprucci, F.; Balsamo, M.; Appolloni, L.; Sandulli, R. Assessment of ecological quality status along the Apulian coasts (Eastern Mediterranean Sea) based on meiobenthic and nematode assemblages. Mar. Biodiver. 2018, 48, 105–115. [Google Scholar] [CrossRef]
  30. Hedfi, A.; Ben Ali, M.; Nourel-Deen, A.; Albogami, B.; Hassan, M.; Saif, T.; Boufahja, F. Distribution and Abundance of Benthic Meiofauna in the Eastern Red Sea Coasts (Jeddah, Saudi Arabia). ARRB 2018, 26, 1–12. [Google Scholar] [CrossRef]
  31. Mahmoudi, E.; Essid, N.; Beyrem, H.; Hedfi, A.; Boufahja, F.; Vtiello, P.; Aissa, P. Individual and combined effects of lead and zinc on a free-living marine nematode community: Results from microcosm experiments. J. Exp. Mar. Bio. Ecol. 2007, 343, 217–226. [Google Scholar] [CrossRef]
  32. Hedfi, A.; Mahmoudi, E.; Boufahja, F.; Beyrem, H.; Aïssa, P. Effects of increasing levels of nickel contamination on structure of offshore nematode communities in experimental microcosms. Bull. Environ. Contam. Toxicol. 2007, 79, 345–349. [Google Scholar] [CrossRef]
  33. Hedfi, A.; Boufahja, F.; Ben Ali, M.; Aïssa, P.; Mahmoudi, E.; Beyrem, H. Do trace metals (chromium, copper and nickel) influence toxicity of diesel fuel for free-living marine nematodes? Environ. Sci. Pollut. Res. 2013, 20, 3760–3770. [Google Scholar] [CrossRef]
  34. Hedfi, A. Les Nématodes Libres, Outils Communautaires de Biosurveillance du Milieu Marin: Étude In Situ et en Microcosme. Ph.D. Thesis, Carthage University, Bizerte, Tunisia, 2008. [Google Scholar]
  35. Schratzberger, M.; Whomersley, P.; Warr, K.; Bolam, S.G.; Rees, H.L. Colonisation of various types of sediment by estuarine nematodes via lateral infaunal migration: A laboratory study. Mar. Biol. 2004, 145, 69–78. [Google Scholar] [CrossRef]
  36. Wakkaf, T.; Allouche, M.; Harrath, A.H.; Mansour, L.; Alwasel, S.; Ansari, K.G.M.T.; Beyrem, H.; Sellami, B.; Boufahja, F. The individual and combined effects of cadmium, polyvinyl chloride (PVC) microplastics and their polyalkylamines modified forms on meiobenthic features in a microcosm. Environ. Pollut. 2020, 266, 115263. [Google Scholar] [CrossRef]
  37. Wieser, W. Benthic studies in buzzards bay. II. The meiofauna. Limnol. Oceanogr. 1960, 5, 121–137. [Google Scholar] [CrossRef]
  38. Elarbaoui, S.; Richard, M.; Boufahja, F.; Mahmoudi, E.; Thomas-Guyonc, H. Effect of crude oil exposure and dispersant application on meiofauna: An intertidal mesocosm experiment. Environ. Sci. Process. Impacts. 2015, 17, 997–1004. [Google Scholar] [CrossRef] [PubMed]
  39. Seinhorst, J.W. A rapid method for the transfer of nematodes from fixative to anhydrous glycerine. Nematologica. 1959, 4, 67–69. [Google Scholar] [CrossRef] [Green Version]
  40. Platt, H.M.; Warwick, R.M.; Furstenberg, J.P. Free-living marine nematodes. Part, I. British Enoploids. S. Afr. J. Zool. 1985, 20, 177. [Google Scholar] [CrossRef]
  41. Platt, H.M.; Warwick, R.M. Free-Living Marine Nematodes. Part II. British Chromadorids. Synopsis of the British Fauna (New Series No. 38); E.J. Brill/W.Backhuys: London, UK, 1988. [Google Scholar]
  42. Warwick, R.M.; Platt, H.M.; Somerfield, P.J. Free-Living Marine Nematodes. Part III. British Monohysterids. Synopsis of British Fauna (New Series No. 53); Field Studies Council: London, UK, 1998. [Google Scholar]
  43. Bezerra, T.N.; Decraemer, W.; Eisendle-Flockner, U.; Hodda, M.; Holovachov, O.; Leduc, D.; Miljutin, D.; Mokievsky, V.; Santiago, P.R.; Sharma, J.; et al. Nemys: World Database of Nematodes. 2020. Available online: http://nemys.ugent.be (accessed on 20 February 2021).
  44. Wieser, W. Die Beziehung zwischen Mundhöhlengestalt, Ernäh rungsweiseund Vorkommen bei freilebenden marinen Nematoden. Arkiv. För. Zoologi. 1953, 2, 439–484. [Google Scholar]
  45. Thistle, D.; Lambshead, P.J.D.; Sherman, K.M. Nematode tail-shape groups respond to environmental differences in the deep-sea. Vie Milieu. 1995, 45, 107–115. [Google Scholar]
  46. Bongers, T.; de Goede, R.G.M.; Korthals, G.W.; Yeates, G.W. An update to the cprating of nematode genera can be found in proposed changes of c-p classification for nematodes. Russ. J. Nematol. 1995, 3, 61–62. [Google Scholar]
  47. Schratzberger, M.; Warr, K.; Rogers, S.I. Functional diversity of nematode communities in the southwestern North Sea. Mar. Env. Res. 2007, 63, 368–389. [Google Scholar] [CrossRef] [Green Version]
  48. Clarke, K.R. Non-parametric multivariate analyses of changes in community structure. Aust. J. Ecol. 1993, 18, 117–143. [Google Scholar] [CrossRef]
  49. Clarke, K.R.; Warwick, R.M. Change in Marine Communities: An Approach to Statistical Analysis and Interpretation, 2nd ed.; PRIMER-E., Ltd., Plymouth Marine Laboratory: London, UK, 2001. [Google Scholar]
  50. Clarke, K.R.; Gorley, R.N. PRIMER v5: User Manual/Tutorial; PRIMER-E: London, UK, 2001. [Google Scholar]
  51. Allouche, M.; Nasri, A.; Harrath, A.H.; Mansour, L.; Alwasel, S.; Beyrem, H.; Plăvan, G.; Rohal-Lupher, M.; Boufahja, F. Meiobenthic nematode Oncholaimus campylocercoides as a model in laboratory studies: Selection, culture, and fluorescence microscopy After exposure to phenanthrene and chrysene. Environ. Sci. Pollut. Res. 2021, 28, 21303–21313. [Google Scholar] [CrossRef] [PubMed]
  52. Miao, X.-S.; Metcalfe, C.D. Determination of cholesterol-lowering statin drugs in aqueous samples using liquid chromatography–electrospray ionization tandem mass spectrometry. J. Chromatogr. A 2003, 998, 133–141. [Google Scholar] [CrossRef]
  53. Dahl, U.; Gorokhova, E.; Breitholtz, M. Application of growth-related sublethal endpoints in ecotoxicological assessments using a harpacticoid copepod. Aquat. Toxicol. 2006, 77, 433–438. [Google Scholar] [CrossRef] [PubMed]
  54. Kirstein, I.; Kirmizi, S.; Wichels, A.; Garin-Fernandez, A.; Erler, R.; Löder, M.; Gerdts, G. Dangerous hitchhikers? Evidence for potentially pathogenic Vibrio spp. on microplastic particles. Mar. Environ. Res. 2016, 120, 1–8. [Google Scholar] [CrossRef] [Green Version]
Figure 1. Abundances of meiobenthic taxa from uncontaminated (C0) and contaminated (P; S2; S1; A2; A1; SP2; SP1; AP2; AP1) microcosms. (*) above bars indicate significant difference (p < 0.05).
Sustainability 13 13190 g001
Figure 2. Graphical summary of univariate indices for nematode assemblages from each microcosm. H’ = Shannon-Wiener index, d = Margalef’s species richness, J’ = Pielou’s evenness, S = species number. An asterisk above bars indicates a significant difference (p < 0.05) with the control community (C0). (*) above bars indicates significant difference (p < 0.05).
Sustainability 13 13190 g002
Figure 3. Non-metric multidimensional scaling (nMDS) 2D plot based on nematode species abundances from uncontaminated (C0) and contaminated (P; S2; S1; A2; A1; SP2; SP1; AP2; AP1) microcosms.
Sustainability 13 13190 g003
Figure 4. Non-metric multidimensional scaling (nMDS) 2D plots (right) and graphical summary (left) based on abundances of functional groups of nematode assemblages from each microcosm. Selective deposit feeders (1A); non-selective deposit feeders (1B); epigrowth feeders (2A); omnivores-carnivores (2B); short/round (s/r); elongated/filiform (e/f); conical (co); clavate/conical-cylindrical (cla); spiral (SP); pocket-like (Pk); indistinct (Id); circular (Cr). An asterisk above bars indicates a significant difference (p < 0.05) with control community (C0).
Sustainability 13 13190 g004
Figure 5. Non-metric multidimensional scaling (nMDS) second-stage ordination of inter-matrix rank correlations. For matrices included. See Figure 3 (species) and 4 (functional traits). Values indicate average similarity percentages between nMDS related to species and those related to functional traits.
Sustainability 13 13190 g005
Table 1. Species list and biological traits of nematode species identified in uncontaminated (C0) and contaminated (P; S2; S1; A2; A1; SP2; SP1; AP2; AP1) microcosms. Colonizers-persisters scores (c-p); tail shape (Tl): conical (co). elongated/filiform (e/f). clavate (cla); amphid shape (Am): pocket-like (Pk). indistinct (Id). spiral (Sp). circular (Cr); feeding groups according to Wieser (1953) (FG): selective deposit-feeders (1A). non-selective deposit-feeders (1B). epistratum-feeders (2A). omnivores carnivores (2B); adult length (AL).
SpeciesFunctional TraitsTreatments
c-pTlAmFGAdult LengthC0PS2S1A2A1SP2SP1AP2AP1
Anticoma acuminata2e/fpk1A2–4 mm0.91 ± 0.780.46 ± 0.8 0.43 ± 0.750.47 ± 0.810.42 ± 0.721.63 ± 0.70.96 ± 0.830.44 ± 0.761.25 ± 1.27
Anticoma eberthi2e/fpk1A2–4 mm8.27 ± 1.1513.01 ± 1.3713.55 ± 1.8510.9 ± 1.855.35 ± 1.0914.75 ± 1.0614.28 ± 1.786.74 ± 0.888.32 ± 1.9314.29 ± 3.02
Calomicrolaimus honestus3cosp2A1–2 mm2.75 ± 1.341.38 ± 1.371.26 ± 1.243.94 ± 2.31.8 ± 0.792.06 ± 1.461.63 ± 0.73.37 ± 0.851.75 ± 0.761.2 ± 1.19
Chromadora sp.2coid2A1–2 mm1.83 ± 0.754.19 ± 0.090.86 ± 0.750.84 ± 1.480.45 ± 0.78 1.22 ± 1.220.97 ± 0.840.43 ± 0.75
Daptonema trabeculosum2clacr1B1–2 mm1.38 ± 1.352.79 ± 0.065.08 ± 1.261.75 ± 1.988.13 ± 1.724.92 ± 1.222.44 ± 1.213.85 ± 1.698.79 ± 2.126.1 ± 1.18
Marylynnia puncticaudata3e/fsp2A2–4 mm0.48 ± 0.820.91 ± 1.582.09 ± 1.392.65 ± 2.36.59 ± 4.485.72 ± 1.8111.84 ± 1.946.74 ± 5.511. 83 ± 1.168.89 ± 2.29
Metalinhomoeus numidicus2e/fcr1B2–4 mm2.34 ± 1.685.58 ± 1.352.96 ± 0.656.99 ± 2.7211.68 ± 0.945.72 ± 1.8111.02 ± 1.1614.42 ± 2.910.95 ± 1.4110.54 ± 1.6
Enoplolaimus littoralis3e/fid2B2–4 mm0.45 ± 0.78 0.41 ± 0.710.43 ± 0.74 0.83 ± 1.071.63 ± 0.71.91 ± 2.183.94 ± 1.261.62 ± 0.68
Metoncholaimus pristiurus3clapk2B>4 mm8.31 ± 1.436.51 ± 2.18.03 ± 1.7410.02 ± 1.810.76 ± 1.1313.52 ± 1.078.17 ± 3.086.25 ± 1.646.15 ± 2.0511.79 ± 3.02
Odontophora villoti2cocr1B2–4 mm0.45 ± 0.78 0.43 ± 0.75 0.48 ± 0.82
Oncholaimus campylocercoides4clapk2B>4 mm23.08 ± 2.2815.84 ± 3.0822.46 ± 4.0624.44 ± 1.522.43 ± 0.625.82 ± 1.2718.77 ± 0.6523.56 ± 2.2618 ± 1.7423.18 ± 1.3
Paracomesoma dubium2clasp2A1–2 mm0.45 ± 0.780.46 ± 0.820.41 ± 0.710.43 ± 0.740.92 ± 0.80.42 ± 0.720.81 ± 1.412.4 ± 0.831.75 ± 0.761.62 ± 0.68
Paramonohystera wieseri2clacr1B1–2 mm1.4 ± 1.422.32 ± 1.6 4.28 ± 2.716.99 ± 2.723.53 ± 3.393.28 ± 0.736.55 ± 4.993.36 ± 1.667.02 ± 0.851.2 ± 2.09
Paramonohystera pilosa2clacr1B1–2 mm0.46 ± 0.790.46 ± 0.80.43 ± 0.75 1.23 ± 1.220.41 ± 0.71 2.2 ± 0.78
Prochromadorella longicaudata2coid2A1–2 mm42.38 ± 0.939.53 ± 1.8522.06 ± 2.3320.54 ± 1.2119.82 ± 2.9616.8 ± 0.4813.47 ± 1.2214.9 ± 0.717.01 ± 1.4511.79 ± 3.02
Spirinia gerlachi3cocr2A1–2 mm0.46 ± 0.79 1.7 ± 0.750.88 ± 0.76 1.24 ± 1.250.41 ± 0.712.39 ± 1.640.43 ± 0.750.82 ± 0.71
Steineria sp.2clacr1B1–2 mm0.46 ± 0.79 0.41 ± 0.71 0.48 ± 0.841.31 ± 1.32
Synonchiella edax4e/fsp2B2–4 mm0.46 ± 0.790.93 ± 0.811.7 ± 0.75 0.82 ± 0.710.41 ± 0.711.93 ± 0.843.07 ± 1.521.65 ± 1.43
Theristus flevensis2cocr1B1–2 mm3.24 ± 0.95.13 ± 2.211.03 ± 1.574.83 ± 2.17.65 ± 2.232.04 ± 0.695.31 ± 1.435.29 ± 1.696.6 ± 2.374.06 ± 0.62
Viscosia cobbi3e/fpk2B1–2 mm0.46 ± 0.790.48 ± 0.821.28 ± 1.33.5 ± 0.790.43 ± 0.740.42 ± 0.7
Table 2. Dissimilarity percentages between treatments (bold values) and results of Similarity Percentage analysis (SIMPER) based on square-root transformed data. Species and functional groups accounting for ~70% of overall dissimilarity are ranked in order of importance of their contribution. More abundant (+); less abundant (−).
C0 vs. P C0 vs. S2 C0 vs. S1 C0 vs. A2 C0 vs. A1 C0 vs. SP2C0 vs. SP1C0 vs. AP2 C0 vs. AP1
Average dissimilarity (%)20.0429.0428.6733.1134.1738.6635.3547.5539.79
R-statistics0.4220.7040.5930.7410.8520.8520.85211
p-value0.0290.010.010.010.010.010.010.010.01
SpeciesOncholaimus campylocercoides 18.47% −Prochromadorella longicaudata 30.37% −Prochromadorella longicaudata 35.16% −Prochromadorella longicaudata 32.88% −Prochromadorella longicaudata 32.36% −Prochromadorella longicaudata 33.01% −Prochromadorella longicaudata 40.58% −Prochromadorella longicaudata 35.91% −Prochromadorella longicaudata 34.19% −
Anticoma eberthi 11.59% +Theristus flevensis 14.44% +Paramonohysteria weiseri 10.15% +Metalinhomoeus numidicus 14.4% +Anticoma eberthi 11.44% +Marylynnia puncticaudata 15.67% +Metalinhomoeus numidicus 16.62% +Marylynnia puncticaudata 12.28% +Metalinhomoeus numidicus 11.36% +
Metoncholaimus pristiurus 11.58% −Anticoma eberthi 10.65% +Metalinhomoeus numidicus 8.58% +Daptonema trabeculosum 10.34% +Metoncholaimus pristiurus 9.51% +Metalinhomoeus numidicus 12.3% +Marylynnia puncticaudata 8.65% +Metalinhomoeus numidicus 9.43% +Marylynnia puncticaudata 11.35% +
Prochromadorella longicaudata 8.8% −Daptonema trabeculosum 6.84% +Viscosia cobbi 5.48% +Marylynnia puncticaudata 9.49% +Oncholaimus campylocercoides 8.23% + Daptonema trabeculosum 3.34% +Daptonema trabeculosum 8.05% +Anticoma eberthi 9.28% +
Theristus flevensis 8.45% +Oncholaimus campylocercoides 6.34% +Anticoma eberthi 5.48% + Marylynnia puncticaudata 8.23% +
Metalinhomoeus numidicus 8.02% +
Feeding groups12.36%23.49%21.34%27.36%27.36%30.11%25.22%36.53%31.82%
2B −2A −2A−2A−2A−2A−2A−2A−2A−
1B + 2B+
Tail shape9.09%14.77%20.16%21.75%30.58%30.74%23.93%35.74%35.22%
e/f +co −co −co −co −e/f +co −co −co −
Amphid shape8.50%23.02%23.78%26.79%29.29%30.75%31.62%40.69%33.91%
cr +id −id −id −id −id −id −id −id −
pk − cr + pk +
Adult length10.02%9.02%12.09%13.74%23.64%26.69%23.76%25.52%30.91%
>4mm +2–4mm +2–4mm +1–2mm −1–2mm −2–4mm +1–2mm −2–4mm +2–4mm +
c-p score11.86%7.13%9.58%7.52%13.25%9.96%11.53%10.71%11.87%
cp2 +cp2 +cp3 +cp3 +cp3 +cp3 +cp2 −cp3 +cp3+
Publisher’s Note: MDPI stays neutral with regard to jurisdictional claims in published maps and institutional affiliations.

