Article

Cyclic Shear Performance of Reinforced Concrete Columns Strengthened by External Steel Rods

Department of Architectural Engineering & Urban System Engineering, Kongju National University, 1223-24, Cheonandaero, Seobuk, Cheonan 31080, Korea
*
Author to whom correspondence should be addressed.
Sustainability 2021, 13(23), 13224; https://doi.org/10.3390/su132313224
Submission received: 15 October 2021 / Revised: 22 November 2021 / Accepted: 24 November 2021 / Published: 29 November 2021

Abstract

:
This study presents a strengthening method for reinforced concrete (RC) columns. The proposed method, which consists of a pair of steel rods, two reverse-threaded couplers, and four corner blocks, is feasible and straightforward. A quasi-static cyclic loading test was performed on the columns externally strengthened by the steel rods. It was found that the corner blocks and the external steel rods with a low prestress level effectively confined the concrete on the compression side of plastic hinges, which eventually induced flexural failure with a ductility higher than three in the strengthened columns. In addition, an analytical approach to predict the shear strength and ultimate flexural strength of the externally strengthened columns was applied. The comparison of analytical and experimental results showed that the analytical approach provided highly accurate predictions on the maximum strength and the failure mode of the externally strengthened columns. It is expected that the application of the proposed method will improve the seismic performance of damaged or deteriorated RC structures, thereby increasing their lifespan expectancy and sustainability.

1. Introduction

A minor earthquake event may significantly damage reinforced concrete (RC) structures due to structural degradation, such as the extension of the concrete cracks caused by the land subsidence and imbalanced service load, the concrete carbonation, and the corrosion of reinforcing steel bars. In addition, the lack of shear reinforcement reduces the load-carrying capacity of the RC column members against an earthquake event, leading to a brittle failure of the columns. In the design of RC columns, the hoop reinforcement is used to prevent the buckling of longitudinal rebars, increase the shear capacity, and enhance the transverse confinement of the core concrete. A diagonal tensile failure has been observed in the RC columns constructed according to the old design provisions, which failed to provide the minimum transverse reinforcement ratio and appropriate anchorage details about hoops [1,2]. Degraded structures or those lacking shear reinforcement need reinforcement or retrofitting to secure the seismic capacity required by the current seismic design codes. According to the Caltrans seismic provisions [3], RC columns must have a displacement ductility of at least 3. It is well-known that the transverse confinement for concrete cover can increase the strength and ductility of the shear-dominated columns lacking shear reinforcement [4].
The transverse confinement techniques that are widely applied to the reinforcement and retrofitting of RC columns with insufficient seismic capacity include external steel jacketing [5,6,7,8,9,10,11], fiber-reinforced plastic (FRP) composite wrapping [12,13,14,15,16,17], external post-tensioning or prestressing [4,18,19,20,21,22], and bonded steel plating [23,24,25,26,27,28]. These reinforcement methods should improve the RC columns’ seismic capacity and provide precision, simplicity, and economic feasibility in construction, as well as convenience in maintenance. The FRP composite wrapping is extensively applied as it provides advantages such as light weight, high strength, high corrosion resistance, and non-expansion of the cross-sectional area. The wet construction methods, such as external steel jacketing, FRP composite material reinforcement, and bonded steel plating have disadvantages due to long retrofitting and wet operations [4]. The dry construction methods, such as external post-tensioning, have excellent precision and economic feasibility in the construction but have disadvantages such as the corrosion of the externally exposed steel materials and the need for the periodic addition of lost prestress. Recently, hybrid reinforcement methods have been presented by combining the advantages of different reinforcement materials and reinforcement methods [29,30,31,32,33,34,35,36].
Miyagi et al. [4] proposed an emergency RC column retrofitting technique consisting of prestressed concrete (PC) steel bars and steel plates. They applied the proposed retrofitting technique to RC columns with different levels of damage and performed a cyclic loading test with the columns. The experimental results showed that the concrete confinement effect of the steel plates recovered the axial and lateral load-carrying capacities of the damaged columns and that the introduction of the tension to the PC bars improved the shear resistance of the columns by suppressing the expansion of the concrete cracks. Zhang et al. [7] suggested a retrofitting technique by combining prestress stainless steel hoops and stainless-steel jackets. Their findings showed that the suggested technique based on the material with excellent corrosion resistance successfully recovered the elastic stiffness, displacement, and horizontal strength of damaged circular bridge columns, indicating that the retrofitted RC columns reached a large drift ratio at a low damage degree level. Kothandaraman and Vasudevan [18] proposed a retrofitting technique for anchoring external longitudinal rebars at the soffit level of RC beam sections to improve the flexural performance of the beams. They showed that the anchorage of the external longitudinal rebars on the bottom cross-sectional surface of the beams increased the flexural carrying capacity of the beams by 70% compared with the non-reinforced beams, and significantly decreased the deflection and the crack width. Demir et al. [19] proposed a reinforcement method by combining external clamps and external longitudinal rebars to enhance the flexure and shear resistance of the RC beams. When the beams were reinforced only with external clamps, the failure behavior of the beams lacking the shear resistance was changed from brittle failure to ductile failure, but the load-carrying capacity was not improved. When the external clamps and external longitudinal rebars were used together, the load-carrying capacity of the beams, rather than the ductility, was improved significantly. Saatcioglu and Yalcin [20] performed an experimental study on the shear behavior of the actual RC columns reinforced with externally prestressed hoops. They found that the externally prestressed hoops suppressed the shear failure of the RC column and enhanced the flexural behavior. However, the infiltration of the steel strands to the concrete near the hoop edge further decreased the strength and prestress of the members. Deng et al. [21] performed a cyclic loading test with short columns reinforced with a prestressing anchoring system. The experimental results showed that when the transverse reinforcement ratio and the axial load ratio were the same, an increase in the prestressing level improved the energy dissipation capacity. However, when the spacing of the strand stirrup was increased, the confinement force on the concrete core was not significantly increased, even if the prestressing level was increased. Li et al. [22] conducted an experimental and analytical study on the shear behavior of the RC beams reinforced with External Vertical Prestressing Rebars (EVPR). The parametric study based on the experimental results showed that the vertical compressive stress increase effectively controls the cracking in the initial loading stage, but the increase in the EVPR stirrup ratio effectively improves the shear resistance by decreasing the width of the diagonal cracks. In addition, the decrease in the rebar spacing was more effective in increasing the shear performance than increasing the cross-sectional area when the stirrup ratio was the same.
This article proposes a strengthening method that allows for the introduction of prestress to external steel rods, which is feasible and straightforward with regard to construction. The proposed strengthening method consists of a pair of external steel rods bent in the shape of a channel or semi-circle; a pair of couplers for introducing prestress to the external steel rods; and four corner blocks for fixing the positions of the external steel rod and preventing the concentration of the stress at the concrete corners. The primary purposes of the proposed strengthening method are (1) to increase the initial stiffness of the RC columns to be reinforced by introducing prestress to the external steel rod according to the need; (2) to prevent the brittle failure of the shear-dominated columns by suppressing the expansion of the diagonal tension cracks in concrete; and (3) to improve the potential flexure resistance capacity and ductile capacity of the columns by increasing the transverse confinement effect. A quasi-static cyclic loading test was performed with the shear-dominated columns to which the proposed strengthening method was applied to evaluate the reinforcement effects experimentally.
In this study, the strain distributions in the longitudinal rebars and hoops were compared between strengthened specimens to examine the decrease in the length of the plastic hinges formed at the column ends, the stress of concrete on the compression side of the columns, and the shear force contributed by the hoops through the application of the external steel rods. Based on the experimental results, the effects of the proposed strengthening method for reinforcing the shear-dominated RC columns were verified in terms of resistance strength, stiffness, ductility, energy dissipation capacity, and damage. Finally, the analytical results of the shear and flexure of the RC columns, obtained in consideration of the contribution of the external steel rods to the shear and the transverse confinement effects of concrete, were compared with the experimental results.
The physical lifespan of RC structures is known to be about 100 years. The degree of concrete carbonation and corrosion of reinforcing steel bars is highly dependent on the climate characteristics of the areas where the RC structures were built. In addition, fatigue accumulation due to continuous vertical loads may accelerate the degradation of the durability of the structures undergoing concrete carbonation. According to the World Green Building Council’s annual report [37], building and construction are responsible for 39% of global energy-related carbon emissions. Out of the 39%, 11% of carbon emissions come from material manufacturing and construction. Repair or strengthening techniques for existing buildings are attracting more attention as alternative modes that can reduce the cost, greenhouse gas, and waste emissions caused by the demolition and reconstruction of existing buildings.
For this reason, studies on new strengthening methods and materials are being actively conducted in structural engineering. The improvement in structural performance due to the application of the proposed strengthening method is also expected to increase the lifespan expectancy and sustainability of existing RC buildings. Furthermore, reducing carbon dioxide emissions from constructing new buildings will help achieve carbon neutrality goals in many countries worldwide.

2. Strengthening Method Using External Prestressing Steel Rods and Corner Blocks

The proposed strengthening method consists of (1) a pair of external steel rods threaded at both ends; (2) four corner blocks for fixing the positions of the steel rods and preventing the concentration of the stress at the column corners by the prestress; and (3) a pair of reverse-threaded couplers for connecting the individual external steel rods and introducing prestress to them. The threaded external steel rods are bent in the shape of a channel or semi-circle according to the cross-sectional shape of the columns. The corner blocks are manufactured in the same shape as the corner of the column cross-section. The proposed strengthening method is implemented in the following order: (1) fixing the corner blocks to install the external prestressing steel bars at the planned positions; (2) temporarily assembling two steel-rod segments by using the reverse-threaded couplers; and (3) introducing the torque of a specific value by rotating the couplers with a torque wrench to apply a tensile force on the outer hoops. Figure 1 shows the construction process of the proposed strengthening method.
The proposed strengthening method has the effect of delaying the yield of the hoops by suppressing the expansion of the diagonal tension cracks over the abdominal area of the columns. In addition, the transverse confinement of the concrete and the longitudinal rebars in the plastic hinge regions by the corner blocks helps to improve the shear performance and ductility of the strengthened columns. The installation of corner blocks with the same length as the column height (L-type corner blocks), as shown in Figure 1b, improves the shear performance and ductility just slightly, compared with the specimens installing short corner blocks with a width of 30 mm (S-type corner blocks, see Figure 2a), but it can significantly decrease the construction time.

3. Experimental Program

3.1. Materials

The design strength of the concrete used for the preparation of the shear-dominated column specimens was set to be 30 MPa. Table 1 shows the concrete mix design. Cylindrical concrete test specimens of Φ100 × 200 mm were prepared to evaluate the mechanical properties of the concrete, and they were cured under the same conditions as the specimens. The average compressive strength ( f c k ) and elastic modulus ( E c ) of the test specimens were 27.5 MPa and 23,630 MPa, respectively.
D22 and D10 deformed bars were used as the longitudinal rebars and the hoops, respectively, while steel bars of Φ13 were used as the external reinforcing bars. The tensile test of the external steel rods was carried out by using samples prepared by connecting two steel bars with reverse-threaded couplers. The tensile test showed that the average yield strengths ( f y ) of the D22 and D10 deformed bars and the Φ13 steel bars were 650.7 MPa, 455.0 MPa, and 544.1 MPa, respectively, whereas the corresponding average elastic modulus ( E s ) was 191,557 MPa, 178,835 MPa, and 192,599 MPa, respectively.

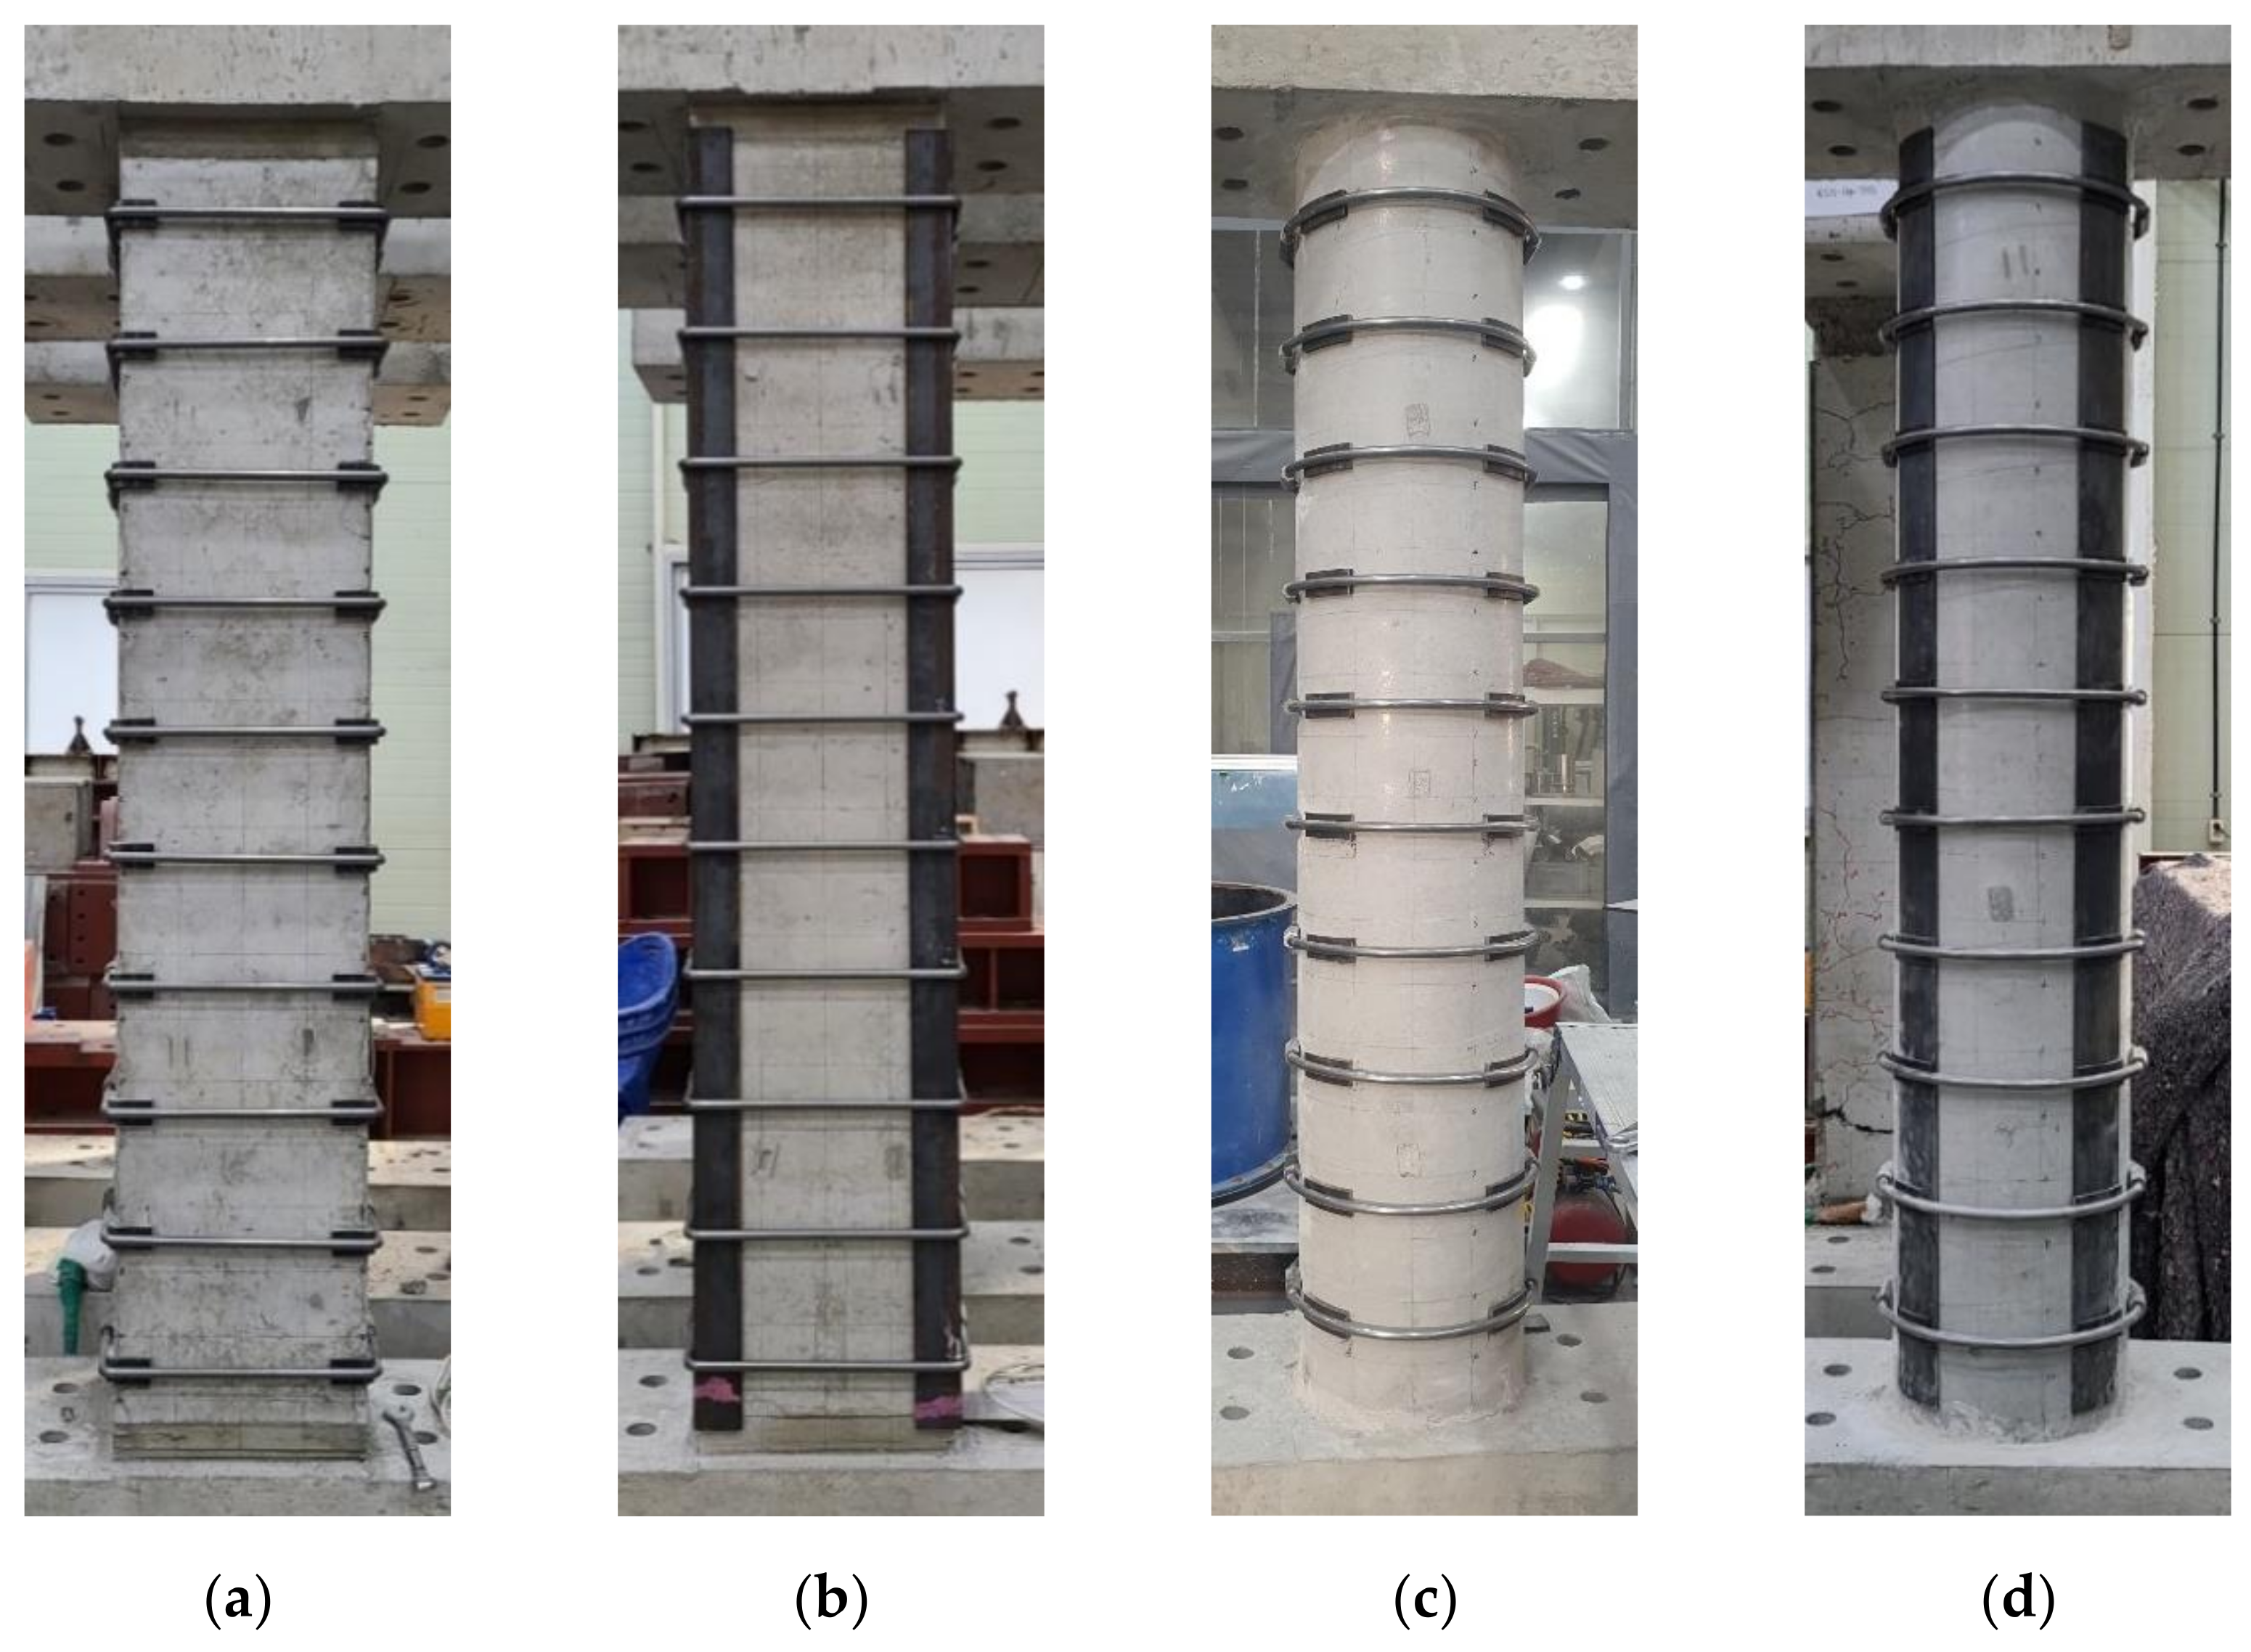
3.2. Description of Specimens

As shown in the specimen list in Table 2, three square columns of 400(b) × 400(h) mm and three circular columns of 400(D) mm were prepared. The variables considered in the design of the specimens were the cross-sectional shape of the columns, the external steel rods, and the length of the corner blocks. The specimen label N represents the non-strengthened specimens (control specimens). The labels P and F represent the specimens in which the S-type corner blocks and the L-type corner blocks were installed at the corners of the cross-section, respectively. The corner blocks were made of ready-made steel of L 65 × 65 × 8 and a curved steel plate of P 65 × 8 .
Figure 2 shows the specifications of the control specimens S-N and C-N and the positions of the strain gauges attached to the longitudinal rebars and hoops. The column height was 2100 mm. All the specimens had a shear span-to-depth ratio of 3.1, regardless of the cross-sectional shape. All the specimens had twelve longitudinal rebars (D22) to prevent flexural failure. Hoops (D10) were arranged at a spacing of 200 mm.
Figure 3 shows the specimens S-P, S-F, C-P, and C-F prepared using the proposed strengthening method. The external steel rods were placed at a spacing of 200 mm to be disposed of between the hoops inside. For the circular columns, corner blocks were installed at a 90° interval at the center of the cross-section. The time required to reinforce the specimens S-F and C-F with the L-type corner blocks was about 25 min, which was considerably shorter than the time required to reinforce the specimens S-P and C-P with the S-type corner blocks (about 48 min). Constant prestressing was introduced to the temporarily assembled outer hoops using a torque wrench immediately before the loading. The prestressing level was measured from the strain gauges attached to the same positions as the hoops.
Figure 2. Details of the control specimens and strain gauges (unit: mm): (a) S-N; (b) C-N.
Sustainability 13 13224 g002

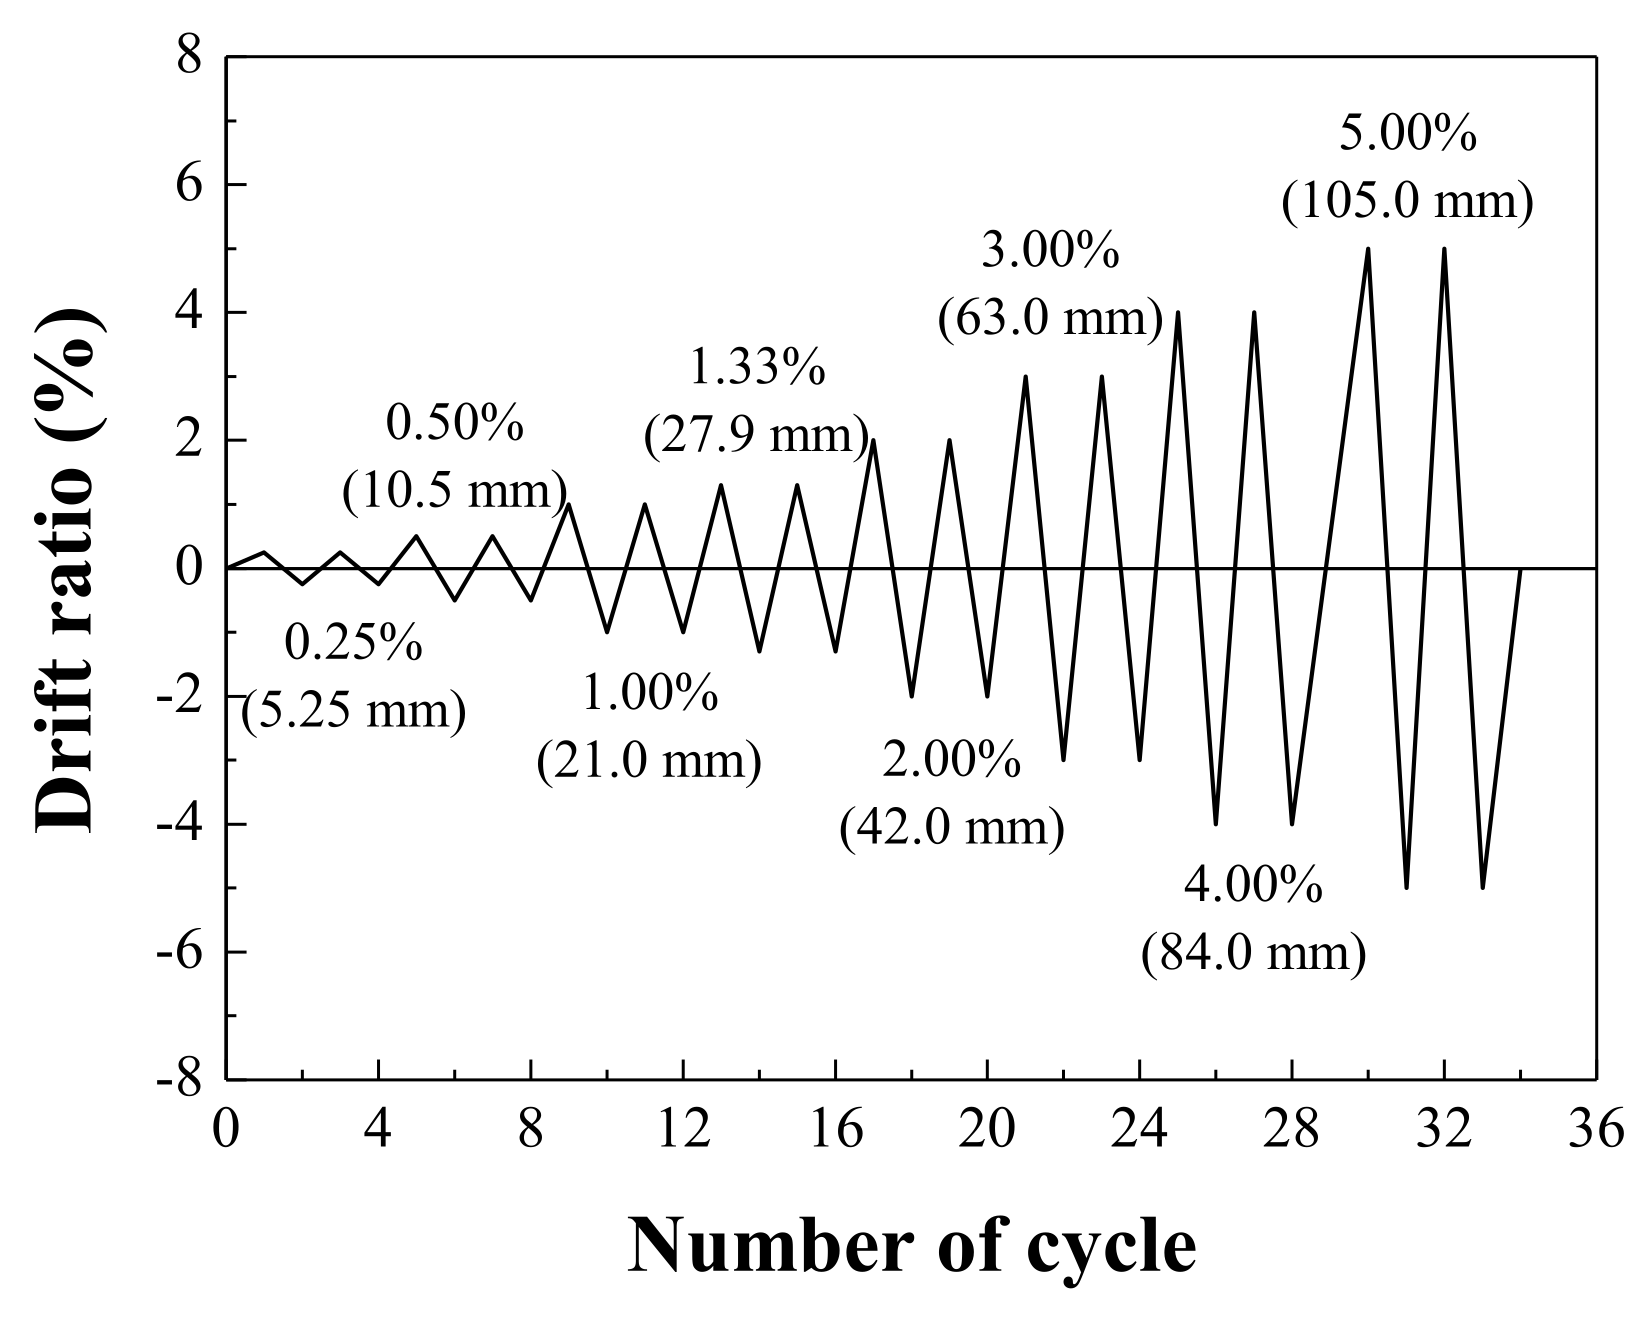
3.3. Loading and Measurement Plans

As shown in Figure 4, the loading equipment and instrumentation were set to apply an antisymmetric bending moment and a constant shear force and introduce an axial load corresponding to 10% of the axial compressive strength of the specimens. The parallelogram apparatus in the loading equipment reduced the P Δ moment induced in the specimens. The quasi-static cyclic loading test was performed by the displacement control method. Figure 5 shows the loading protocol applied to the experiment. All the specimens were subjected to a load in two cycles in each of the drift ratio stages. The loading was terminated when the applied load was decreased below 85% of the maximum load or when the load resistance was significantly decreased.
The present study focused on evaluating the proposed strengthening method’s effects on the failure mode, strength, and ductility of the shear-dominated columns at a low prestress level. As shown in Figure 2, strain gauges were attached to the hoops and the longitudinal rebars to measure the change of the failure mode of the strengthened specimens and the length of the plastic hinges formed at the ends. A prestress of about 4 kN was introduced to the external steel rods immediately before the loading by rotating the reverse-threaded couplers with a torque wrench. According to a previous report [22], prestressing effectively suppresses initial cracking. However, introducing a prestress to external reinforcements over a certain level can cause a decrease in the ductility after the maximum load while increasing the initial stiffness of the columns [36]. Demir et al. [19] showed that the strength and ductility of shear-dominated RC beams increased significantly when reinforced only with external clamps without prestressing.

4. Experimental Results and Discussion

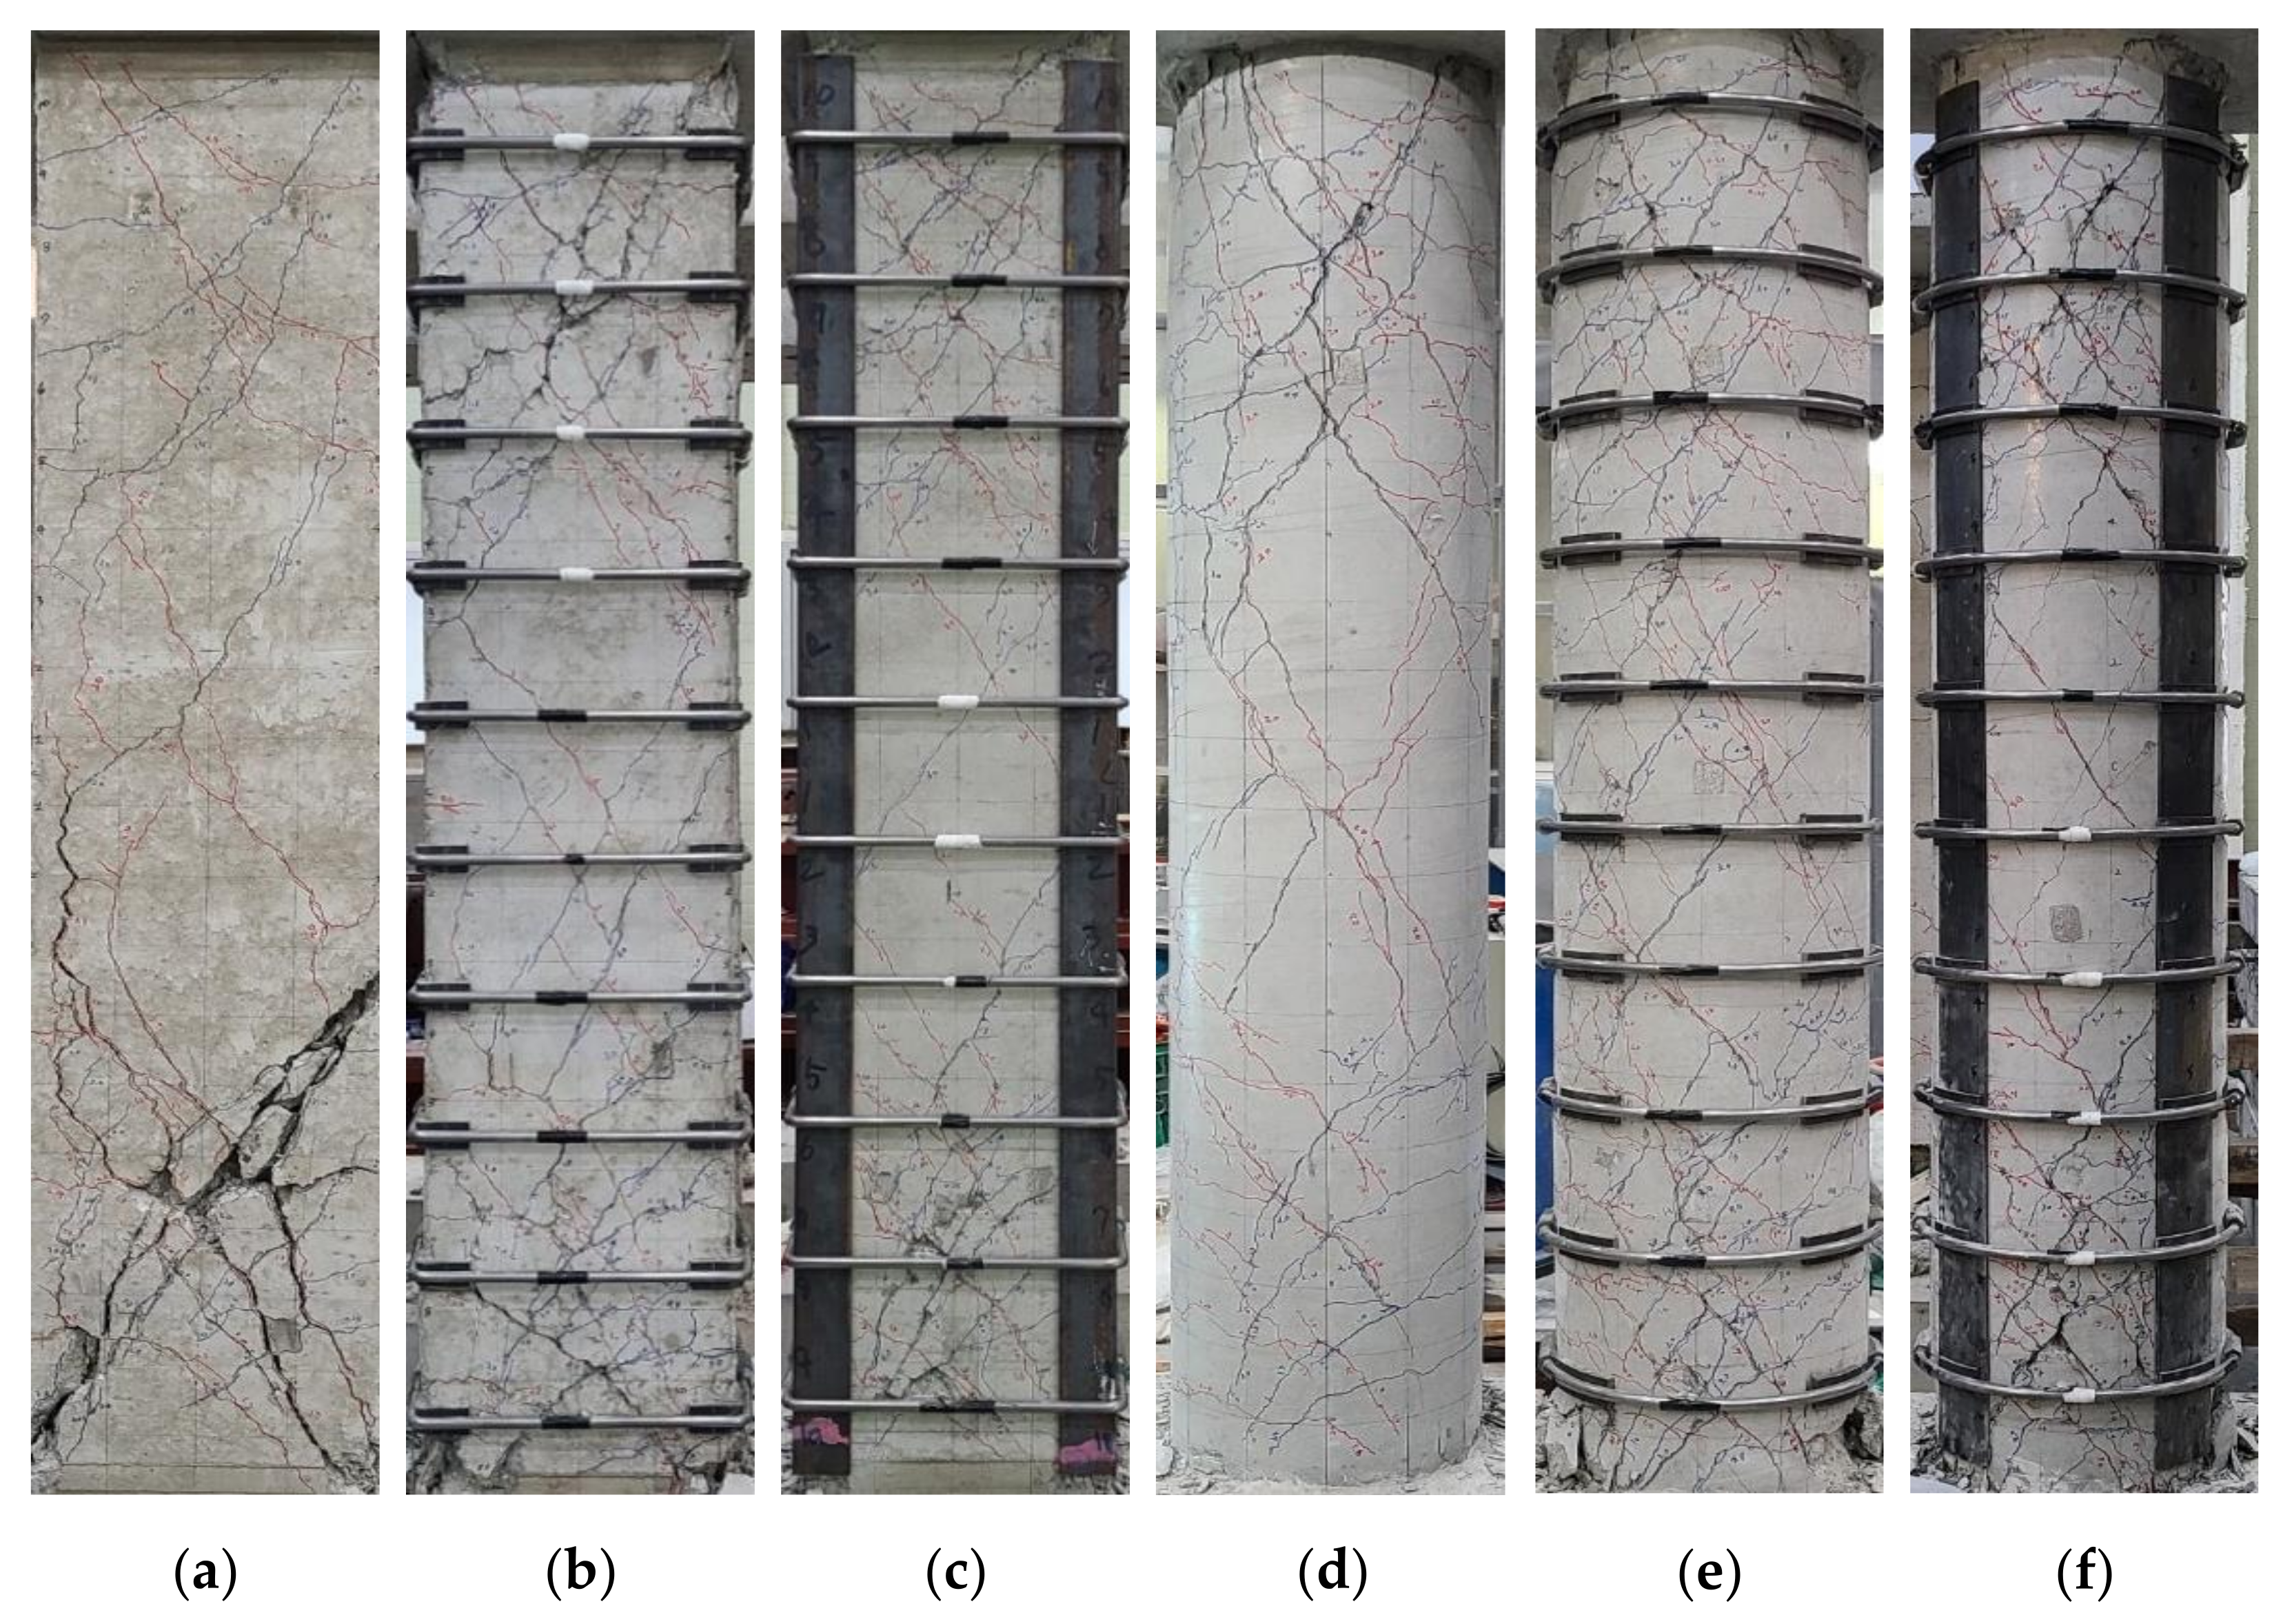
4.1. Load-Drift Ratio Hysteretic Curve and Failure Mode

Table 3 summarizes the drift ratios corresponding to the flexural cracking load, P c r , the lateral load of the hoops and the longitudinal rebars at the yield, P y h and P y l , the maximum load, P m a x , and the ultimate load, P u ( = 0.85 P m a x ). Figure 6 and Figure 7 show the load–drift ratio hysteretic curves and the cracking patterns of the specimens at the final failure. In all the specimens, the initial flexural crack was observed at both ends at a drift ratio of about 0.25%. Flexure-shear cracks toward the center of the span of the specimens were generated at a drift ratio of about 0.5%. Since a low level of prestressing was introduced, the flexural cracks and the magnitude of the flexural crack load ( P c r ) were similar among the specimen series.
The control specimens S-N and C-N hoops yielded a drift ratio of 0.97% and 1.19%, respectively. After reaching the maximum load, the width of the diagonal tensile cracks abruptly increased and showed a brittle failure without ductile behavior. The average maximum load of S-N and C-N in the positive and negative loading directions was 342.4 kN and 286.3 kN, respectively. The maximum load was different between the two specimens because the cross-sectional area of the concrete to resist the shear force was about 20% smaller, but the longitudinal reinforcement ratio was about 27% higher in C-N.
The concrete crushing caused the failure of the strengthened specimens at both ends and the increase in the diagonal tensile cracks’ width. The average maximum load of the strengthened specimens was 1.17 to 1.29 times higher than that of the control specimens. In contrast to S-N and C-N that both showed brittle failure after the yielding of the hoops, both the hoops and the longitudinal rebars of the strengthened specimens yielded before the maximum load, and the deformation capacity observed after the maximum load was also improved significantly. While the specimens S-P and S-F’s longitudinal rebars yielded after the hoops yielded, the hoops in the specimens C-P and C-F occurred immediately after the longitudinal rebars yielded. In addition, despite the increase in the drift ratio of these specimens, the applied load did not decrease below 85% of the maximum load. From the observed yielding points of the hoops and the longitudinal rebars, the amount of the external steel rods used, therefore, can be presumed to be the minimum value needed to change the failure mode of the shear-dominated specimens.
The results showed that the difference in the corner block length between the strengthened specimens had a negligible effect on increasing the maximum load and the displacement. However, more shear cracks were found in S-P and C-P installing the S-type corner blocks at the corners of the cross-section. This was because the L-type corner blocks had a negligible effect on improving the flexural moment resistance performance of the specimens but controlled the cracks developed on shear failure surfaces. In addition, S-F showed a significant drop of the pinching effect in the load–displacement curve compared with S-P, C-F, and C-P.

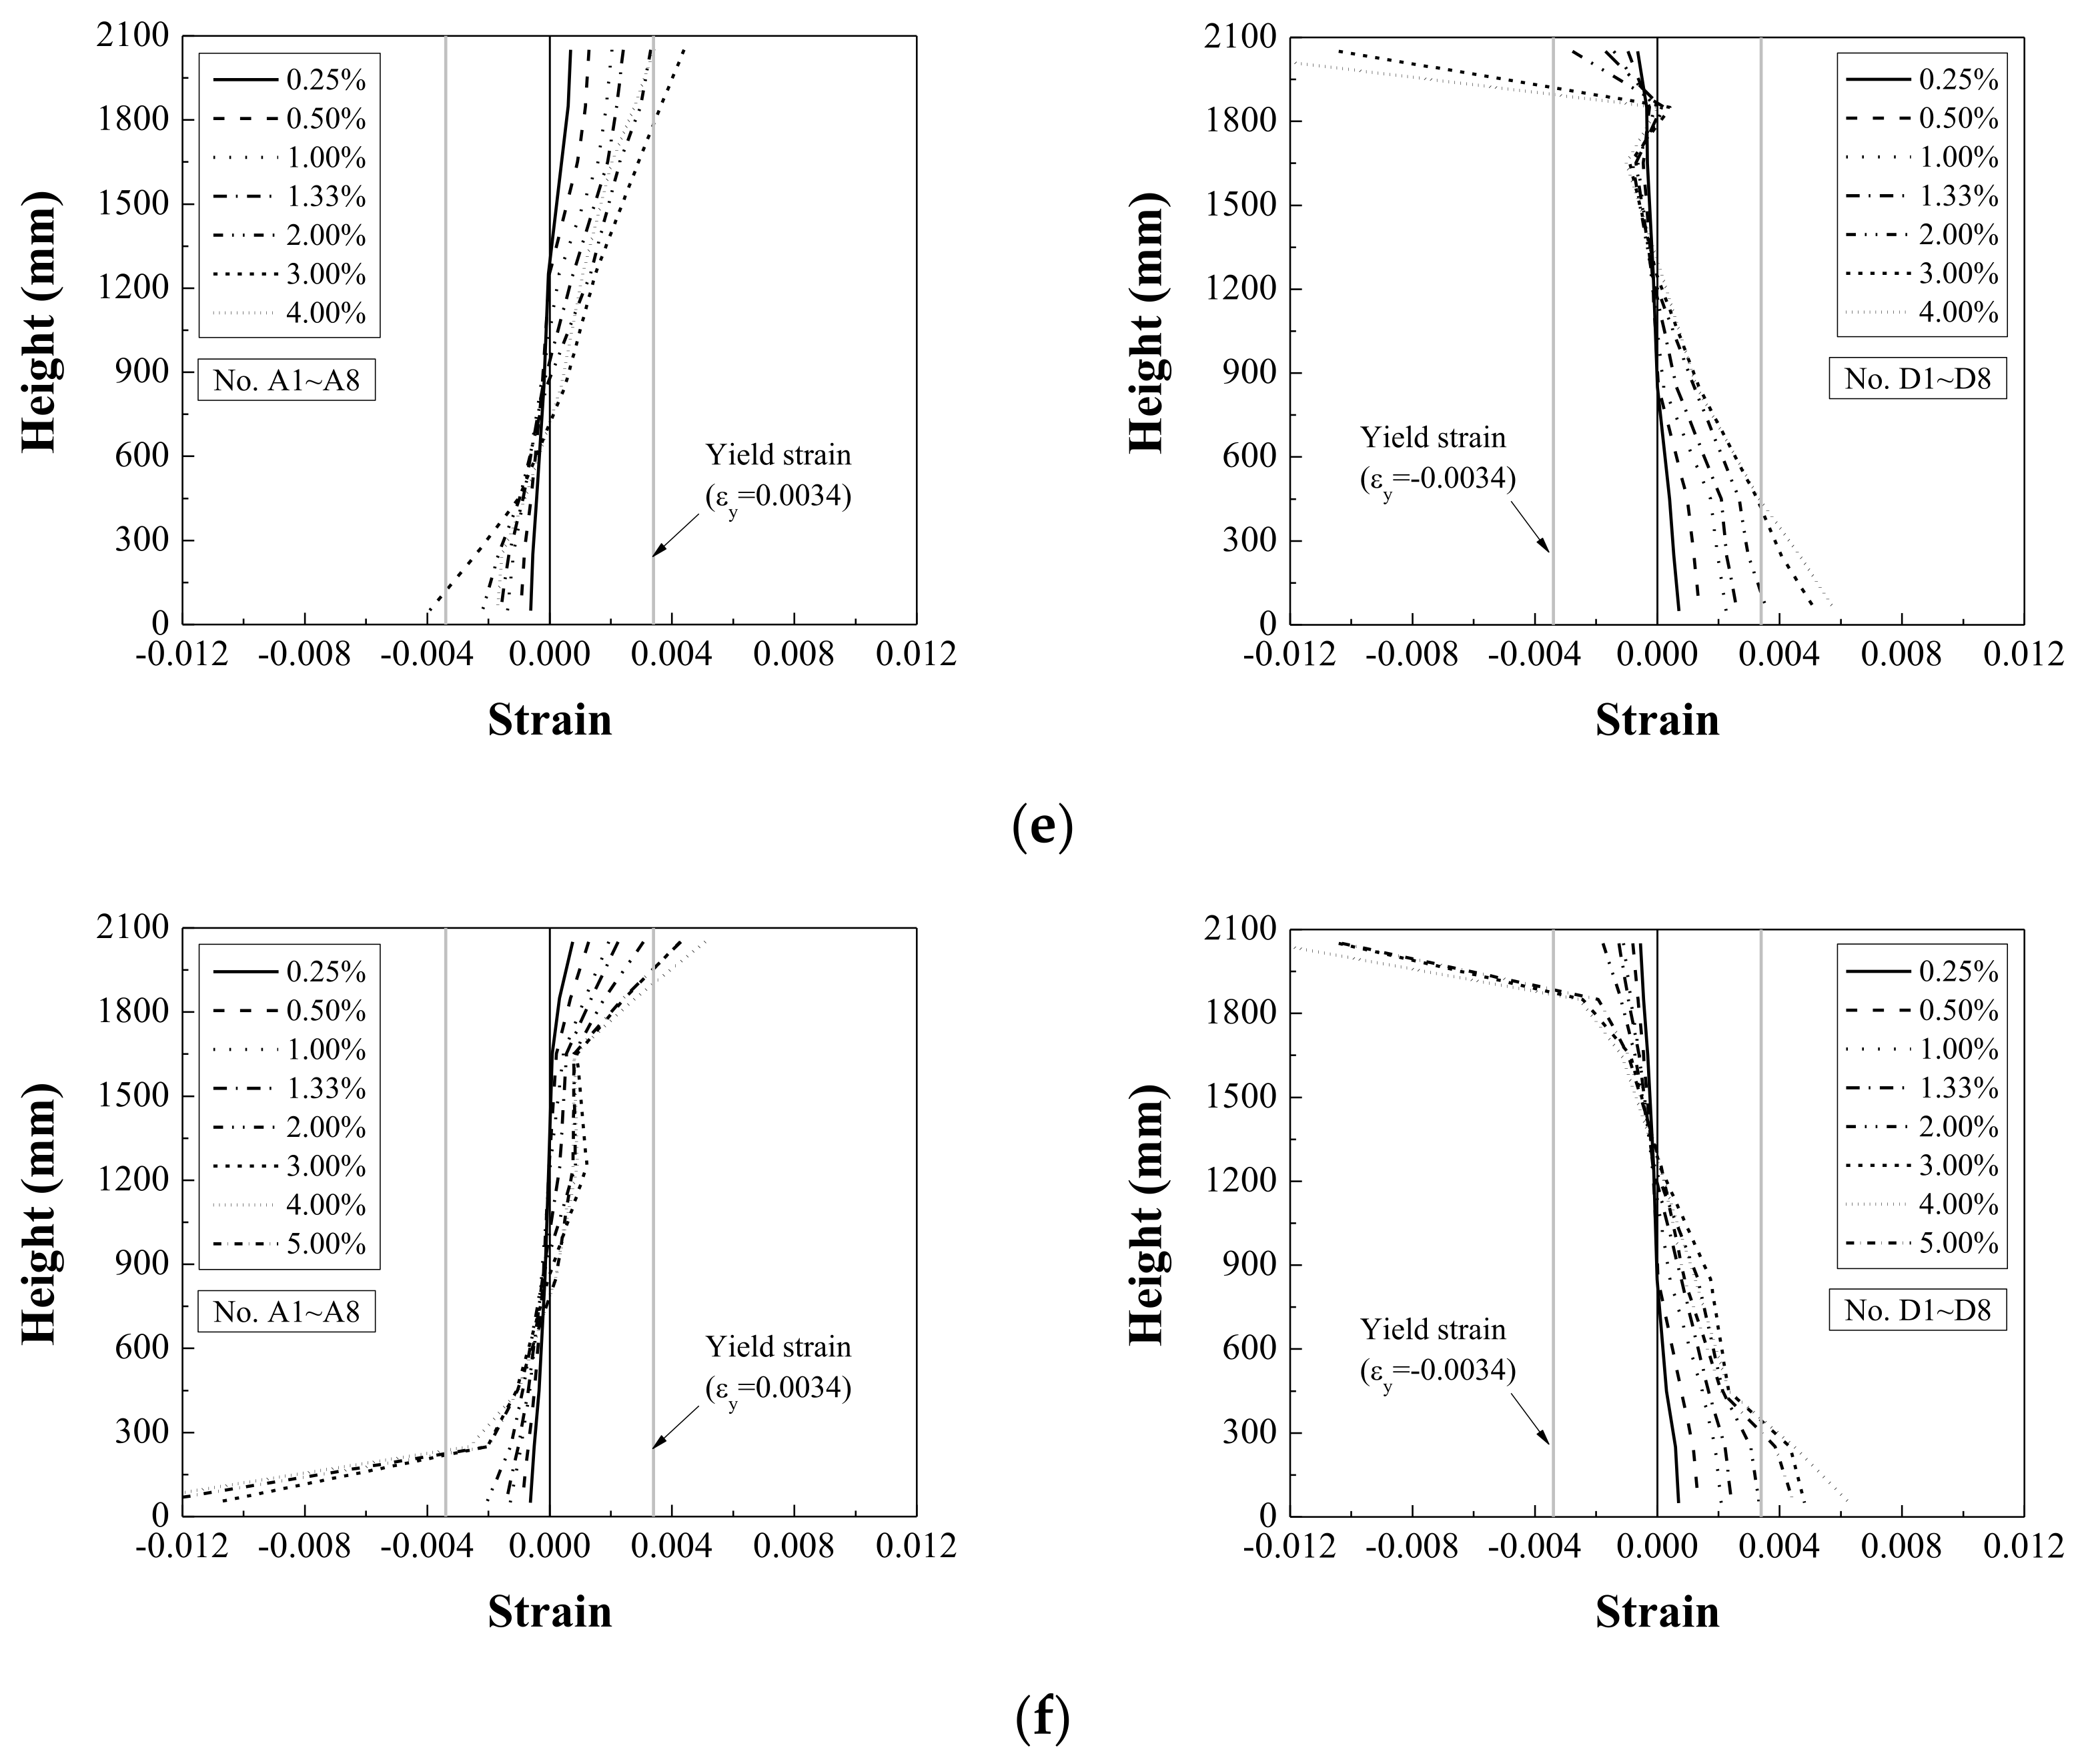
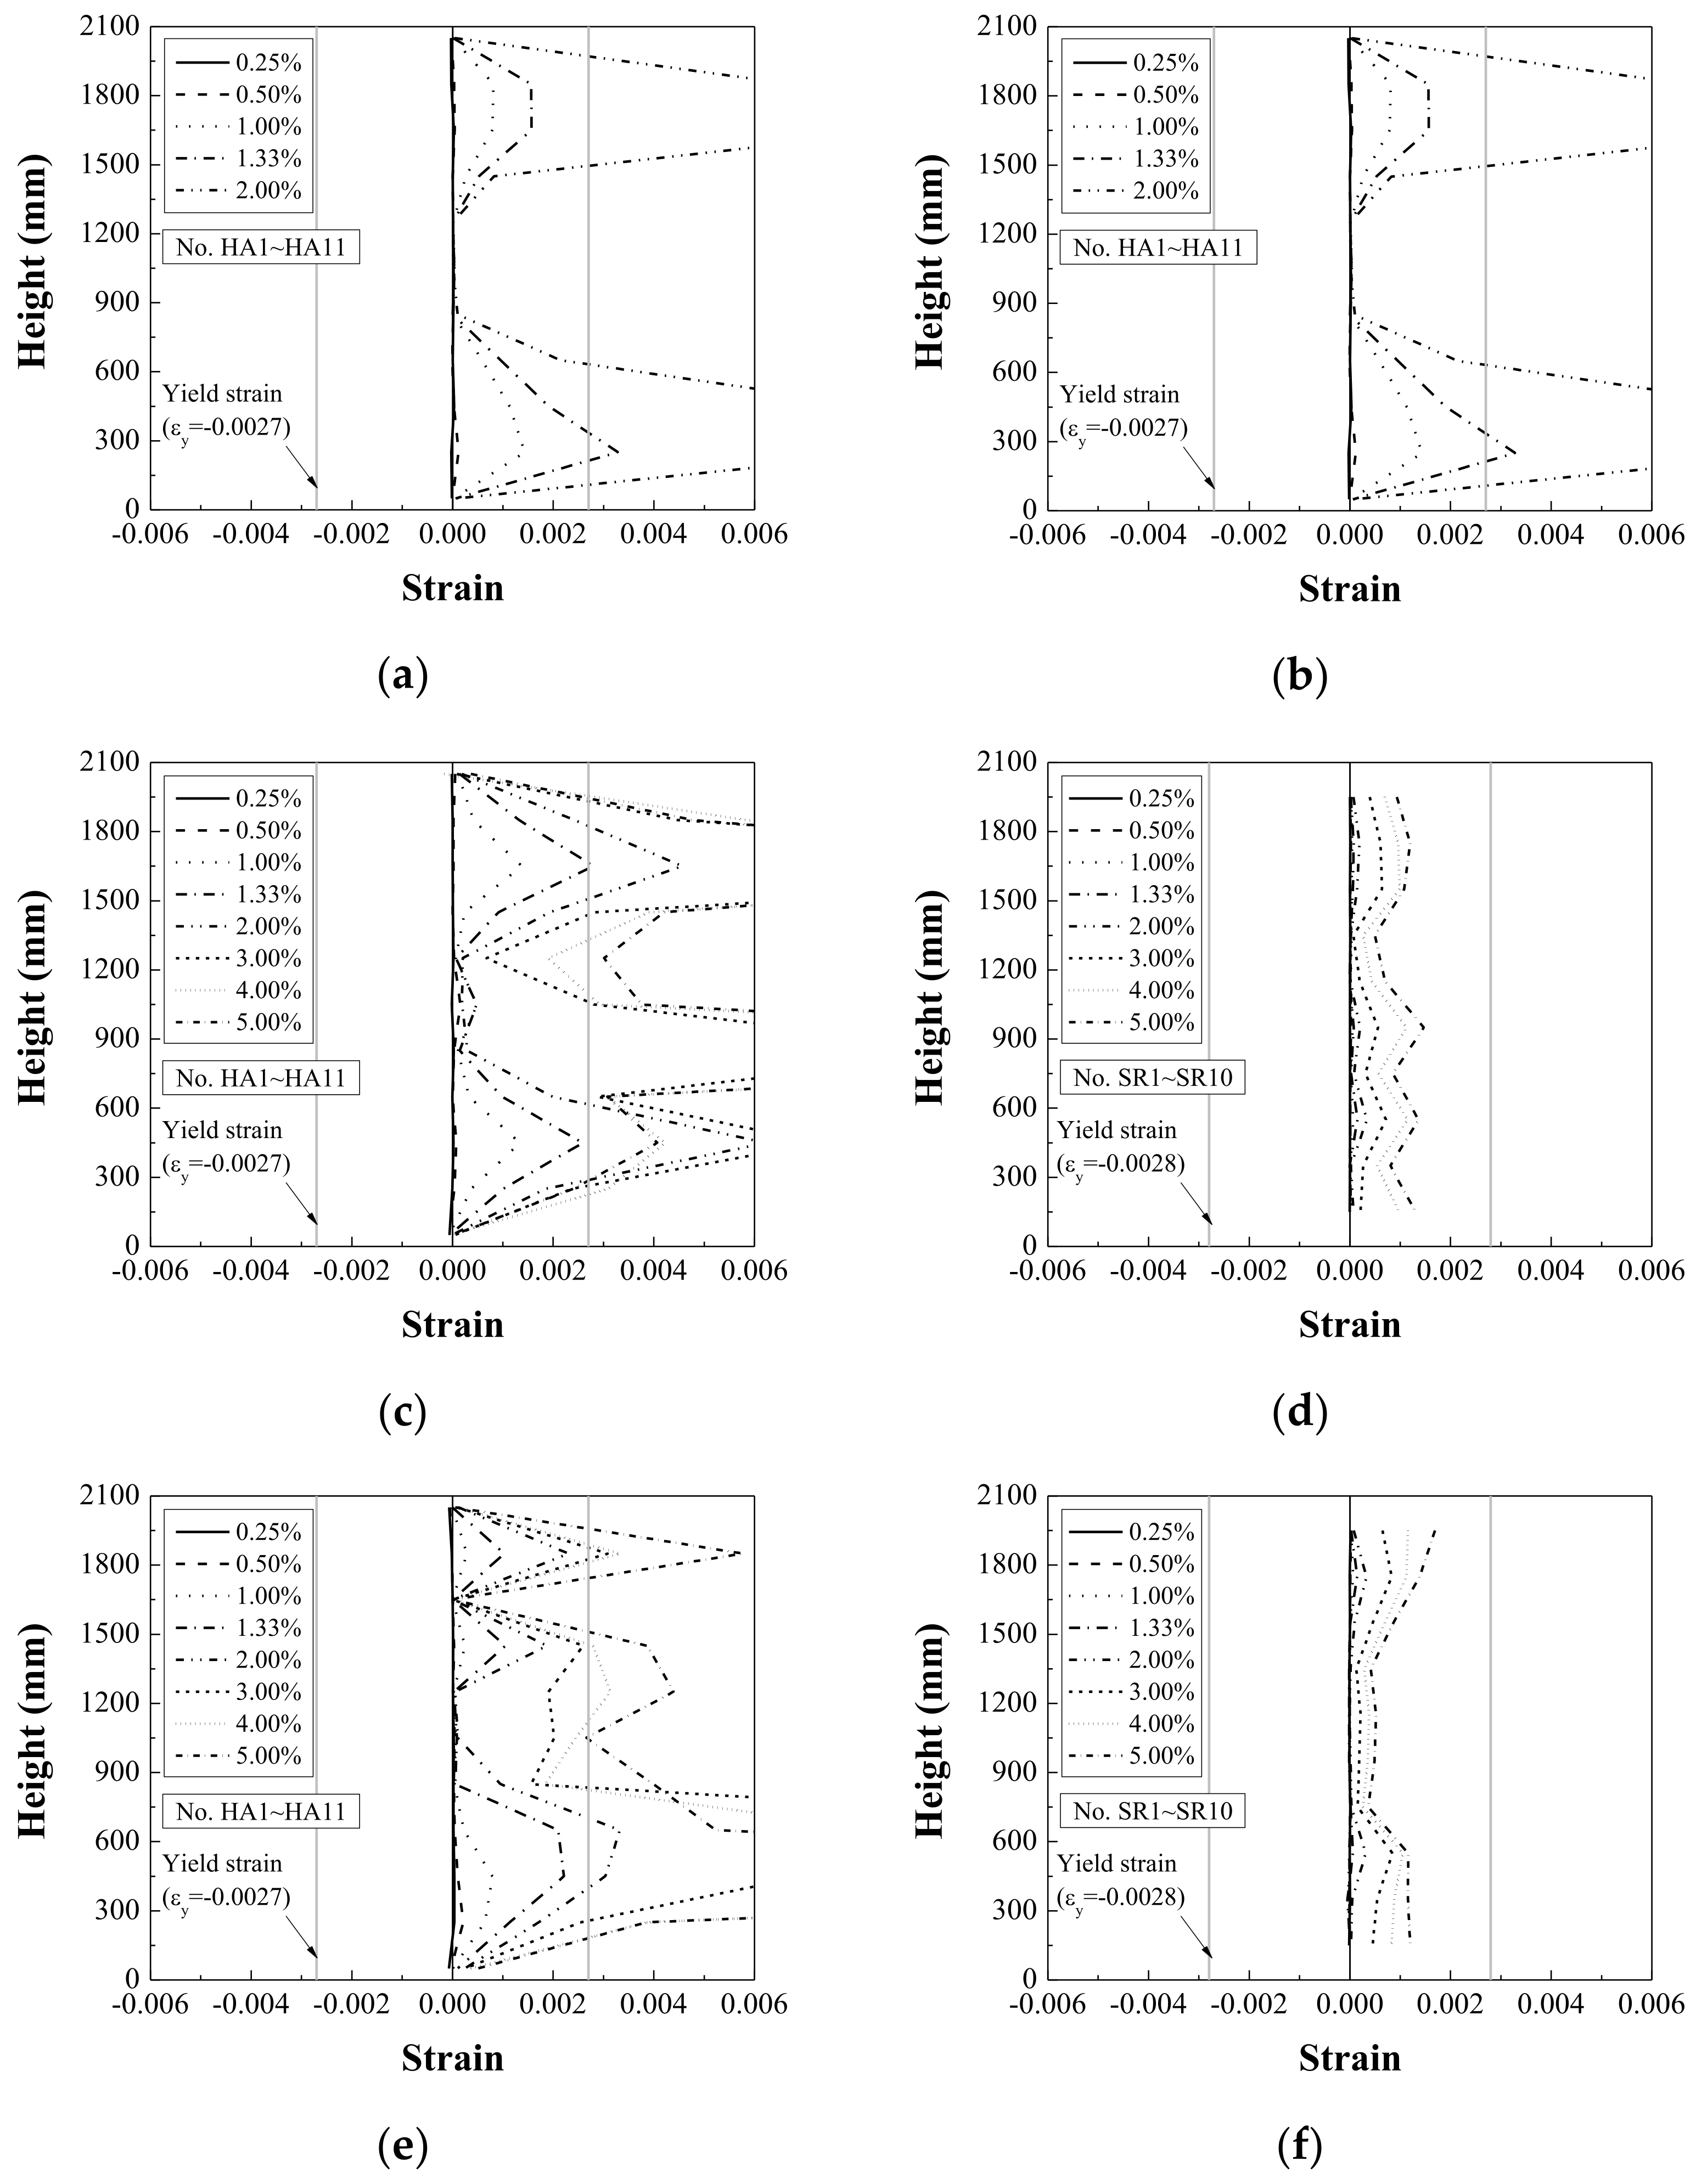
4.2. Characteristics of Strain Distribution

4.2.1. Strain Distribution in Longitudinal Rebars

This section describes the strain of the hoops, external steel rods, and longitudinal rebars measured from the strain gauges to examine the effects of the proposed strengthening method on the crack control and the transverse confinement of concrete. Figure 8 shows the strain distribution in the longitudinal rebars at specified drift ratios. The analysis was performed with the strain of the longitudinal rebars marked on the cross-section of the columns (A1 to A8 and D1 to D8). In the control specimens S-N and C-N, the maximum strain of the longitudinal rebars reached 78% (A8 in S-N) and 95% (D8 in C-N) of the yield strain ( ε y l = 0.0034 ) at a drift ratio of 2.0% (see Figure 8a,b). The control specimens showed the typical linear strain distribution found from the longitudinal rebars of shear-dominated column specimens.
Figure 8c,d show that the strain of the longitudinal rebars in the specimens S-P and S-F reached a yield strain at a drift ratio of 1.74% and 1.93%, respectively. Within the sections about 450 mm away from both ends, the longitudinal rebars’ strain abruptly increased with the drift ratio. The strain distribution in the longitudinal rebars shows the length of the plastic hinges formed in the strengthened specimens. The observed plastic hinge length is about 1.13 times the section height ( h ). Due to the increase in the shear resistance by the external steel rods, the strain of the longitudinal rebars on the tension side of the specimens considerably increased in the section between the top and bottom plastic hinges, compared with their control specimen. At a drift ratio of 4.0%, the strain of longitudinal rebars on the tension side (D8 in S-P and S-F) exceeded a value 2.5 times as high as the yield strain. The strain gradient of longitudinal rebars at the plastic hinges was steeper in S-F than in S-P because the L-type corner blocks suppressed the expansion of the concrete surrounding the longitudinal rebars located at the corners within the plastic hinge regions of S-F, thereby maintaining the bond strength between the longitudinal rebars and the concrete. The same trend was also found in the strain distribution measured from strain gauges D1 to D8.
Figure 8e,f show that the strain distribution in the longitudinal rebars of the specimens C-P and C-F is similar to that of S-P and S-F. The plastic hinges of the two specimens were located at positions about 1.13   h away from both ends. The maximum strain of longitudinal rebars on the tension side was less than a value 1.5 times as high as the yield strain at a drift ratio of 4.0%; however, the strain of longitudinal rebars on the compression side was higher than that of S-P and S-F. This showed that the concrete crushing occurred earlier in the circular columns, having a smaller cross-sectional area of the compression-side concrete but a higher longitudinal reinforcement ratio than in the square columns. Contrary to the strain distribution observed in S-P and S-F, the strain gradient of the longitudinal rebars in the plastic hinge regions was similar between C-P and C-F. This indicates that the corner blocks with a curved steel plate had a negligible effect on the bond performance between the longitudinal rebars and the concrete in the circular columns.

4.2.2. Strain Distribution in Hoops and Steel Rods

Figure 9 shows the strain distribution in the hoops and external steel rods. The strains used in the comparison were measured from the hoops and external steel rods vertically disposed of in the loading direction.
Figure 9a,b show the strain distribution in the hoops of specimens S-N and C-N, respectively. The strain of the hoops, HA3 in S-N and HA10 in C-N, reached the yield strain ( ε y h = 0.0027 ) at a drift ratio of 0.97% and 1.19%, respectively. After the yielding of the hoops, the strain of the hoops at all positions abruptly increased by the expansion of the width of the shear cracks throughout the specimens.
Figure 9c–f show the distributions of the strain of the hoops and external steel rods in specimens S-P and S-F. The strain of the hoops in S-P and S-F (HA3 in S-P and HA9 in S-F) reached the yield strain at a drift ratio of 1.29%. The hoops of these specimens yielded at a drift ratio 1.33 times as large as the yield drift ratio of S-N. In addition, under maximum strength in S-P and S-F, the strain of the hoops (HA9 in S-P and HA8 in S-F) reached 774% and 634% of the yield strain, respectively. On the other hand, the strain of the external steel rods, SR8 in S-F and S-P, reached 25% and 33% of the yield strain ( ε y s r = 0.0028 ), respectively. At the maximum load, the strain of the hoops in S-P was 1.17 times as high as that of the hoops in S-F. On the other hand, the strain of the external steel rods in S-F was 1.32 times as high as that of the external steel rods in S-P. As mentioned above, this suggests that the L-type corner blocks and the external steel rods more effectively suppressed the expansion of the cracks developed on shear failure surfaces.
Figure 9g–j show the strain of the hoops and external steel rods in specimens C-P and C-F. The strain of the hoops, HA9 in C-P and HA8 in C-F, reached the yield strain at a drift ratio 1.14 times and 1.47 times as large as the yield drift ratio of C-N, respectively. In C-P and C-F under the maximum strength, the strain of the hoops, HA3 in C-P and HA2 in C-F, reached 489% and 366% of the yield strain, respectively, but the strain of the external steel rods, SR8 in C-F and 2 in C-P, reached 38% and 44% of the yield strain, respectively. The experimental results showed that the effects of the curved corner blocks and the external steel rod to control the shear cracks were smaller in the C series specimens than in the S series specimens. On the contrary, the strain of the external steel rod located in the plastic hinge region was significantly higher in the C series specimens than in the S series specimens. This shows that the external steel rods effectively resisted the shear force and the lateral expansion of the concrete in the C series specimens, compared with the S series specimens.

4.3. Reinforcement Effect

This section evaluates the reinforcement effect of the RC columns by the proposed strengthening method in terms of the stiffness degradation, displacement ductility, energy dissipation capacity, and damage degree level. The analysis was performed by using the average of the absolute values of the lateral load and displacement in the positive and negative directions ( P i = + P i + P i / 2 , Δ i = + Δ i + Δ i / 2 ). Table 4 compares the cracking load ( P c r ) , yield load ( P y ), maximum load ( P m a x ) , and ultimate load ( P u ) , of the specimens, extracted from the load–drift ratio curves, as well as the displacement, stiffness, and displacement ductility corresponding to each of the loads.

4.3.1. Stiffness Degradation

Figure 10 shows the stiffness degradation ratio of the S and C series specimens for the drift ratio. The stiffness degradation ratio was defined as the ratio between the secant stiffness, k i , and the elastic stiffness, k e . The stiffness degradation ratio of the S and C series specimens was similar to a drift ratio of 1.33% regardless of the reinforcement’s presence. Since the level of the introduced prestress was low, the difference in the initial stiffness at the drift ratio of 0.25 to 0.50% was negligible between the different specimen series. However, as the drift ratio increased to 3.00%, the stiffness degradation ratio was slightly higher in the C series specimens than in the S series specimens. This may be because the circular external steel rods effectively confined the concrete on the compression side of the plastic hinges compared with the square external steel rods before reaching the maximum load.

4.3.2. Displacement Ductility

The displacement ductility coefficient, μ , is defined as the ratio of the ultimate displacement, Δ u , to the yield displacement, Δ y . P y and Δ y of all the specimens, shown in Table 4, were estimated by the model proposed by Priestley et al. [38]. Δ y of S-P and S-F were 1.73 times and 1.75 times as high as that of S-N, respectively, while Δ y of C-P and C-F were 1.42 times and 1.64 times as high as that of C-N, respectively. Table 4 shows the displacement ductility coefficient, μ , for all the specimens. The average μ of S-P and S-F was 1.73 times as high as their control specimen, and that of C-P and C-F was 1.3 times as high as their control specimen. However, in the strengthened specimens, the length of the corner blocks did not show a significant effect in increasing the ductile capacity. Moreover, the displacement ductility of the strengthened circular specimens was lower than that of the square specimens because the concrete crushing occurred earlier in the C-series specimens, compared with the S-series specimens, after reaching the maximum load.

4.3.3. Energy Dissipation Capacity

Figure 11 compares the cumulative hysteresis energy dissipation, Σ H E , between the specimen series. Σ H E at a given cycle is computed as the summation of the hysteretic energies dissipated during the current and preceding cycles. H E is determined from the area enclosed by the hysteretic loop at each cycle. The Σ H E of the control specimens S-N and C-N, which underwent shear failure at a drift ratio of 2.0%, was 37.7 kN·m and 43.9 kN·m, respectively. The Σ H E of S-P and S-F was 5.0 times and 6.6 times as much as their control specimen, respectively, and that of C-P and C-F was 2.3 times and 3.1 times as much as their control specimen. Moreover, the Σ H E of the strengthened S-series specimens at the same drift ratio of 4.0% was 1.47 times as much as the C-series specimens. The analytical results verified that the proposed strengthening method increased the shear resistance of the column specimens and the transverse confinement of the concrete to induce the flexural failure of the columns, significantly enhancing the energy dissipation capacity of the strengthened specimens.

4.3.4. Damage Assessment

The damage degree of the control and strengthened specimens was assessed using the damage index model developed by Park and Ang (PA index model) [39,40]. Table 5 shows the five damage degree levels of a reinforced concrete building, suggested by Park and Ang [39]. The damage index, D I , is calculated by Equations (1) and (2):
D I = Δ i Δ u + β Σ H E i P y Δ u
β = 0.7 ρ s 0.447 + 0.073 l d + 0.24 n o + 0.314 ρ t
where Δ i is the maximum displacement at each drift ratio; Δ u is the ultimate displacement; Σ H E i is the cumulative hysteretic energy at each drift ratio; P y   is the yield load; β is a non-negative parameter based on cyclic loading effect; ρ s is the volumetric ratio of confining steel; ρ t is the longitudinal reinforcement ratio as a percentage (=0.75% if ρ t < 0.75%); n o   is the normalized axial stress (=0.2 if n o < 0.2); and l / d is the shear span ratio (=1.7 if l / d < 1.7).
In Equation (2), the values of l / d , n o , and ρ t are taken from Table 2, and the volumetric confinement ratio of steel, ρ s , is calculated in consideration of the volume of concrete confined by the hoops and external steel rods. In the present study, ρ s of the circular and square column specimens was calculated by calculating the volumetric ratio of confining steel obtained by modifying the model proposed by Mander et al. [41], as described in Section 4.4.
Figure 12 shows the damage assessment of the S and C series specimens. S-N and C-N were severely damaged at a drift ratio of 1.0% and reached collapse damage at a drift ratio of 2.0%. On the contrary, S-P, S-F, and C-F were slightly damaged at a drift ratio of 1.0% and reached collapse damage at a drift ratio of 5.0%. C-P was moderately damaged at a drift ratio of 1.0% and reached collapse damage at a drift ratio of 4.0%. The damage assessment showed that, while the external steel rods with a low prestress level had a negligible effect on the initial stiffness increase, the proposed strengthening method considerably reduces the seismic damage in RC columns.

4.4. Shear and Ultimate Strengths in the Flexure of Externally Strengthened RC Columns

The experimental results of this study and the existing literature showed that external reinforcement enhances the stiffness, strength, and ductility capacity of RC members. However, brittle failure may occur in a strengthened RC column because an increase in the quantity of transverse reinforcement increases the flexural and shear strength of the column; thus, it should be carefully considered in the design. This section describes an analytical approach to predict the shear strength and ultimate flexural strength of the square and circular columns strengthened by the external steel rods and then compares the predicted shear and ultimate flexural strengths with the experimental results.
The shear strength of a square RC column under an axial compressive load, N , consists of the shear resistance of concrete, V c , and the contribution of transverse reinforcement, V s . Current design codes recommend calculating the shear strength of a circular column, assuming that it is the same as the shear strength of an equivalent square column. In the case of columns externally strengthened by steel rods, the contribution of the steel rods to the shear strength should be considered. Considering the addition of the external steel rods, the shear strength of a strengthened column, V n , can be expressed as
V n = V c + V s = 0.17 λ f c k + N 6 A g b d + A w f y w s d
in which λ is the coefficient of lightweight concrete; A g is the gross area of cross-section; f c k is the compressive strength of concrete; b is the section width; d is the effective depth; A w is the average cross-sectional area of one leg of hoop and external steel rod; f y w is the average yield strength of hoop and external steel rod; and s is the center-to-center distance between the hoop and external steel rod (center-to-center). Equation (3) has the same format as the nominal one-way shear strength provided in the ACI 318-19 building code [42].
An increase in the transverse reinforcement ratio also affects the flexural strengths of columns due to increasing confining pressure. The confinement model developed by Mander et al. [40] was employed to predict the flexural strength of the columns strengthened by the external steel rods. Figure 13 shows the cross-sectional dimensions of the square and circular columns strengthened by the external steel rods. The effective transverse confinement stress, f l , and the confined concrete strength, f c c , in the model by Mander et al. are herein expressed by applying the average yield strength and dimension of the hoops and external steel rods as in Equations (4) and (5):
f l = 0.5 k e ρ s f y w
f c c = f c k 1.254 + 2.254 1 + 7.94 f l f c k 2 f l f c k
Here, k e is the confinement effectiveness coefficient. k e for circular and square sections is expressed as Equations (6) and (7), respectively.
k e = 1 0.5 s d c 2 1 ρ c
k e = 1 w i 2 6 c x c y 1 s 2 c x 1 s 2 c y / 1 ρ c  
In this equation, s is the clear distance between hoop and steel rod; d c is the average diameter of circular confining steel; d c h and d c s r are the diameters of the circular hoop and circular steel rod, respectively; ρ c is the ratio of longitudinal steel area to nominal concrete core area; w i is the clear distance between each longitudinal rebar; c x is the average dimension of a concrete core surrounded by confining steel parallel to the x -axis; c x h and c x s r are the dimensions of the concrete core surrounded by a square hoop and steel rod parallel to the x -axis, respectively; c y is the average dimension of the concrete core surrounded by confining steel parallel to the y -axis; c y h and c y s r are the dimensions of the concrete core surrounded by the square hoop and steel rod parallel to the y -axis, respectively. More details about the stress–strain relation for confined concrete can be found in [40]. The maximum c x s r , c y s r , and d c s r were assumed to be equal to the width ( b ), height ( h ), and diameter ( D ) of the cross-section of the specimens, respectively. The clear distance between the hoop and the steel rod was 88.5 mm. The flexural yield strength and the ultimate flexural strength of the strengthened specimens in consideration of f c c are calculated by using the linear distribution of the y-axis strains and the equivalent rectangular concrete stress block without applying the safety factors for the concrete and longitudinal rebar.
Table 6 compares the experimental and analytical results. The shear force, V y h , at the yield of the hoops observed in the control specimens that underwent shear failure was compared with the shear strength, V n , calculated by Equation (3). The maximum shear force, V m a x . e , observed in the strengthened specimens was likewise compared with the ultimate flexural strength ( V u = M u / a ) from the flexural analysis. V u of the strengthened specimens, with the L-type corner blocks, includes the contribution of the L-type corner blocks in flexure. Here, the observed maximum shear force, V m a x . e , of the specimens represents the average maximum loads in the positive and negative directions.
V n of S-N and C-N was 292.0 kN and 271.2 kN, respectively, indicating that the strengthened specimens’ shear strength was more than 2.2 times as high as the control specimens. In addition, the flexural yield strength, V y , and the ultimate flexural strength, V u , of all the strengthened specimens were lower than V n , suggesting that the strengthened specimens undergo flexural failure. It was found that the calculated V u was very similar to the maximum shear force observed in the experiment. The average and the coefficient of variation of the ratio between the analytical result, V a n a l , and the experimental result, V t e s t , were 1.02 and 6.95%, respectively. It showed that the analytical approach considering the average yield strength of the hoops and the external steel rods, the average dimensions of the cross-section, and the confined concrete strength provided highly accurate predictions of the shear and ultimate flexural strengths, as well as the failure mode of the strengthened square and circular columns.

5. Conclusions

This article presented an external strengthening method of RC columns that introduces prestress to external steel rods and which is feasible and straightforward. A quasi-static cycling loading test was performed on the square and circular columns strengthened by the proposed strengthening method, and the following conclusions were derived:
  • The initial elastic stiffness was not increased in the specimens strengthened by the external steel rods with a low prestress level at a drift ratio of 0.25 to 0.50% before the occurrence of the flexure-shear cracks. However, the external steel rods suppressed the expansion of the diagonal tensile cracks generated in the specimens at a larger drift ratio, so the load-carrying capacity of the columns was improved by more than 1.2 times.
  • Installing the external steel rods and the L-type corner blocks improved the transverse concrete confinement and the bond strength of the longitudinal rebars; moreover, this induced flexural failure with a ductility higher than three in the strengthened columns.
  • The evaluation of the damage degree level of the specimens showed that, while the control specimens reached collapse level at a drift ratio of 2.0%, the strengthened ones reached collapse level at a drift ratio of 4.0 to 5.0%. It was found that the proposed strengthening method can effectively improve the seismic capacity of RC columns.
  • The flexural analysis considering the hoops and external steel rods’ average yield strength, the cross-section’s average dimensions, and the confined concrete strength can reasonably predict the failure mode, the shear strength, and the ultimate flexural strength of RC columns strengthened by the external steel rods. Further studies are needed on the effect of prestressing and axial load levels on the transverse confinement of concrete and the strength and ductility capacity of column members.
  • The experimental and analytical results showed the possibility that the proposed strengthening method can improve the lifespan expectancy and the service life of existing RC structures against seismic events by suppressing the expansion of cracks in columns damaged due to deterioration.

Author Contributions

Conceptualization, H.-G.K., Y.-J.L. and K.-H.K.; methodology, H.-G.K.; software, Y.-J.L.; validation, H.-G.K. and Y.-J.L.; formal analysis, Y.-J.L.; investigation, H.-G.K.; resources, H.-G.K.; data curation, H.-G.K. and Y.-J.L.; writing—original draft preparation, H.-G.K. and Y.-J.L.; writing—review and editing, Y.-J.L. and K.-H.K.; visualization, H.-G.K. and Y.-J.L.; supervision, K.-H.K.; project administration, K.-H.K.; funding acquisition, H.-G.K. and K.-H.K. All authors have read and agreed to the published version of the manuscript.

Funding

This work was supported by the Priority Research Centers Program through the National Research Foundation of Korea (NRF) funded by the Ministry of Education (2019R1A6A1A03032988); This research was supported by Basic Science Research Program through the National Research Foundation of Korea (NRF) funded by the Ministry of Education (2018R1A2B3001656); This research was supported by Basic Science Research Program through the National Research Foundation of Korea (NRF) funded by the Ministry of Education (2019R1I1A3A01058156).

Institutional Review Board Statement

Not applicable.

Informed Consent Statement

Not applicable.

Data Availability Statement

Not applicable.

Conflicts of Interest

The authors declare no conflict of interest.

References

  1. Yarandi, M.S.; Saatcioglu, M.; Foo, S. Rectangular concrete columns retrofitted by external prestressing for seismic shear re-sistance. In Proceedings of the 13th World Conference on Earthquake Engineering, Vancouver, BC, Canada, 1–6 August 2004; p. 2720. [Google Scholar]
  2. Andrawes, B.; Shin, M.; Wierschem, N. Active Confinement of Reinforced Concrete Bridge Columns Using Shape Memory Alloys. J. Bridg. Eng. 2010, 15, 81–89. [Google Scholar] [CrossRef]
  3. California Department of Transportation. Seismic Design Criteria, Version 2.1; Caltrans: Sacramento, CA, USA, 2019.
  4. Miyagi, T.; Yamagawa, T.; Li, W.; Rahman, M.N. A study on emergency retrofit using prestressing bars and steel plates for damaged columns. In Proceedings of the 13th World Conference on Earthquake Engineering, Vancouver, BC, Canada, 1–6 August 2004; p. 1169. [Google Scholar]
  5. Zhang, D.; Ueda, T.; Furuuchi, H. Concrete cover separation failure of overlay-strengthened reinforced concrete beams. Constr. Build. Mater. 2012, 26, 735–745. [Google Scholar] [CrossRef]
  6. Chalioris, C.E.; Thermou, G.E.; Pantazopoulou, S.J. Behavior of rehabilitated RC beams with self-compacting concrete jacketing – Analytical model and test results. Constr. Build. Mater. 2014, 55, 257–273. [Google Scholar] [CrossRef]
  7. Zhang, D.; Li, N.; Li, Z.-X.; Xie, L. Rapid repair of RC bridge columns with prestressed stainless-steel hoops and stainless-steel jackets. J. Constr. Steel Res. 2021, 177, 106441. [Google Scholar] [CrossRef]
  8. Ren, Z.; Zeng, X.; Sun, J. Using Two-Way Prestressed Semicircular Steel Plate for Construction of Reinforced Concrete Cylinder Column. Complexity 2018, 2018, 1481837. [Google Scholar] [CrossRef] [Green Version]
  9. Li, Y.; Hwang, J.; Chen, S.; Hsieh, Y. A study of reinforced concrete bridge columns retrofitted by steel jackets. J. Chin. Inst. Eng. 2005, 28, 319–328. [Google Scholar] [CrossRef]
  10. Lin, M.-L.; Chen, P.-C.; Tsai, K.-C.; Yu, Y.-J.; Liu, J.-G. Seismic steel jacketing of rectangular RC bridge columns for the mitigation of lap-splice failures. Earthq. Eng. Struct. Dyn. 2010, 39, 1687–1710. [Google Scholar] [CrossRef]
  11. Choi, E.; Chung, Y.-S.; Park, C.; Kim, D.J. Seismic performance of circular RC columns retrofitted with prefabricated steel wrapping jackets. Mag. Concr. Res. 2013, 65, 1429–1440. [Google Scholar] [CrossRef]
  12. Hawileh, R.; Naser, M.Z.; Zaidan, W.; Rasheed, H. Modeling of insulated CFRP-strengthened reinforced concrete T-beam exposed to fire. Eng. Struct. 2009, 31, 3072–3079. [Google Scholar] [CrossRef]
  13. Mofidi, A.; Chaallal, O. Tests and Design Provisions for Reinforced-Concrete Beams Strengthened in Shear Using FRP Sheets and Strips. Int. J. Concr. Struct. Mater. 2014, 8, 117–128. [Google Scholar] [CrossRef] [Green Version]
  14. Wu, Y.-F.; Liu, K. Characterization of Mechanically Enhanced FRP Bonding System. J. Compos. Constr. 2013, 17, 34–49. [Google Scholar] [CrossRef]
  15. Capani, F.; D’Ambrisi, A.; De Stefano, M.; Focacci, F.; Luciano, R.; Nudo, R.; Penna, R. Experimental investigation on cyclic response of RC elements repaired by CFRP external reinforcing systems. Compos. Part B Eng. 2017, 112, 290–299. [Google Scholar] [CrossRef] [Green Version]
  16. Obaidat, Y.T.; Ashteyat, A.M.; Obaidat, A.T.; Alfaris, S.F. A new technique for repairing reinforced concrete columns. J. Build. Eng. 2020, 30, 101256. [Google Scholar] [CrossRef]
  17. Wang, J.; Yang, J.; Cheng, L. Experimental Study of Seismic Behavior of High-Strength RC Columns Strengthened with CFRP Subjected to Cyclic Loading. J. Struct. Eng. 2019, 145, 04018240. [Google Scholar] [CrossRef]
  18. Kothandaraman, S.; Vasudevan, G. Flexural retrofitting of RC beams using external bars at soffit level – An experimental study. Constr. Build. Mater. 2010, 24, 2208–2216. [Google Scholar] [CrossRef]
  19. Demir, A.; Ercan, E.; Demir, D.D. Strengthening of reinforced concrete beams using external steel members. Steel Compos. Struct. 2018, 27, 453–464. [Google Scholar]
  20. Saatcioglu, M.; Yalcin, C. External Prestressing Concrete Columns for Improved Seismic Shear Resistance. J. Struct. Eng. 2003, 129, 1057–1070. [Google Scholar] [CrossRef]
  21. Deng, Z.C.; Jumbe, R.; Li, H. Seismic Behavior of Short Concrete Columns with Prestressing Steel Wires. Adv. Mater. Sci. Eng. 2014, 2014, 180193. [Google Scholar] [CrossRef]
  22. Li, Y.; Wu, M.; Wang, W.; Xue, X. Shear Behavior of RC Beams Strengthened by External Vertical Prestressing Rebar. Adv. Civ. Eng. 2021, 2021, 5483436. [Google Scholar] [CrossRef]
  23. Osman, B.H.; Wu, E.; Bohai, J.; Abdallah, M. Repair technique of pre-cracked reinforced concrete (RC) beams with transverse openings strengthened with steel plate under sustained load. J. Adhes. Sci. Technol. 2017, 31, 2360–2379. [Google Scholar] [CrossRef]
  24. Yang, S.-H.; Cao, S.-Y.; Gu, R.-N. New technique for strengthening reinforced concrete beams with composite bonding steel plates. Steel Compos. Struct. 2015, 19, 735–757. [Google Scholar] [CrossRef]
  25. Hamad, B.; Masri, A.; Basha, H.; Baalbaki, O. Behavior of T-shaped reinforced concrete beams partially confined by structural steel. Constr. Build. Mater. 2011, 25, 1037–1043. [Google Scholar] [CrossRef]
  26. Su, R.; Siu, W.; Smith, S. Effects of bolt–plate arrangements on steel plate strengthened reinforced concrete beams. Eng. Struct. 2010, 32, 1769–1778. [Google Scholar] [CrossRef]
  27. Swamy, R.N.; Jones, R.; Charif, A. The effect of external plate reinforcement on the strengthening of structurally damaged RC beams. Struct. Eng. 2008, 67, 45–56. [Google Scholar]
  28. Arslan, G.; Sevuk, F.; Ekiz, I. Steel plate contribution to load-carrying capacity of retrofitted RC beams. Constr. Build. Mater. 2008, 22, 143–153. [Google Scholar] [CrossRef]
  29. Afshin, H.; Shirazi, M.R.N.; Abedi, K. Experimental and numerical study about seismic retrofitting of corrosion – damaged reinforced concrete columns of bridge using combination of FRP wrapping and steel profiles. Steel Compos. Struct. 2019, 30, 231–251. [Google Scholar]
  30. Chou, C.C.; Lee, C.S.; Wu, K.Y.; Chin, V.L. Development and validation of a FRP-wrapped spiral corrugated tube for seismic performance of circular concrete columns. Constr. Build. Mater. 2018, 170, 489–511. [Google Scholar] [CrossRef]
  31. Chrysanidis, T.; Tegos, I. Axial and transverse strengthening of R/C circular columns: Conventional and new type of steel and hybrid jackets using high-strength mortar. J. Build. Eng. 2020, 30, 101236. [Google Scholar] [CrossRef]
  32. Zhang, D.; Li, N.; Li, Z.-X.; Xie, L. Experimental investigation and confinement model of composite confined concrete using steel jacket and prestressed steel hoop. Constr. Build. Mater. 2020, 256, 119399. [Google Scholar] [CrossRef]
  33. Fakharifar, M.; Chen, G.; Arezoumandi, M.; ElGawady, M.; Information, R. Hybrid Jacketing for Rapid Repair of Seismically Damaged Reinforced Concrete Columns. Transp. Res. Rec. J. Transp. Res. Board 2015, 2522, 70–78. [Google Scholar] [CrossRef]
  34. Li, J.; Gong, J.; Wang, L. Seismic behavior of corrosion-damaged reinforced concrete columns strengthened using combined carbon fiber-reinforced polymer and steel jacket. Constr. Build. Mater. 2009, 23, 2653–2663. [Google Scholar] [CrossRef]
  35. Realfonzo, R.; Napoli, A. Cyclic Behavior of RC Columns Strengthened by FRP and Steel Devices. J. Struct. Eng. 2009, 135, 1164–1176. [Google Scholar] [CrossRef]
  36. Moghaddam, H.; Samadi, M.; Pilakoutas, K.; Mohebbi, S. Axial compressive behavior of concrete actively confined by metal strips; part A: Experimental study. Mater. Struct. 2010, 43, 1369–1381. [Google Scholar] [CrossRef]
  37. The World Green Building Council. Bringing Embodied Carbon Upfront-Coordinated Action for the Building and Construction Sector to Tackle Embodied Carbon; World Green Building Council: London, UK, 2019. [Google Scholar]
  38. Priestley, M.J.N.; Seible, F.; Calvi, G.M. Seismic Design and Retrofit of Bridges; John Wiley & Sons, Inc.: New York, NY, USA, 1996. [Google Scholar]
  39. Park, Y.; Ang, A.H. Mechanistic Seismic Damage Model for Reinforced Concrete. J. Struct. Eng. 1985, 111, 722–739. [Google Scholar] [CrossRef]
  40. Park, Y.; Ang, A.H.; Wen, Y.K. Seismic Damage Analysis of Reinforced Concrete Buildings. J. Struct. Eng. 1985, 111, 740–757. [Google Scholar] [CrossRef]
  41. Mander, J.B.; Priestley, M.J.N.; Park, R. Theoretical Stress-Strain Model for Confined Concrete. J. Struct. Eng. 1988, 114, 1804–1826. [Google Scholar] [CrossRef] [Green Version]
  42. ACI Committee 318. In Building Code Requirements for Structural Concrete (ACI 318-19) and Commentary (ACI 318R-19); American Concrete Institute: Farmington Hills, MI, USA, 2019; pp. 401–410.
Figure 1. Construction view of the proposed strengthening method: (a) column with S-type corner block; (b) column with L-type corner block.
Sustainability 13 13224 g001
Figure 3. Specimens strengthened with external steel rods and corner blocks: (a) S-P; (b) S-F; (c) C-P; (d) C-F.
Sustainability 13 13224 g003
Figure 4. View of the test setup: (a) schematic of the loading equipment; (b) photo of the test setup.
Sustainability 13 13224 g004
Figure 5. Loading protocol.
Sustainability 13 13224 g005
Figure 6. Load–drift ratio hysteretic curves: (a) S-N; (b) S-P; (c) S-F; (d) C-N; (e) C-P; (f) C-F.
Sustainability 13 13224 g006
Figure 7. Crack patterns of the specimens at failure: (a) S-N; (b) S-P; (c) S-F; (d) C-N; (e) C-P; (f) C-F.
Sustainability 13 13224 g007
Figure 8. Strain distributions in the longitudinal reinforcing bars: (a) S-N; (b) C-N; (c) S-P; (d) S-F; (e) C-P; (f) C-F.
Sustainability 13 13224 g008aSustainability 13 13224 g008b
Figure 9. Strain distributions in the hoops and steel rods: (a) hoops in S-N; (b) hoops in C-N; (c) hoops in S-P; (d) steel rods in S-P; (e) hoops in S-F; (f) steel rods in S-F; (g) hoops in C-P; (h) steel rods in C-P; (i) hoops in C-F; (j) steel rods in C-F.
Sustainability 13 13224 g009aSustainability 13 13224 g009b
Figure 10. Stiffness degradation ratio: (a) S-series specimens; (b) C-series specimens.
Sustainability 13 13224 g010
Figure 11. Cumulative hysteretic energy dissipation: (a) S-series specimens; (b) C-series specimens.
Sustainability 13 13224 g011
Figure 12. Damage assessment based on the PA damage index: (a) S-series specimens; (b) C-series specimens.
Sustainability 13 13224 g012
Figure 13. Cross-sectional dimensions of the square and circular columns for calculating k e , f l , and f c c .
Sustainability 13 13224 g013
Table 1. Concrete mix design.
f’cGmaxW/CS/aUnit Weight (kg/m3)
(MPa)(mm)(%)(%)WCSGAD
302536.445.21624607859704.46
f’c: compressive strength of concrete mix design; Gmax: maximum size of coarse aggregate; W/C: water-cement ratio; S/a: fine aggregate modulus; W: water; C: cement; S: fine aggregate; G: coarse aggregate; and AD: water-reducing admixture.
Table 2. List of specimens.
Specimenb
(mm)
h
(mm)
a/d
(-)
Longitudinal
Rebar
Inner
Hoop
External
Steel Rod
Strengthening Method
S-N4004003.112-D22
fy = 650.7 MPa
D10@200
fy = 455.0 MPa
Φ13@200
fy = 544.1 MPa
None-strengthened
S-PS-type corner block
S-FL-type corner block
C-N400(D)None-strengthened
C-PS-type corner block
C-FL-type corner block
S: square section; C: circular section; N: un-strengthened column; P: column with S-type corner blocks; F: column with L-type corner blocks; b: section width; h: section height; D: diameter of circular columns; fy: yield strength; a/d: shear span-to-depth ratio.
Table 3. Summary of the experimental results.
SpecimenLoad (Pi) and Drift Angle (α)Failure Mode
PcrαPyhαPylαPmαPuα
(kN)(%)(kN)(%)(kN)(%)(kN)(%)(kN)(%)
S–N163.40.25227.20.97−350.2∑∑1.34−297.7−1.51Shear
S–P170.00.25351.31.29402.41.74448.02.76380.84.85Shear-flexural
S–F168.00.25−355.0−1.29432.51.93451.12.96383.45.00Shear-flexural
C–N117.00.25239.51.19236.01.33296.11.96251.72.00Shear
C–P110.60.25290.41.68−290.2-1.28−343.5−2.02-291.9−3.26Flexure
C–F119.60.25320.51.76−257.3-1.09345.72.70293.84.43Flexure
Pcr: cracking load; Pyh: load at yielding of hoop; Pyl: load at yielding of longitudinal rebar; Pmax: maximum load; Pu: ultimate load, α: drift angle.
Table 4. Comparison of stiffness at specified load levels.
SpecimenAt PcrAt PylAt PmAt Puμ
ΔcrkcrΔykyΔmkmΔuku
(mm)(kN/mm)(mm)(kN/mm)(mm)(kN/mm)(mm)(kN/mm)(mm/mm)
S-N5.331.118.119.027.812.333.48.71.85
S-P5.332.431.414.250.08.996.83.93.09
S-F5.332.031.714.062.67.1105.03.63.31
C-N5.322.322.512.734.58.342.05.81.87
C-P5.321.131.810.550.16.776.23.72.39
C-F5.322.836.89.449.47.090.23.22.45
Δcr: displacement at cracking load; Δy: yield displacement; Δm: displacement at maximum load; Δu: ultimate displacement; ki: secant stiffness at each load level; μ: displacement ductility coefficient.
Table 5. Five damage degree levels and damage index for RC members.
Damage LevelDamage Index (DI)Visual Damage State
Slight damageDI < 0.1No damage or minor cracking
Minor damage0.1 < DI < 0.25Light cracking throughout
Moderate damage0.25 < DI < 0.4Extensive large cracks, spalling of concrete cover
Severe damage0.4 < DI < 1.0Extensive concrete crushing, visible buckling of reinforcement
CollapseDI > 1.0Partial or total collapse of RC members
Table 6. Comparison of the experimental and analytical results.
SpecimenExperimental Results (Vtest)Analytical Results (Vanal)Vanal/Vtest
Vyh.eVyl.eVmax.eVnVyVuVmax.a
(kN)(kN)(kN)(kN)(kN)(kN)(kN)
S-N277.3-342.4292.0--292.01.05
S-P351.3402.4443.8623.6356.3454.0454.41.02
S-F355.0432.4442.6623.6364.7462.4462.41.04
C-N239.5-286.3271.2--271.21.13
C-P290.4290.2344.8602.9215.1325.1325.10.94
C-F320.5257.3343.7602.9215.8325.9325.90.95
Ave. 1.02
C.V(%) 6.95
V y h . e : observed shear force at yielding of the hoop; V y l . e : observed shear force at yielding of longitudinal rebar; V m a x . e : observed maximum shear force; V n : shear strength; V y : flexural yield strength; V u : ultimate strength in flexure; V m a x . a : minimum value among V n , V y , and V u .
Publisher’s Note: MDPI stays neutral with regard to jurisdictional claims in published maps and institutional affiliations.

