Article

Effect of Emitter Modifications on Spray Performance of a Solid Set Canopy Delivery System in a High-Density Apple Orchard

1
Center for Precision and Automated Agricultural Systems, Biological Systems Engineering, Washington State University, Prosser, WA 99350, USA
2
Freshwater Institute, The Conservation Fund, Shepherdstown, WV 25443, USA
3
Department of Entomology, Michigan State University, East Lancing, MI 48824, USA
4
Application Insight, LLC, Lansing, MI 48906, USA
*
Author to whom correspondence should be addressed.
Sustainability 2021, 13(23), 13248; https://doi.org/10.3390/su132313248
Submission received: 5 November 2021 / Revised: 23 November 2021 / Accepted: 26 November 2021 / Published: 30 November 2021

Abstract

:
Optimally configured solid set canopy delivery systems (SSCDS) can provide adequate spray performance in high-density apple orchards with a minimized risk of off-target pesticide drift. SSCDS configured in a shower-down emitter arrangement have been reported to be the simplest and most economical system. However, existing off-the-shelf emitters used in shower-down configurations have resulted in minimal deposition in lower canopy zones. Therefore, this study was focused on the modifications of off-the-shelf emitters to obtain a desirable spray pattern for adequate spray deposition in all the canopy zones. The modifications include redesigning the impact plate of two existing micro-emitters. Field tests were conducted to evaluate the spray performance of SSCDS with the non-modified emitters (treatment: SD1 and SD3) and contrast the results with modified emitters (treatment: SD2 and SD4). While the treatments SD1 and SD3 had off-the-shelf emitters with swivel plate and static spreader, respectively, the treatment SD2 and SD4 had similar emitters with modified impactor plates. In each treatment block, the apple canopy was divided into six zones and sprayed with a 500 ppm fluorescent tracer solution. Mylar cards and water-sensitive paper samplers were placed on the adaxial and abaxial leaf surfaces in each canopy zone to quantify spray deposition and coverage, respectively. The SSCDS treatments retrofitted with modified emitters, i.e., SD2 and SD4, were observed to have uniform and numerically higher deposition and coverage compared to SD1 and SD3. The SSCDS treatment with modified static spreader (i.e., SD4) resulted in the highest overall spray deposition (1405.7 ± 156.4 ng cm−2 [mean ± standard error]) with improved mid (1121.6 ± 186.9 ng cm−2) and bottom (895.6 ± 149.3 ng cm−2) canopy deposition. Overall, the proposed emitter modification assisted in improved SSCDS spray performances and may be a way forward toward large-scale emplacements of such systems.

1. Introduction

Fresh market apple production has witnessed a significant change in planting techniques during the past two decades. Globally, growers are widely adopting trellis-supported, freestanding, and high-density apple canopies characterized by a fruiting wall that can enhance fruit quality and produce marketability [1,2]. However, tractor trailed air-assisted sprayers, which were originally designed for large, spherical canopies, are still being used for pesticide application in modern orchard systems, characterized by narrow, linear canopies. The use of air-assisted sprayers can cause off-target chemical drift leading to air, water, and ecological contamination [3,4,5,6]. Environmental contamination by pesticides can lead to health hazards for operators, bystanders, and non-target species [7,8,9]. Moreover, tractors pulled sprayers may not be a practical option if soils are wet and impassable for heavy equipment. The physical impacts of application equipment with the canopy result in crop loss and potential damage to trees. The abovementioned drawbacks and limitations raise the need for a sustainable and efficient application technique that is suitable for modern orchard systems.
One of the variants of a fixed spray delivery system, a solid set canopy delivery system (SSCDS), has shown potential to be an alternative to conventional air-assisted sprayers [9,10,11,12]. Typically, an SSCDS is a hydraulic pressure-operated spray delivery system consisting of a network of spray lines and micro-emitters installed within the canopy to achieve effective spray performance while reducing pesticide drift through targeted spraying [10,11,13,14,15,16]. An applicator system, with a spray tank, a gasoline pump, and an air-compressor, was used to feed the spray lines with spray liquid and compressed air during different SSCDS operational stages [9,12]. Such systems have been evaluated in the past for spray application in apples, wine grapes, and other tree-fruit canopies [10,11,12,16,17]. Researchers have also investigated the effect of the emitter type and their within-canopy placement on the spray performance of SSCDS [9,12,18,19,20]. Sinha et al. (2020) [21] proposed a pneumatic spray delivery system including a series of reservoirs to eliminate the effect of frictional pressure drop on spray uniformity. Moreover, efforts have been made to automate SSCDS for large-scale commercial adaptation. Ranjan et al. (2019) [22] developed a spray control unit and an electronic control system to wirelessly actuate flow control solenoid valves in SSCDS to achieve different operational stages of the system.
Despite the discussed advantages and current improvements in SSCDS, such systems employ a large number of micro-emitters in the canopy, and this is a prime factor that directly influences the installation cost. Various studies have been conducted on crop-specific micro-emitter selection and configuration optimization in apple orchards and vineyards [9,16,18,23]. A three-tier configuration with hollow cone emitters placed in top, mid, and bottom canopy zones was reported to provide adequate spray deposition and coverage in high-density apple canopies [16]. Ranjan et al. (2021) [24] conducted a study to customize the design of the in-canopy static emitters that further improved the spray performance of a three-tier configured SSCDS. However, with six emitters per tree, such configurations may find a tough path toward adoption in commercial orchards. Sinha et al. (2021) [16] evaluated a configuration with only one emitter atop the tree canopy. This was the simplest configuration, creating a “shower-down” effect over the tree canopy. Such systems are comparatively economical for use in commercial orchards. However, these emitters are used for irrigation in controlled-environment agriculture and have a larger wetted diameter that reduced spray deposition and coverage in the lower canopy zones. Therefore, the overall goal of the study was to modify existing irrigation micro-emitters to have desirable spray attributes with a shorter wetted diameter and a canopy-confined spray pattern for improving within-canopy deposition and spray uniformity. The following are the specific objectives of the study:
  • The design and fabrication of micro-emitter impactor plates intended to achieve uniform and efficient spray performance through modified emitters.
  • Field evaluation of modified emitters integrated into SSCDS configurations suitable for a high-density apple orchard trained in a tall spindle architecture.

2. Materials and Methods

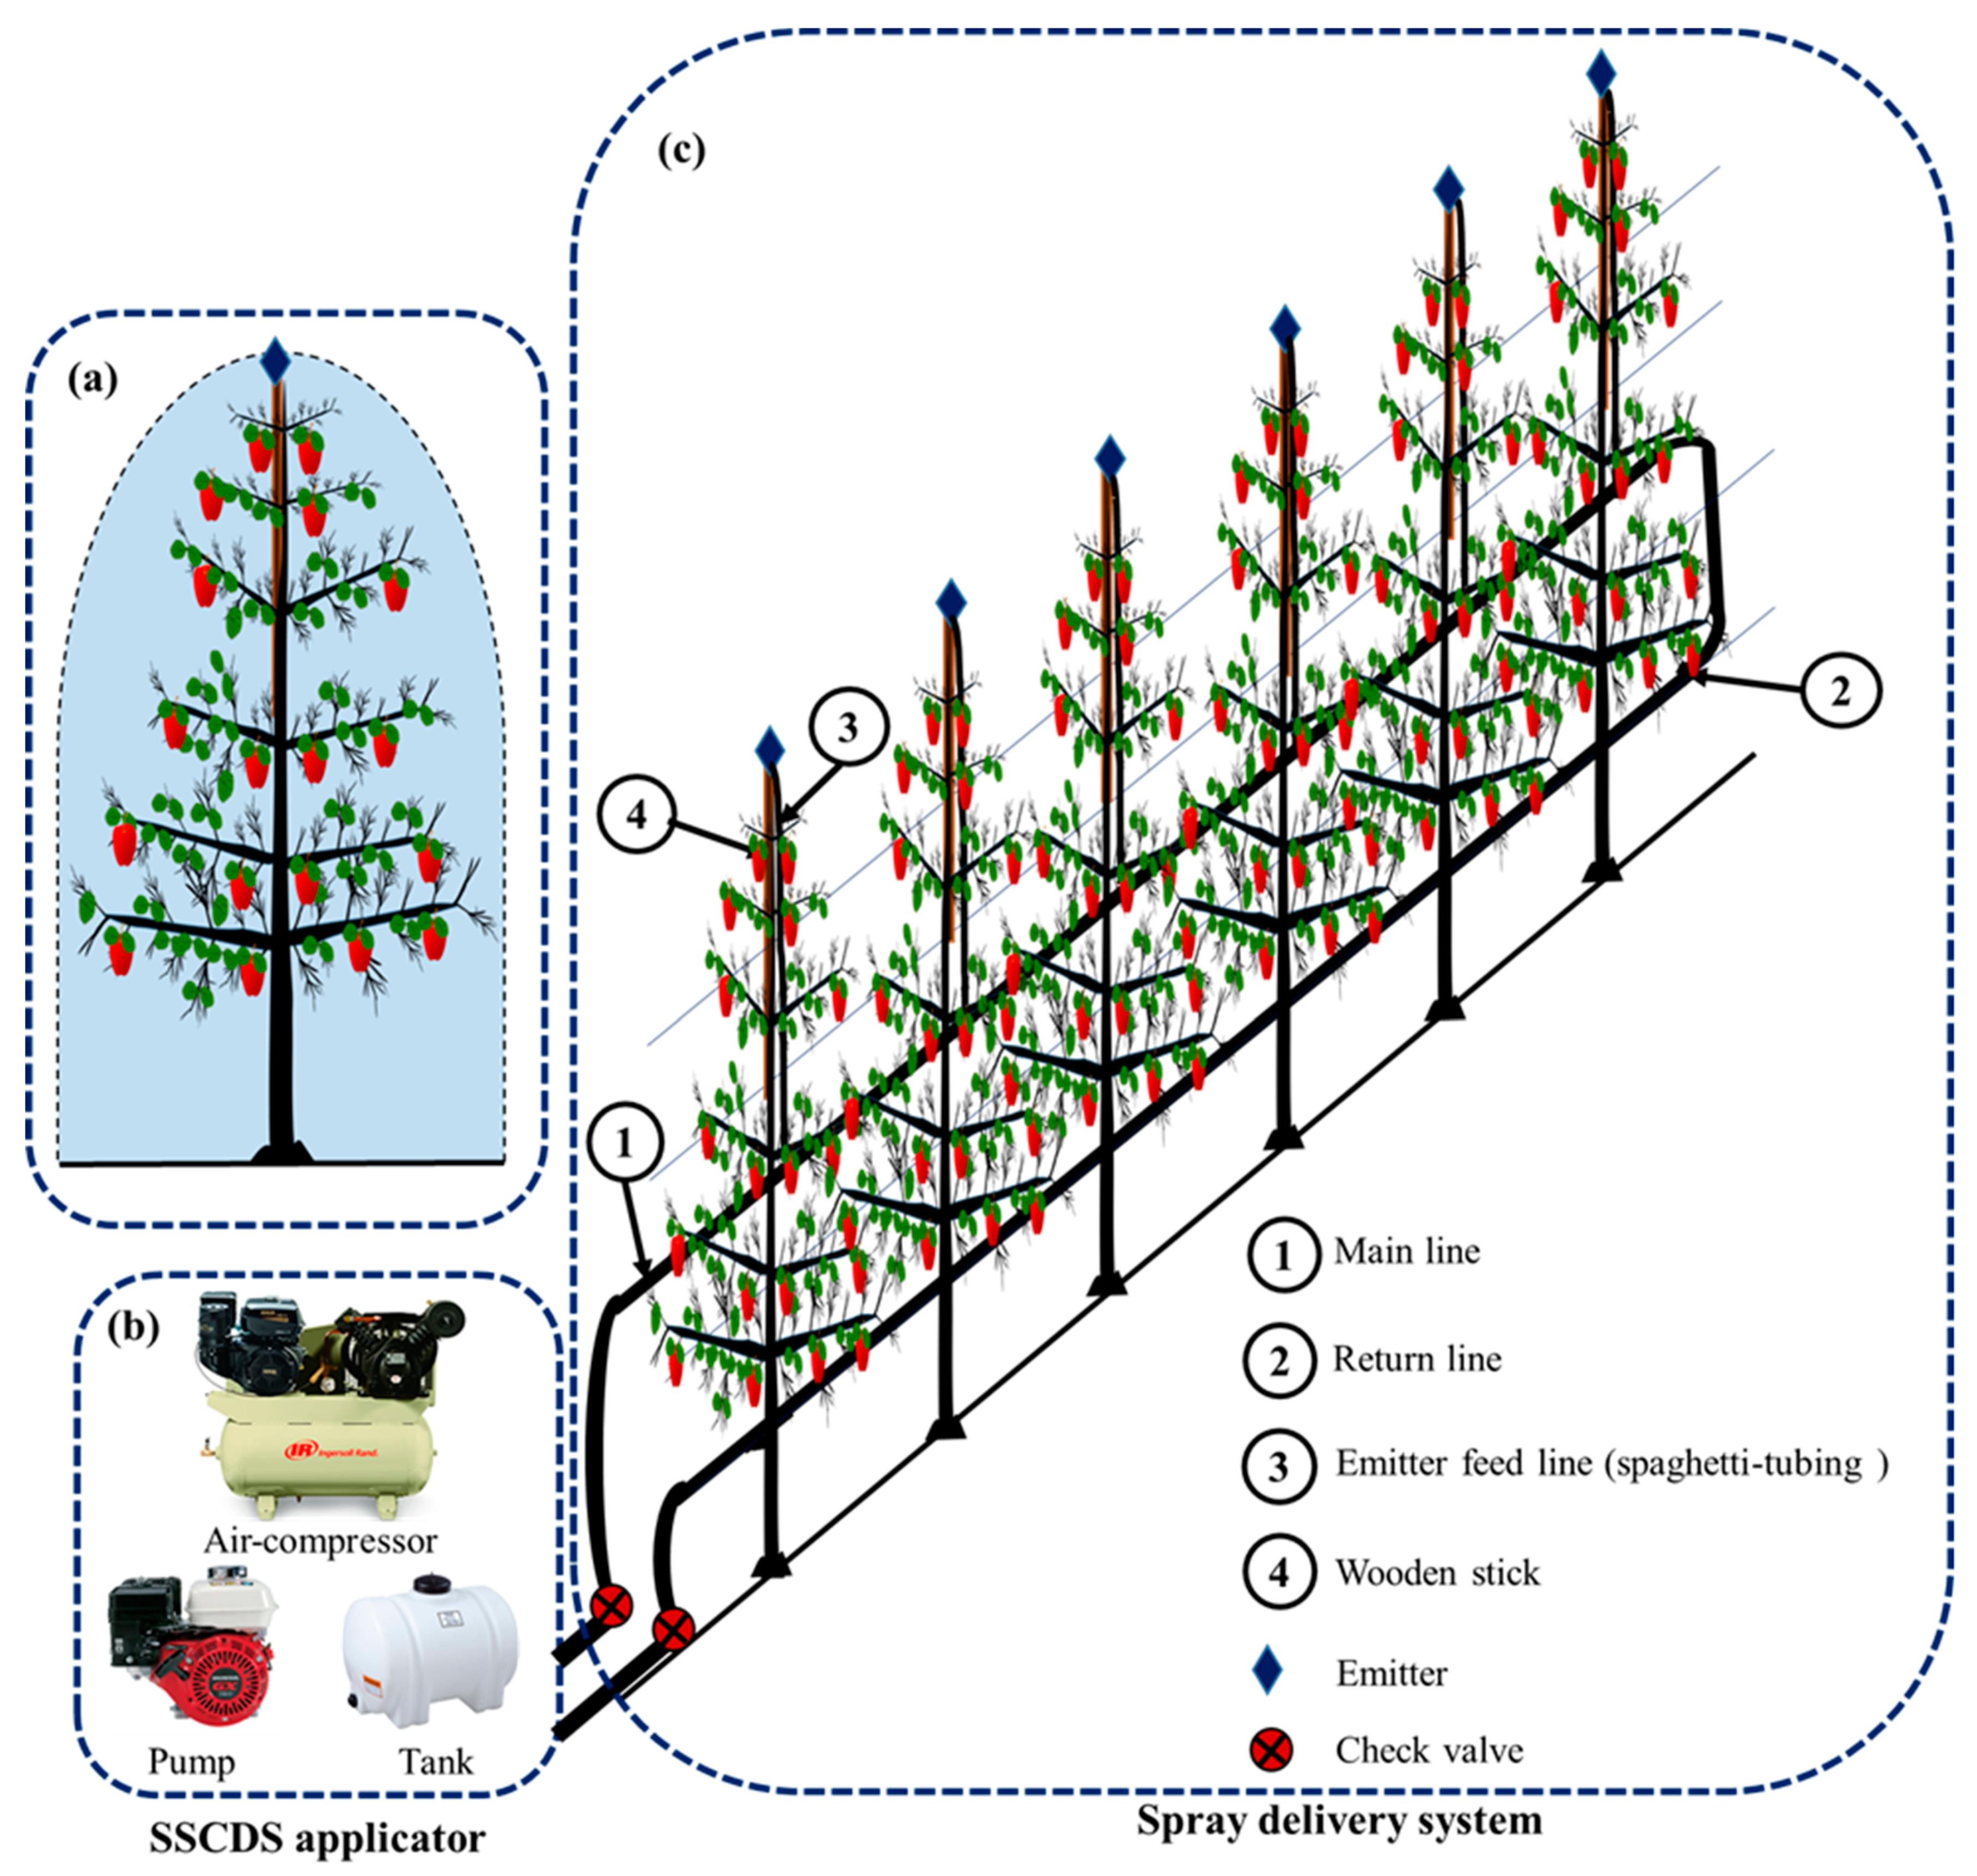
2.1. Solid Set Canopy Delivery System

The SSCDS tested in this study delivered the spray material to the canopy using an applicator system (Figure 1b) connected with a network of polyethylene (PE) spray lines and micro-emitters. The specific details of the SSCDS applicator system are in Sinha et al. (2019) [9]. Briefly, the spray delivery system consisted of main and return spray lines connected in a loop (Figure 1c). Manual shut-off valves were provided at the loop’s end to control the flow of spray liquid through the system. The main (Ø = 2.54 cm) and return (Ø = 1.91 cm) spray lines were installed on existing tree row trellis wires with the help of custom fixtures at 2.5 m and 1.5 m above ground level (AGL), respectively. The open ends of the main and return lines were connected to a pump (model: 2475F14G, Ingersoll Rand, Davidson, NC, USA) and air-compressor (model: Hypro 1538, Pentair plc, New Brighton, MN, USA) assembly mounted on the mobile applicator assembly. The micro-emitters were installed at 0.91 m above the canopy at a linear spacing of 0.91 m with the help of a wooden stick and were connected to the main line using PE tubing (Ø = 0.6 cm). Two off-the-shelf commercial micro-emitters (E1 and E3) and two modified micro-emitters (E2 and E4) were tested in shower-down configuration (Figure 1a). The system was charged with spray liquid at a hydraulic pressure of 138 kPa, and spray application was achieved at a hydraulic pressure of 310 kPa. An air compressor was operated to recover the residual liquid in the spray line and clean the system at pressures of 138 and 310 kPa, respectively. In addition, each emitter was end-plugged to a diaphragm check valve (Cracking pressure: 207 kPa, Jain® Irrigation Inc., Fresno, CA, USA) to avoid the dripping of spray material at lower hydraulic pressure.

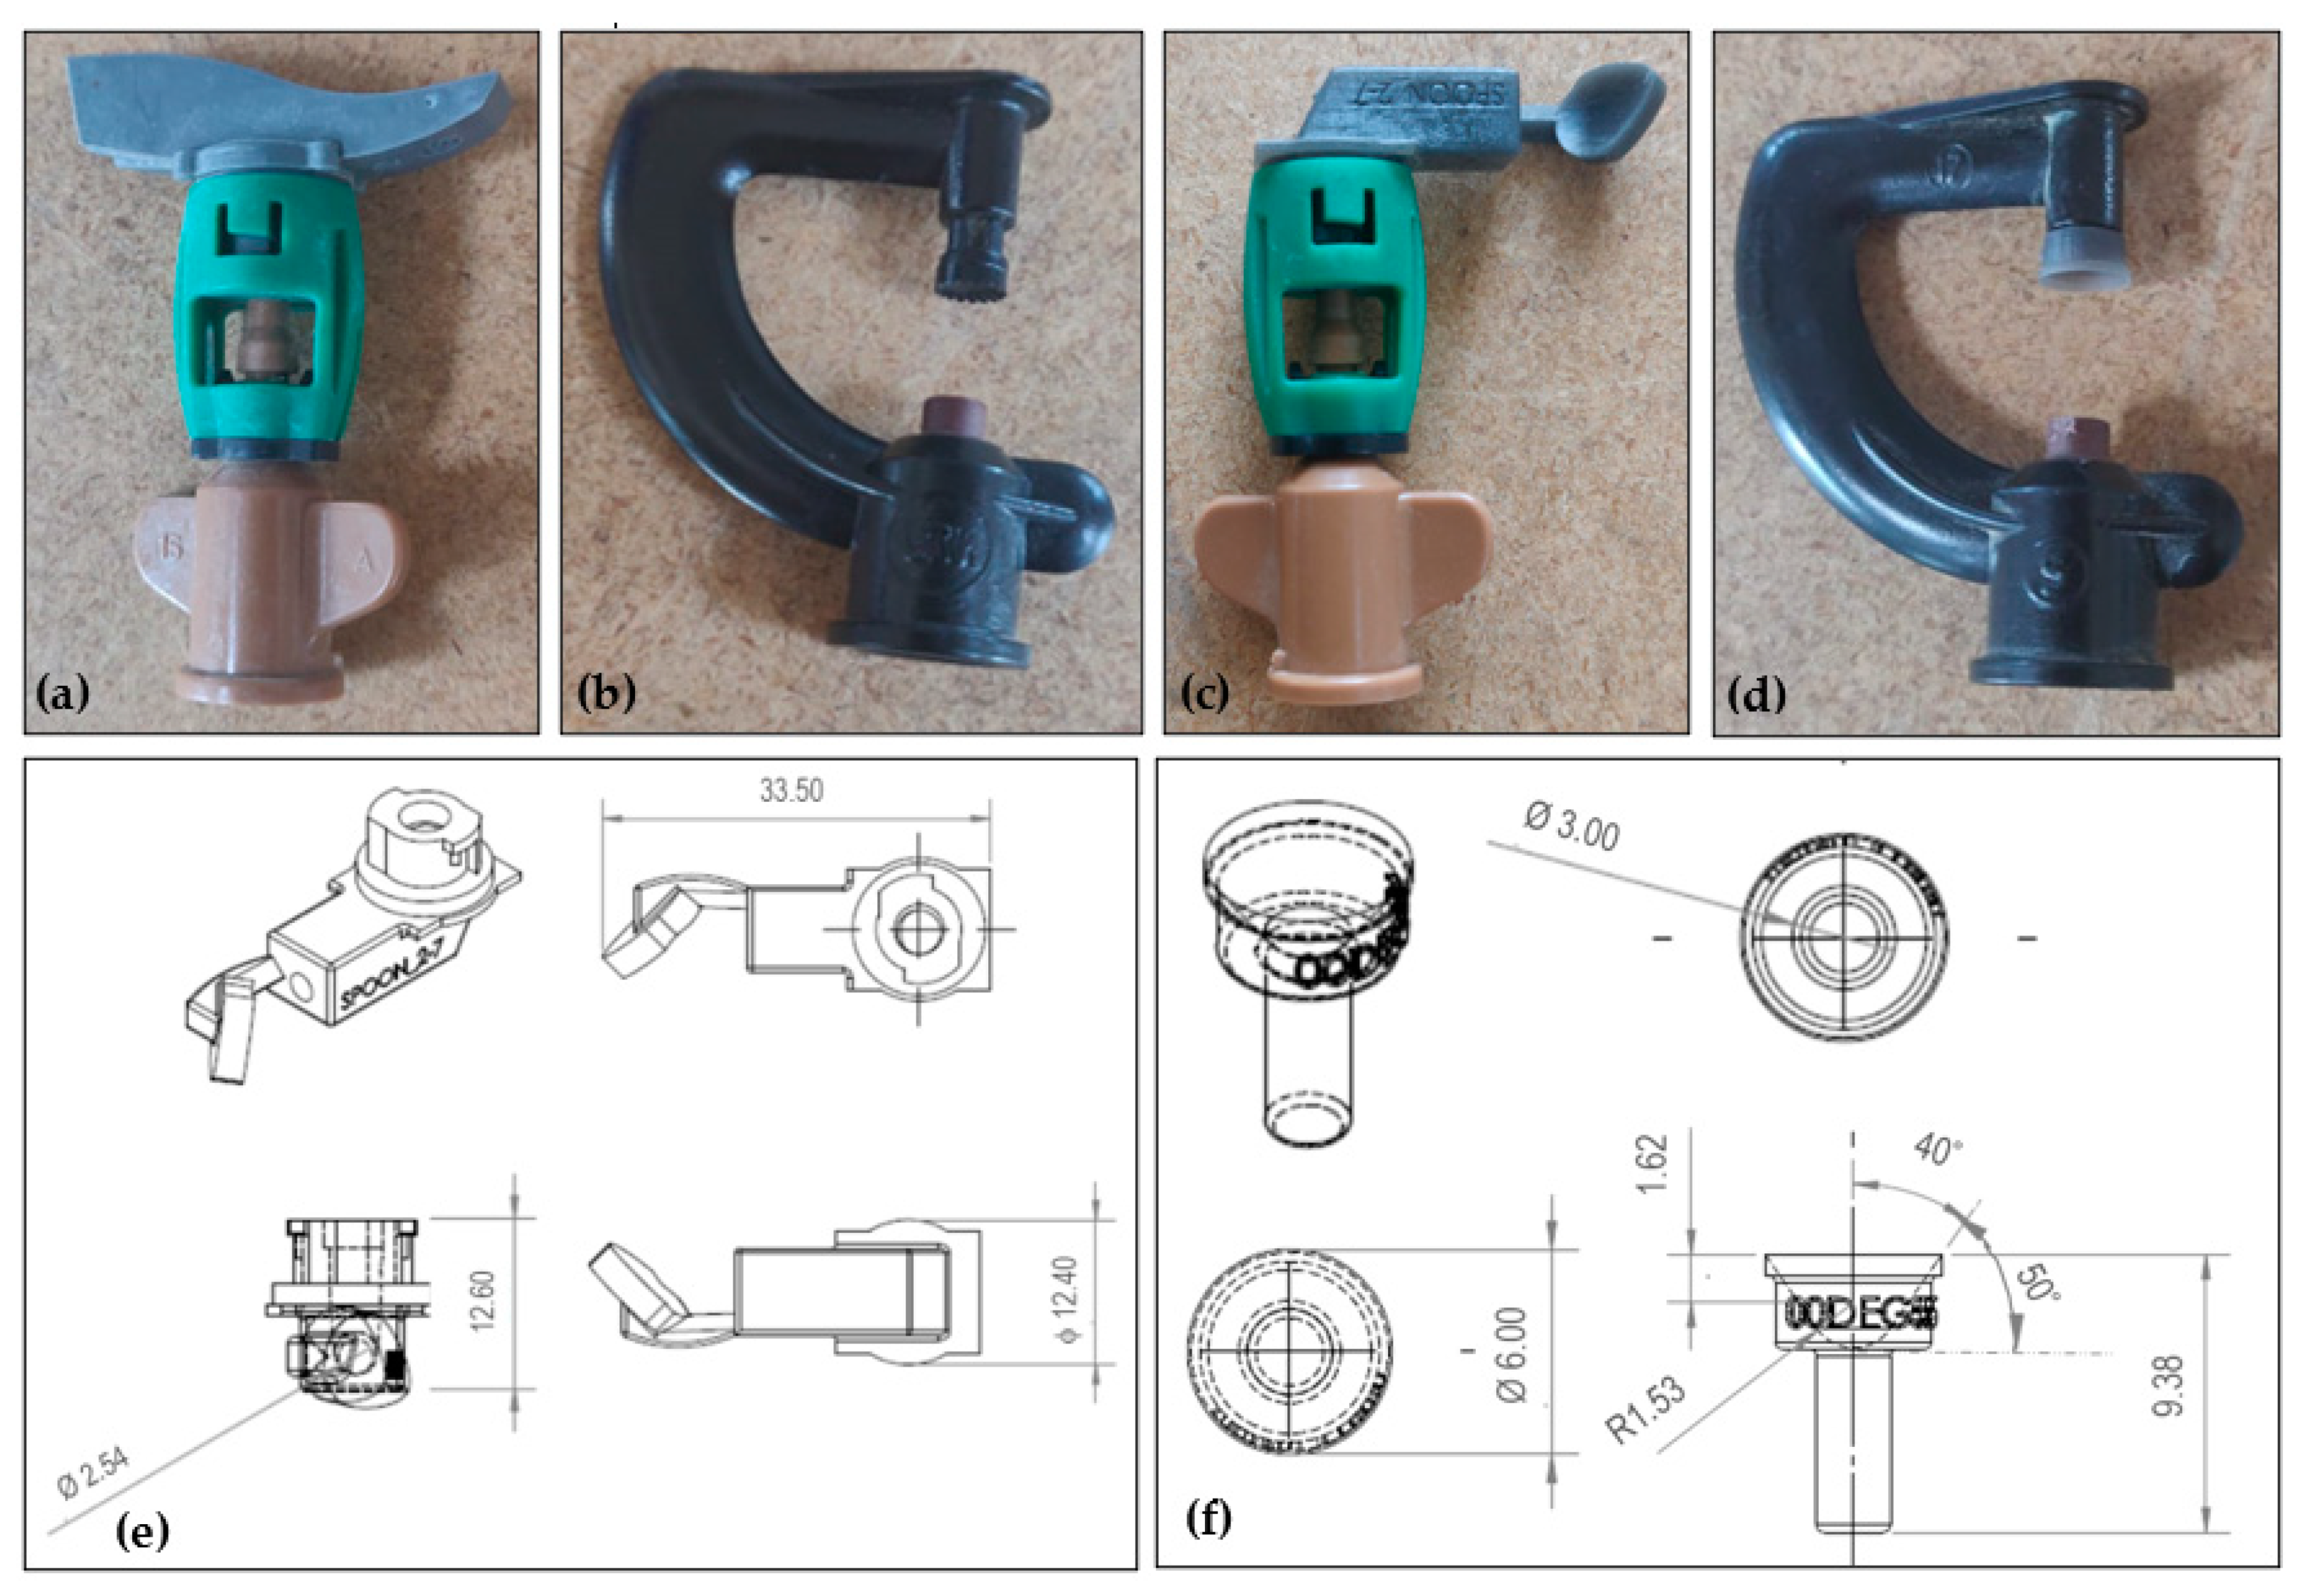
2.2. Micro-Emitter Modification

Two off-the-shelf irrigation micro-emitters, one with a swivel plate deflector (hereafter termed as E1, Figure 2a) and the other with a static spreader (hereafter termed as E3, Figure 2b) were used in two SSCDS treatments in shower-down arrangements. Pertinent modifications were made in E1 and E3 micro-emitters to obtain a narrow spray pattern desirable for apple trees in the modern orchard system. Typically, the tree row spacing in such a system is about 2.7–3.0 m. Thus, the micro-emitter modifications were sought to keep the spray within the crop canopy (Figure 3). For E1, an internal circular channel (Ø = 2.54 mm) was provided in the unit’s swivel body to generate a spray jet, and an inclined deflector was added in front of the jet outlet (Figure 2e) to act as an impactor plate for creation of the droplet spectra. The inclined deflector acted as a restriction in the path of the spray jet, thereby reducing the wetted diameter considerably (Figure 3b). The angle of the plate was varied to optimize and focus the direction of travel of the droplets in a conical manner. The shape and concavity of the plate were varied to adjust droplet size. The three most successful shapes for the modified emitter were (i) round plate, (ii) pie plate, and (iii) spoon, each giving different patterns and droplet spectra. Similarly, the static spreader of E3 was modified (Figure 2f) with a concavity ranging from 20–60° to achieve a reduced wetted diameter (Figure 3d). Further, the teeth that are typical to the commercial version were removed from the design, as a smooth edge proves superior for reducing the droplet size distribution and improving the overall uniformity of the atomizer [25]. This was verified in the lab using strobe photography.
The modified emitters were evaluated in the lab by assessing spray coverage and wetted diameter on water-sensitive papers (WSPs). These preliminary lab trials indicated that the spoon-type swivel plate deflector and the static spreader with a 50° angle were suitable modifications to E1 and E3, respectively, to obtain the desired spray pattern. The modified emitters with a re-designed swivel plate and static spreader are hereafter termed as E2 (Figure 2c) and E4 (Figure 2d), respectively. The detailed specifications of the emitters are provided in Table 1. Four SSCDS treatments with emitters in a shower-down arrangement were developed using E1, E2, E3, and E4, hereafter termed as SD1, SD2, SD3, and SD4, respectively.

2.3. Experimental Site

The field experiment was conducted in a tall spindle architecture trained apple orchard (cv. WA38, root stock: M9-NIC29, planted in June 2013) (Figure 4) located at Roza research farm (46.29° N, 119.73° W), Washington State University, Prosser, WA. The orchard density was 4284 trees ha−1 with a row spacing of 3.0 m, a within row tree spacing of 0.8 m, and a mean tree height of 3.0 m.

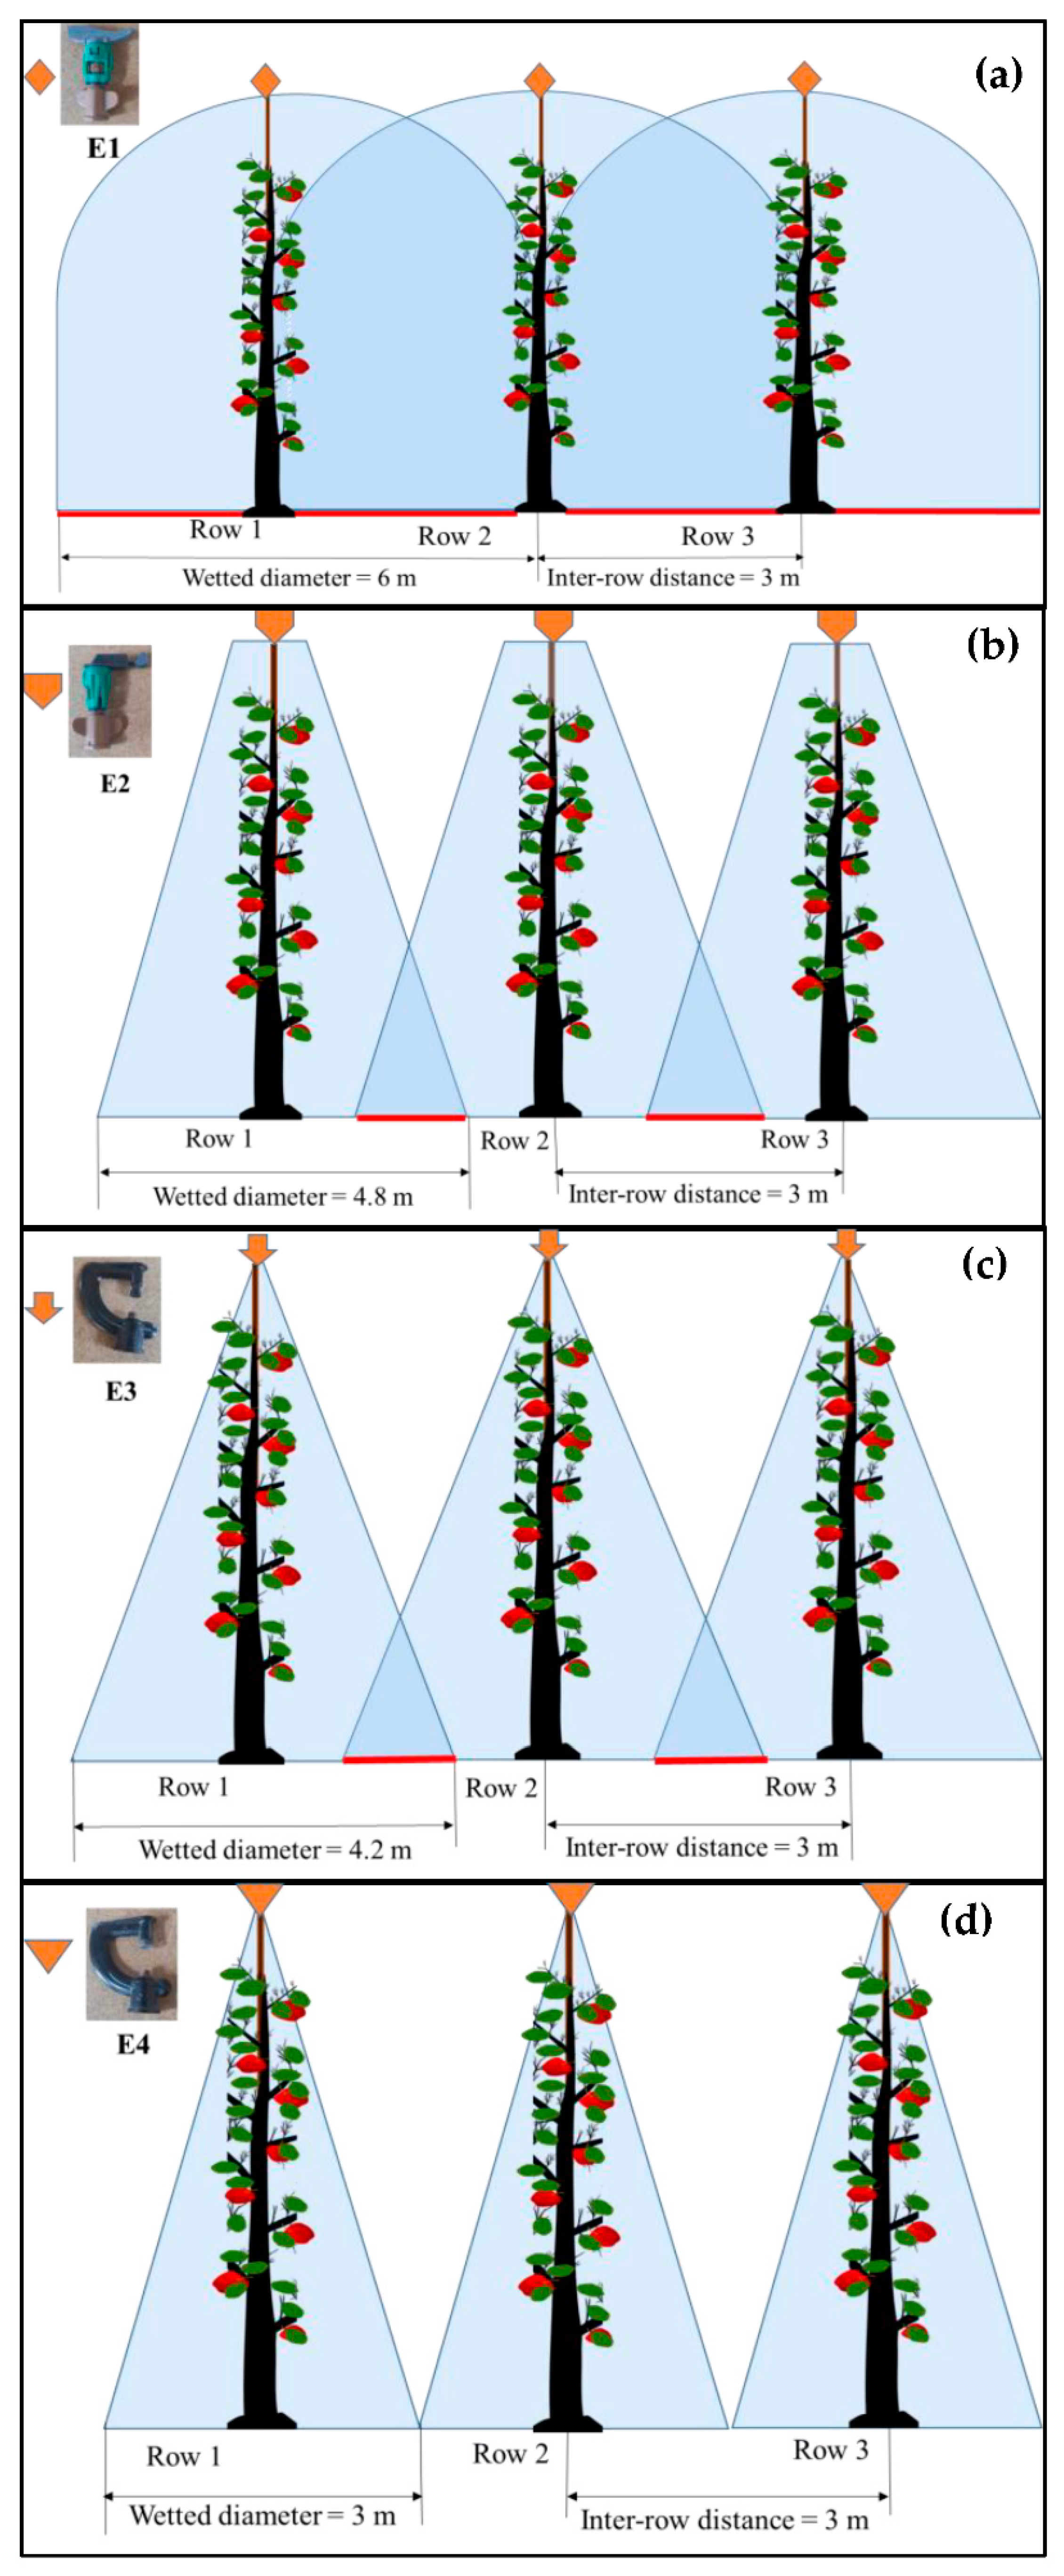
2.4. Experimental Design

The experiment was conducted using a randomized split-split-plot design. Four blocks with an 11 m row length with 11 trees per block were selected in the experimental orchard to install the SSCDS treatments (i.e., SD1–SD4). The SSCDS treatments were randomly assigned to the identified blocks. Moreover, a buffer of one block was maintained within the treatments to avoid cross-contamination of the samples (Owen-Smith et al., 2019) [10]. Three trees were randomly selected from each block, and the tree canopy was divided into three zones, namely top, mid, and bottom, to collect spray performance data (Figure 5a). In each canopy zone, two leaves were randomly selected, and mylar cards (5.1 × 5.1 cm, Stark Boards, CA) and water-sensitive paper samplers (WSPs) (2.5 × 2.5 cm, Syngenta Crop Protection Inc., Greensboro, NC, USA) were installed on the adaxial (upper side) and abaxial (underside) surfaces (Figure 5b,c). While the mylar cards were used to quantify the spray deposition, WSPs were used to quantify spray coverage. The spray deposition (ng cm−2) was defined as the amount of active ingredient (ng) deposited per unit area of the mylar card. Coverage was evaluated by assessing the percentage of the stained area caused by spray mix on WSPs. Subsamples were collected from the east and west sides of the canopy. The experimental trials were repeated three times (28 June, 1 July, and 3 July 2019) to generate replicates for the study. During each trial, the SSCDS treatments were reallocated to different treatment blocks to account for the variability in canopy vigor (Figure 6).

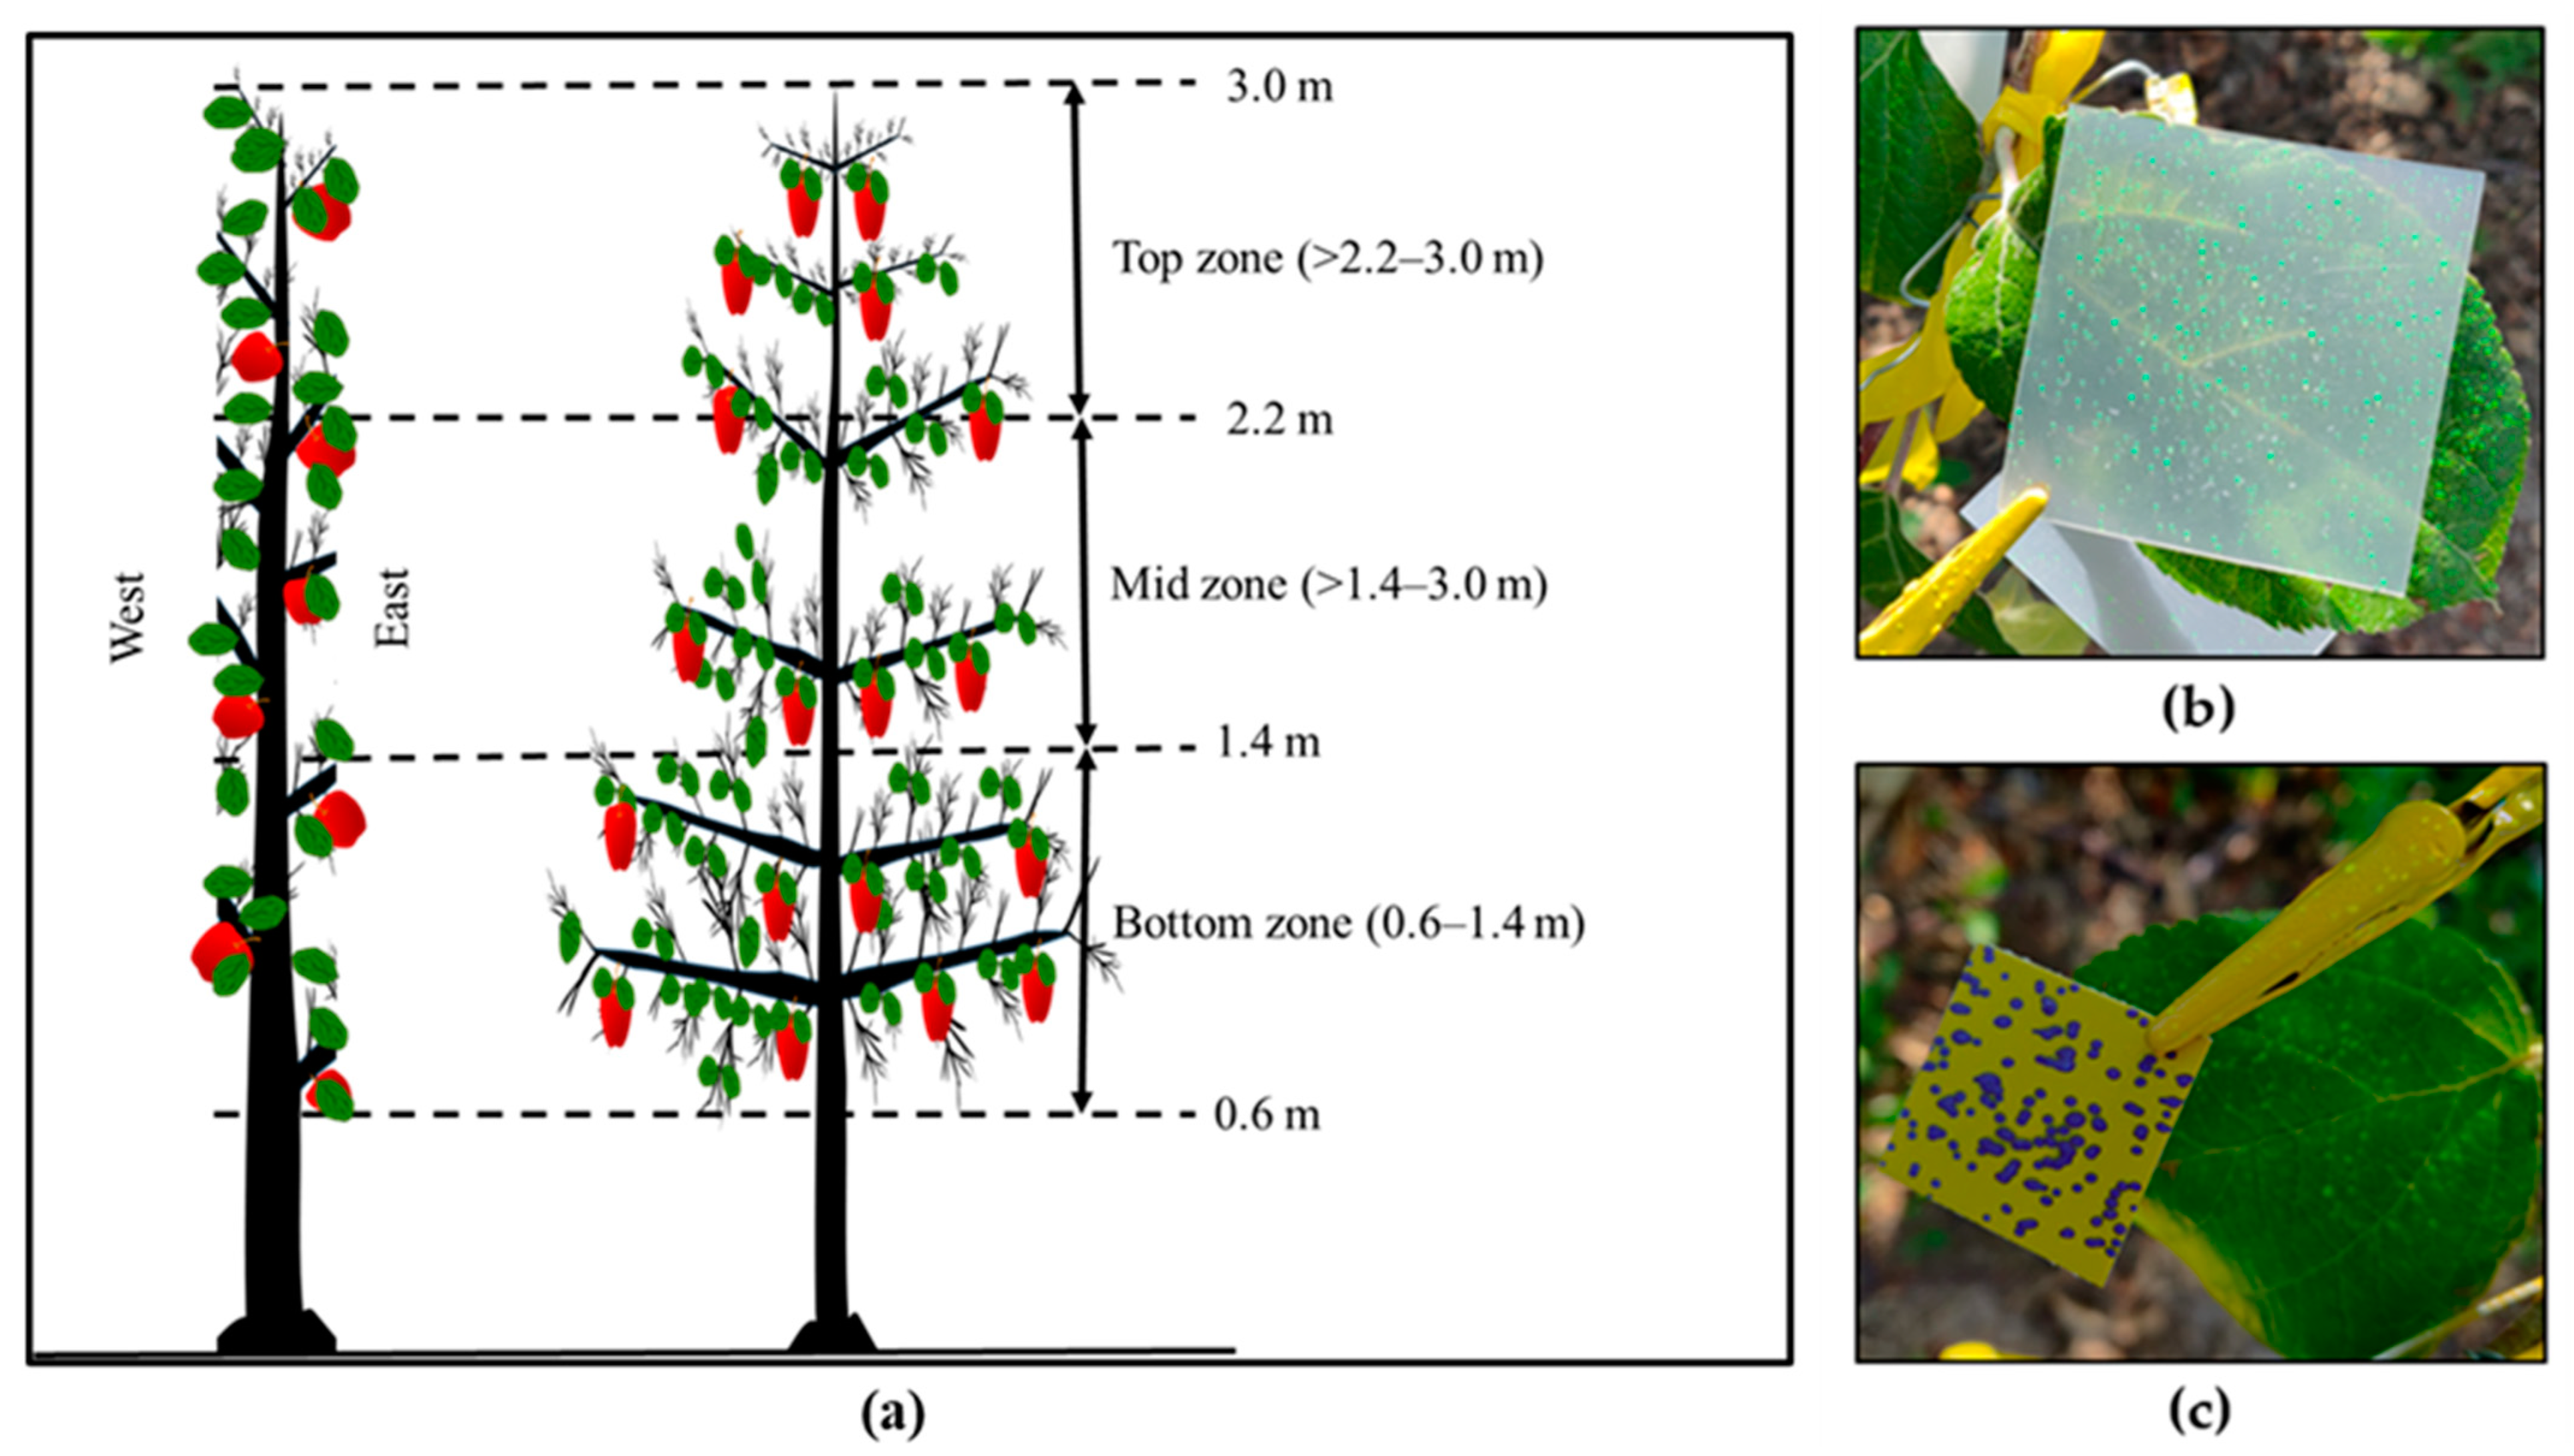
2.5. Data Collection Protocol

The spray droplet attributes of the selected emitters (E1, E2, E3, and E4) were first analyzed in the lab using a droplet size analyzer (Model: VisiSize 15, Oxford Lasers Ltd., Didcot, Oxon, UK) at a spraying pressure of 310 kPa. The obtained droplet sizes were categorized based on volume mean diameter (VMD) or DV 0.5 as per ASABE S-572.3 standard [26]. During the field trial, a 500 ppm spray mix of bio-degradable fluorescent tracer (Pyranine 10G, Keystone Inc., Chicago, IL, USA) was prepared in the water tank of the SSCDS applicator unit. The tank solutions were collected before (pre) and after (post) each trial in a 50 mL polypropylene centrifuge tube, and the tubes were capped and air-sealed. Each SSCDS treatment was operated for 15 s at 310 kPa to achieve an application rate of 702 L ha−1 (Sinha et al., 2020) [16].
The pressure data were acquired at 1.5 m and 22 m from the inlet port using a thin film pressure transducer (Model: 1502B81EZ100psiG, PCB Piezotronics Inc., Depew, NY, USA) and were logged at a frequency of 1 Hz using a data logger (Model: CR1000, Campbell Scientific, Logan, UT, USA). The samplers were left to dry for 15–20 min before collection. Nitrile gloves were used by the field crew to collect the samplers and avoid any contamination issues. The mylar cards were collected directly into labeled and air-sealed plastic bags to prevent contamination and kept in a cooler with ice packs. The collected samplers were later transferred to the lab and stored in a refrigerated chamber at a temperature of 1.7 °C until analyzed. The WSPs were collected and pasted on a labeled paper sheet and were kept in an envelope. These envelopes were stored in a dry place inside a plastic bag to avoid moisture exposure prior to analysis.

2.6. Meteorological Data

An all-in-one weather station (Model: ATMOS 41, METER Group, Inc., Pullman, WA, USA) was installed at a height of 1 m above the canopy to record in-field meteorological parameters (wind speed, wind direction, air temperature, and relative humidity) [27]. The data were logged at a frequency of 0.2 Hz using a data logger (Table 2).

2.7. Data Analysis

Fluorometry analysis was conducted on the collected mylar card samplers for deposition assessment [19]. The mylar card samplers were rinsed with 20 mL deionized (DI) water inside the plastic bag. Each mylar card was agitated on a mechanical shaker for 60 s for proper washing of tracer deposit and homogeneous mixing of the tracer in the solution. The rinsate was then poured into two 10 mL cylindrical cuvette, and the tracer concentration of the rinsate was measured with help of a fluorometer (Model: 10AU, Turner design, San Jose, CA, USA). The tracer concentrations for each of the cuvette were recorded twice by altering its placement inside the tube, and the normalized concentrations of both the cuvettes were averaged to evaluate the mean concentration of the sample rinsate. Moreover, 0.5 mL of tank sample was diluted in 100 mL of DI water, and collected tank samples were analyzed in a fluorometer to estimate the mean tank concentration for each trial. The tank ratio was calculated by normalizing each tank concentration with the highest tank concentration. Additionally, a calibration equation (Y = 0.986 × X; R2 = 0.99; Y and X are the actual and measured concentrations of standard solution, respectively) was developed for solutions of known concentrations. The calibration-corrected mylar card sampler concentration was multiplied by the rinse volume and tank ratio and then divided by the card surface area to evaluate spray deposition per unit area (ng cm−2) (hereafter termed as ‘deposition’). The collected WSPs were first scanned with an optical scanner (Model: Perfection V37, Seiko Epson Corporation, Suwa, Japan) with a 1200 dot-per-inch pixel density. A software program (GOTAS) [28] was then utilized to evaluate the spray coverage (%), an indicator of the percentage area covered by spray droplets onto the treated surface, by estimating the percentage area of the blue/purple stain on the WSP sampler [29] (hereafter termed as ‘coverage’).
Deposition and coverage data were statistically analyzed in RStudio (version: 3.4.1) [30]. The data were checked for their normality and were found to be positively skewed. Therefore, a cube-root transformation was applied to minimize data skewness. Deposition and coverage were analyzed using a 4 × 3 × 2 factorial analysis of variance (ANOVA), with treatment (SD1, SD2, SD3, and SD4), canopy zone (top, mid, and bottom), and leaf surface (adaxial and abaxial) as fixed factors. The analysis was conducted at a significance level of 5% to compare the mean spray deposition and coverage of the studied treatments. Additionally, a Tukey’s Honest Significance (HSD) post hoc test was conducted for multiple comparisons of mean deposition and coverage values.

3. Results and Discussion

3.1. Spray Droplet Attributes

The droplet spectrum analysis of selected emitters indicated that spray droplets associated with E1 and E3 were in the medium (VMD = 283 μm) and very fine (VMD = 130.9 μm) range, respectively (ASABE S-572.3) [26] (Table 3). The design modification in the swivel deflector of E1 resulted in a reduction in spray droplet size, and the modified emitter E2 had spray droplets in the fine category (VMD = 214.8 μm) (Table 3). Contrary to that, the modification in the static spreader of E3 increased the droplet size, and the modified emitter E4 had medium-sized droplets.

3.2. Spray Deposition

The ANOVA of spray deposition data indicated that there were significant differences in spray deposition among studied SSCDS treatments (F3108 = 7.0, p < 0.001), canopy zones (F2144 = 14.7, p < 0.001), and leaf surfaces (F1216 = 14.9, p < 0.001) as main effects. However, no significant interaction effect was reported among treatments, canopy zones, or leaf surfaces (Table 4). The spray deposition (mean ± standard error) of SD4 (1405.7 ± 156.4 ng cm−2) was the highest, followed by SD3 (734.3 ± 139.4 ng cm−2), SD2 (592.3 ± 68.0 ng cm−2), and SD1 (381.3 ± 37.9 ng cm−2) (Figure 7).
The results indicated that both modified emitter assemblies had higher overall mean depositions compared to the non-modified ones (Figure 7). Pertinent modifications in E1 emitters (with a spoon deflector) to fabricate E2 emitters helped reduce the wetted diameter of E1 emitters (6 m and 4.2 m, respectively). Similarly, the modification in the static spreader of E3 emitters to fabricate E4 emitters also reduced the wetted diameter of E3 emitters (4.2 m and 3.0 m, respectively). This reduction in wetted diameter, which confined the spray within the tree canopy, may have resulted in increased canopy deposition in SSCDS treatments with the modified emitters (e.g., E2 and E4) compared to the off-the-shelf (e.g., E1 and E3) ones.
Despite the high numerical difference in canopy spray deposition between SD1 and SD2, the difference was not significant at the 5% level, possibly because of high variability in deposition data. Such variability is very common in tree-fruit spray application scenarios [9,31] and can be minimized by increasing the number of replicates. As hypothesized, the modification brought to the swivel deflector in the E1 emitters and the static spreader in the E3 emitters enhanced the canopy deposition because of the confinement of the spray within the tree canopy. Additionally, treatments SD3 and SD4, retrofitted with static spreader-based emitters (E3 and E4, respectively), performed better than the SSCDS treatments SD1 and SD2, which had swivel deflector-based emitters (E1 and E2, respectively). The E1 and E2 emitters (with swivel deflectors) had comparatively larger wetted diameters (Table 1) and diffused spray patterns that would have resulted in lower canopy depositions of SD1 and SD2. Overall, SD4 treatment with the modified emitter E4 performed best, with the highest deposition among tested treatments, and may be a suitable emitter type for shower-down-configured SSCDS.

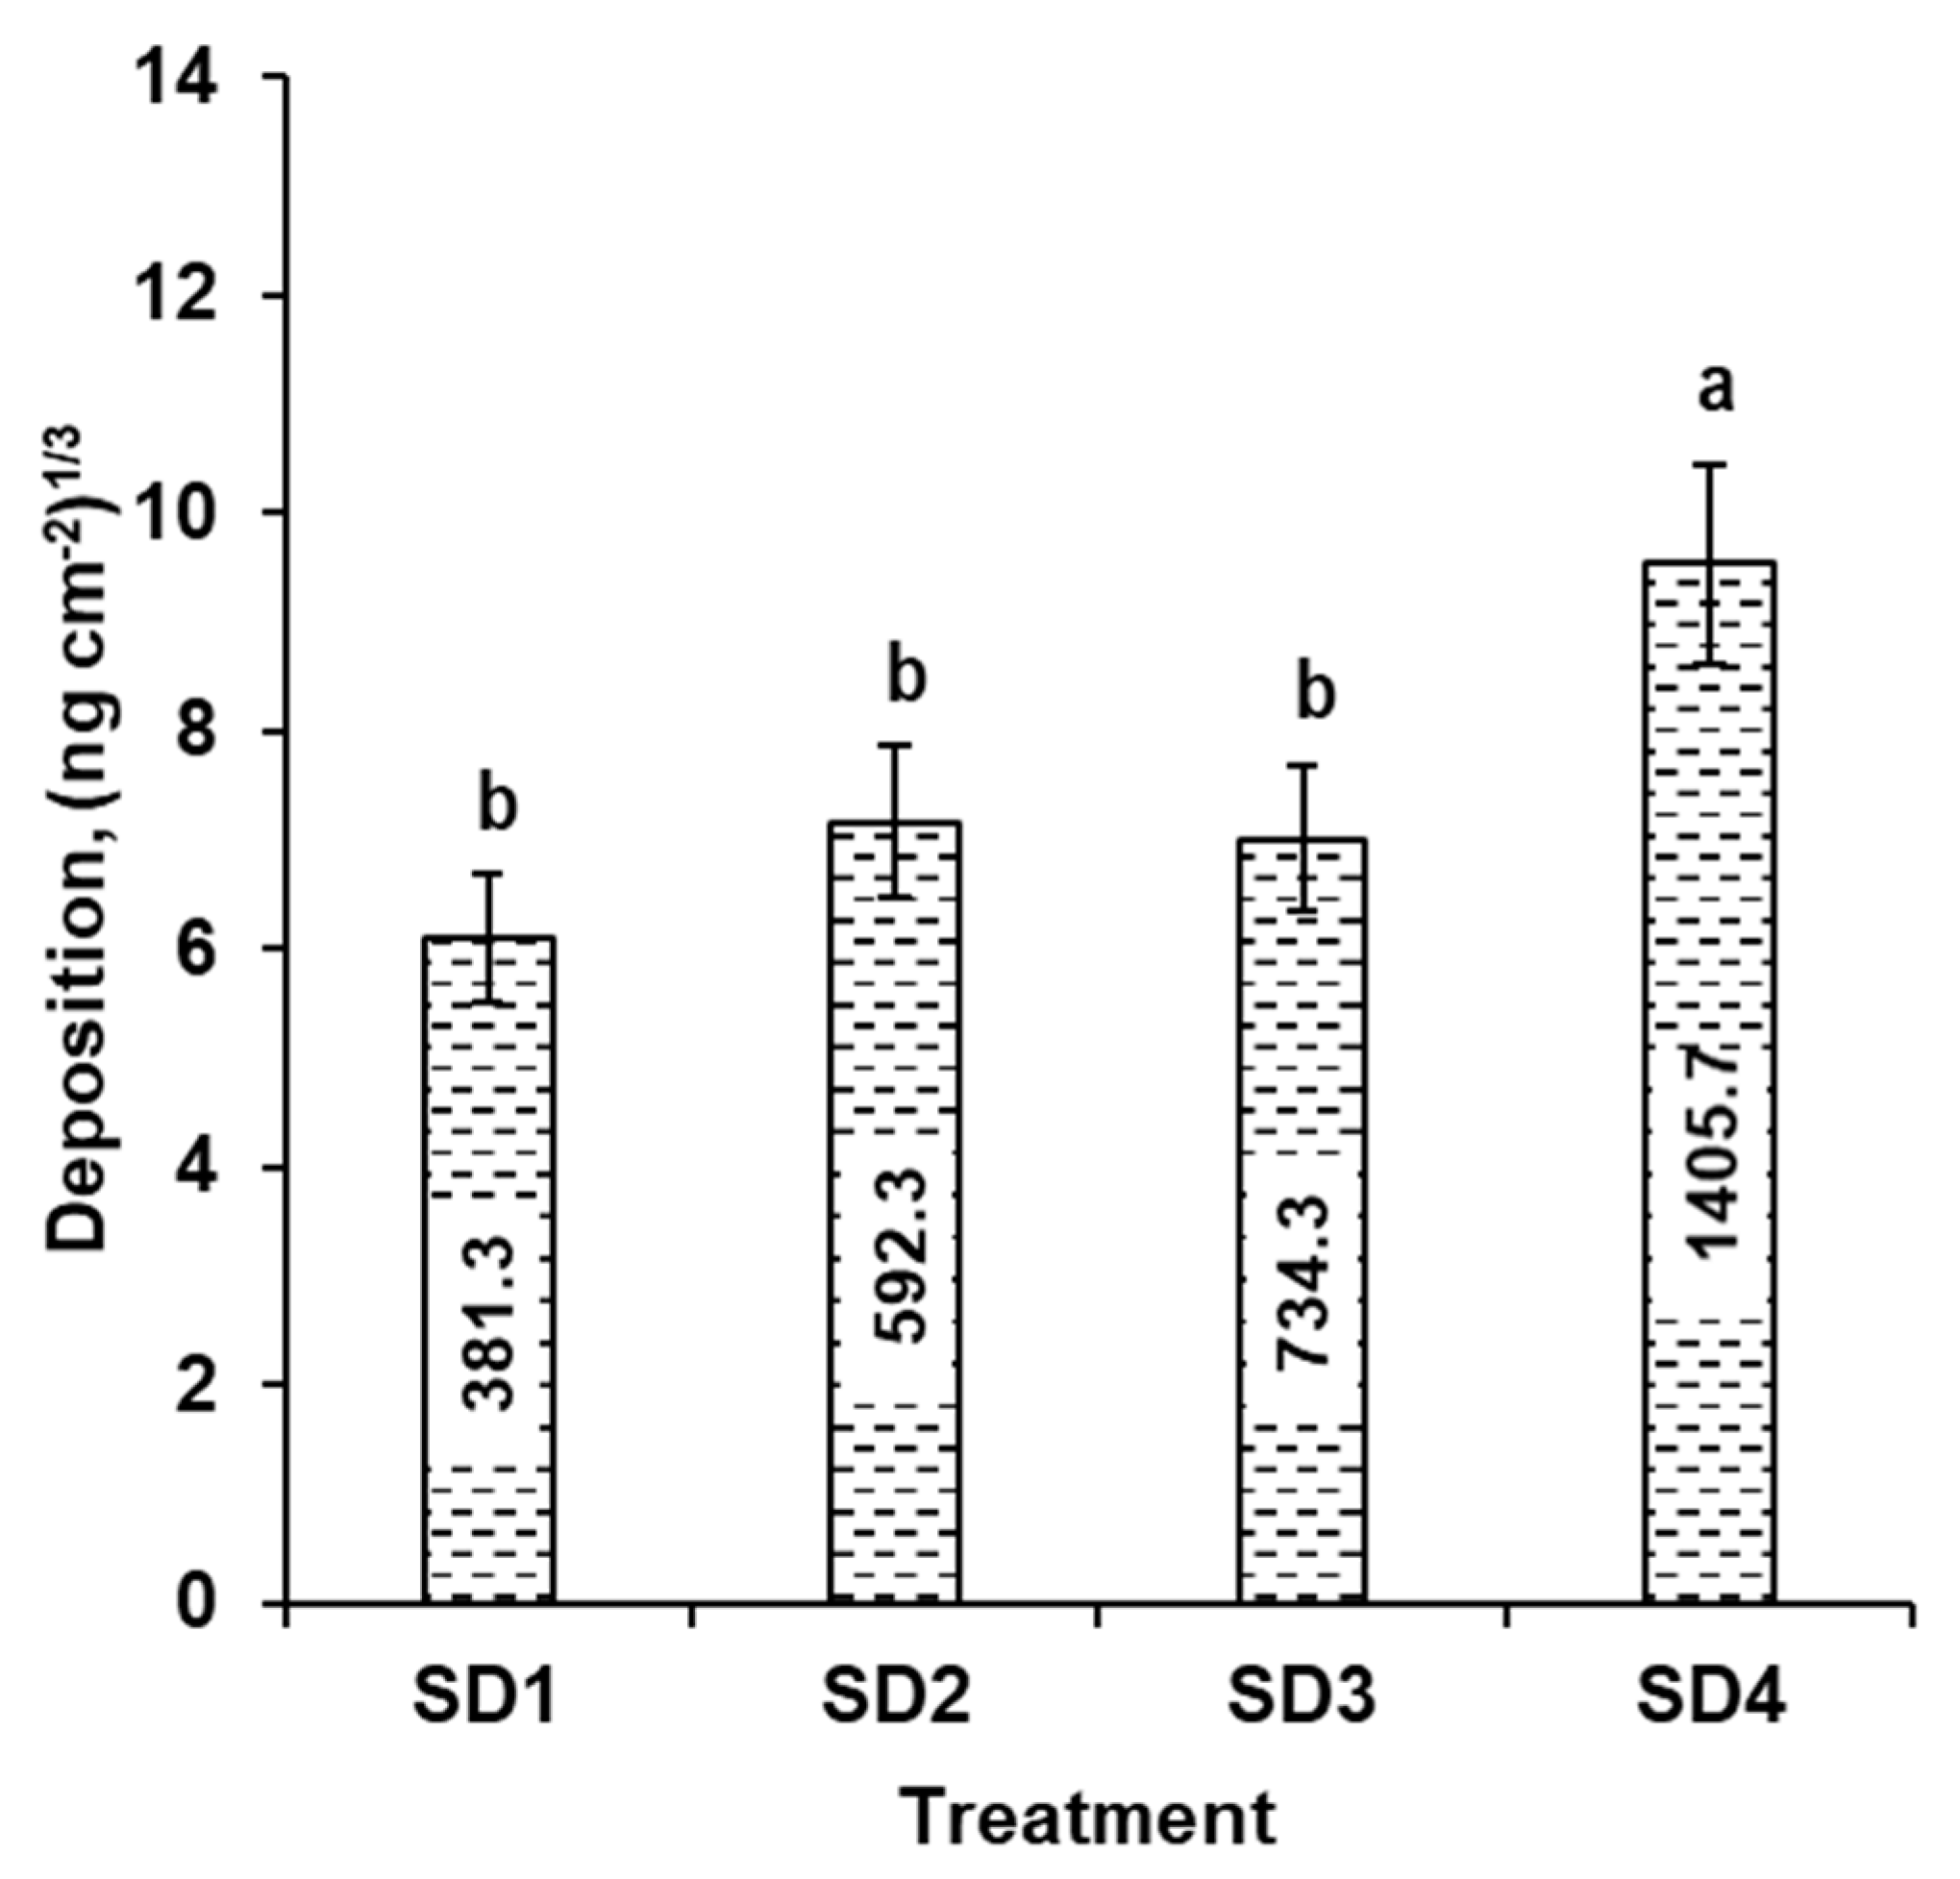
3.2.1. Effect of SSCDS Treatments and Canopy Zones on Deposition

ANOVA indicated a significant difference in spray deposition among the canopy zones regardless of the SSCDS treatments. For all four SSCDS treatments, the top canopy zone received the highest deposition, whereas the bottom zone received the least (p < 0.001) (Figure 8). However, no significant interaction effect was reported between the treatment and the canopy zone as main effects (Table 4). The highest mean canopy deposition was observed in the top canopy zone for SD4 (2199.8 ± 317.8 ng cm−2), followed by SD3 (1519.3 ± 373.2 ng cm−2). Moreover, the spray deposition in the bottom canopy zone for SD4 (895.6 ± 149.3 ng cm−2) was significantly lower than that in the top zone. The proximity of emitters to the top zone would have resulted in a higher deposition in this zone. Similar results were reported by Sinha et al. (2019) [9] and Sinha et al. (2020) [21] when evaluating SSCDS configurations in apple orchards and vineyards.
While the differences were non-significant, the modified emitters consistently provided higher spray deposition in different canopy zones. For example, the treatments SD2 and SD4 with the modified emitters had increases of about 61% and 193% in the bottom canopy deposition compared to respective SD1 and SD3 treatments with off-the-shelf emitters. Similarly, the corresponding increases in the mid-canopy deposition were about 57% and 105%, respectively (Figure 8). Overall, SD4 had the highest spray deposition in all the canopy zones. These results indicate that the proposed emitter assembly modifications may improve spray deposition in the lower canopy zones, which was not possible with the existing off-the-shelf emitters [16].

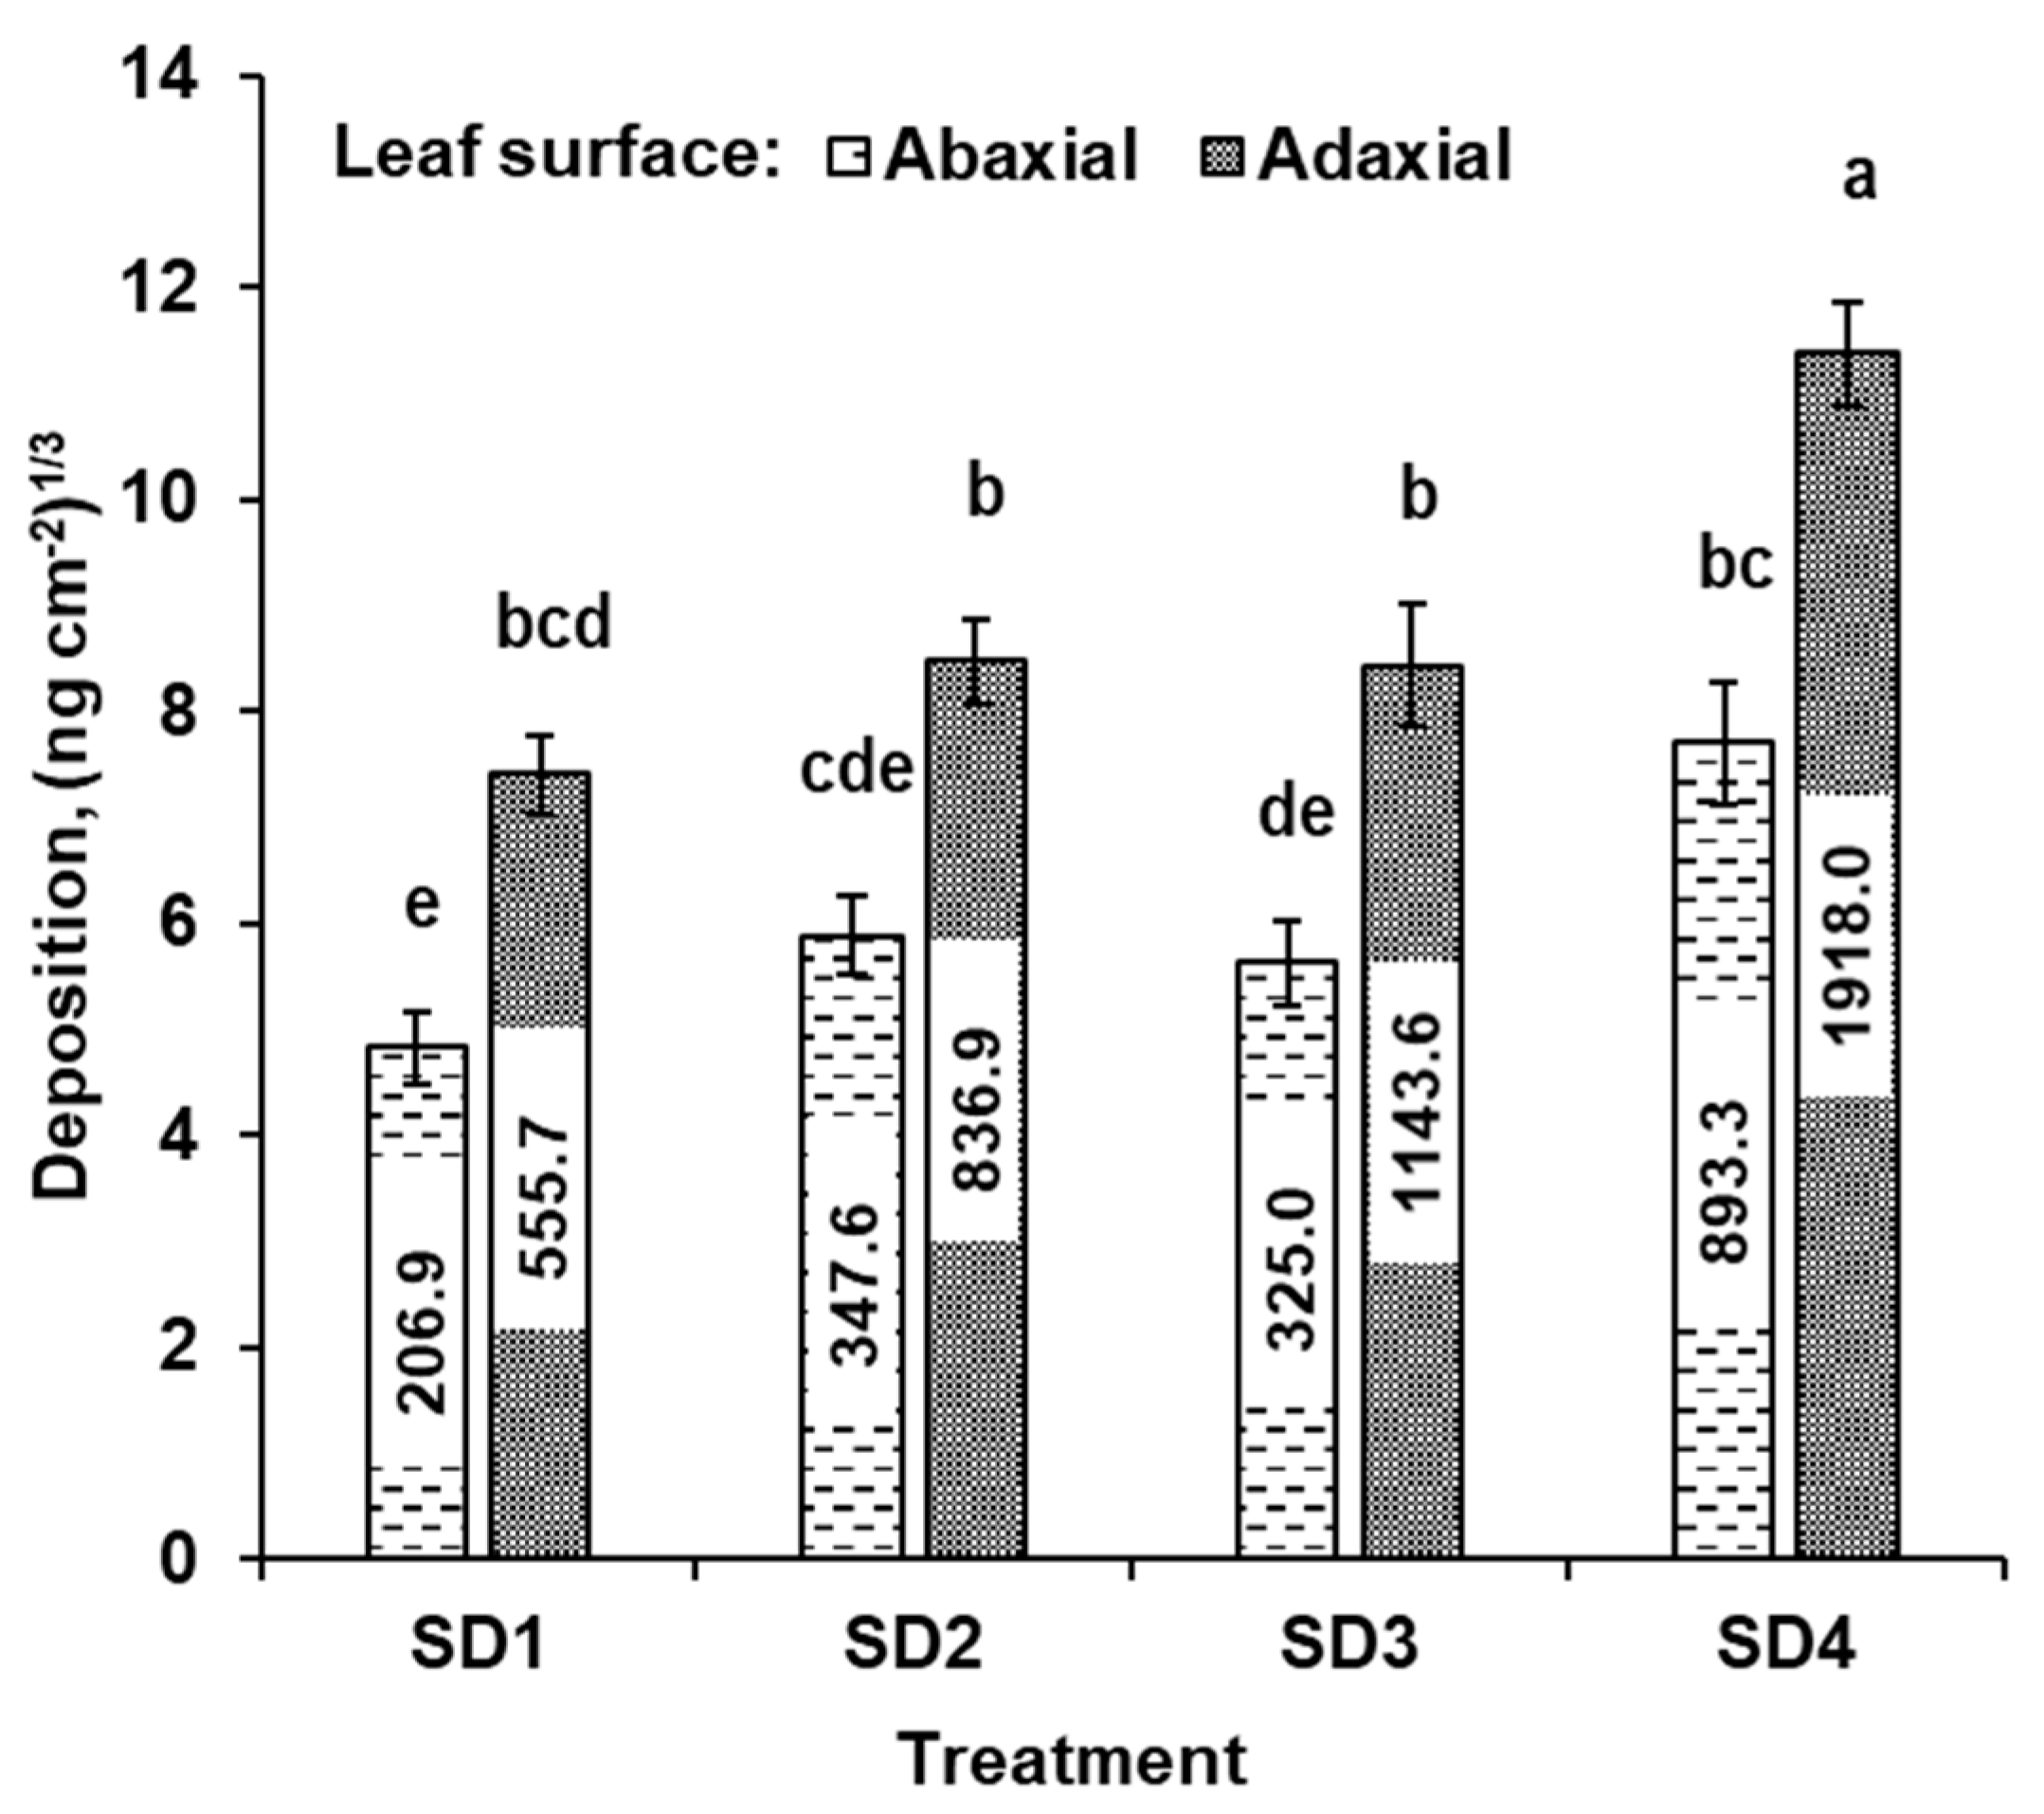
3.2.2. Effect of SSCDS Treatments and Leaf Surface on Deposition

The ANOVA of spray deposition data indicated that the spray deposition at the adaxial surface was significantly higher than that at the abaxial leaf surface (p < 0.001), regardless of the treatment main effect (Figure 9). However, no significant interaction effects were reported between SSCDS treatments and leaf surface as main effects (Table 4). The adaxial leaf surface deposition for SD4 (1918.0 ± 242.0 ng cm−2) was found to be the highest, followed by SD3 (1143.6 ± 260.9 ng cm−2), and the difference between them was statistically significant. Similarly, abaxial deposition of SD4 (893.3 ± 173.9 ng cm−2) was highest among the tested treatments, followed by SD2 (347.6 ± 57.3 ng cm−2); however, the difference was not significant at the 5% level.
Overall, the results suggest that the emitter modifications resulted in higher adaxial and abaxial spray deposition compared to off-the-shelf emitters. For instance, the adaxial leaf surface received 66% and 50% higher spray deposits while spraying with modified emitter integrated SSCDS treatments (SD2 and SD4, respectively) compared to respective non-modified treatments (SD1 and SD3). Similarly, increments of 68% and 157% were observed in abaxial spray deposition for corresponding modified treatments compared to non-modified emitter treatments. The modified emitters confined the spray within the canopy because of the reduced wetted diameter and would have resulted in improved adaxial and abaxial leaf surface deposition.
Overall, SD4 treatment performed the best, with the highest adaxial and abaxial surface deposition, and may be recommended for further studies. The emitter modifications can thus provide a radical solution to overcome the prior limitations related to existing SSCDS configurations, i.e., poor deposition on abaxial leaf surfaces. Moreover, a season-long biological efficacy assessment [10,11] of the modified SSCDS configuration with re-designed emitters could further assure the aptness of such a system for pest/insect management.

3.3. Spray Coverage

There were significant differences in the spray coverage (%) with reference to SSCDS treatments (F3108 = 3.9, p = 0.009), canopy zones (F2144 = 14.5, p < 0.001), and leaf surfaces (F1214 = 74.2, p < 0.001) as main effects (Table 5). However, there were no significant interactions between treatments, canopy zones, and leaf surfaces. The highest mean coverage was observed for SD4 (25.0 ± 3.1%), followed by SD3 (17.0 ± 2.7%), SD2 (13.0 ± 2.1%), and SD1 (10.7 ± 1.6%) (Figure 10).
Overall, similar to deposition trends, modified emitter-configured treatments had higher spray coverage compared to non-modified ones. The spray coverage of SD2 and SD4 retrofitted with modified emitters was 47% and 21% higher than that of the off-the-shelf emitter-configured SD1 and SD3 treatments, respectively. However, the difference in coverage among the modified and off-the-shelf emitter-configured treatments was not significant. This may be due to the high variability in coverage data, similar to the deposition data trends discussed in Section 3.2.
Among the modified treatments, SD4 achieved the highest canopy coverage. The modification in the static spreader that altered the spray droplet size from very fine to medium might be a reason for improved spray coverage for SD4. The medium size droplets are less susceptible to drift from the treated area compared to very fine droplets [32].

3.3.1. Effect of SSCDS Treatments and Canopy Zone on Coverage

There was a significant difference in canopy coverage among canopy zones, irrespective of SSCDS treatments (p < 0.001). However, there were no significant interaction effects among treatment and canopy zone as main effects (Table 5). The SD3 treatment-treated top canopy zone received the highest spray coverage (29.6 ± 5.6%), followed by SD4 (28.6 ± 5.5%). The bottom canopy coverage of SD4 (20.1 ± 5.0%) was the highest among the other treatments; however, the differences were statistically not significant at the 5% level (Figure 11).
These results indicate that the modification of emitters did not significantly affect the spray coverage in different canopy zones. However, the data trend indicated that spray coverage increased numerically in some of the canopy zones. For example, SD2 with E2 emitters had 27% and 31% higher coverage in the top- and mid-canopy zones, respectively, compared to SD1 with off-the-shelf emitters. While the top zone coverage in SD3 and SD4 was numerically similar, SD4 with modified E4 emitters had about 111% and 164% increases in mid and bottom zone coverage, respectively. Moreover, emitter modifications also resulted in higher coverage uniformity among the canopy zones for SD4 treatment. The coefficient of variation (CV) in spray coverage among the canopy zones for SD3 and SD4 treatments was 68.4% and 17.5%, respectively. The lower CV for SD4 indicates the uniform distribution of the spray mix among the canopy zones. Overall, treatment SD4 retrofitted with emitter E4, which has a modified static spreader, performed the best among the tested treatments and resulted in enhanced mid- and bottom-zone canopy coverage as well as uniform spray distribution among the canopy zones.

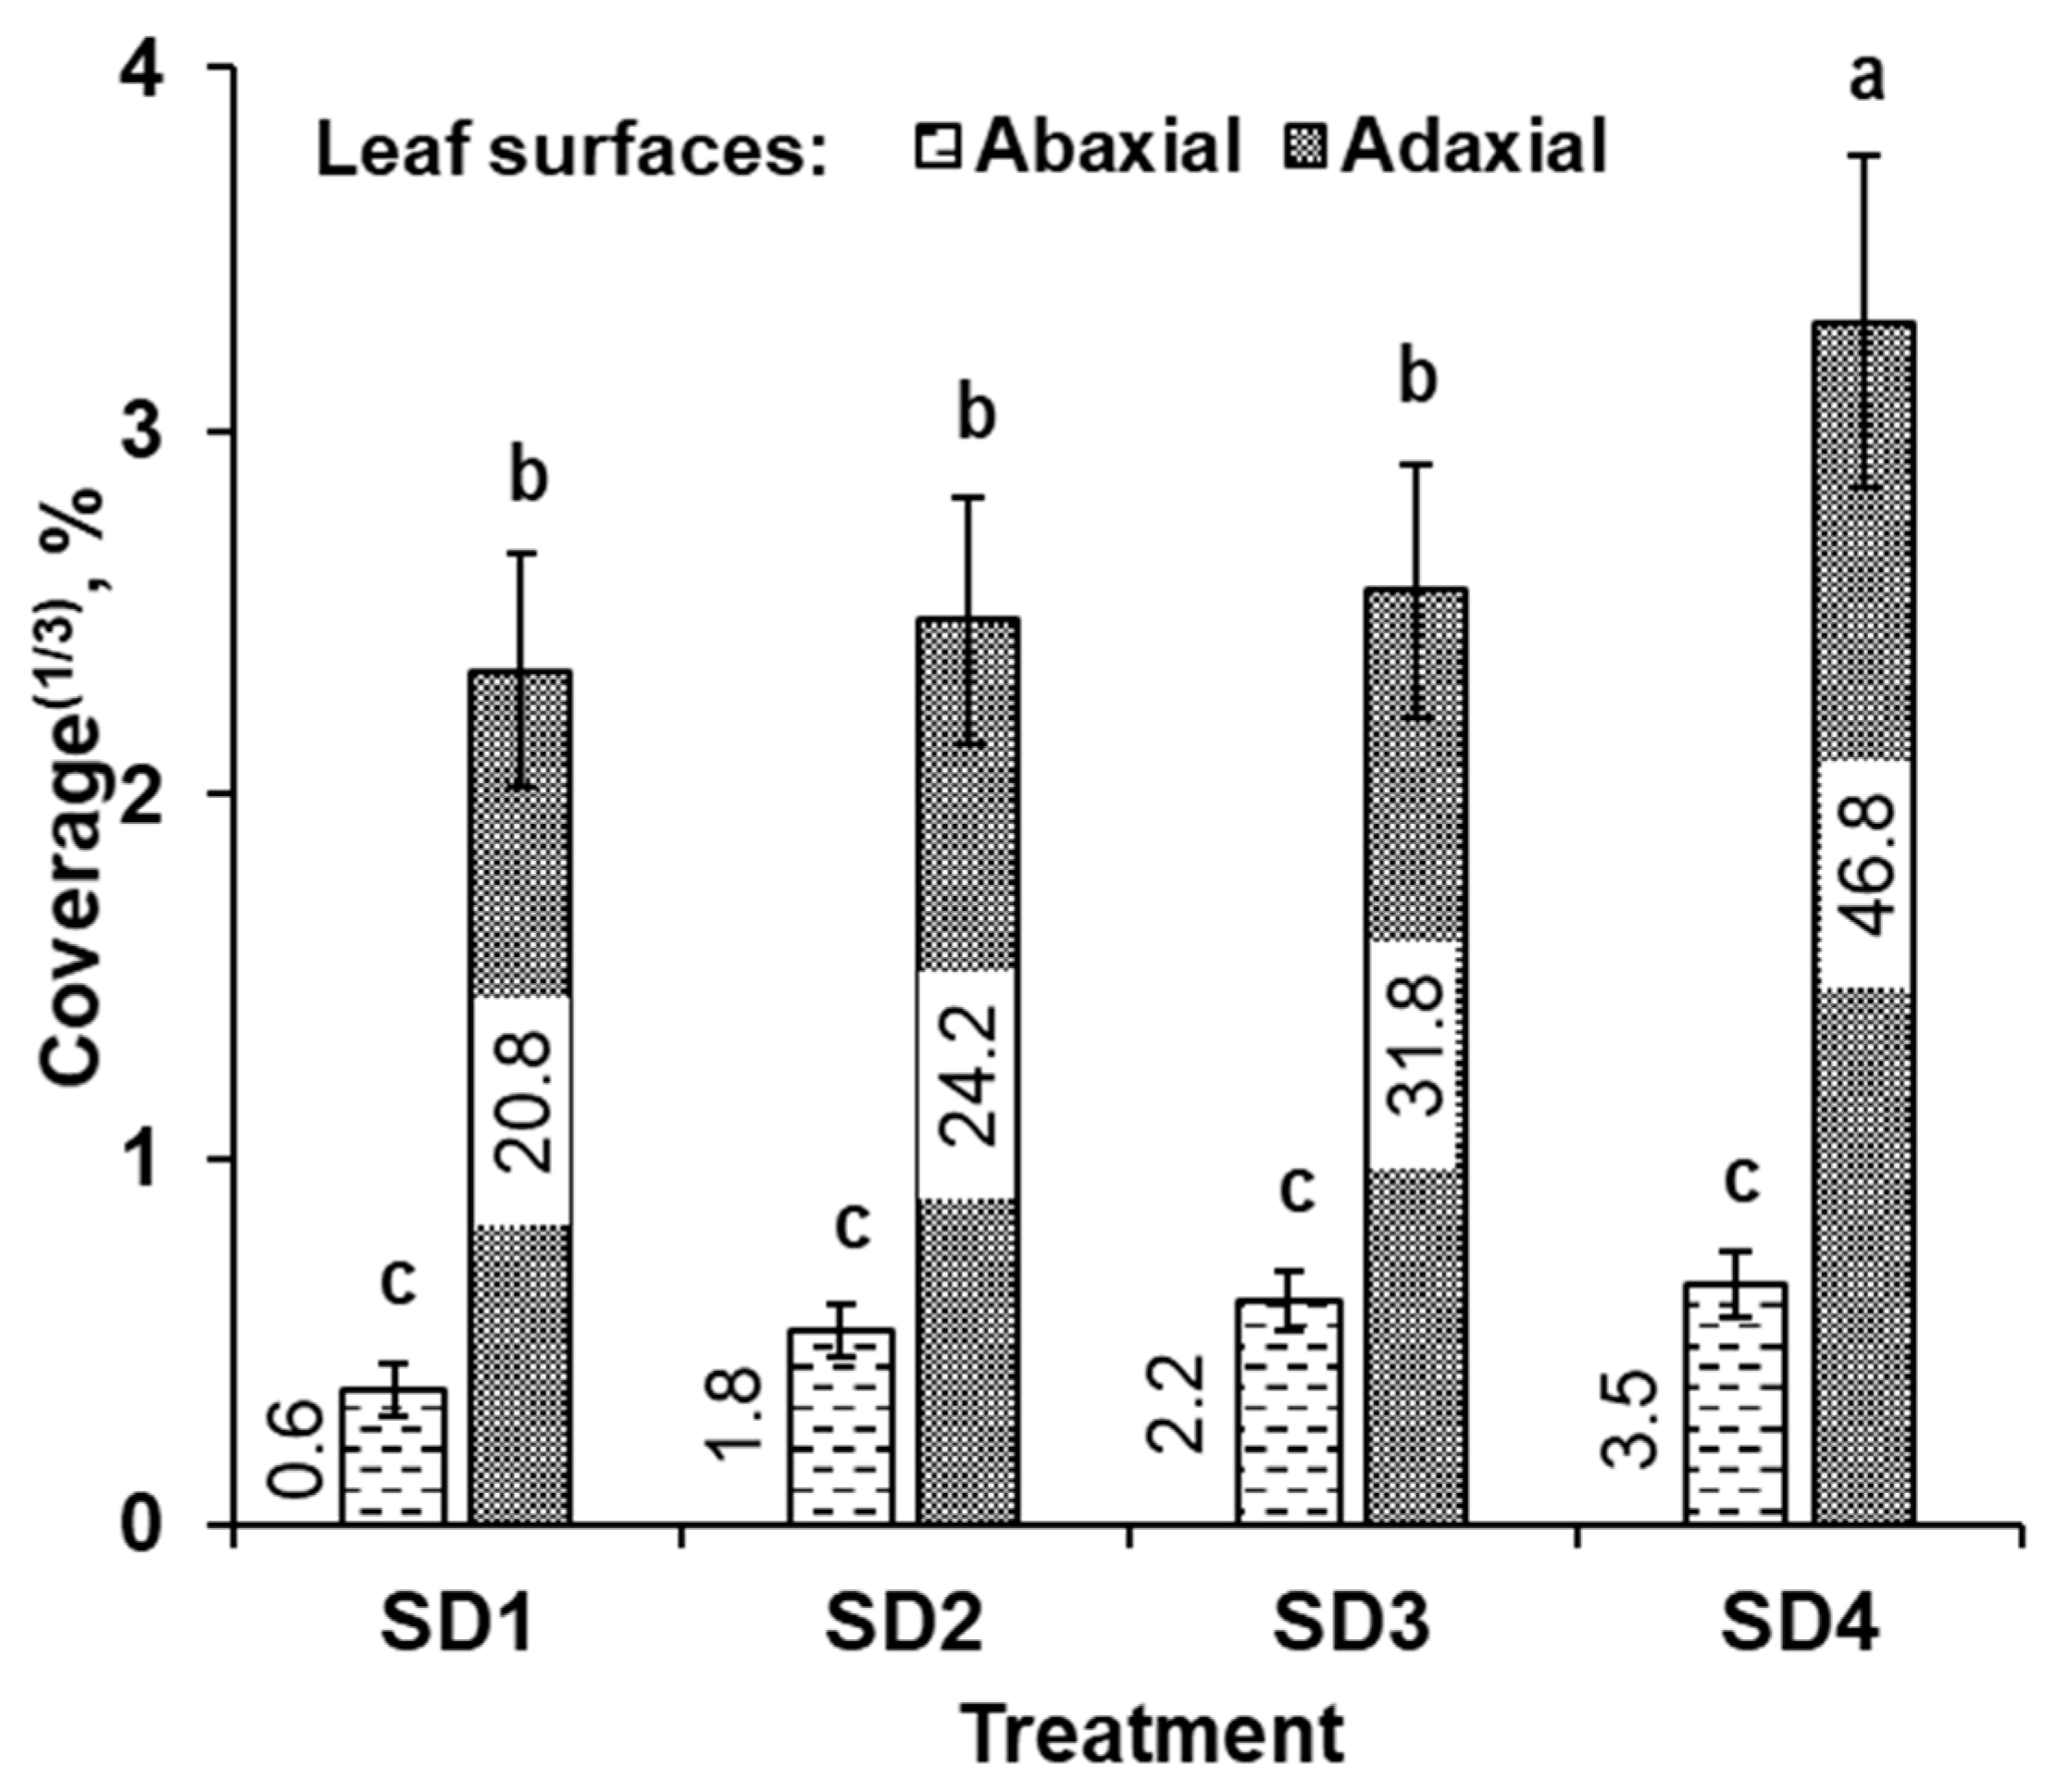
3.3.2. Effect of SSCDS Treatments and Leaf Surface on Coverage

The mean spray coverage of the adaxial leaf surface was significantly higher than that of the abaxial surface (p < 0.001) regardless of the SSCDS treatment. Moreover, a significant interaction effect was reported between SSCDS treatments and leaf surfaces (F3,54 = 3.4, p = 0.02) as a main effect (Table 5). The SD4 treatment had the highest adaxial and abaxial spray coverage (46.8 ± 4.3% and 3.5 ± 1.3%, respectively) followed by SD3 (31.8 ± 4.4% and 2.2 ± 1.0%, respectively). However, there were no significant differences in abaxial leaf surface coverage among the studied treatments (Figure 12).
Pertinent emitter modifications would have resulted in higher adaxial and abaxial leaf coverage. The SD2 and SD4 treatments had 16.3% and 47.2% higher adaxial leaf coverage compared to the respective SD1 and SD3 treatments. Contrasting abaxial leaf deposition (refer to Section 3.2.2) with corresponding spray coverage indicated a mismatch between the deposition and coverage data. It may be possible that spray particles were reaching the underside of the leaf in the form of a mist with particles smaller than the detection threshold of the water-sensitive papers. While such particles may not necessarily stain WSPs to provide quantifiable coverage data [9,33], the active ingredient they carry can be detected with highly sensitive fluorometry analysis [12]. The overlapping of droplets might be another factor that would have resulted in lower abaxial leaf surface coverage. Owen-Smith et al. (2019) [10,11], Sinha et al. (2020) [19], and Verpont et al. (2015) [34] reported a similar discrepancy between spray deposition and coverage for studies conducted on a fixed spray delivery system. The above results suggest that the adopted coverage analysis could merely give a rough idea of the spray distribution and may not be a quantitative parameter for spray assessments. Our future research, which will be focused on exploring the biological efficacy with optimal SSCDS configuration, shall provide further clarity on the contradicting trends of spray deposition and coverage.

4. Conclusions

The following are the conclusions of this study:
  • Pertinent modifications in the swivel deflector and static spreader of off-the-shelf micro-emitters considerably improved the spray performance of SSCDS configurations retrofitted with modified emitters.
  • SSCDS treatment with the modified emitters had improved canopy deposition and coverage compared to treatments with off-the-shelf emitters.
  • The treatment with modified emitters yielded improved deposition and coverage in the middle and bottom canopy zones as well as on the abaxial side of leaves.
  • SSCDS treatment SD4 utilizing E4 emitters with a static spreader with 50° concavity had the highest canopy deposition and coverage. The same configuration also resulted in relatively uniform spray distribution and coverage along the canopy zone and on both sides of the leaf. Therefore, we recommend further biological efficacy studies with SD4 prior to potential large-scale emplacements.

Author Contributions

L.R.K., R.R. and R.S. conceptualized this work and contributed to the experiment design. M.L. assisted in the design and fabrication of the modified micro-emitter. R.R., R.S., L.R.K. and G.-A.H. contributed to the field data collection. R.R. executed the data analysis and prepared the original draft of the manuscript. R.S., L.R.K., G.-A.H., M.J.G. and M.L. reviewed and revised the manuscript in the current form. All authors have read and agreed to the published version of the manuscript.

Funding

This project was funded by the USDA-NIFA Specialty Crop Research Initiative grant program and WNP0745.

Acknowledgments

This project was funded by the USDA-NIFA Specialty Crop Research Initiative grant program and WNP0745. The authors extend their gratitude to Karen Lewis and Bernardita Sallato for allowing the spray trial in their research block. Sincere thanks to Patrick Scharf and Linda Root for their technical and administrative support. We would also like to thank Abhilash Chandel, Jake Schrader, Anura Rathanayake, Ramesh Sahni, Margaret McCoy, Maia Bloom, and Jenni Suder for their assistance in data collection and analysis. Lastly, we would like to thank CJ Johnson at Application Insight, LLC for his extensive work and experimentation in the development of the modified emitters.

Conflicts of Interest

The authors declare no conflict of interest.

References

  1. Robinson, T.L. Effect of tree density and tree shape on light interception, tree growth, yield and economic performance of apples. Acta Hortic. 2007, 732, 405–414. [Google Scholar] [CrossRef]
  2. Grieshop, M.; Gut, L.; Wise, J.; Smith, P.O.; Sundin, G.; Flore, S.M.J.; Lang, G.; Perry, R. Development of solid set delivery systems for high density apples. NY Fruit Quart. 2015, 16–20. [Google Scholar]
  3. Cross, J.V.; Walklate, P.J.; Murray, R.A.; Richardson, G.M. Spray deposits and losses in different sized apple trees from axial fan orchard sprayers: 1. Effects of liquid flow rate. Crop Prot. 2001, 20, 13–30. [Google Scholar] [CrossRef]
  4. Cross, J.V.; Walklate, P.J.; Murray, R.A.; Richardson, G.M. Spray deposits and losses in different sized apple trees from axial fan orchard sprayers: 2. Effects of spray quality. Crop Prot. 2001, 20, 333–343. [Google Scholar] [CrossRef]
  5. Cross, J.V.; Walklate, P.J.; Murray, R.A.; Richardson, G.M. Spray deposits and losses in different sized apple trees from an axial fan orchard sprayer: 3. Effects of air volumetric flow rate. Crop Prot. 2003, 22, 381–394. [Google Scholar] [CrossRef]
  6. Grieshop, M.J.; Emling, J.; Ledebuhr, M. Re-envisioning agrichemical input delivery: Solid Set Delivery Systems for high density fruit production, Impacts on off-target deposition. In Proceedings of the 2018 ASABE Annual International Meeting, Detroit, MI, USA, 29 July–1 August 2018; p. 1. [Google Scholar]
  7. Klein, R.; Schulze, L.; Ogg, C. Factors Affecting Spray Drift of Pesticides. 2008. Available online: https://www.certifiedcropadviser.org/files/certifications/certified/education/self–study/exam–pdfs/119.pdf (accessed on 15 January 2020).
  8. Garcerá, C.; Moltó, E.; Chueca, P. Spray pesticide applications in Mediterranean citrus orchards: Canopy deposition and off-target losses. Sci. Total Environ. 2017, 599, 1344–1362. [Google Scholar] [CrossRef]
  9. Sinha, R.; Khot, L.R.; Hoheisel, G.A.; Grieshop, M.J.; Bahlol, H. Feasibility of a Solid set canopy delivery system for efficient agrochemical delivery in vertical shoot position trained vineyards. Biosyst. Eng. 2019, 179, 59–70. [Google Scholar] [CrossRef]
  10. Owen-Smith, P.; Wise, J.; Grieshop, M.J. Season Long Pest Management Efficacy and Spray Characteristics of a Solid Set Canopy Delivery System in High Density Apples. Insects 2019, 10, 193. [Google Scholar] [CrossRef] [Green Version]
  11. Owen-Smith, P.; Perry, R.; Wise, J.; Jamil, R.Z.R.; Gut, L.; Sundin, G.; Grieshop, M.J. Spray coverage and pest management efficacy of a solid set canopy delivery system in high density apples. Pest Manag. Sci. 2019, 75, 3050–3059. [Google Scholar] [CrossRef]
  12. Sinha, R.; Ranjan, R.; Khot, L.R.; Hoheisel, G.A.; Grieshop, M.J. Drift potential from a solid set canopy delivery system and an axial–fan air–assisted sprayer during applications in grapevines. Biosyst. Eng. 2019, 188, 207–216. [Google Scholar] [CrossRef]
  13. Carpenter, T.G.; Reichard, D.L.; Wilson, S.M. Design and feasibility of a permanent pesticide application system for orchards. Trans. ASABE 1985, 28, 350–355. [Google Scholar] [CrossRef]
  14. Agnello, A.M.; Landers, A.J. Current progress in development of a fixed spray pesticide application system for high-density apple plantings. NY Fruit Quart. 2006, 14, 22–26. [Google Scholar]
  15. Panneton, B.; Piche, M.; Philion, V.; Chouinard, G. Leaf deposition with fixed sprinklers, low drift emitters and conventional emitters in apple orchard. ASABE 2011, 11, 1110798. [Google Scholar] [CrossRef]
  16. Sinha, R.; Khot, L.R.; Hoheisel, G.A.; Grieshop, M.J. Field Performance of a Solid Set Canopy Delivery System Configured for High-Density Tall Spindle Architecture Trained Apple Canopies. Trans. ASABE 2021, 64, 1735–1745. [Google Scholar] [CrossRef]
  17. Niemann, S.M.; Whiting, M.D. Spray coverage in apple and cherry orchards using a solid set canopy delivery system. In Proceedings of the XXIX International Horticultural Congress on Horticulture: Sustaining Lives, Livelihoods and Landscapes (IHC2014), Brisbane, Australia, 25 November 2014; Volume 1130, pp. 647–654. [Google Scholar]
  18. Sharda, A.; Karkee, M.; Hoheisel, G.; Zhang, Q.; Mangus, D. Design and Evaluation of Solid Set Canopy Delivery System for Spray Application in High-density Apple Orchards. Appl. Eng. Agric. 2019, 35, 751–757. [Google Scholar] [CrossRef]
  19. Sinha, R.; Ranjan, R.; Khot, L.R.; Hoheisel, G.A.; Grieshop, M.J. Comparison of within canopy deposition for a solid set canopy delivery system (SSCDS) and an axial–fan airblast sprayer in a vineyard. Crop Prot. 2020, 132, 105124. [Google Scholar] [CrossRef]
  20. Sinha, R.; Ranjan, R.; Shi, G.; Hoheisel, G.A.; Grieshop, M.; Khot, L.R. Solid set canopy delivery system for efficient agrochemical delivery in modern architecture apple and grapevine canopies. Acta Hortic. 2020, 1269, 277–286. [Google Scholar] [CrossRef]
  21. Sinha, R.; Ranjan, R.; Khot, L.R.; Hoheisel, G.A.; Grieshop, M.J. Development and performance evaluation of a pneumatic spray delivery based solid set canopy delivery system for spray application in a high–density apple orchard. Trans. ASABE 2020, 63, 37–48. [Google Scholar] [CrossRef]
  22. Ranjan, R.; Shi, G.; Sinha, R.; Khot, L.R.; Hoheisel, G.A.; Grieshop, M.J. Automated Solid Set Canopy Delivery System for Large-Scale Spray Applications in Perennial Specialty Crops. Trans. ASABE 2019, 62, 585–592. [Google Scholar] [CrossRef]
  23. Sharda, A.; Karkee, M.; Zhang, Q.; Ewlanow, I.; Adameit, U.; Brunner, J. Effect of emitter type and mounting configuration on spray coverage for solid set canopy delivery system. Comput. Electron. Agric. 2015, 112, 184–192. [Google Scholar] [CrossRef]
  24. Ranjan, R.; Sinha, R.; Khot, L.R.; Hoheisel, G.A.; Grieshop, M.; Ledebuhr, M. Spatial Distribution of Spray from a Solid Set Canopy Delivery System in a High-Density Apple Orchard Retrofitted with Modified Emitters. Appl. Sci. 2021, 11, 709. [Google Scholar] [CrossRef]
  25. Lefebvre, A.H.; McDonell, V.G. Atomization and Sprays; CRC Press: Boca Raton, FL, USA, 2017. [Google Scholar]
  26. ASABE S572.3. Spray Nozzle Classification by Droplet Spectra; ASABE: St. Joseph, MI, USA, 2020. [Google Scholar]
  27. ISO 22522:2007. Crop Protection Equipment—Field Measurement of Spray Distribution in Tree and Bush Crops; ISO: Geneva, Switzerland, 2007. [Google Scholar]
  28. Chaim, A.; Pessoa, M.C.P.Y.; Camargo Neto, J.; Hermes, L.C. Comparison of microscopic method and computational program for pesticide deposition evaluation of spraying. Pesqui. Agropecu. Bras. 2002, 37, 493–496. [Google Scholar] [CrossRef]
  29. Nansen, C.; Ferguson, J.C.; Moore, J.; Groves, L.; Emery, R.; Garel, N.; Hewitt, A. Optimizing pesticide spray coverage using a novel web and smartphone tool, SnapCard. Agron. Sustain. Dev. 2015, 35, 1075–1085. [Google Scholar] [CrossRef]
  30. R Studio, R Core Team. R: A language and Environment for Statistical Computing; R Foundation for Statistical Computing: Vienna, Austria, 2020; Available online: https://www.R-project.org/ (accessed on 10 January 2020).
  31. Koch, H.; Weisser, P. Sensor equipped orchard spraying–efficacy, savings and drift reduction. Aspect Appl. Biol. 2000, 57, 357–362. [Google Scholar]
  32. Hilz, E.; Vermeer, A.W. Spray drift review: The extent to which a formulation can contribute to spray drift reduction. Crop Prot. 2013, 44, 75–83. [Google Scholar] [CrossRef]
  33. Martin, D.E. A fluorescent imaging technique for quantifying spray deposits on plant leaves. At. Sprays 2014, 24, 367–373. [Google Scholar] [CrossRef] [Green Version]
  34. Verpont, F.; Favareille, J.; Zavagli, F. Fixed spraying system: A future potential way to apply pesticides in an apple orchard? Julius-Kühn-Archiv 2015, 448, 53. [Google Scholar]
Figure 1. The solid set canopy delivery system configured in a shower-down arrangement that creates (a) a shower-down effect in the canopy with (b) an applicator consisting of pump, air-compressor, and spray tank and (c) the solid set spray delivery system connected in a close loop with applicator.
Sustainability 13 13248 g001
Figure 2. Off-the-shelf emitters (a) E1 and (b) E3 and modified emitters (c) E2 with (e) spoon type swivel deflector and (d) E4 with (f) static spreader of 50° deflection angle and smooth edge (all schematic dimensions are in mm).
Sustainability 13 13248 g002
Figure 3. Schematics (not drawn to scale) for effective wetted diameter of the off-the-shelf emitters (a) E1 and (c) E3, and the modified emitters (b) E2 and (d) E4. Area highlighted in red shows the overlap of wetted diameters pertinent to different emitter types.
Sustainability 13 13248 g003
Figure 4. Experimental site: high-density apple orchard trained in tall spindle architecture and installed with hydraulic spray delivery based solid set canopy delivery system configured in shower-down configuration (growth stage: full canopy; SSCDS configuration: SD4; imaged: 3 July 2019).
Sustainability 13 13248 g004
Figure 5. Depiction of allocated (a) canopy sampling zones, (b) mylar card, and (c) WSP samplers installed in each of the sampling zones for deposition and coverage evaluation (All dimensions are refereed above ground level).
Sustainability 13 13248 g005
Figure 6. The allocated SSCDS treatments (SD1, SD2, SD3, and SD4) for different trials (Trial 1: 28 June 2019; Trial 2: 1 July 2019; Trial 3: 3 July 2019; schematic is not drawn to the scale; N represents the true north direction).
Sustainability 13 13248 g006
Figure 7. Cube root-transformed mean spray deposition (ng cm−2) for different SSCDS treatments (SD1, SD2, SD3, and SD4). Different lowercase letters above individual bar plots indicate significant differences in transformed mean at α = 0.05, and associated error bars indicate standard error; non-transformed mean deposition (ng cm−2) values are indicated within the transformed bar plots.
Sustainability 13 13248 g007
Figure 8. Cube root-transformed mean spray deposition evaluated in different canopy zones for various SSCDS treatments (SD1, SD2, SD3, and SD4). Different lowercase letters above individual bar plots indicate the significant differences in transformed mean at α = 0.05, and associated error bars indicate standard error; non-transformed mean deposition (ng cm−2) values are indicated within the transformed bar plots.
Sustainability 13 13248 g008
Figure 9. Cube root-transformed mean spray deposition evaluated at abaxial (lower) and adaxial (upper) leaf surfaces for tested SSCDS treatments (SD1, SD2, SD3, and SD4). Different lowercase letters above individual bar plots indicate the significant differences in transformed mean at α = 0.05, and associated error bars indicate standard error; non-transformed mean deposition (ng cm−2) values are indicated within the transformed bar plots.
Sustainability 13 13248 g009
Figure 10. The cube root-transformed mean spray coverage (%) obtained for tested SSCDS treatments (SD1, SD2, SD3, and SD4). Different lowercase letters above individual bar plots indicate the significant differences in transformed mean at α = 0.05, and associated error bars indicate standard error; non-transformed mean coverage (%) values are indicated within the transformed bar plots.
Sustainability 13 13248 g010
Figure 11. The cube root transformed mean spray coverage (%) obtained at canopy zones (top, mid, bottom) for different SSCDS treatments (SD1, SD2, SD3, and SD4). Different lowercase letters above individual bar plots indicate the significant differences in transformed mean at α = 0.05 and associated error bars indicate standard error; non-transformed mean coverage (%) values have been indicated within the transformed bar plots.
Sustainability 13 13248 g011
Figure 12. The mean spray coverage (%) (Based on cube root transformation) obtained at leaf surface (abaxial and adaxial) for different SSCDS treatments (SD1, SD2, SD3, and SD4). Different lowercase letters above individual bar plots indicate the significant differences in transformed mean at α = 0.05 and associated error bars indicate standard error; non-transformed mean coverage (%) values have been indicated within/beside the transformed bar plots.
Sustainability 13 13248 g012
Table 1. The specification of micro-emitters tested with SSCDS variants.
EmitterModel $Flow Rate (L min−1) *Wetted Diameter (m) #SSCDS Treatment
E1Green Spin0.96.0SD1
E2Modified0.94.8SD2
E3Modular0.94.2SD3
E4Modified0.93.0SD4
$ Manufacturer: Jain® Irrigation Inc. with full-circle spray pattern. * Flow rate reported at an application pressure of 310 kPa. # Reported wetted diameter for emitter installed in shower-down configuration at a height of 3.9 m AGL.
Table 2. Weather parameters (means ± standard error) recorded during field data collection for tested treatments.
DateWeather ParameterSSCDS Treatment
SD1SD2SD3SD4
28 June 2019Wind speed (m s−1)0.63 ± 0.10.24 ± 0.00.4 ± 0.10.3 ± 0.1
Wind direction (°) *64.5 ± 3.6322.5 ± 25.4218.3 ± 20.4190.1 ± 19.2
Air temperature (°C)11.9 ± 0.214.6 ± 0.013.1 ± 0.212.8 ± 0.16
Relative humidity0.7 ± 0.00.6 ± 0.00.7 ± 0.00.7 ± 0.01
1 July 2019Wind speed (m s−1)0.8 ± 0.20.9 ± 0.30.7 ± 0.31.1 ± 0.2
Wind direction (°) *243.6 ± 19.0249.9 ± 10.9245.1 ± 13.4227.8 ± 13.4
Air temperature (°C)19.8 ± 0.215.5 ± 0.219.3 ± 0.218.4 ± 0.1
Relative humidity0.6 ± 0.00.6 ± 0.00.6 ± 0.00.6 ± 0.0
3 July 2019Wind speed (m s−1)0.7 ± 0.11.8 ± 0.40.8 ± 0.21.0 ± 0.2
Wind direction (°) *233.7 ± 15.3248.3 ± 14.1190.1 ± 6.6222.7 ± 14.4
Air temperature (°C)15.2 ± 0.116.1 ± 0.114.5 ± 0.115.9 ± 0.2
Relative humidity0.7 ± 0.00.6 ± 0.00.7 ± 0.00.6 ± 0.0
* Reported with reference to true north and orchard rows were in north-south oriented.
Table 3. Droplet size distribution for different emitters used in the study.
EmitterTreatmentVolume Percentile-Based Diameter (μm)Category *
DV0.1DV0.5DV0.9
E1SD1186.8283.0532.2Medium
E2SD2119.3214.8699.3Fine
E3SD372.5130.9360.1Very fine
E4SD4134.6256.2416.8Medium
* Droplet size categorized as per standard ASABE S-572.3 [26] based on DV0.5 (VMD) values.
Table 4. ANOVA summary for cube root-transformed deposition data (ng cm−2).
VariablesDfMSFp
Main plot
Block142.49
Treatment355.257<0.001
Error(a)3193.80
Canopy zone2116.1014.7<0.001
Leaf surface1117.6014.9<0.001
Treatment × Canopy zone69.721.20.29
Treatment × Leaf surface315.401.90.12
Canopy zone × Leaf surface217.402.20.11
Treatment × Canopy zone × Leaf surface615.501.970.07
Error(b)3847.89
Table 5. ANOVA summary for cube root-transformed spray coverage data.
VariablesDfMSFp
Main plot
Block10.13
Treatment33.33.90.009
Error(a)38.5
Canopy zone212.214.5<0.001
Leaf surface162.574.2<0.001
Treatment × Canopy zone61.51.70.11
Treatment × Leaf surface32.93.40.02
Canopy zone × Leaf surface20.390.50.63
Treatment × Canopy zone × Leaf surface61.61.90.08
Error(b)3790.84
Publisher’s Note: MDPI stays neutral with regard to jurisdictional claims in published maps and institutional affiliations.

