Article

Optimization of Ecosystem Services of Shanghai Urban–Suburban Street Trees Based on Low-Carbon Targets

Department of Landscape Architecture, School of Design, Shanghai Jiao Tong University, Shanghai 200240, China
*
Authors to whom correspondence should be addressed.
Sustainability 2021, 13(23), 13251; https://doi.org/10.3390/su132313251
Submission received: 18 October 2021 / Revised: 22 November 2021 / Accepted: 23 November 2021 / Published: 30 November 2021

Abstract

:
Road traffic carbon emissions are an important cause of global warming, and street trees play an important role in regulating road carbon emissions. During urbanization, major differences in the planting management modes and growth status of the street trees in urban–suburban gradient may exist, leading to significant differences in the low-carbon values of the street trees in urban–suburban gradient. Based on this, this study took two typical urban–suburban gradient zones in Shanghai as an example to analyze the changes in the characteristics of street tree species, planting density, tree sizes, and low-carbon contribution with urban and rural changes, and proposed strategies for optimizing the low-carbon contribution of urban street trees. The results showed that, from the inner ring to the outer ring and the suburban ring, the proportion of London plane tree gradually changed from 82% to 11%, and the proportion of the camphor tree gradually changed from 9% to 70%; the average DBH of the trees gradually decreased from 28.81 to 23.74 cm. The number of plantings per unit road length gradually increased, and the number of plantings per unit area gradually decreased; therefore, the average low-carbon contribution of urban–suburban street trees is not significant, but the low-carbon contribution of upper street trees per unit area is higher, and suburban unit street trees have a higher low-carbon contribution. Finally, this article proposes different optimization strategies for future urban micro-renewal and suburban new-city construction.

1. Introduction

Carbon emissions are a significant cause of global warming [1]. In recent years, governments in various countries have proposed the goal of peaking their carbon consumption and becoming carbon neutral to actively respond to climate issues [2]. Making full use of plant carbon sequestration and reducing carbon emissions are important techniques for achieving carbon neutrality. As an important form of green infrastructure in cities, street trees can provide urban residents with many ecosystem service functions with low-carbon contributions, such as carbon sequestration, runoff regulation, and air purification [3,4,5]. Street trees can directly affect the carbon cycle through carbon fixation, and can also reduce carbon emissions by reducing the consumption of resources and energy through environmental governance, including runoff regulation and air purification [6,7]. Thus, assessing the direct and indirect low-carbon contributions of street trees and proposing optimization plans has practical significance for the realization of the “dual carbon” goal.
Existing commonly used methods for estimating and evaluating the low-carbon contribution of street trees mainly estimate the direct carbon sequestration of street trees; however, the research on the regulation function that indirectly generates the contribution of carbon emission reduction is insufficient. Evaluation methods for the low-carbon contribution of street trees mainly include the actual measurement of biomass and the estimation methods of growth models [8,9] (Table 1). The biomass measurement method directly measures the tree felling or uses surveying tools/three-dimensional laser scanning to reconstruct the tree structure and determine the biomass, obtaining the current carbon sequestration. The biomass measurement method has many limitations, including its time-consuming and labor-intensive nature, along with its associated high costs. Currently, the growth model estimation method is more commonly used. The main principle here involves constructing a growth equation by measuring and mapping the structural changes of specific local tree species every year or estimating the growth rate in combination with the local climate to determine the photosynthesis and respiration rate, which facilitates the measurement of the annual carbon sink [10,11,12,13]. For example, Lahoti, et al. [14] used a species-specific equation to estimate the biomass and the carbon sink value of trees in Nagpur, India. Tang, et al. [15] calculated the annual carbon sequestration value of street trees in Beijing, China, by combining field measurements and related growth equations. In the past, the growth model estimation method has been integrated with the CITYgreen model, i-Tree model, etc. Because the CITYgreen model focuses on the overall environmental elements, it is applied more widely to the assessment of planar urban forests; however, the i-Tree model focuses more on the evaluation of individual trees under urban conditions, so it is used more frequently in study street trees [16,17]. According to the calculation process and principles of the aforementioned commonly used methods, it is found that the existing research on the estimation of the low-carbon contribution of street trees mainly considers their carbon sequestration contribution, while less focus is paid to the contribution of the regulation function, which can indirectly reduce carbon. This could lead to a significant underestimation of the low-carbon contribution of street trees.
Existing research has found that the influencing factors of the low-carbon contribution of trees mainly include the trees themselves, along with climatic and environmental factors; for urban street trees, human interference is another factor that cannot be ignored. Many studies have confirmed that the characteristics of the trees themselves, such as tree species, size, crown structure, and leaf shape, have significant effects on the photosynthesis rate, rainwater retention, and pollution adsorption functions of trees, which can change their low-carbon contributions. For example, studies have shown that the tree size, tree structure, and leaf shape significantly affect the efficiency with which tree leaves receive light, altering the photosynthesis characteristics of trees [18]. Trlica, et al. [19] found that the canopy size determines the magnitude and distribution of biomass carbon uptake. The type, number, and canopy structure of trees significantly affect their rainwater retention and tree transpiration functions, determining the value of tree runoff reduction [20,21]. The trees’ capacity to reduce air pollutants is mainly due to the biological absorption, physical solidification, and sedimentation of pollutants by tree leaves and branches [22,23]. The climate and environmental factors, such as sunlight, rainfall, and air pollution, also have an effect on the carbon sequestration and regulation functions of trees. For example, light intensity and duration can significantly change the photosynthesis capacity of tree leaves [24]. The value of the runoff reduction produced by trees in rainy areas is significantly higher than that in less rainy areas [25], and trees are more valuable for air purification in areas with more significant air pollution [26]. Street trees in cities are significantly different from those in natural woodlands and green spaces. Their tree species selection, planting size, and planting density are subject to human intervention. These human interventions will significantly change the low-carbon function of street trees [27]. Through the process of urbanization, there may be significant differences in road greening design concepts, tree species selection, and management models. The impact of this human intervention could lead to spatial heterogeneity in the low-carbon contribution of urban street trees in different urban–rural gradients [28]. In general, there are many existing studies that focus on the mechanism of the influence of climatic, environmental, and tree factors on the low-carbon contribution of street trees. However, to comprehensively evaluate and optimize the low-carbon contribution of urban street trees, it is necessary to pay attention to the influence of human interference factors and consider the differences in the urban–suburban gradient. Therefore, exploring the differences between the characteristics of the urbanization gradient and the characteristics of the low-carbon functions of street trees can help ascertain the key influencing factors of the low-carbon contribution of urban street trees, improving the low-carbon contribution ability of street trees in the entire region.
Shanghai is a globalized metropolis. It has experienced rapid urbanization, with obvious urban–rural gradients. The planting of street trees began approximately in the concession period. To date, the planting range of street trees has been greatly expanded, and the tree species selection preferences have also undergone several changes [29,30]. The design, planting, and management of street trees in the urban areas and the suburbs greatly differ due to differences in construction concepts in various eras. On the other hand, different population densities lead to differences in demand, which ultimately leads to significant differences in the management goals and finesse of urban–suburban street trees, which may lead to significant differences in the low-carbon contribution of street trees in a given urban–suburban gradient [31,32]. Therefore, to accurately estimate and evaluate the low-carbon contribution of street trees in Shanghai, determine its characteristics and key influencing factors, and propose an optimization strategy for it, this study mainly carried out the following research: (1) the direct and indirect low-carbon contribution of street trees was estimated, and the comprehensive low-carbon effects of street trees in Shanghai were explored; (2) the low-carbon contribution and influencing factors of street trees in two urban–suburban gradient belts were investigated, along with the spatially heterogeneous characteristics; and (3) the key impact of the low-carbon contribution of street trees in Shanghai was analyzed, and an optimization strategy for improving the low-carbon contribution of street trees in Shanghai’s urban and suburban areas was proposed.

2. Research Area and Methods

2.1. Study Area

Shanghai is one of the core metropolises in China. It is bounded by longitude 120°52′–122°12′ E and latitude 30°40′–31°53′ N (Figure 1). Studies have shown that the southwest axis from the center of Shanghai to Songjiang is the most typical urban–rural development gradient zone [33]. For this reason, the transect in this direction was selected as experimental axis 1, and the line perpendicular to it—from downtown to Jiading—was selected as axis 2 (Figure 2). Based on the quantitative analysis of the urban–suburban–rural pattern in Shanghai by Qian et al. [30], it is believed that there is no obvious suburban–rural boundary in Shanghai; therefore, this study defines the gradient as the urban–suburban gradient. For the urban–suburban gradient division of Shanghai, this study adopted the method of dividing the inner ring, middle ring, outer ring, and suburban ring—recognized by many scholars—and used this to define the urban areas and the suburbs [34,35]. In addition, considering that the study area is relatively large, to clearly explain the differences between the areas, this study takes all the roads in an administrative street as a whole for discussion.

2.2. Research Methods

2.2.1. Calculation of Ecosystem Services from Street Trees

This study used the i-Tree Eco v6 to calculate the three ecosystem service functions highly related to low-carbon goal-carbon sequestration, runoff regulation, and air purification and convert their values into monetary value through economic conversion [23,36,37]. Among them, this study took the value of carbon sequestration as the contribution value of carbon sinks, the value of the runoff regulation, and air purification of trees as the indirect carbon contribution value, and the sum of the three as the comprehensive value. The use of the model required the selection of a climate and the setting of economic parameters; subsequently, the collected tree census data were input into the model calculation. Regarding the model and parameter settings, this study referred to related research and revised the economic and technical indicators into Shanghai data. The climate data selection system included meteorological data for both rainfall and pollutants in Shanghai in 2018.

2.2.2. Estimation of the Low-Carbon Contribution of Urban–Suburban Street Trees

In this study, both the self-measured database of typical sample plots of street trees and the general survey database of street trees at SMLMIS (Shanghai Municipal Landscape Management and Instruction Station) were used to calculate the low-carbon contribution of street trees on the two aforementioned axes (Table 2). Among them, SMLMIS conducted a large-scale survey of street trees in major areas of Shanghai in 2019. A total of 3753 road sections and 174,919 trees were surveyed on the two axes, forming a census database. However, the database of SMLMIS was not sufficient to calculate its low-carbon contribution. In this study, 15 typical tree species (Chinese horse chestnut (Aesculus chinensis), camphor tree (Cinnamomum camphora), chinaberry (Melia azedarach), Chinese hackberry (Celtis sinensis), Chinese pistache (Pistacia chinensis), Chinese sweetgum (Liquidambar formosana), ginkgo (Ginkgo biloba), golden rain tree (Koelreuteria paniculata), Japanese zelkova (Zelkova serrata), London plane tree (Platanus acerifolia), Nuttall oak (Quercus nuttallii), sweetgum (Liquidambar styraciflua), trident maple (Acer buergerianum), umbrella catalpa (Catalpa bungei), and wingleaf soapberry (Sapindus saponaria)) were selected according to the suggestions of SMLMIS, and 41 road sections were selected for detailed investigation according to different sizes in each “urban–suburban” gradient in Shanghai, so as to supplement the tree species information and accurately estimate their carbon contribution (Figure 3).
A detailed survey was conducted through the plot design plan proposed by related scholars using i-Tree, and the size of each plot was designed to be about 400 m2 [8]. This research was based on the spatial characteristics of roads, so the size of the space accommodated by five consecutive street trees was taken as a sample plot (about 400 m2), and three research plots with a certain interval were set up in each survey section (the distance between plots was generally more than 200 m). In terms of information collection, according to the requirements of the i-Tree Eco manual, the tree species, basic physical characteristics of street trees (tree height, crown top height, crown bottom height, east–west crown width, and north–south crown width), tree health status (crown missing rate, tree crown death ratio), environmental factors (the presence or absence of conflicts such as wires and the number of light-receiving surfaces), and other factors were investigated for each tree, with a total of 1352 street trees (Table 3). After that, the collected information was input into the i-Tree model to calculate its low-carbon value results (since there was no Nuttall oak in the model species, we referred to the practice of other scholars and chose a similar species of the same genus to replace it [7]).
Studies by many scholars have shown that tree species and sizes are the most important factors affecting the ecosystem service value of a single tree [38,39,40,41]. Based on this, the self-measured database can be associated with the SMLMIS database. This study used MATLAB to determine the closest five tree species in the self-measured database, based on the tree species and sizes of the street trees in each section of the SMLMIS database, calculating the average value of their ecosystem services as the value of the given tree; for tree species that were not investigated in detail but existed in small numbers in the city, this study assigned the average value of all trees investigated. Finally, the road segment data were summarized by administrative streets. First, the basic characteristics of street trees were analyzed on different urban–suburban gradients; then, the low-carbon contribution of different gradients was investigated; and finally, their mutual influences were studied, and an optimal design strategy was proposed (Figure 4).

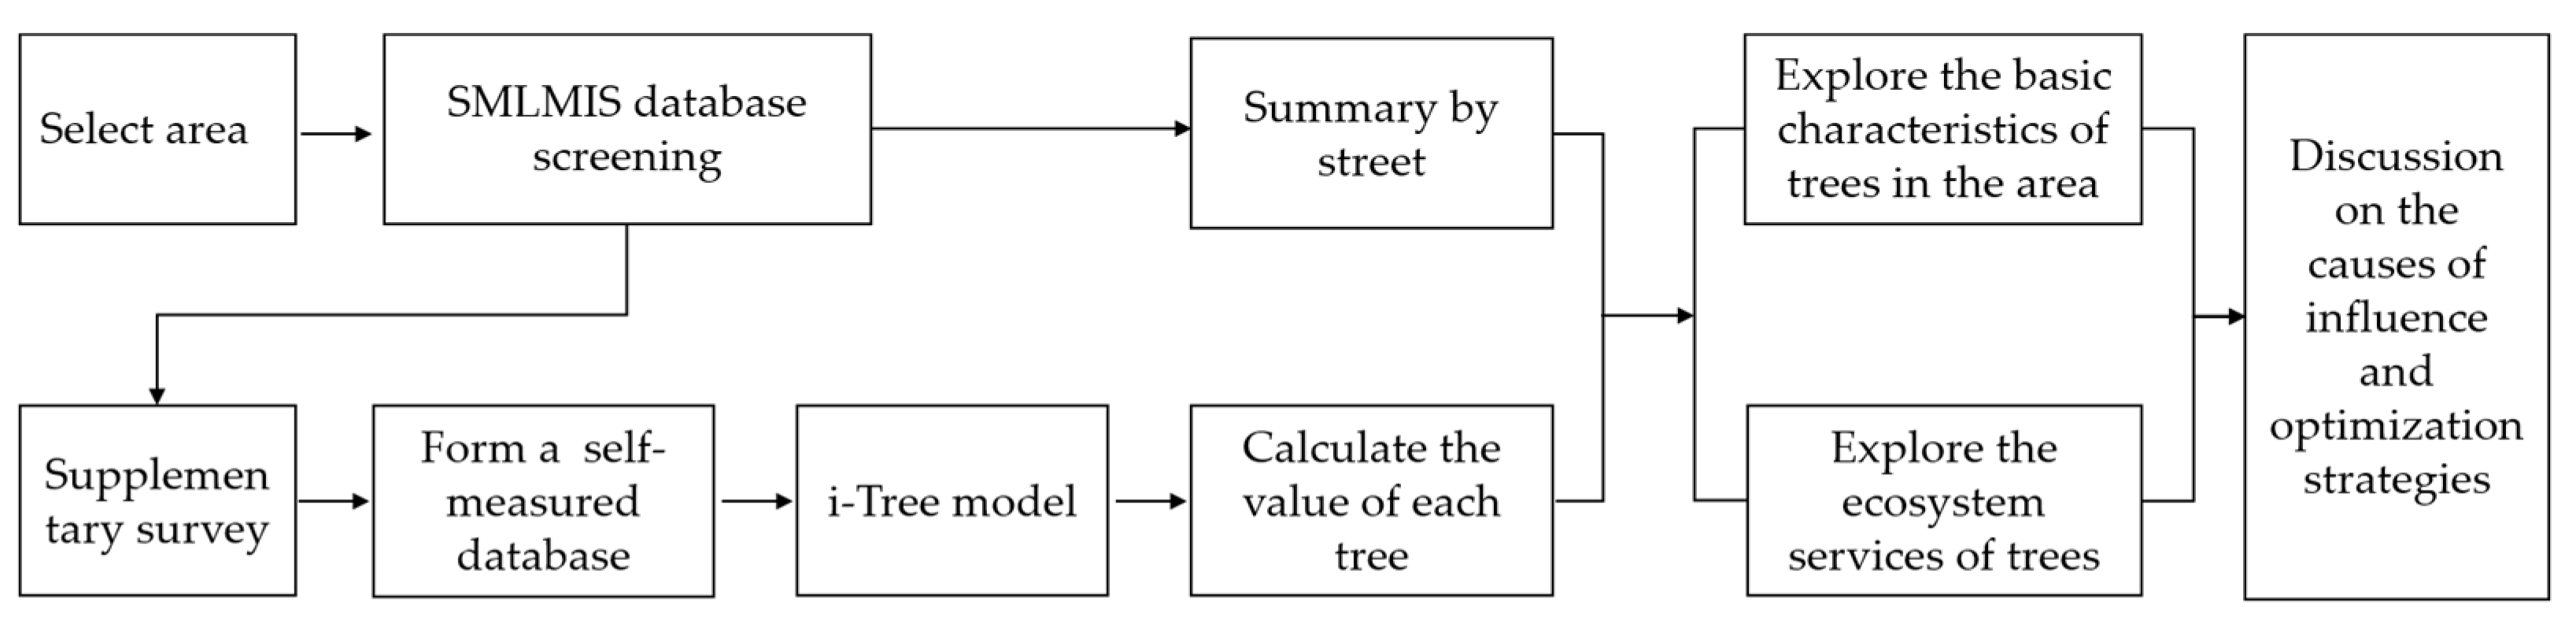
2.2.3. Data Analysis Methods and Steps

The basic characteristics of street trees determine the ecosystem services they can ultimately provide for low-carbon goals [42,43]. These basic characteristics can be described in terms of two elements: tree attributes and planting density. Therefore, this research first analyzed the basic characteristics of urban–suburban street trees in Shanghai based on the SMLMIS database. In terms of tree attributes, we focused on the tree species and tree sizes that had the greatest impact on the low-carbon contribution of urban–suburban street trees. The main street tree species in Shanghai are the London plane tree and camphor tree [44], which account for more than half of the total. Therefore, in this study, street tree species in Shanghai were divided into three types—London plane tree, camphor, and other trees—to investigate their distribution characteristics on the two urban axes; for tree size s, this study used the diameter at breast height (DBH). In terms of planting density, the planting quantity per unit length of street trees was analyzed, along with the planting quantity characteristics per unit area. Since only the start and endpoints of the road section were marked in the database, the length of the road section was not included. Therefore, this study simplified the road section as a straight line and calculated its length after the start and endpoints were located in the Baidu coordinate-picking system.
Subsequently, this study used i-Tree Eco to determine the value of the low-carbon contribution of various tree species based on the self-measured database and used correlation analysis to explore the extent to which it was affected by various factors, comprehensively analyzing the low-carbon contribution differences between urban and suburban street trees. Among the various factors that affect the low-carbon contribution of trees, internal factors include tree species, the growth status (DBH, tree height, crown height, and crown width), and tree health factors (crown death ratios and missing degree); external factors include the planting environment (the number of light-receiving surfaces and the conflict of telegraph poles are the major influencing factors) [45,46]. Regarding planting density, because each road section has different slab belt settings and the tree spacing of each planting belt is different, the planting quantity per unit road length differs; in addition, the road network density varies between regions, resulting in different numbers of plantings. Therefore, this study was divided into two parts: the unit road length and unit area, to discuss the difference in low-carbon contribution caused by the spatial differences brought about by planting density.

3. Results

3.1. Analysis of the Basic Characteristics of Urban–Suburban Street Trees

3.1.1. Characteristics of Urban–Suburban Tree Species

The distribution of tree species on axis 1 exhibited a strong two-level differentiation, roughly with the middle ring as the boundary. The main street tree species in the boundary was the London plane tree, and the main street tree species outside the boundary was the camphor tree. The distribution characteristics of the tree species on axis 2 also had two obvious gradients. The outer ring was the approximate boundary. The main street tree species in the streets in the urban areas was still plane trees, similar to axis 1, while the main street trees in the suburbs were not limited to camphor trees—London plane tree and other tree species were also present (Figure 5).
When the two axes were viewed according to the gradient of the inner, middle, outer, and suburban rings, the proportions of the London plane tree, camphor tree, and other tree species in the inner ring were 82%, 9%, and 9%, respectively, and those for the middle ring to the inner ring were 64%, 26%, and 10%, respectively. The proportions of the outer ring to the middle ring London plane tree, camphor, and other tree species were 42%, 50%, and 8%, respectively, and those for the suburban ring to the outer ring were 11%, 70%, and 19%, respectively. Starting from the city center, along the urban–suburban axis, it was obvious that the proportion of London plane trees was gradually decreasing, the proportion of camphor trees was gradually increasing, and the proportion of other tree species between the outer ring and the suburb ring had increased significantly. Therefore, the distribution of street tree species had obvious urban–suburban gradient characteristics. This feature was influenced by the preference of street tree species in different eras in Shanghai (Shanghai has planted various street trees in different periods [47,48]: see Table 4 for details). Eventually, obvious urban–suburban gradient differences in tree species patterns formed.

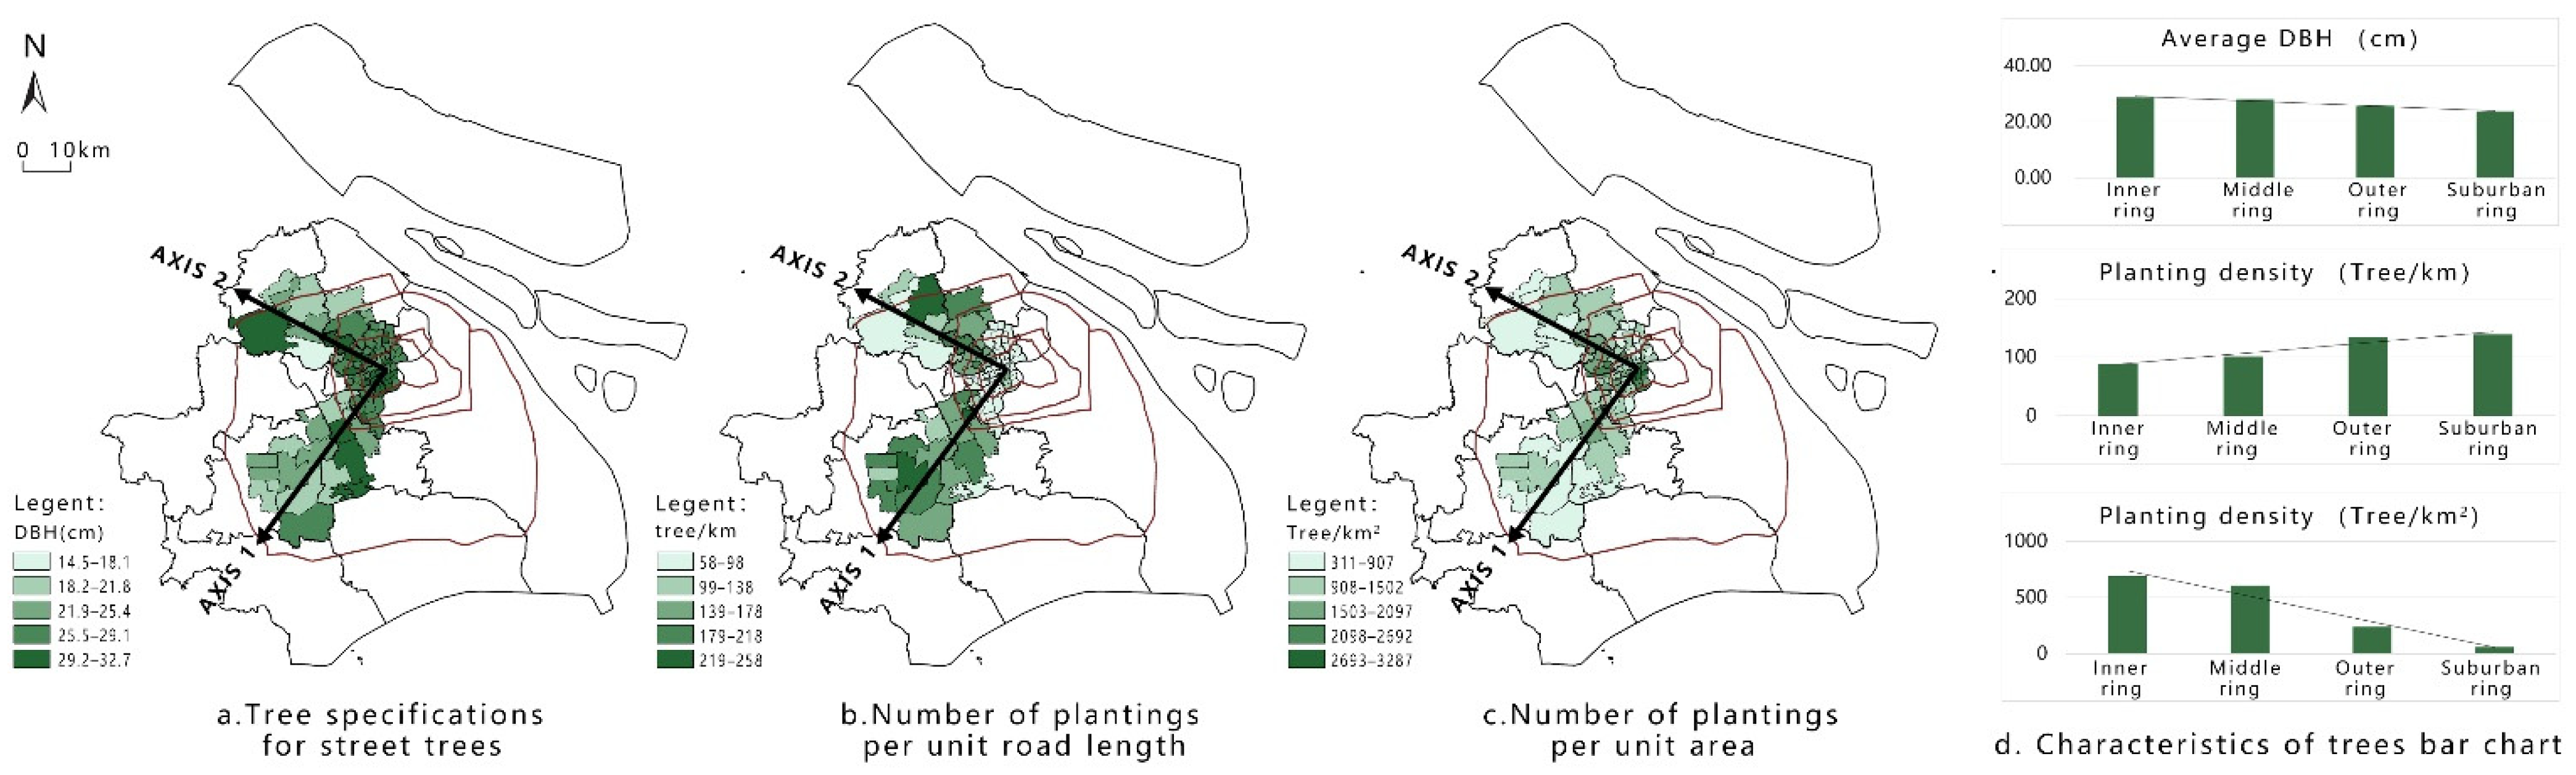
3.1.2. Urban–Suburban Street Tree Diameters

For axis 1, along the route from the urban areas to the suburbs, the average tree diameter of street trees generally exhibited a gradual decrease, and a small number of streets in the suburbs had larger average tree diameters (Figure 6a). For the second axis, there was also a weaker gradual decreasing trend, but a small number of streets in the suburbs had larger average tree diameters. When the two axes were viewed in the gradients of the inner, middle, outer, and suburban rings, the average DBH of the inner ring, middle ring to inner ring, outer ring to middle ring, and suburb ring to outer ring was 28.81, 27.99, 25.68, and 23.74 cm, respectively; starting from the city center, along the urban–suburban axis, the average DBH of the street trees generally exhibited a gradual decline, but the overall gap was not large. This feature shows that the current tree sizes are affected by both the planted seedling sizes and growth cycle factors; however, from the final result, the gradient difference was not obvious, and it was mainly affected by the growth cycle differences.

3.1.3. Urban–Suburban Street Tree Planting Density Analysis

Both the number of plantings per unit road length on the axis (Figure 6b) and the number of plantings per unit area (Figure 6c) exhibited relatively obvious urban–suburban differences. The number of plantings per unit road length showed that there were fewer urban centers and more suburbs; the number of plantings per unit area showed the opposite trend, with more urban centers and fewer suburbs. For axis 2, the number of plantings per unit road length roughly showed a two-level differentiation between the urban areas and the suburbs, but the gradient changes were not as obvious as those in axis 1; the number of plantings per unit area exhibited a similar situation to that of axis 1, with a large number of downtown areas and few suburbs. When the two axes were viewed in gradients of the inner, middle, outer, and suburban circles, starting from the city center, along the urban–suburban axis, the number of plantings per unit road length gradually increased, and the number of plantings per unit area gradually decreased. This characteristic showed that the planting density per unit road length in the suburbs was higher, and the planting density per unit area in the urban areas was higher. The former is due to the dual factors of more slats in the suburbs and tree spacing, resulting in more trees per unit road length; the latter is because the road network density in the downtown area is much higher than that in the suburbs, and its impact on the planting density per unit area is much greater than the impact of more slats and tree spacing, which ultimately leads to higher planting density in the downtown area.

3.2. Analysis of the Low-Carbon Contribution of Urban–Suburban Street Trees

3.2.1. Impact of Tree Species on Their Low-Carbon Contribution

Different tree species have different branch and stem morphologies, leaf morphologies, crown morphologies, etc., resulting in large differences in their low-carbon contributions. This survey collected data on 15 tree species, including Chinese horse chestnut, camphor tree, chinaberry, Chinese hackberry, Chinese pistache, Chinese sweetgum, ginkgo, golden rain tree, Japanese zelkova, London plane tree, Nuttall oak, sweetgum, trident maple, umbrella catalpa, and wingleaf soapberry, yielding a total of 1352 trees (more than 50 trees were collected for each species). The low-carbon contribution of each tree species calculated using the i-Tree Eco model is shown in Figure 7.
It can be seen from the figure that the relationship of the comprehensive low-carbon contribution of a single tree, from high to low, was London plane tree > camphor tree > chinaberry > golden rain tree > Chinese pistache > wingleaf soapberry > Chinese hackberry > trident maple > Japanese zelkova > Chinese sweetgum > Chinese horse chestnut > Nuttall oak > sweetgum > umbrella catalpa > ginkgo. In terms of the carbon sink value and indirect carbon value, the species ranking relationship of the carbon sink value was London plane tree > camphor tree > chinaberry > wingleaf soapberry > golden rain tree > trident maple > Nuttall oak > Chinese pistache > Chinese horse chestnut > Chinese sweetgum > umbrella catalpa > sweetgum > Japanese zelkova > Chinese hackberry > ginkgo. The average annual carbon sequestration of the highest-value London plane tree was 38.9 kg, reaching an annual carbon sequestration value of USD 7.20, with a comprehensive value of USD 18.74. The ranking relationships among tree species contributing indirect carbon value were as follows: London plane tree > golden rain tree > camphor tree > Chinese hackberry > Chinese pistache > chinaberry > trident maple > Japanese zelkova > wingleaf soapberry > Chinese sweetgum > Chinese horse chestnut > sweetgum > ginkgo > umbrella catalpa > Nuttall oak.

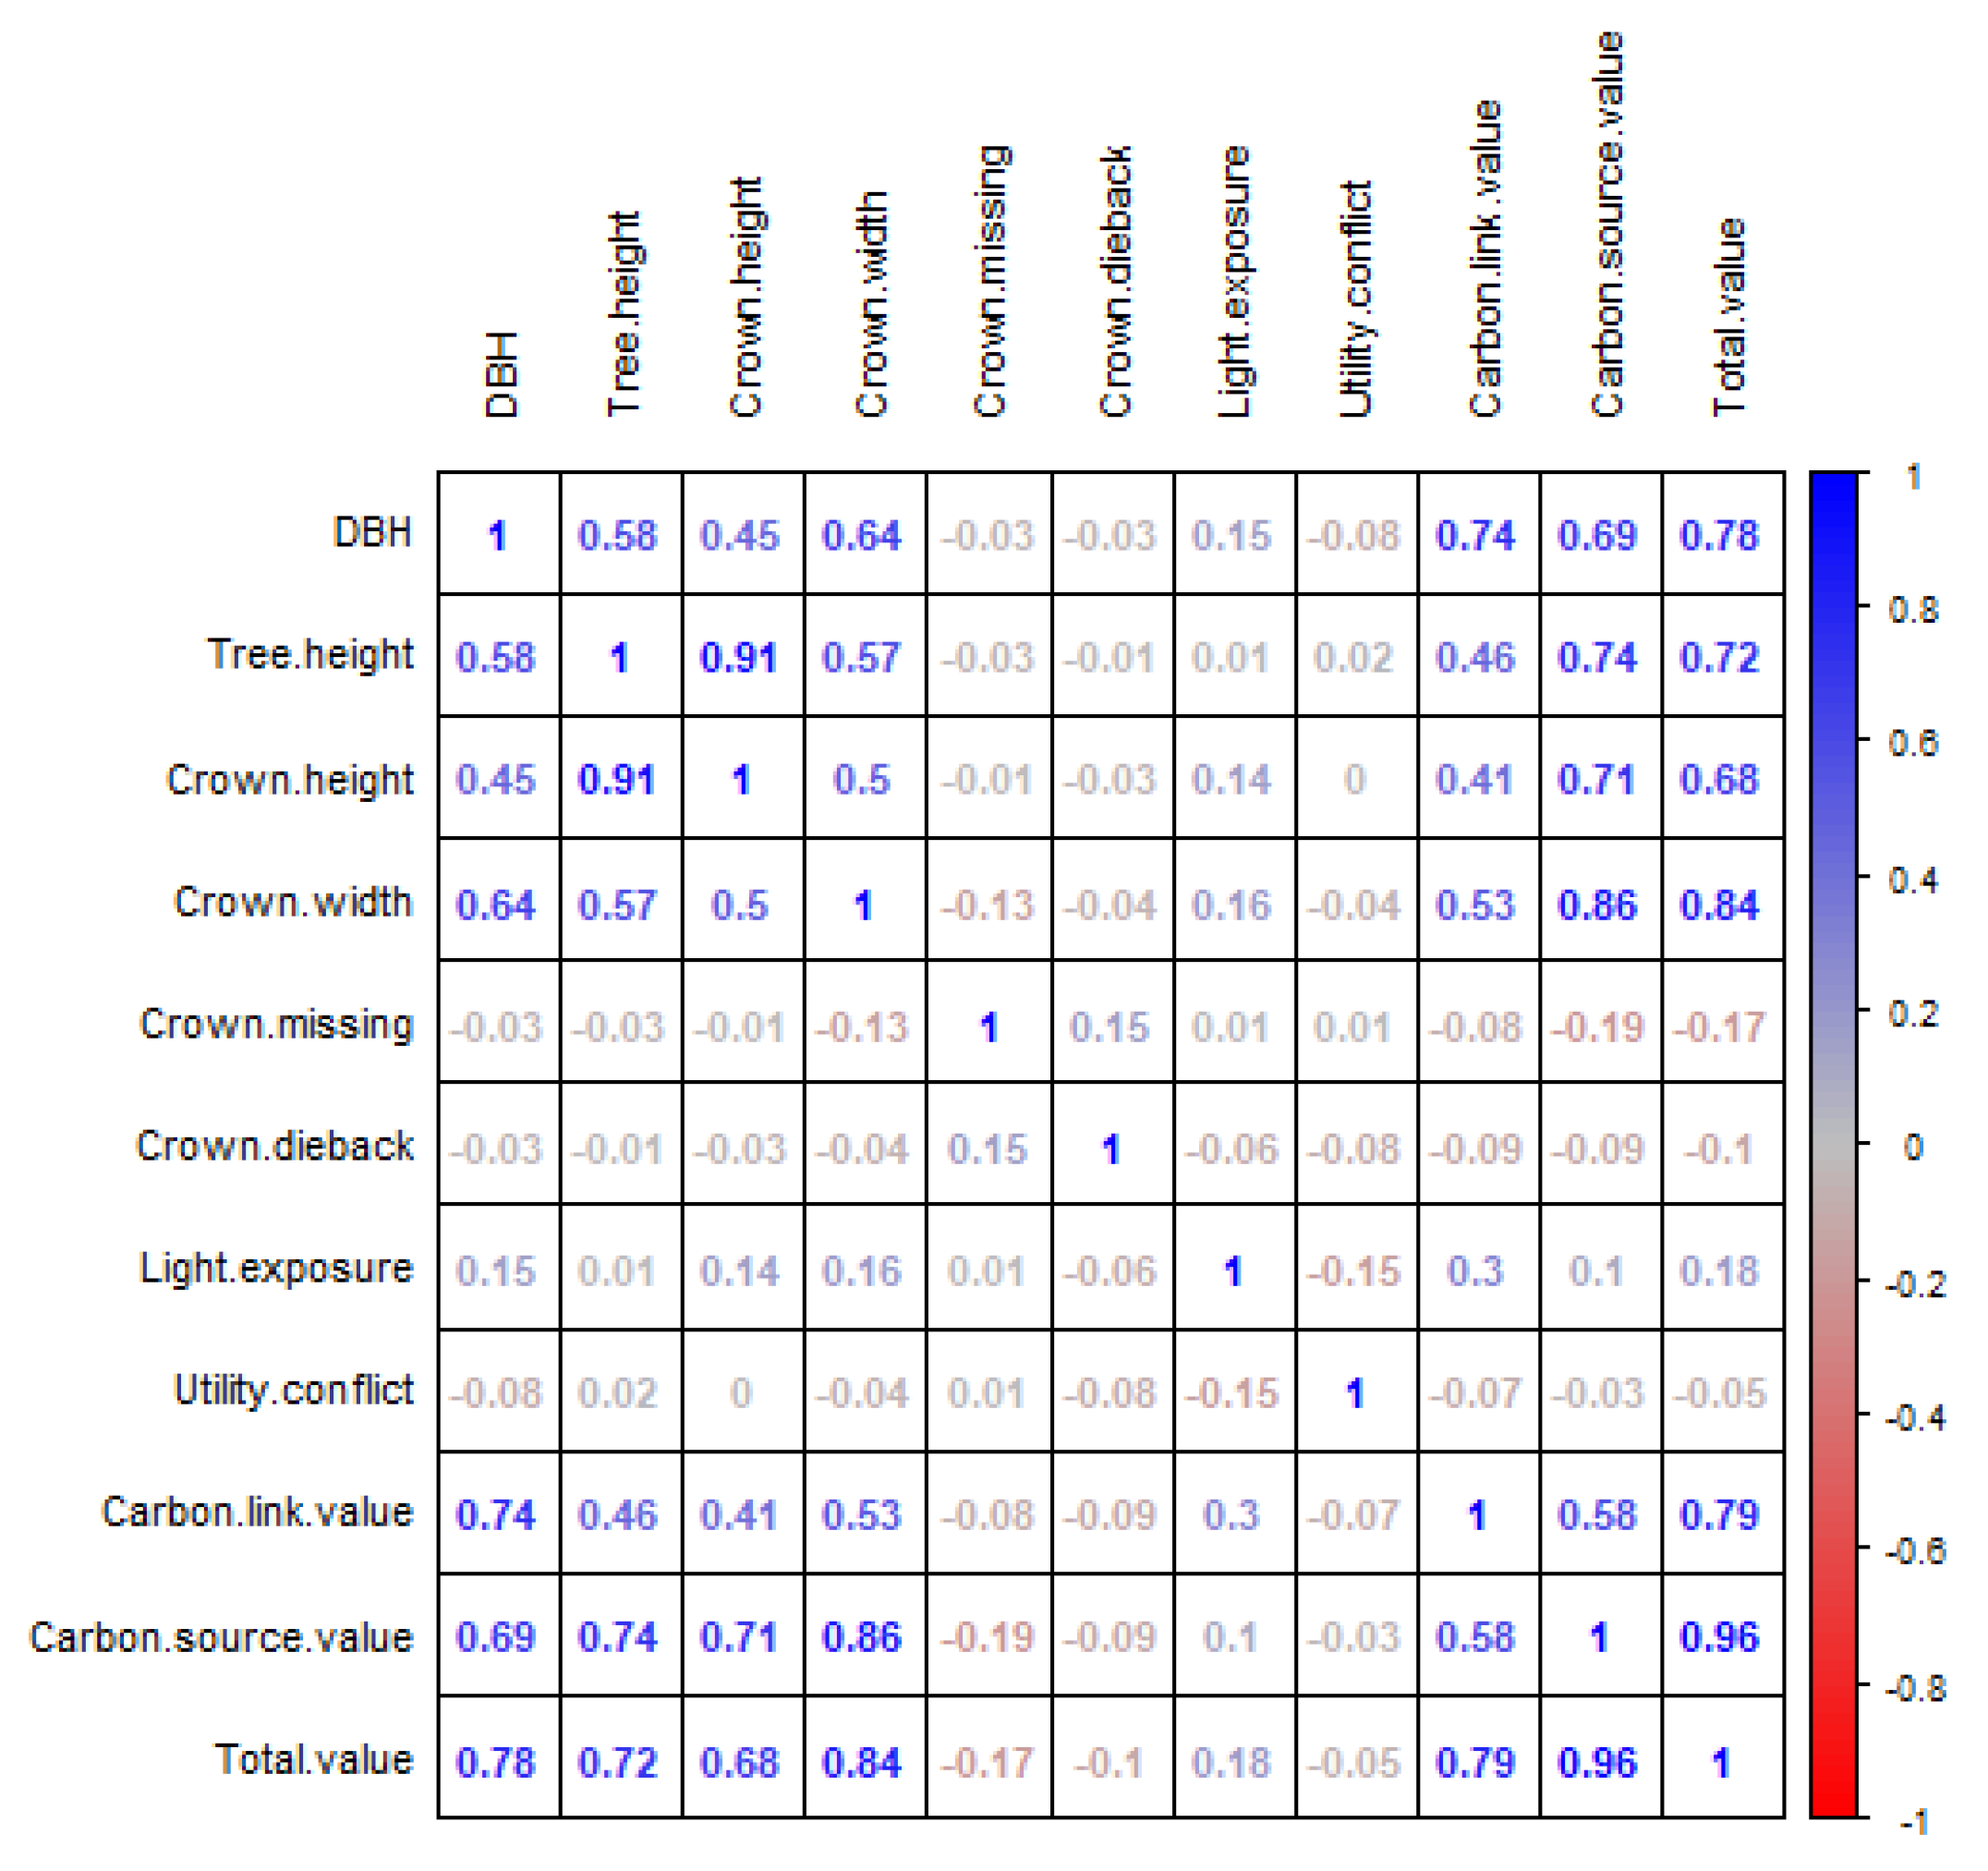
3.2.2. Impact of Other Factors on the Low-Carbon Contribution

To explore which factors had a greater influence on the low-carbon contribution of street trees, this study used tree samples in the self-measured database to ascertain the correlation between these factors and the final benefits; the results are shown in Figure 8. It can be seen from the figure that the DBH, tree height, crown height, and crown width related to its growth status had the largest correlation with their comprehensive contributions. Among them, the correlation of DBH was 0.78, the correlation of tree height was 0.72, the correlation of crown height was 0.68, and the correlation of crown width was 0.84. Secondly, the number of light-receiving surfaces in the planting environment category also had a certain correlation, which was 0.18, and the correlation of other factors was low. Therefore, according to this study, the diameter of the DBH and the crown width are the two factors that have the greatest impact on the low-carbon contribution of street trees.

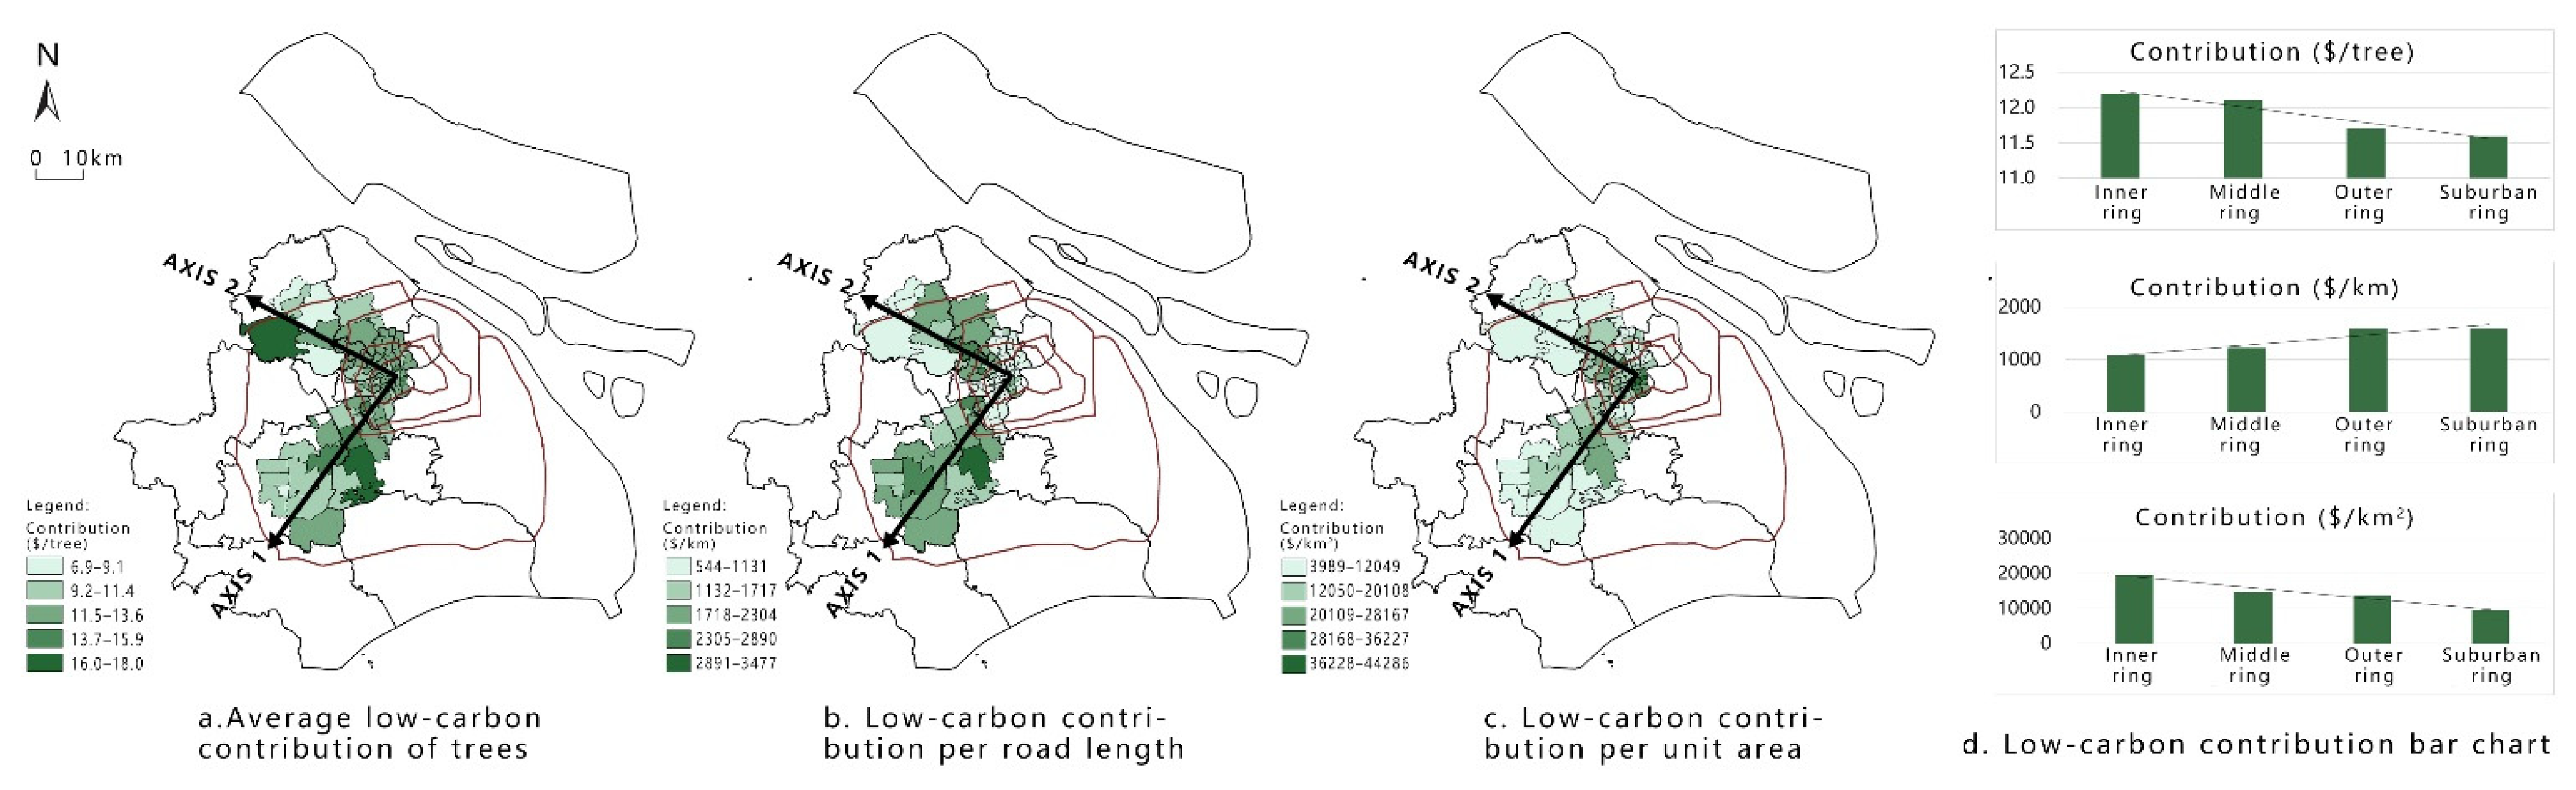
3.2.3. Urban–Suburban Street Tree Low-Carbon Contribution Difference Analysis

In addition to the impact of the trees themselves, the spatial differences of street trees are mainly affected by the comprehensive planting density determined by the density of the road network in different regions and the number of plantings per unit road length, resulting in large differences in the average ecological benefits of different regions. Therefore, to explain the differences in the low-carbon contribution of street trees caused by spatial differences on the urban–suburban gradient in Shanghai, the average low-carbon contribution of street trees in the area, the low-carbon contribution per road length, and the low-carbon contribution per unit area were comprehensively analyzed.
For axis 1, from the urban areas to the suburbs, the average low-carbon contribution of street trees generally exhibited a decreasing trend, but a small number of streets in the suburbs had a higher overall contribution (because the street had a tree species with a higher low-carbon value, and the tree species was growing well); this phenomenon was also found in axis 2. When the two axes were viewed according to the gradient of the inner, middle, outer and suburban rings, the average low-carbon contribution values of street trees in the inner ring, middle ring to inner ring, outer ring to middle ring, and suburb ring to outer ring were USD 12.20, USD 12.11, USD 11.71, and USD 11.60/tree, respectively. Starting from the city center, along the urban–suburban axis, the average low-carbon contribution of street trees generally exhibited a gradual decline; however, the overall gap was not large (Figure 9a). This result shows that the attributes of trees had little effect on the differences in the contribution of urban–suburban gradients. Therefore, when studying the impact of planting density on its low-carbon value, the impact of tree species and tree sizes can be neglected.
For axis 1, the low-carbon contribution of street trees per unit road from the urban areas to the suburbs exhibited a clear upward trend; for axis 2, the low-carbon contribution of long-street trees for unit roads, from the urban areas to the suburbs also exhibited an increasing trend. On the whole, the annual value of the low-carbon contributions from the unit roads from the inner ring, from the central to the inner ring, from the outer ring to the central ring, and from the suburban ring to the outer ring were USD 1079, USD 1225, USD 1593, and USD 1600/km, respectively. Starting from the city center, along the urban–suburban axis, the low-carbon contribution of street trees per unit length of road exhibited a gradual upward trend (Figure 9b). This result indicates that the planting density per unit length of road had a certain impact on the differences in the ecosystem service values of urban–suburban street trees.
For axis 1, from the urban areas to the suburbs, the low-carbon contribution of street trees per unit area exhibited an extremely obvious decreasing trend; this phenomenon occurred in axis 2 as well. On the whole, the annual value of the low-carbon contributions of street trees per unit area from the inner ring, the central to the inner ring, the outer ring to the central ring, and the suburb ring to the outer ring were USD 19,418, USD 14,763, USD 13,679, and USD 9391/km2, respectively. Starting from the city center, along the urban–suburban axis, the low-carbon contribution of street trees per unit area exhibited a gradual decline (Figure 9c). This result shows that, although the urban–suburban contribution difference was greatly affected by the difference in the number of plantings per unit road length, the difference in the number of plantings per unit area had a larger effect on it.

4. Discussion

4.1. Comprehensive Low-Carbon Value of Street Trees

This study comprehensively estimated the direct and indirect low-carbon contribution of street trees. In comparison to previous studies, which only estimated the contribution of direct carbon sequestration, this research can better reflect the role of street trees in achieving carbon neutrality [49,50,51]. In this study, taking the London plane tree as an example, it was found that the average annual carbon sequestration of this tree species was 38.9 kg, which is an approximate value of USD 7.20; however, if its comprehensive low-carbon contribution were considered, this value reached USD 18.74. In terms of the annual value of the species, its direct carbon sequestration value accounted for only about 40% of the total, and 60% was other indirect low-carbon values. Therefore, the assessment of the comprehensive low-carbon contribution of street trees can greatly enhance the understanding of their comprehensive low-carbon capabilities, providing a more comprehensive perspective on the carbon-neutral planning of future cities.

4.2. Urban–Suburban Street Trees and Human Factors

This study found that a significant influencing factor of the urban–suburban gradient low-carbon contribution was the regional planting density, while the tree species and size were insignificant factors. A possible reason for this is that the degree of urbanization significantly affects the regional street tree planting density. For example, the high-density of street tree planting in the city center is a consequence of its high-density road network. However, there are usually uniform standards for the selection of street tree species and their size in cities, so the differences between urban and suburban gradients are not significant [52,53]. This clearly shows that human interference has a significant effect on the low-carbon contribution of urban street trees, which is difficult to reflect in the study of local areas [54,55,56]. This study can better explain the spatial distribution characteristics of the low-carbon contribution of urban street trees under the strong influence of human interference, which can help propose low-carbon plans and design suggestions for different urban and suburban areas.

4.3. Street Tree Optimization Strategy Based on Low-Carbon Goals

From urban to suburban areas, the attributes and planting densities of street trees exhibited obvious gradient characteristics, which ultimately led to a larger gradient in the value of their low-carbon contributions. The characteristics of urban–suburban street trees and their low-carbon contributions are listed in Table 5.
As far as the status quo characteristics are concerned, there were obvious regional differences and imbalances in the suburbs, especially in terms of the tree species, the number of plantings per unit road length, the number of plantings per unit area, the low-carbon contribution per unit road length, and the low-carbon contribution per unit area. First of all, the differences in tree species selection were mainly caused by the tree species selection preferences in different historical periods. The differences in the number of plantings per unit road length were largely due to the fact that most of the central urban areas had one-plate two-belt roads, while multiple belts were more common in the suburbs. The difference in the number of plantings per unit area was due to the higher traffic demand in the urban areas, leading to higher road network densities, which ultimately led to a higher number of plantings per unit area.
The average low-carbon contribution of urban–suburban street trees exhibited only slight differences, but the contribution per unit road and per unit area differed significantly. Although the average low-carbon contribution of street trees between administrative streets did not differ drastically, there were still large differences between different roads from a practical standpoint. For example, there are no street trees or sparse street trees on some roads in the urban areas; as far as the city is concerned, some roads will have a poor overall low-carbon contribution owing to inappropriate tree species selection or tree sizes that are too small.

4.3.1. Optimization Strategies for the Micro-Renewal of Central Urban Areas

According to the assessment of urban–suburban street trees, although the urban areas had certain advantages in terms of a low-carbon contribution per unit area, the low-carbon contribution per unit section of the urban areas was relatively low, which must be focused on. As the traffic volume of roads in central urban areas is larger and their carbon emissions are also higher, there is a stronger demand for low-carbon contributions per unit road. In addition, the general urban construction in the urban areas is complete, and the cost of changes in road width and road strip structures is high; therefore, only microrenewal measures can be considered. It can be seen from the results of this research that the low-carbon contribution of a unit road section was mainly affected by the attributes of trees and the number of plantings per unit road length. Additionally, trees with lower contributions can be appropriately replaced with London plane tree, camphor trees, chinaberry, golden rain tree, Chinese pistache, wingleaf soapberry, and other tree species that have a higher average contribution. This further improves the management level, optimizes the tree pond space, improves soil conditions, strengthens the prevention and control of diseases and pests, and puts other measures in place to increase the growth rate of trees. In addition, some roads can be further improved by upgrading and lowering telephone poles, optimizing the growth and light conditions of trees. In addition, when the planting density of street trees is difficult to change, measures should be considered to increase the amount of greenery per unit road section through rational placement of flowerpots and increases in vertical greening.

4.3.2. Optimization Strategies for the Construction of New Suburban Towns

According to the evaluation of “outskirts” street trees, suburbs had a better low-carbon contribution per unit road length than central urban areas, but the lower road network density reduced the low-carbon contribution of street trees. This phenomenon shows that, over time, the street tree planting plans of the new-city became more reasonable, a trend that is expected to improve further in the future. It can be seen from the research that increasing the low-carbon contribution of a unit section can be considered in terms of the tree attributes and planting density. In the construction of new suburban towns in the future, it is important not only to consider planting tree species with higher contributions but also to create a good environment to enhance their growth rate; for example, it is possible to set larger tree cavities or row tree cavities, increase the retreat distance of southerly buildings on the east–west road to allow more light to reach the trees, etc. In addition, in new areas, appropriate consideration can be given to setting up wider green belts (double-row street trees) or increasing the number of green belts per unit length (multi-slab belts) to increase the low-carbon contribution of street trees.

4.4. Limitations and Caveats

Because this research was mainly carried out using the i-Tree model, it is affected by i-Tree’s inherent drawbacks [57,58]. For example, the i-Tree model restricts the selection of pollutant and precipitation data from only one local weather station. However, although the survey samples are located in the same city, the meteorological conditions of each point naturally differ. In addition, this study used the tree diameter as a key comparison indicator of its size and structure, which exhibits certain regional differences in large-scale comparisons. However, some accuracy was lost due to the inability to accurately collect other tree structure information at the regional level.
Regarding the experimental conclusions, this study focused on the ecosystem service value of trees under the low-carbon goal; the final conclusion also served this goal. However, the landscape and biodiversity of urban trees should also be carefully considered [59,60]. Although this study suggests the selection of high-value tree species, choosing only one or two species should be avoided. Four, five, or six main tree species should be selected on the basis of their advantages when used in combination. This diversity of tree species can reduce threat factors, such as possible future pests and diseases affecting a single species. In addition, the cultural and aesthetic value of trees should also be taken into account, which means that street trees can be selected by matching different shapes, sizes, species, and colors.

5. Conclusions

In the context of the policy of carbon neutrality and carbon peaking, assessing the low-carbon contribution value of urban street trees is conducive to understanding China’s current status in terms of reaching these goals. It can also help to rationally optimize the ecosystem service value of urban road greening, providing data to help inform the global response to climate change. This study integrated tree census data and self-measured data from SMLMIS to evaluate the low-carbon contribution of street trees in two typical urban–suburban gradient zones in Shanghai. It was found that the basic characteristics of street trees exhibited strong urban–suburban gradient differences, and their low-carbon contribution also presented a more obvious urban–suburban gradient difference. In future urban construction, attention should be paid to the differences between street trees in urban and suburban areas. The attributes and planting densities of street trees can be comprehensively considered to improve the low-carbon contribution of street trees in different regions.

Author Contributions

Y.C., C.X., R.J. and S.C. conceived and designed the study; Y.C., C.X. and R.J. carried out tree surveying; Y.C. performed the modelling with i-Tree, developed and performed the methods and contributed the materials; Y.C., C.X., R.J. and S.C. analyzed the data and wrote the paper. The manuscript was produced through contributions of all authors. All authors have read and agreed to the published version of the manuscript.

Funding

This research study was funded by the Shanghai Science and Technology Project (19DZ1203702) and the National Natural Science Foundation of China (32001362).

Institutional Review Board Statement

Not applicable.

Informed Consent Statement

Not applicable.

Data Availability Statement

Our Data mainly comes from team survey and SMLMIS database.

Acknowledgments

Thanks to Benyao Wang and Yanting Zhang from Shanghai Municipal Landscape Management and Instruction Station for their help.

Conflicts of Interest

The authors declare no conflict of interest.

References

  1. Ghahramani, M.; Pilla, F. Analysis of Carbon Dioxide Emissions From Road Transport Using Taxi Trips. IEEE Access 2021, 9, 98573–98580. [Google Scholar] [CrossRef]
  2. Xi, J. Building on Past Achievements and Launching a New Journey for Global Climate Actions. The People’s Daily, 13 December 2020; p. 002. (In Chinese) [Google Scholar]
  3. Baró, F.; Calderón-Argelich, A.; Langemeyer, J.; Connolly, J.J. Under one canopy? Assessing the distributional environmental justice implications of street tree benefits in Barcelona. Environ. Sci. Policy 2019, 102, 54–64. [Google Scholar] [CrossRef]
  4. Jo, H.-K.; Kim, J.-Y.; Park, H.-M. Carbon and PM2.5 Reduction and Design Guidelines for Street Trees in Korea. Sustainability 2020, 12, 10414. [Google Scholar] [CrossRef]
  5. Im, J. Green Streets to Serve Urban Sustainability: Benefits and Typology. Sustainability 2019, 11, 6483. [Google Scholar] [CrossRef] [Green Version]
  6. Jo, H.-K.; Kim, J.-Y.; Park, H.-M. Carbon reduction and planning strategies for urban parks in Seoul. Urban For. Urban Green. 2019, 41, 48–54. [Google Scholar] [CrossRef]
  7. Tan, X.; Hirabayashi, S.; Shibata, S. Estimation of Ecosystem Services Provided by Street Trees in Kyoto, Japan. Forests 2021, 12, 311. [Google Scholar] [CrossRef]
  8. Song, P.; Kim, G.; Mayer, A.; He, R.; Tian, G. Assessing the Ecosystem Services of Various Types of Urban Green Spaces Based on i-Tree Eco. Sustainability 2020, 12, 1630. [Google Scholar] [CrossRef] [Green Version]
  9. Mullaney, J.; Lucke, T.; Trueman, S.J. A review of benefits and challenges in growing street trees in paved urban environments. Landsc. Urban Plan. 2015, 134, 157–166. [Google Scholar] [CrossRef]
  10. Zhao, Y.; Hu, Q.; Li, H.; Wang, S.; Ai, M. Evaluating Carbon Sequestration and PM2.5 Removal of Urban Street Trees Using Mobile Laser Scanning Data. Remote Sens. 2018, 10, 1759. [Google Scholar] [CrossRef] [Green Version]
  11. Schedlbauer, J.L.; Polohovich, S. Current and Future Carbon Storage Capacity in a Southeastern Pennsylvania Forest. Nat. Areas J. 2020, 40, 300–308. [Google Scholar] [CrossRef]
  12. Babst, F.; Alexander, M.R.; Szejner, P.; Bouriaud, O.; Klesse, S.; Roden, J.; Ciais, P.; Poulter, B.; Frank, D.; Moore, D.J.; et al. A tree-ring perspective on the terrestrial carbon cycle. Oecologia 2014, 176, 307–322. [Google Scholar] [CrossRef] [Green Version]
  13. Okimoto, Y.; Nose, A.; Oshima, K.; Tateda, Y.; Ishii, T. A case study for an estimation of carbon fixation capacity in the mangrove plantation of Rhizophora apiculata trees in Trat, Thailand. For. Ecol. Manag. 2013, 310, 1016–1026. [Google Scholar] [CrossRef]
  14. Lahoti, S.; Lahoti, A.; Joshi, R.K.; Saito, O. Vegetation Structure, Species Composition, and Carbon Sink Potential of Urban Green Spaces in Nagpur City, India. Land 2020, 9, 107. [Google Scholar] [CrossRef] [Green Version]
  15. Zhao, S.; Tang, Y.; Chen, A. Carbon Storage and Sequestration of Urban Street Trees in Beijing, China. Front. Ecol. Evol. 2016, 4, 53. [Google Scholar] [CrossRef] [Green Version]
  16. Lin, J.; Kroll, C.N.; Nowak, D.J.; Greenfield, E.J. A review of urban forest modeling: Implications for management and future research. Urban For. Urban Green. 2019, 43, 126366. [Google Scholar] [CrossRef]
  17. Rötzer, T.; Moser-Reischl, A.; Rahman, M.A.; Grote, R.; Pauleit, S.; Pretzsch, H. Modelling Urban Tree Growth and Ecosystem Services: Review and Perspectives. Prog. Bot. 2020, 82, 405–464. [Google Scholar] [CrossRef]
  18. Agbelade, A.D.; Onyekwelu, J.C. Tree species diversity, volume yield, biomass and carbon sequestration in urban forests in two Nigerian cities. Urban Ecosyst. 2020, 23, 957–970. [Google Scholar] [CrossRef]
  19. Trlica, A.; Hutyra, L.R.; Morreale, L.L.; Smith, I.A.; Reinmann, A.B. Current and future biomass carbon uptake in Boston’s urban forest. Sci. Total Environ. 2020, 709, 136196. [Google Scholar] [CrossRef]
  20. Morakinyo, T.E.; Lam, Y.F.N. Study of traffic-related pollutant removal from street canyon with trees: Dispersion and deposition perspective. Environ. Sci. Pollut. Res. 2016, 23, 21652–21668. [Google Scholar] [CrossRef]
  21. Selbig, W.R.; Loheide, S.P., II; Shuster, W.; Scharenbroch, B.C.; Coville, R.C.; Kruegler, J.; Avery, W.; Haefner, R.; Nowak, D. Quantifying the stormwater runoff volume reduction benefits of urban street tree canopy. Sci. Total Environ. 2021, 806, 151296. [Google Scholar] [CrossRef]
  22. Zabret, K.; Šraj, M. Rainfall Interception by Urban Trees and Their Impact on Potential Surface Runoff. CLEAN Soil Air Water 2019, 47, 1800327. [Google Scholar] [CrossRef]
  23. Selmi, W.; Weber, C.; Rivière, E.; Blond, N.; Mehdi, L.; Nowak, D. Air pollution removal by trees in public green spaces in Strasbourg city, France. Urban For. Urban Green. 2016, 17, 192–201. [Google Scholar] [CrossRef] [Green Version]
  24. Poorter, H.; Niinemets, Ü; Ntagkas, N.; Siebenkäs, A.; Mäenpää, M.; Matsubara, S.; Pons, T.L. A meta-analysis of plant responses to light intensity for 70 traits ranging from molecules to whole plant performance. New Phytol. 2019, 223, 1073–1105. [Google Scholar] [CrossRef] [PubMed] [Green Version]
  25. Baptista, M.D.; Livesley, S.J.; Parmehr, E.G.; Neave, M.; Amati, M. Variation in leaf area density drives the rainfall storage capacity of individual urban tree species. Hydrol. Process. 2018, 32, 3729–3740. [Google Scholar] [CrossRef]
  26. Huang, Y.; Lei, C.; Liu, C.-H.; Perez, P.; Forehead, H.; Kong, S.; Zhou, J.L. A review of strategies for mitigating roadside air pollution in urban street canyons. Environ. Pollut. 2021, 280, 116971. [Google Scholar] [CrossRef]
  27. Lin, J.; Wang, Q.; Li, X. Socioeconomic and spatial inequalities of street tree abundance, species diversity, and size structure in New York City. Landsc. Urban Plan. 2021, 206, 103992. [Google Scholar] [CrossRef]
  28. Monteiro, M.V.; Handley, P.; Doick, K.J. An insight to the current state and sustainability of urban forests across Great Britain based on i-Tree Eco surveys. Forestry 2019, 93, 107–123. [Google Scholar] [CrossRef]
  29. Jiang, Y. A summary of urban street trees at home & abroad. China Munic. Eng. 2020, 6, 4–6, 109. (In Chinese) [Google Scholar]
  30. Xu, X.; Liang, J.; Yang, R. Shanghai avenue construction and prospect. Chin. Landsc. Archit. 2019, 35, 75–79. (In Chinese) [Google Scholar]
  31. Zanzi, A.; Andreotti, F.; Vaglia, V.; Alali, S.; Orlando, F.; Bocchi, S. Forecasting Agroforestry Ecosystem Services Provision in Urban Regeneration Projects: Experiences and Perspectives from Milan. Sustainability 2021, 13, 2434. [Google Scholar] [CrossRef]
  32. Li, C.; Wang, R.; Zhang, F.; Luo, Y.; Huang, Y. Relationships between Ecosystem Services and Urbanization in Jiangsu Province, Eastern China. Sustainability 2019, 11, 2073. [Google Scholar] [CrossRef] [Green Version]
  33. Zhuang, S.; Xu, Y.; Xiong, J.; Liu, S. Transformation of Master Planning in Super-large Cities: Practice and Exploration of the New Round of City Planning in Shanghai. Urban Plan. Forum 2017, 2, 10–19. (In Chinese) [Google Scholar]
  34. Liu, S.; Zhang, X.; Feng, Y.; Xie, H.; Jiang, L.; Lei, Z. Spatiotemporal Dynamics of Urban Green Space Influenced by Rapid Urbanization and Land Use Policies in Shanghai. Forests 2021, 12, 476. [Google Scholar] [CrossRef]
  35. Shi, Y.; Tao, T.; Cao, X.; Pei, X. The association between spatial attributes and neighborhood characteristics based on Meituan take-out data: Evidence from shanghai business circles. J. Retail. Consum. Serv. 2021, 58, 102302. [Google Scholar] [CrossRef]
  36. Miller, J.D.; Hess, T. Urbanisation impacts on storm runoff along a rural-urban gradient. J. Hydrol. 2017, 552, 474–489. [Google Scholar] [CrossRef] [Green Version]
  37. Qaro, S.; Akrawee, Z. ASSESSMENT OF CARBON STORAGE AND SEQUESTRATION BY USING I-TREE PROGRAM FOR ATRUSH FOREST/NORTH OF IRAQ. Iraqi J. Agric. Sci. 2020, 51, 72–85. [Google Scholar]
  38. Cimburova, Z.; Barton, D.N. The potential of geospatial analysis and Bayesian networks to enable i-Tree Eco assessment of existing tree inventories. Urban For. Urban Green. 2020, 55, 126801. [Google Scholar] [CrossRef]
  39. Jonsson, M.; Bengtsson, J.; Gamfeldt, L.; Moen, J.; Snäll, T. Levels of forest ecosystem services depend on specific mixtures of commercial tree species. Nat. Plants 2019, 5, 141–147. [Google Scholar] [CrossRef]
  40. Gamfeldt, L.; Snäll, T.; Bagchi, R.; Jonsson, M.; Gustafsson, L.; Kjellander, P.; Ruiz-Jaen, M.C.; Fröberg, M.; Stendahl, J.; Philipson, C.D.; et al. Higher levels of multiple ecosystem services are found in forests with more tree species. Nat. Commun. 2013, 4, 1340. [Google Scholar] [CrossRef]
  41. Mitchell, R.J.; Hewison, R.L.; Haghi, R.K.; Robertson, A.H.J.; Main, A.M.; Owen, I.J. Functional and ecosystem service differences between tree species: Implications for tree species replacement. Trees 2021, 35, 307–317. [Google Scholar] [CrossRef]
  42. Shoda, T.; Imanishi, J.; Shibata, S. Growth characteristics and growth equations of the diameter at breast height using tree ring measurements of street trees in Kyoto City, Japan. Urban For. Urban Green. 2020, 49, 126627. [Google Scholar] [CrossRef]
  43. Wang, X.; Cheng, H.; Xi, J.; Yang, G.; Zhao, Y. Relationship between Park Composition, Vegetation Characteristics and Cool Island Effect. Sustainability 2018, 10, 587. [Google Scholar] [CrossRef] [Green Version]
  44. Han, Y. On the Selection of Tree Species in the Construction of Urban Boulevard in Shanghai. Chin. Landsc. Archit. 2019, 35 (Suppl. 2), 80–83. (In Chinese) [Google Scholar]
  45. Roy, S.; Byrne, J.; Pickering, C. A systematic quantitative review of urban tree benefits, costs, and assessment methods across cities in different climatic zones. Urban For. Urban Green. 2012, 11, 351–363. [Google Scholar] [CrossRef] [Green Version]
  46. Salmond, J.A.; Tadaki, M.; Vardoulakis, S.; Arbuthnott, K.; Coutts, A.; Demuzere, M.; Dirks, K.N.; Heaviside, C.; Lim, S.; MacIntyre, H.; et al. Health and climate related ecosystem services provided by street trees in the urban environment. Environ. Health 2016, 15, S36. [Google Scholar] [CrossRef] [PubMed] [Green Version]
  47. Cheng, X.; Wang, T. Shanghai Garden History; Shanghai Academy of Social Sciences Press: Shanghai, China, 2000. (In Chinese) [Google Scholar]
  48. Bureau, S.L.a.C.A.A. Shanghai Avenue; Shanghai People’s Publishing House: Shanghai, China, 2016. (In Chinese) [Google Scholar]
  49. Intasen, M.; Hauer, R.J.; Werner, L.P.; Larsen, E. Urban Forest Assessment in Bangkok, Thailand. J. Sustain. For. 2016, 36, 148–163. [Google Scholar] [CrossRef]
  50. Park, J.H.; Baek, S.G.; Kwon, M.Y.; Je, S.M.; Woo, S.Y. Volumetric equation development and carbon storage estimation of urban forest in Daejeon, Korea. For. Sci. Technol. 2018, 14, 97–104. [Google Scholar] [CrossRef] [Green Version]
  51. Rajoo, K.S.; Karam, D.; Abdu, A.; Rosli, Z.; Gerusu, G.J. Urban Forest Research in Malaysia: A Systematic Review. Forests 2021, 12, 903. [Google Scholar] [CrossRef]
  52. Lv, H.; Wang, W.; He, X.; Xiao, L.; Zhou, W.; Zhang, B. Quantifying Tree and Soil Carbon Stocks in a Temperate Urban Forest in Northeast China. Forests 2016, 7, 200. [Google Scholar] [CrossRef] [Green Version]
  53. Nowak, D.J.; Greenfield, E.J. US Urban Forest Statistics, Values, and Projections. J. For. 2018, 116, 164–177. [Google Scholar] [CrossRef]
  54. Wang, X.; Wang, Y.; Qu, X.; Huang, B.; Li, Z.; Sun, J.; Wei, X.; Yang, X. Urban trees in university campus: Structure, function, and ecological values. Environ. Sci. Pollut. Res. 2021, 28, 45183–45198. [Google Scholar] [CrossRef] [PubMed]
  55. Siedlarczyk, E.; Winczek, M.; Zięba-Kulawik, K.; Wężyk, P. Smart green infrastructure in a smart city–the case study of ecosystem services evaluation in krakow based on i-Tree eco software. GeoSci. Eng. 2019, 65, 36–43. [Google Scholar] [CrossRef]
  56. Riondato, E.; Pilla, F.; Basu, A.S.; Basu, B. Investigating the effect of trees on urban quality in Dublin by combining air monitoring with i-Tree Eco model. Sustain. Cities Soc. 2020, 61, 102356. [Google Scholar] [CrossRef]
  57. Nowak, D.J.; Crane, D.E.; Stevens, J.C.; Hoehn, R.E.; Walton, J.T.; Bond, J. A ground-based method of assessing urban forest structure and ecosystem services. Aboriculture Urban For. 2008, 34, 347–358. [Google Scholar]
  58. Pataki, D.E.; Carreiro, M.M.; Cherrier, J.; Grulke, N.E.; Jennings, V.; Pincetl, S.; Pouyat, R.V.; Whitlow, T.H.; Zipperer, W.C. Coupling biogeochemical cycles in urban environments: Ecosystem services, green solutions, and misconceptions. Front. Ecol. Environ. 2011, 9, 27–36. [Google Scholar] [CrossRef]
  59. Krellenberg, K.; Artmann, M.; Stanley, C.; Hecht, R. What to do in, and what to expect from, urban green spaces—Indicator-based approach to assess cultural ecosystem services. Urban For. Urban Green. 2021, 59, 126986. [Google Scholar] [CrossRef]
  60. Liu, J.; Slik, F. Are street trees friendly to biodiversity? Landsc. Urban Plan. 2021, 218, 104304. [Google Scholar] [CrossRef]
Figure 1. The location in the world map.
Sustainability 13 13251 g001
Figure 2. Research scope map.
Sustainability 13 13251 g002
Figure 3. Detailed survey sample map.
Sustainability 13 13251 g003
Figure 4. Research flow chart.
Sustainability 13 13251 g004
Figure 5. Analysis of the proportion of tree species in each street: (ac) geospatial analysis diagrams, and (d) doughnut chart.
Sustainability 13 13251 g005
Figure 6. Analysis of the basic characteristics of trees in various streets (ac) geospatial analysis diagrams, and (d) bar chart.
Sustainability 13 13251 g006
Figure 7. Value analysis of the low-carbon contribution of different tree species.
Sustainability 13 13251 g007
Figure 8. Correlation analysis of other attributes of trees for the low-carbon contribution of street trees.
Sustainability 13 13251 g008
Figure 9. Analysis of the low-carbon contribution of street trees: (ac) geospatial analysis diagrams, and (d) bar chart.
Sustainability 13 13251 g009
Table 1. Related research of ecosystem services of street trees based on low-carbon targets.
Related ResearchMain Points
Street tree ecosystem services and low-carbon value classificationStreet trees can directly affect the carbon cycle through carbon fixation and can also reduce carbon emissions by reducing the consumption of resources and energy through environmental governance, including runoff regulation and air purification.
Estimation methods and estimation indicatorsThe estimation methods, in the main, include the actual biomass measurement method and the growth model estimation method, which mainly focus on the direct carbon fixation value of street trees but ignore the indirect carbon reduction value of the regulation function.
Factors influencing the low-carbon value of street treesMainly include the characteristics of trees themselves, climatic and environmental conditions, and human interference. However, human disturbance may be the main factor in the heterogeneity of the low-carbon contribution of street trees in the urban–suburban gradient. Therefore, it is necessary to focus on this.
Table 2. Data source.
Database NameData SourcesNumber of Road SectionsNumber of TreesSurvey Time
Self-measured databaseTeam survey41 road sections1352 trees2021
SMLMIS databaseShanghai Municipal Landscape Management and Instruction Station3753 road sections174,919 trees2019
Table 3. Format of the survey data sheet.
IDSpeciesDBH (cm)Total Height (m)Crown: Top Height (m)Crown: Base Height (m)Crown: Width N/S (m)Crown: Width E/W (m)Crown: % DiebackCrown: % MissingCrown: Light ExposureUtility Conflict
1London plane tree34.3 9.5 9.5 4.0 5.0 5.0 1–5%1–5%5 sidesNo lines
2Camphor tree22.7 8.5 8.0 3.5 5.0 4.5 15–20%5–10%5 sidesNo lines
Table 4. Brief planting history of street trees in Shanghai.
TimeHistory
1865Shanghai began planting street trees.
1950sTo rapidly plant native tree species, poplar and arrow-dried poplar were planted on many roads. However, it was later discovered that this leads to high cultivating and flower labor, high costs, and a poor greening effect, and they were gradually eliminated in the early 1970s.
1970sPractice has proven that London plane tree has the advantages of fast growth, long life, pruning resistance, a large crown, and high transplant survival rate. Shanghai changed the street tree species and gradually began to use London plane tree as the main street tree and camphor trees as the supplement, along with multiple auxiliary tree species.
21st centuryIn light of the cultivation of new tree species, some other tree species were planted.
Table 5. Urban–suburban street tree characteristics and low-carbon contribution changes.
Characteristics and Low-Carbon ContributionsChanges from Urban to Suburban Areas
SpeciesThe main tree species gradually changed from London plane tree to camphor trees
Tree sizesApproximately exhibit a gradually decreasing trend
Planting number per unit road lengthObvious trend from small to big
Planting quantity per unit areaObvious trend from big to small
Average low-carbon contributionApproximately exhibit a gradually decreasing trend
Low-carbon contribution per unit road lengthObvious trend from small to big
Low-carbon contribution per unit areaObvious trend from big to small
Publisher’s Note: MDPI stays neutral with regard to jurisdictional claims in published maps and institutional affiliations.

