Article

A Vertical Joint Spacing Calculation Method for UDEC Modeling of Large-Scale Strata and Its Influence on Mining-Induced Surface Subsidence

1
School of Environment Science and Spatial Informatics, China University of Mining and Technology, Xuzhou 221116, China
2
State Key Laboratory for Geomechanics and Deep Underground Engineering, Xuzhou 221116, China
*
Author to whom correspondence should be addressed.
Sustainability 2021, 13(23), 13313; https://doi.org/10.3390/su132313313
Submission received: 7 October 2021 / Revised: 5 November 2021 / Accepted: 30 November 2021 / Published: 1 December 2021

Abstract

:
While universal discrete element code (UDEC) is widely used for understanding the mechanism of large-scale strata movement and the effects of mining subsidence on the environment, the fundamental knowledge of how to set vertical joint spacing (VJS) in UDEC is still not fully understood. To address the knowledge gap, we first present a novel VJS calculation method, then conduct UDEC experiments, and finally compare the predictions of UDEC models with field subsidence observation. The results suggest the following: (1) when compared to the conventional VJS setting (1× to 3× bed thickness), the maximum surface subsidence (MSS) prediction via UDEC models based on our proposed VJS setting method is closer to field observation; (2) a smaller but varying VJS setting can also have the effect of a larger VJS setting; and (3) with the increase in VJS, MSS first drops, then rises, and reaches the minimum when VJS is set at approximately 7× bed thickness. This paper provides an explanation of the VJS setting in UDEC and establishes a bridge between the KS theory and VJS, which is helpful for the sustainable development of such an UDEC modeling strategy and for a better understanding of the influences of mining subsidence on the environment in mining-affected areas.

1. Introduction

Underground coal mining causes the deformation and movement of overlying strata and eventually leads to ground surface subsidence or cracking, which affects our living environment and the sustainable development of coal industries [1,2]. The discrete element commercial software UDEC is extensively used for understanding the mechanism behind strata movement and to predict surface subsidence more directly and realistically. However, the knowledge of how to establish a sound UDEC model especially involving discontinuity parameters is not entirely understood and merits further study.
In the UDEC modeling process of large-scale strata, it is difficult to construct detailed discontinuities such as joints and cracks of different directions and scales, mainly due to the following two reasons: (1) under the constraints of UDEC software algorithms and computer computing power, simulating a large number of joints will lead to extremely long calculation times; (2) under the current technology level of geological exploration, the detailed spatial distribution of discontinuities cannot be given. In such a case, the modeling idea of equivalent joint (i.e., simplified or fictitious joint) is popular [3,4,5,6]. Specifically, researchers often use a horizontal joint to simulate the bedding plane and use evenly spaced vertical joints (ESVJs) that are perpendicular to the bedding plane and run through the entire rock bed to simulate the phenomenon of stratum fracture. It should be mentioned that, in the field, although vertical joints (also called cross joints) [7,8] may actually exist in some strata in local, they are not always perpendicular to bedding planes and are not always run through the entire rock bed [9,10,11]. More commonly, they have limited length and intersect bedding planes at different angles in terms of their sedimentary environment and geological history. In addition, the spacing between vertical joints varies greatly from one place to another; some researchers [12,13,14,15] suggest that the spacing is proportional to bed thickness and the ratio of joint spacing to bed thickness may range from 0.77 to 100 as reported in literatures [16,17].
To be clear, the ESVJs are used to comprehensively characterize the cross joints of different directions and scales in the field; it is not necessarily a real existence but a simulation strategy in the context of large-scale modeling to achieve a balance between calculation time and simulation effects. Therefore, vertical joint spacing (VJS) will play a decisive role in determining the length of the fractured rock mass. If the VJS is too large, the actual broken stratum cannot be reflected in simulations in time; if the VJS setting is too small, the simulated stratum may break prematurely. Apparently, the setting of VJS determines the shape of the overburden structure to a certain extent and ultimately affects the degree of surface subsidence, whereas such effects have not been understood.
In practical, it is very common to use ESVJs to simulate large-scale strata movement. For example, Zhang et al. [18] built a UDEC model with dimensions of 800 m × 280 m for revealing the overburden failure characteristics in the case of a special mining and geological condition. Li et al. [19] constructed a UDEC model with dimensions of 850 m × 100 m for analyzing the influence of key stratum on mine pressure in the case of top-coal caving face with super great mining height. Zhang et al. [20] built a UDEC model with dimensions of 2200 m × 550 m for evaluating the fracture development around river valleys. The value of the VJS in the above and many other studies [18,19,20,21,22,23,24,25,26,27,28,29,30] is between 1× to 3× bed thickness, but how the VJS was determined is still not clear and there is no related literature that clearly explains the determination process. To the best of the authors’ knowledge, practical experiences and subjective tendencies often play a leading role, which makes it impossible to compare between different UDEC models involving different engineering cases and limits the sustainable development of such UDEC modeling strategy.
In this study, we first proposed a method for calculating the VJS on the basis of the Key Stratum theory and the “Three-Zones” theory, which provides a direct explanation on how to set up the VJS in UDEC when modeling large-scale strata movement and therefore is beneficial for the continuous progress of such modeling strategy. The proposed method is then applied to a specific UDEC model based on the Ying-Pan-Hao coal mine, while other UDEC models with the VJS varying from 0.5× to 1000× bed thickness were also built (see Section 3) as a control group and for fundamental understandings of how the VJS influences surface subsidence prediction. Finally, the effectiveness of the proposed method was evaluated by comparing the difference between field observations and predictions in Section 4.

2. Methods

2.1. General Description

With the ongoing extraction of underground coal resources, the stress field of overburden will also be dynamically redistributed. During this process, the overlying rock bed failure starts at the weakest part where stress concentration exceeds its strength and then propagates in the least resistance path or, in other words, along the discontinuities (either a predominate one or a set of mircojoints). Recall that, in the field, the discontinuities between bedding planes have different lengths, directions, and persistence, and that ESVJs as a kind of fictitious joints were used to comprehensively characterize these discontinuities for large-scale modeling. Then, it seems that the major function of the vertical joints (VJs) are to mark the potential fracture locations of the overlying strata so as to simulate the fracture phenomenon of rock beds because, if not, they lose their physical meaning. More specifically, if they are not marking the potential fraction locations, they must indicate the real joints or need another theory to explain the meaning of setting up such fictious joints. Since there is no related theory in this regard for now and the real existence of ESVJs in the field is very rare as we have stated in the Introduction, we believe that assuming the vertical joint spacing (VJS) is essentially the same as the length of broken block in the Key Stratum theory [31] should be reasonable. In the following, we elaborate the method for calculating VJS by adding an additional hypothesis to the KS theory, and the effect of “Three-Zones” theory on VJS setting is also discussed.
Moreover, we must stress that the above analyses do provide an explanation for the setting of ESVJs. Although it may not be perfect, it is helpful for the sustainable development of such UDEC modeling strategy.

2.2. Determining VJS Based on the Key Stratum Theory

The Key Stratum (KS) theory is proposed by Qian [31] and is widely accepted by researchers, which emphasizes that hard rock layers play a key role in the control of movement and the deformation of overburden. While KS theory is a big leap for understanding the possible overburden structure after coal mining, the load acting on the stratum between two adjacent key strata is not specified, which results in only the VJS of key stratum being available. Rather, the VJS of the remaining rock layers is still not clear. Here, we present a direct calculation method for solving this knowledge gap as elaborated below.
As shown in Figure 1, we presume that there are M layers strata above a coal seam, and denote their thickness, volume force, elastic modulus, and tensile strength as h i , γ i , E i , and T i , respectively, where 1 i M . According to the composite beam used in KS theory, the load ( q n ) 1 borne by the first layer of an n layers composite beam is given as:
( q n ) 1 = E 1 h 1 3 i = 1 i = n γ i h i j = 1 j = n E j h j 3
The first step of our proposed method is consistent with the step of identifying potential key stratum in KS theory, i.e., looking for the hard rock layers in the overburden and specifically to determine if Equation (2) is true. If so, the rock layer n + 1 can be considered as a potential key stratum, and then by making the layer n + 1 the new first layer, we can reuse Equation (2) to find all potential key strata:
( q n + 1 ) 1 < ( q n ) 1
Supposing that we have obtained N1 potential key strata, and one of them is numbered n i with the corresponding load q n i , where n i represents the layer n i and 1 i N 1 . Equation (3) can then be used for calculating the breaking distance l n i (i.e., VJS), where Equation (3) is derived under the condition of a fixed beam at both ends:
l n i = h n i 2 T n i q n i
l n i < l n i + 1
In KS theory, the potential key strata also need to meet the condition that the breaking distance of the lower one is smaller than that of the upper one (see Equation (4)). Otherwise, all the rock loads controlled by the upper one need to be applied to the lower one, and then the breaking distance of the lower one is recalculated until all key strata are determined, i.e., Equation (4) holds for all potential key strata. Apparently, KS theory still does not describe the calculation method of the breaking distance of the rock layers between two adjacent key strata. Here, we add an additional hypothesis to solve this problem. Supposing that we have obtained N2 key strata, and one of them is numbered k i with the corresponding load q k i , where k i represents the layer k i of the overburden and 1 i N 2 . The number of the rock layers controlled by layer k i can therefore denote as N 3 = k i + 1 k i 1 . When the layer k i is broken, the N 3 + 1 layers composite beam with layer k i as its first layer can then be regarded as an N3 layers composite beam with layer k i + 1 as the first layer, as shown in Figure 2.
Hence, the load acting on layer k i + 1 is given as:
( q N 3 ) k i + 1 = E k i + 1 h k i + 1 3 i = k i + 1 i = N 3 γ i h i j = k i + 1 j = N 3 E j h j 3
By analogy, we can obtain the load acting on the layer k i + j ( j < N 3 ) as:
( q N 3 j ) k i + 1 + j = E k i + 1 + j h k i + 1 + j 3 m = k i + 1 + j m = N 3 j γ m h m n = k i + 1 + j n = N 3 j E n h n 3
Collectively, the load of every rock layer can be determined, and by introducing it into Equation (3), their VJS can be directly and clearly calculated.

2.3. VJS Setting Based on the “Three-Zones” Theory

The “Three-Zones” theory [32] is also widely accepted by researchers, which divides the overburden into three zones: caved zone, fracture zone, and continuous deformation zone. Basically, the caved zone is a space where roof rocks collapsed and piled together after coal mining; the fracture zone is a space where strata have been separated or fractured but still can form a certain balanced structure without collapse; and the continuous deformation zone is a space where only bending deformation occurred. This suggests that it is not necessary to set up vertical joints in the continuous deformation zone since there is no stratum fracture, which is helpful to reduce modeling complexity and calculation time, especially for deep mining, where large amounts of joints are involved. However, the impact of such a setting on the prediction of surface subsidence remains unclear. In this paper, we first set up vertical joints in full modeling space to determine the characteristic of three zones, then build a same model with vertical joints in continuous deformation zone removed and re-execute the simulation process to observe the impacts on surface subsidence.

3. Engineering Background and UDEC Models

3.1. Modeling Prototype and Field Subsidence Observation

Our UDEC experiments are based on the Ying-Pan-Hao (YPH) coal mine located in the Wu-Shen banner of China’s Inner Mongolia province. As shown in Figure 3, there are several boreholes around the 2201 panel, of which K82 and K83 are obviously the most representative, and there are 163 observation stations along and vertical the mining direction for surface subsidence measurement. The 2201 panel is the first mining panel of the YPH coal mine with no buildings or structures on the ground surface, which ensures the reliability of surface subsidence measurements. Its mining length, working face length, average coal thickness, and average depth are 2500 m, 300 m, 6.5 m, and 730 m, respectively. We list the strata information revealed by boreholes K82 and K83 in Table 1 and Table 2, and more details of the mining and geological conditions of the YPH coal mine can be found in Gong and Guo [33]. Maximum surface subsidence was recorded to 411 mm after mining the 2201 panel, and additional comments will be made when discussing the differences between field subsidence observation and results predicted by UDEC models (Section 4).

3.2. UDEC Models and Setup

We built a total of 48 UDEC models, half of which are K82-based models (scenario 1), and the other half are K83-based models (scenario 2). We take scenario 1 as an example to explain the experimental process and setup. According to Table 1, we first built 11 UDEC models with the VJS set at 0.5×, 1×, 2×, 3×, 4×, 5×, 6×, 7×, 8×, 9×, and 1000× bed thickness, respectively, in order to study the influence of the VJS on surface subsidence. We also built a special UDEC model with the VJS calculated via the equations in Section 2.1 for comparison with the aforementioned models. We then conducted UDEC simulations to obtain the ranges of the “Three-Zones” and built another 12 UDEC models with vertical joints removed in the continuous deformation zone (e.g., Figure 4) to study the influence of the “Three-Zones” theory on surface subsidence. The VJS in coal seams is constant to ensure that the excavation range in all models is exactly the same. All models have the same dimension of 1902.8 m × 724.4 m, the same boundary condition with left, right, and bottom sides fixed (see Figure 5), and the same constitutive model (Mohr–Coulomb model for rock mass and Coulomb slip model for joints). For evenly spaced vertical joints (ESVJs), the position of the first vertical joint from the left boundary determines the position of the following vertical joints. In all models, we set ESVJs with the left boundary as the starting position to ensure that there is no manual manipulation of the joint position. The rock mass properties used here were calibrated in the previous study [33] and are shown in Figure 6 and Figure 7.

4. Results and Discussion

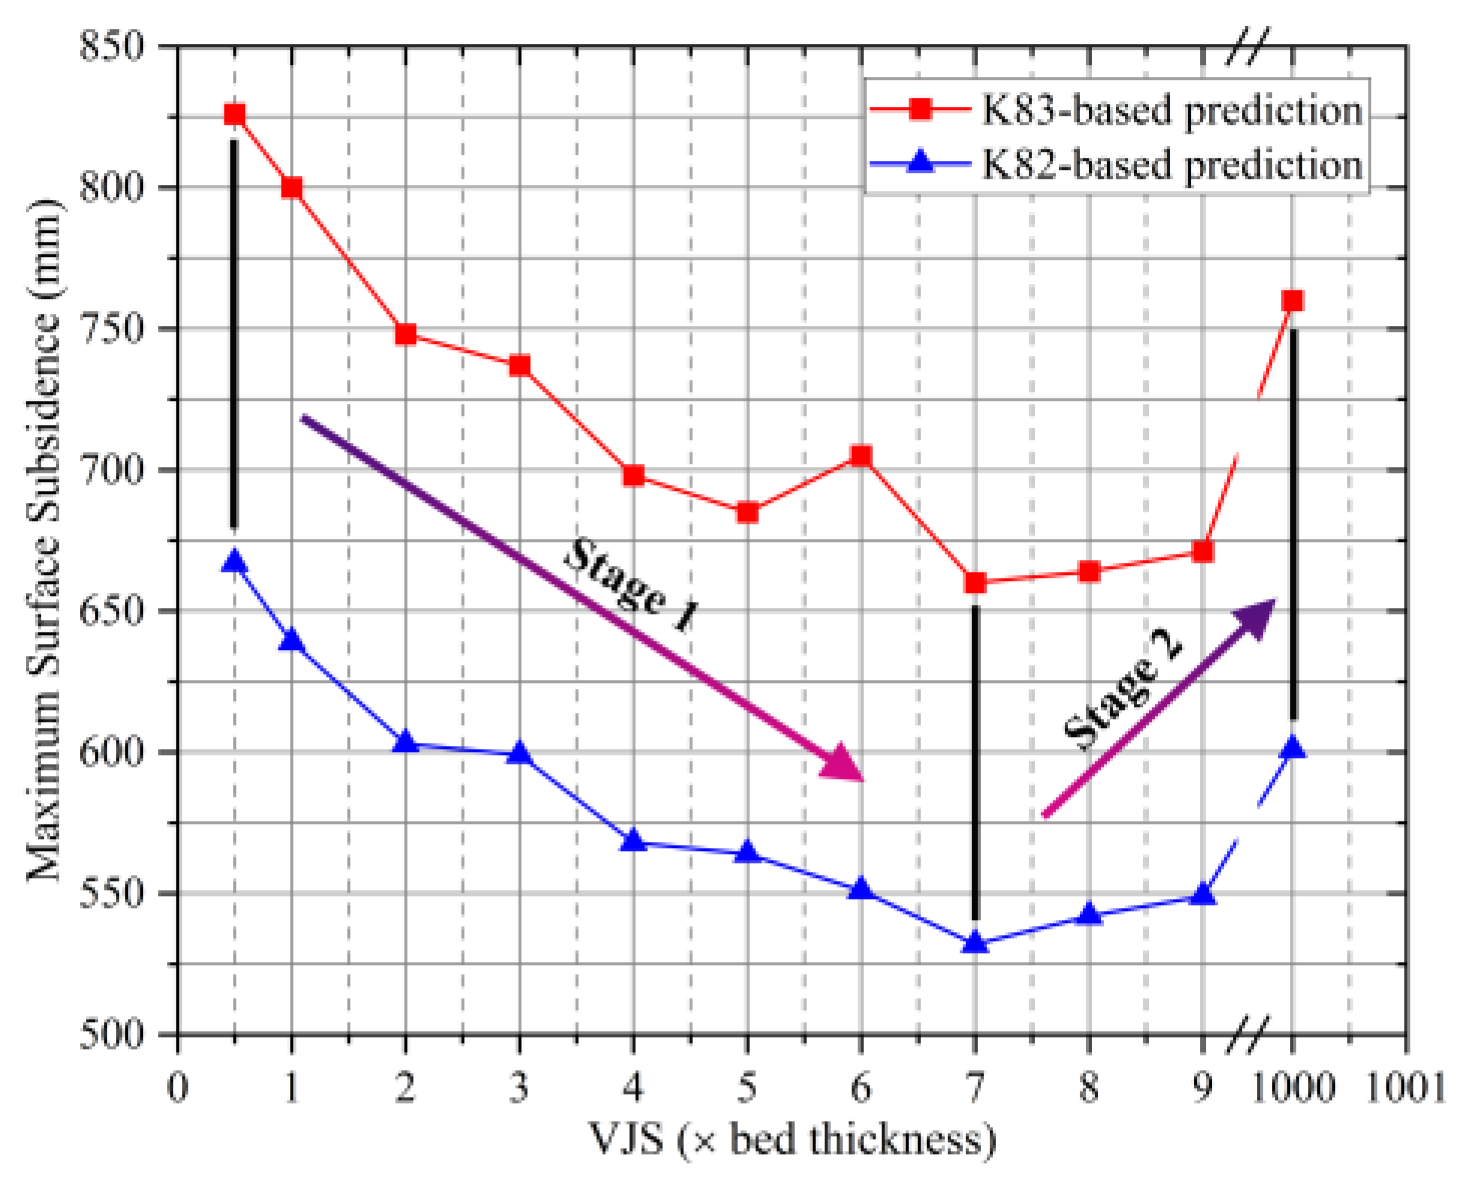
4.1. Influence of VJS on Maximum Surface Subsidence

Based on the methodology and engineering background elaborated above, we simulate the mining process of the 2201 panel, record the maximum surface subsidence (MSS) of different scenarios (K83-based models and K82-based models), and present them in Figure 8.
We found that, in general, the MSS predicted by the UDEC models based on borehole K83 is larger than that based on borehole K82, which is mainly because the thickness and lithology of the stratum were revealed by different boreholes, and the mechanical properties used in different models vary. This suggests that a 3DEC (3D Discrete Element Code) model is needed to incorporate all strata data into one model so as to improve the accuracy of predictions, which, as a consequence, will also lead to an extremely complex modeling process and long calculation time and merits further study.
We also found that, with the increase in the VJS, the MSS first drops (stage 1), then rises (stage 2), and reaches the minimum at 7× bed thickness for both scenarios, which is significant because it is different from the intuition that MSS will continue to decrease as the VJS increases. Here, we explain this phenomenon as illustrated in Figure 9, where we can see that the length of the cantilever beam [34] in Figure 9b is much longer than that in Figure 9a, which well reduces the space for overburden to further overhang and collapse. We also note that the length of the cantilever beams in Figure 9d,e are almost the same, but due to the different VJS settings, the patterns of masonry beam [29,35,36] formed in Layer 31 vary. Specifically, the denser vertical joints in Figure 9d lead to greater subsidence of Layer 31, which in turn provides the overlying strata more space for deformation. Collectively, if we consider this from the perspective of a compressive arch [34], then we see that, with the increase in VJS setting, the earlier formation of compressive arch structure reduces deformation space, which explains the mechanism of stage 1. For stage 2, we consider an extreme case where the VJS is equal to 1000 times bed thickness (see Figure 9c,f). Then, we imagine that Figure 9c,f are transformed from Figure 9b,e, respectively. In other words, the rocks that have collapsed and fractured return to their original positions with bending and separation, and the only difference before and after this transformation is that the compressive arch structure in Figure 9c,f bear more rock loads that have been released in Figure 9b,e, which results in the greater subsidence and explains the mechanism of stage 2.
More importantly, the UDEC models corresponding to Figure 9c,f are very similar to FLAC2D or FLAC3D models where no vertical joints are set in abundant literatures [37,38,39,40,41,42,43,44,45], which suggests that when predicting the surface subsidence using FLAC2D or FLAC3D, the surface subsidence could be overestimated due to the fact that the collapse of roof strata above a coal seam cannot be effectively simulated [46].

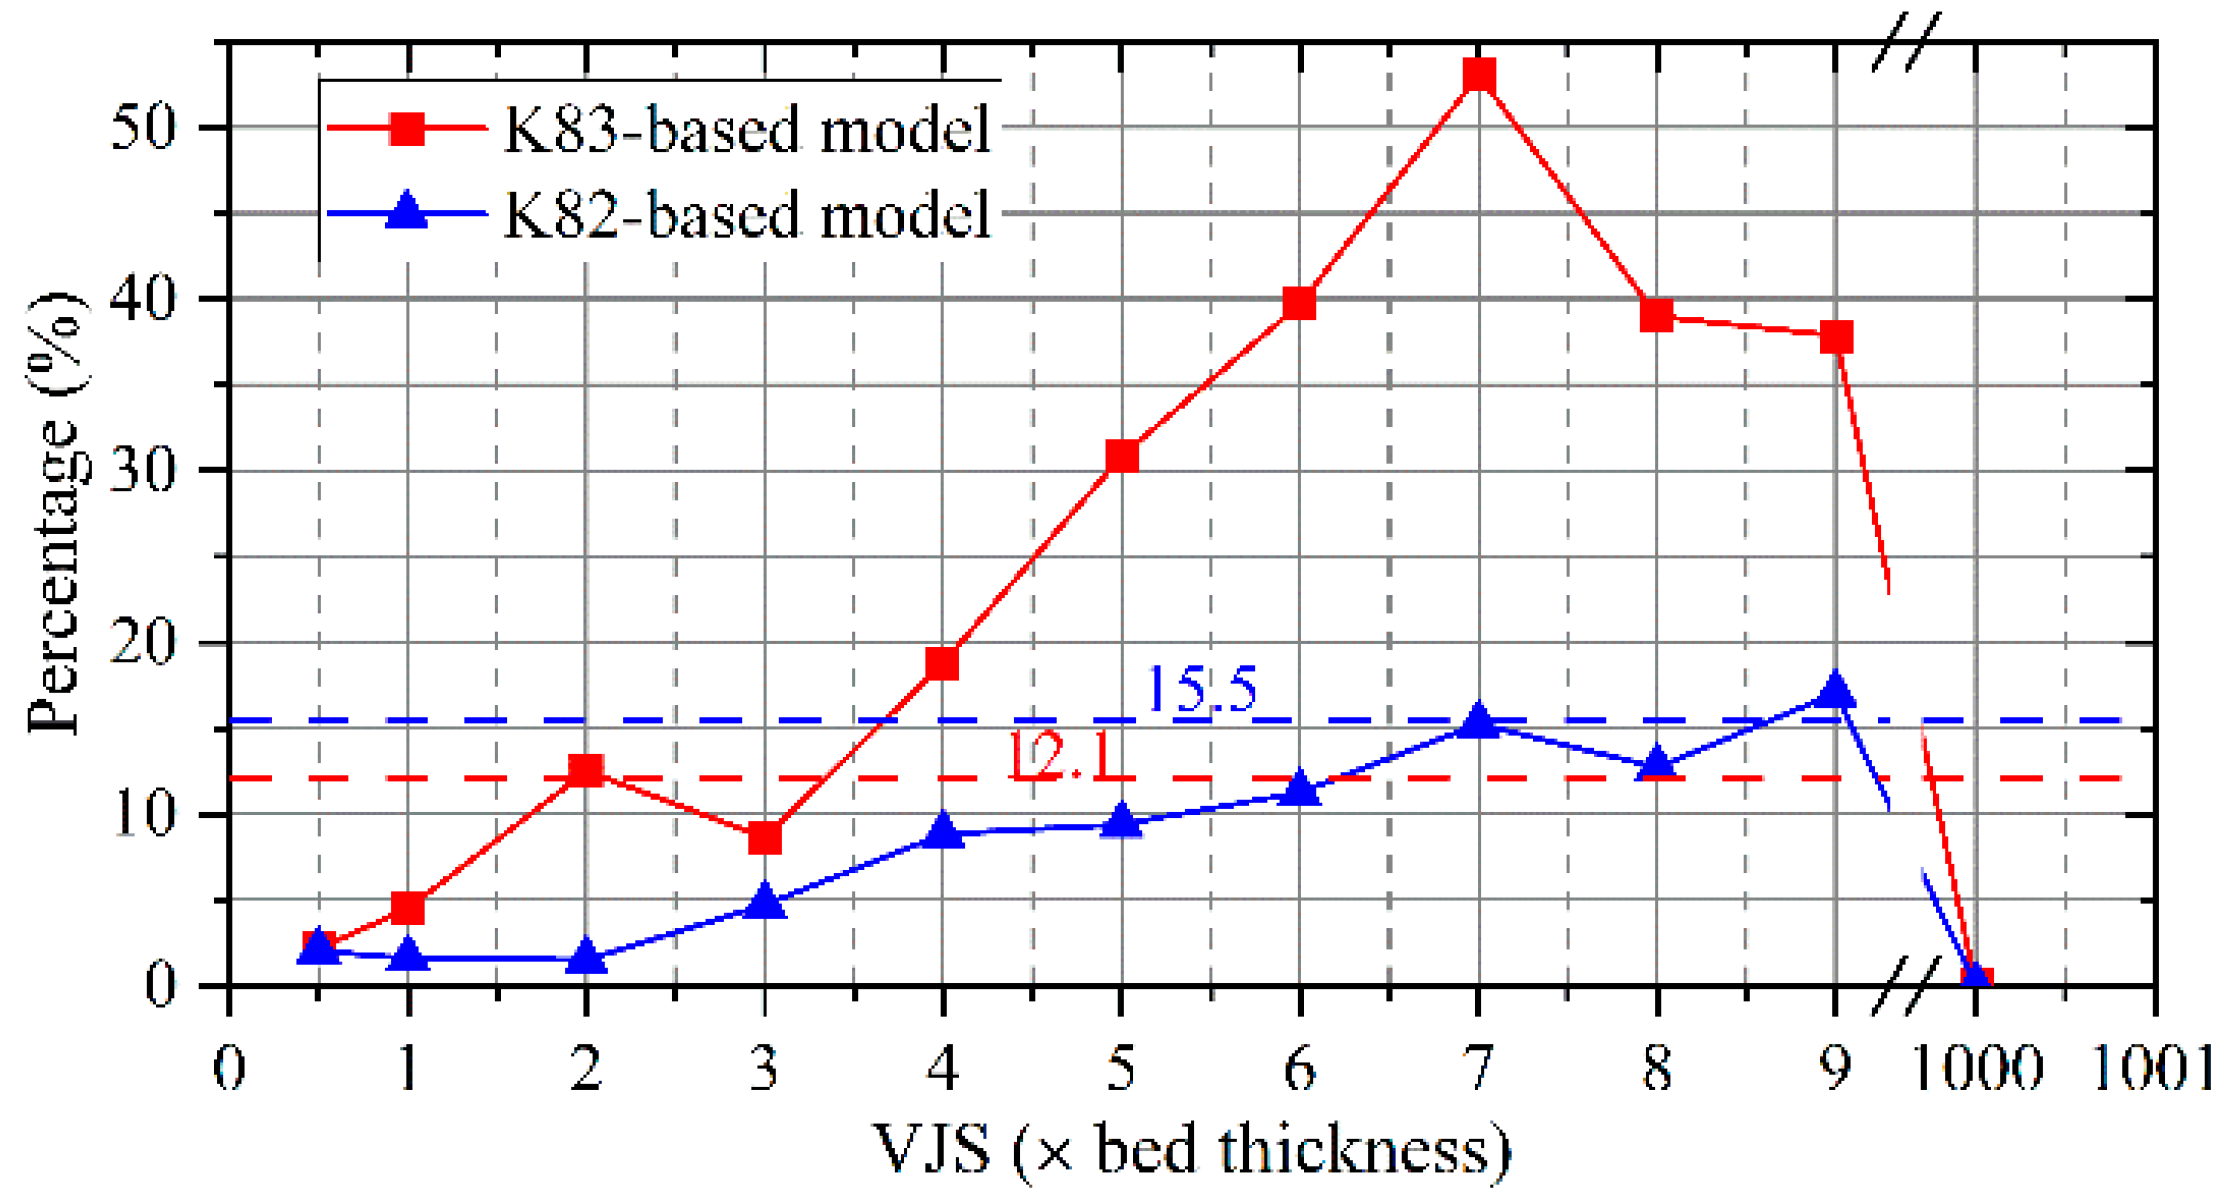
4.2. Influence of the Proposed Method on MSS

Regarding the influence of our proposed VJS calculation method on MSS, we can see (Figure 10) that, in K83-based models, the MSS (714 mm) predicted by our proposed model is between the values predicted by models with VJS setting at 3× bed thickness and 4× bed thickness, while in K82-based models, that (567 mm) is between the values predicted by models with the VJS setting at 4× and 5× bed thickness. If we consider that in abundant literatures the VJS is set between 1× and 3× bed thickness and the observed MSS in the YPH coal mine is 411 mm, then we can conclude that the prediction by our proposed model is better because it is closer to the field observation. More importantly, we can see (Figure 11) that the VJS based on the proposed method varies in different strata and is no more than 3× bed thickness in most thick beds, suggesting that a smaller but varying VJS setting can also have the effect of a larger VJS setting in large-scale UDEC simulations. We also note that K82-based and K83-based models with the VJS set at 4× to 9× bed thickness achieved smaller MSS predictions, which are closer to field observation, but such a large VJS setting has no precedent and runs counter to the breaking distance of rock roof in the YPH coal mine.
In addition, it should be mentioned that the observed MSS in the YPH coal mine was recorded right after mining the 2201 panel, and further surface subsidence will occur afterward and account for 15% of the total subsidence according to He et al. [47]. Therefore, the final MSS may reach 483 mm, which suggests that the K82-based UDEC model is more representative for the 2201 panel. We note that the subsidence values (567 mm and 714 mm) obtained via the UDEC models still have a certain gap with the field observation (483 mm), suggesting that mining subsidence is a complex phenomenon that is unlikely to be accurately explained by UDEC models based on a single borehole and that a data-intensive UDEC model that considers many other factors, such as modeling based on multiple boreholes, is needed and merits further study.

4.3. Influence of “Three-Zones” Theory on MSS

Regarding the influence of the “Three-Zones” theory on MSS, we can see (Figure 12) that in K83-based models considering the “Three-Zones” theory, the MSS is slightly smaller when the VJS is set at 0.5× to 1× bed thickness, is larger when the VJS is set at 2× to 9× bed thickness, and is the same when the VJS is set at 1000× bed thickness. Similar relationships can be found in K82-based predictions. For models based on our proposed method, a larger MSS prediction can also be observed. Since the VJS is set larger than 1× bed thickness in abundant literatures, we can conclude that removing vertical joints in the continuous deformation zone will result in the MSS increasing.
We also note that, with the increase in the VJS, the MSS difference before and after removing vertical joints in the continuous deformation zone basically first increases and then decreases in both scenarios. We further calculate this difference and compare it with the error between measured and predicted MSS to get the percentage of its influence on the total error, as shown in Figure 13. We can see that, when the VJS is set to less than 1× bed thickness, the influence of the “Three-Zones” theory is considered to be very small, less than 5%, which we believe is acceptable because removing vertical joints in a continuous deformation zone will greatly reduce joints number, thereby reducing the complexity of modeling and saving calculation time, especially considering that a small VJS setting will produce a large number of joints in the case of deep coal mining. We also note that, for our proposed VJS setting method, the influence of the “Three-Zones” theory can reach 12.1% to 15.5%, which we believe is not acceptable because when the VJS is large (e.g., more than 3× bed thickness), the influence may be great, as shown in Figure 13, especially considering that the VJS in each stratum often differs.

5. Summary and Conclusions

Recall that our objectives of this study were to gain knowledge of a clear and direct VJS calculation method for UDEC modeling of large-scale strata movement, and to better understand the influence of VJS on surface subsidence. Specifically, we proposed a novel VJS calculation method and conducted UDEC experiments. We find that with the increase in the VJS, the MSS first drops, then rises, and reaches the minimum approximately at 7× bed thickness. We find that when the VJS setting is extremely large, UDEC models are similar to FLAC models where no vertical joints are set. We thus suggest that surface subsidence predicted by FLAC2D or FLAC3D models could be overestimated. We also find that when compared to conventional VJS setting (1× to 3× bed thickness), the MSS predictions via UDEC models based on our proposed VJS setting method is closer to measurement and that a smaller but varying VJS setting can also have the effect of a larger VJS setting.
Regarding the influence of “Three-Zones” theory on MSS, we find that removing vertical joints in a continuous deformation zone will result in MSS increasing and that with the increase in the VJS, the MSS difference before and after removing vertical joints basically first increases and then decreases. We suggest not removing vertical joints in the continuous deformation zone when building UDEC models based on our proposed VJS calculation method and suggest removing them when the VJS setting is small (e.g., 0.5× to 1× bed thickness in this case).
Given the importance and extensive application of UDEC and also in the context of precision coal mining [48], a clear and direct VJS calculation method and a better understanding of influences of the VJS on surface subsidence, as discussed in this study, are necessary and important, which helps for the sustainable development of the UDEC modeling strategy of large-scale strata and for a better understanding of the influences of mining subsidence on the environment in mining-affected areas.

Author Contributions

Conceptualization, Y.G. and G.G.; methodology, Y.G.; software, G.Z.; validation, K.G., Q.D. and Y.G.; formal analysis, Y.G.; investigation, K.G.; resources, Q.D.; data curation, G.G.; writing—original draft preparation, Y.G.; writing—review and editing, G.G.; visualization, G.Z.; supervision, L.W.; project administration, L.W.; funding acquisition, G.G. All authors have read and agreed to the published version of the manuscript.

Funding

The study underlying this publication was sponsored by the Future Scientists Program of “Double First Class” of China University of Mining and Technology (Contract number 2019WLKXJ072).

Institutional Review Board Statement

Not applicable.

Informed Consent Statement

Not applicable.

Acknowledgments

The authors would like to thank the Priority Academic Program Development of Jiangsu Higher Education Institutions for support to this work, and the Advanced Analysis & Computation Center for the High-Performance Computer. Additionally, many thanks to three anonymous reviewers for their excellent suggestions on the manuscript.

Conflicts of Interest

The authors declare no conflict of interest.

References

  1. Guo, Q.; Guo, G.; Li, Y.; Wang, L.; Zhao, X. Stability evaluation of an expressway construction site above an abandoned coal mine based on the overlay and index method. Sustainability 2019, 11, 5163. [Google Scholar] [CrossRef] [Green Version]
  2. Guo, W.B.; Wang, H.S.; Dong, G.W.; Li, L. A case study of effective support working resistance and roof support technology in thick seam fully-mechanized face mining with hard roof conditions. Sustainability 2017, 9, 935. [Google Scholar] [CrossRef] [Green Version]
  3. Kulatilake, P.H.S.W.; Ucpirti, H.; Wang, S.; Radberg, G.; Stephansson, O. Use of the distinct element method to perform stress analysis in rock with non-persistent joints and to study the effect of joint geometry parameters on the strength and deformability of rock masses. Rock Mech. Rock Eng. 1992, 25, 253–274. [Google Scholar] [CrossRef]
  4. Shreedharan, S.; Kulatilake, P.H.S.W. Discontinuum–Equivalent Continuum Analysis of the Stability of Tunnels in a Deep Coal Mine Using the Distinct Element Method. Rock Mech. Rock Eng. 2016, 49, 1903–1922. [Google Scholar] [CrossRef]
  5. Huang, G.; Kulatilake, P.H.S.W.; Shreedharan, S.; Cai, S.; Song, H. 3-D discontinuum numerical modeling of subsidence incorporating ore extraction and backfilling operations in an underground iron mine in China. Int. J. Min. Sci. Technol. 2017, 27, 191–201. [Google Scholar] [CrossRef]
  6. Sherizadeh, T.; Kulatilake, P.H.S.W. Assessment of roof stability in a room and pillar coal mine in the U.S. using three-dimensional distinct element method. Tunn. Undergr. Space Technol. 2016, 59, 24–37. [Google Scholar] [CrossRef] [Green Version]
  7. Bai, T.; Maerten, L.; Gross, M.R.; Aydin, A. Orthogonal cross joints: Do they imply a regional stress rotation? J. Struct. Geol. 2002, 24, 77–88. [Google Scholar] [CrossRef]
  8. Bai, T.; Gross, M.R. Theoretical analysis of cross-joint geometries classification. J. Geophys. Res. 1999, 104, 1163–1177. [Google Scholar] [CrossRef]
  9. Dershowitz, W.S.; Einstein, H.H. Characterizing Rock Joint Geometry with Joint System Models. Rock Mech. Rock Eng. 1988, 21, 21–51. [Google Scholar] [CrossRef]
  10. Einstein, H.H.; Veneziano, D.; Baecher, G.B.; O’Reilly, K.J. The Effect of Discontinuity Persistence on Rock Slope Stability. Int. J. Rock Mech. Min. Sci. Geomech. Abstr. 1983, 20, 227–236. [Google Scholar] [CrossRef]
  11. Zhang, L.; Einstein, H.H. The planar shape of rock joints. Rock Mech. Rock Eng. 2010, 43, 55–68. [Google Scholar] [CrossRef]
  12. Narr, W.; Lerche, I. A Method for Estimating Subsurface Fracture Density in Core. Am. Assoc. Pet. Geol. Bull. 1984, 68. [Google Scholar] [CrossRef]
  13. Ladeira, F.L.; Price, N.J. Relationship between fracture spacing and bed thickness. J. Struct. Geol. 1981, 3, 179–183. [Google Scholar] [CrossRef]
  14. Huang, Q.; Angelier, J. Fracture spacing and its relation to bed thickness. Geol. Mag. 1989, 126, 355–362. [Google Scholar] [CrossRef]
  15. Price, N.J. Fault and Joint Development in Brittle and Semi-Brittle Rock; Pergamon Press: London, UK, 1966. [Google Scholar]
  16. Narr, W.; Suppe, J. Joint spacing in sedimentary rocks. J. Struct. Geol. 1991, 13, 1037–1048. [Google Scholar] [CrossRef]
  17. Narr, W. Fracture Density in the Deep Subsurface: Techniques with Application to Point Arguello Oil Field. Am. Assoc. Pet. Geol. Bull. 1991, 75, 1300–1323. [Google Scholar]
  18. Zhang, D.; Sui, W.; Liu, J. Overburden Failure Associated with Mining Coal Seams in Close Proximity in Ascending and Descending Sequences Under a Large Water Body. Mine Water Environ. 2018, 37, 322–335. [Google Scholar] [CrossRef] [Green Version]
  19. Li, M.; Zhang, J.X.; Huang, Y.l.; Gao, R. Measurement and numerical analysis of influence of key stratum breakage on mine pressure in top-coal caving face with super great mining height. J. Cent. South Univ. 2017, 24, 1881–1888. [Google Scholar] [CrossRef]
  20. Zhang, C.; Mitra, R.; Oh, J.; Canbulat, I.; Hebblewhite, B. Numerical analysis on mining-induced fracture development around river valleys. Int. J. Mining Reclam. Environ. 2018, 32, 463–485. [Google Scholar] [CrossRef]
  21. Qin, W.; Xu, J. Horizontal Subzone Characteristics and Methane Seepage. Adv. Civ. Eng. 2018, 2018, 9071578. [Google Scholar]
  22. Sun, Y.; Zuo, J.; Karakus, M.; Wen, J. A Novel Method for Predicting Movement and Damage of Overburden Caused by Shallow Coal Mining. Rock Mech. Rock Eng. 2020, 53, 1545–1563. [Google Scholar] [CrossRef]
  23. Xinjie, L.; Xiaomeng, L.; Weidong, P. Analysis on the floor stress distribution and roadway position in the close distance coal seams. Arab. J. Geosci. 2016, 9, 83. [Google Scholar] [CrossRef]
  24. Tian, C.; Liu, Y.; Yang, X.; Hu, Q.; Wang, B.; Yang, H. Development characteristics and field detection of overburden fracture zone in multiseam mining: A case study. Energy Sci. Eng. 2020, 8, 602–615. [Google Scholar] [CrossRef]
  25. Zhao, Y.; Wang, S.; Hagan, P.; Ren, L.; Zou, Z. Pressure-Arching Characteristics in Roof Blocks during Shallow Coal Mining. Adv. Civ. Eng. 2018, 2018, 6817059. [Google Scholar] [CrossRef]
  26. Wang, B.; Jiang, F.; Wang, C.; Zhang, B. Experimental Study on the Width of the Reasonable Segment Pillar of the Extremely Soft Coal Seam in the Deep Mine. Geotech. Geol. Eng. 2019, 37, 4947–4957. [Google Scholar] [CrossRef]
  27. Yang, D.; Guo, W.; Tan, Y. Application of magnetotelluric method to the detection of overburden failure height in shallow seam mining. Arab. J. Geosci. 2018, 11, 350. [Google Scholar] [CrossRef]
  28. Sun, W.; Qin, Z.; Li, Q.; Chen, G.; Li, T. Study on Optimization of Roadway Position in Pre-mining Upper Layered Concave–Convex Coal Body. Geotech. Geol. Eng. 2019, 37, 3739–3748. [Google Scholar] [CrossRef]
  29. Huang, Q.; Wu, B.; Cheng, W.; Lei, B.; Shi, H.; Chen, L. Investigation of permeability evolution in the lower slice during thick seam slicing mining and gas drainage: A case study from the Dahuangshan coalmine in China. J. Nat. Gas Sci. Eng. 2018, 52, 141–154. [Google Scholar] [CrossRef]
  30. Wang, S.R.; Wu, X.G.; Zhao, Y.H.; Hagan, P.; Cao, C. Evolution characteristics of composite pressure-arch in thin bedrock of overlying strata during shallow coal mining. Int. J. Appl. Mech. 2019, 11, 1950030. [Google Scholar] [CrossRef]
  31. Qian, M.-G.; Miao, X.-X.; Xu, J.-L. Theoretical Study of Key Statum in Ground Ccontrol. J. China Coal Soc. 1996, 21, 225–230. [Google Scholar] [CrossRef]
  32. Peng, S.S. Surface Subsidence Engineering; SMME Inc.: Littleton, CO, USA, 1992; ISBN 0-87335-114-2. [Google Scholar]
  33. Gong, Y.; Guo, G. A data-intensive FLAC3D computation model: Application of geospatial big data to predict mining induced subsidence. Comput. Model. Eng. Sci. 2019, 119, 395–408. [Google Scholar] [CrossRef] [Green Version]
  34. Kang, H.; Lou, J.; Gao, F.; Yang, J.; Li, J. A physical and numerical investigation of sudden massive roof collapse during longwall coal retreat mining. Int. J. Coal Geol. 2018, 188, 25–36. [Google Scholar] [CrossRef]
  35. Yu, B. Behaviors of overlying strata in extra-thick coal seams using top-coal caving method. J. Rock Mech. Geotech. Eng. 2016, 8, 238–247. [Google Scholar] [CrossRef] [Green Version]
  36. He, M.; Zhu, G.; Guo, Z. Longwall mining “cutting cantilever beam theory” and 110 mining method in China-The third mining science innovation. J. Rock Mech. Geotech. Eng. 2015, 7, 483–492. [Google Scholar] [CrossRef] [Green Version]
  37. Cheng, G.; Liu, T.; Wang, Y. Study of Deformation Mechanism on the Pipeline in Steep Longer Distance Seams Mining. In Proceedings of the 4th International Conference on Sustainable Energy and Environmental Engineering, Shenzhen, China, 20–21 December 2016; pp. 44–48. [Google Scholar]
  38. Xu, N.; Kulatilake, P.H.S.W.; Tian, H.; Wu, X.; Nan, Y.; Wei, T. Surface subsidence prediction for the WUTONG mine using a 3-D finite difference method. Comput. Geotech. 2013, 48, 134–145. [Google Scholar] [CrossRef]
  39. Li, H.Z.; Guo, G.L.; Zha, J.F.; Yuan, Y.F.; Zhao, B.C. Research on the surface movement rules and prediction method of underground coal gasification. Bull. Eng. Geol. Environ. 2016, 75, 1133–1142. [Google Scholar] [CrossRef]
  40. Huai, -Z.L.; Jian, -F.Z.; Guang, -L.G.; Bin, -C.Z.; Bing, W. Compression Ratio Design and Research on Lower Coal Seams in Solid Backfilling Mining Under Urban Areas. Soil Mech. Found. Eng. 2016, 53, 125–131. [Google Scholar] [CrossRef]
  41. Wu, X.; Fu, R.Z.; Zhang, L.J.; Mu, W.P.; Qian, C.; Wang, Z.R. The effect of the metal deposits exploitation on the safe operation of water conservancy project. Environ. Earth Sci. 2016, 75, 544. [Google Scholar] [CrossRef]
  42. Liu, Y.; Zhou, F.; Geng, X.; Chang, L.; Kang, J.; Cui, G.; Zhang, S. A prediction model and numerical simulation of the location of the longwall face during the highest possible failure period of gob gas ventholes. J. Nat. Gas Sci. Eng. 2017, 37, 178–191. [Google Scholar] [CrossRef]
  43. Guo, Y.; Hou, K. Study on surface subsidence law induced by deep mining of large steep metal deposit. Appl. Mech. Mater. 2013, 295–298, 2902–2905. [Google Scholar] [CrossRef]
  44. Asadi, A.; Shahriar, K. Prediction of surface subsidence due to inclined coal seam mining using profile function. In Proceedings of the Coal 2009: Coal Operators’ Conference, University of Wollongong, Wollongong, NSW, Australia, 12–13 February 2009; pp. 130–139. [Google Scholar]
  45. Liu, J.; Sui, W.; Zhao, Q. Environmentally sustainable mining: A case study of intermittent cut-and-fill mining under sand aquifers. Environ. Earth Sci. 2017, 76, 562. [Google Scholar] [CrossRef] [Green Version]
  46. Keilich, W.; Aziz, N.I. Numerical modelling of mining induced subsidence. In Proceedings of the Coal 2006: Coal Operators’ Conference, University of Wollongong, Wollongong, NSW, Australia, 6–7 July 2006; pp. 313–326. [Google Scholar]
  47. He, G.-Q.; Yang, L.; Ling, G.-D.; Jia, F.-C.; Hong, D. Coal Mining Subsidence; China University of Mining & Technology Publisher: Xuzhou, China, 1991. [Google Scholar]
  48. Yuan, L.; Zhang, P. Framework and thinking of transparent geological conditions for precise mining of coal. Meitan Xuebao/J. China Coal Soc. 2020, 45, 2346–2356. [Google Scholar] [CrossRef]
Figure 1. Schematic of the composite beam model.
Sustainability 13 13313 g001
Figure 2. Schematic of the VJS calculation between two adjacent key strata.
Sustainability 13 13313 g002
Figure 3. (a) Locations of the YPH coal mine and (b) relative position of the 2201 mining panel, observation stations, and boreholes.
Sustainability 13 13313 g003
Figure 4. VJS setting (9× bed thickness as an example) for K82-based UDEC model considering the “Three-Zones” theory.
Sustainability 13 13313 g004
Figure 5. VJS setting (9× bed thickness as an example) for K82-based UDEC model.
Sustainability 13 13313 g005
Figure 6. Calibrated rock mass properties used for strata of borehole K82. Strata numbers are consistent with that in Table 1.
Sustainability 13 13313 g006
Figure 7. Calibrated rock mass properties used for strata of borehole K83. Strata numbers are consistent with that in Table 2.
Sustainability 13 13313 g007
Figure 8. Relationship between MSS and different EVJS settings.
Sustainability 13 13313 g008
Figure 9. Simulation results of different UDEC models: (a) K82-based model with VJS set at 0.5× bed thickness; (b) K82-based model with VJS set at 7× bed thickness; (c) K82-based model with VJS set at 1000× bed thickness; (df) are the same for the K83-based Model. Layer numbers are consistent with that in Table 1 and Table 2.
Sustainability 13 13313 g009
Figure 10. Relationship between MSS and different VJS settings. Dotted lines indicate MSS predicted by the UDEC models with VJS set via the proposed method in Section 2.1.
Sustainability 13 13313 g010
Figure 11. K82-based and K83-based UDEC models with VJS setting via our proposed method. Layer numbers are consistent with that in Table 1 and Table 2.
Sustainability 13 13313 g011
Figure 12. Relationship between MSS and different VJS settings. Dashed and dotted lines indicate MSS predicted by the UDEC models with VJS setting via the proposed method in Section 2.1. Purple and orange dashed lines represent predictions considering the “Three-Zones” theory.
Sustainability 13 13313 g012
Figure 13. Relationship between VJS and the percentage.
Sustainability 13 13313 g013
Table 1. Strata information revealed by borehole K82. M-G represents medium-grained and C-G represents coarse-grained.
No.LithologyThickness
(m)
No.LithologyThickness
(m)
No.LithologyThickness
(m)
1Quaternary97.915Mudstone34.429Sandy Mudstone34.4
2Fine Sandstone33.916Siltstone9.630Siltstone9.6
3M-G Sandstone40.917Sandy Mudstone10.431Fine Sandstone10.4
4Fine Sandstone22.218Siltstone12.032Siltstone12.0
5C-G Sandstone40.619M-G Sandstone13.633Fine Sandstone13.6
6M-G Sandstone36.720Siltstone18.334M-G Sandstone18.3
7Fine Sandstone18.221Siltstone11.035C-G Sandstone11.0
8C-G Sandstone21.022Sandy Mudstone8.936Mudstone8.9
9Fine Sandstone11.023Fine Sandstone13.937Sandy Mudstone13.9
10Fine Sandstone27.424C-G Sandstone5.238Siltstone5.2
11M-G Sandstone36.425Sandy Mudstone6.939Coal6.9
12C-G Sandstone13.726Sandy Mudstone40.040Floor40.0
13Mudstone5.227Siltstone34.4
14Sandy Mudstone13.028M-G Sandstone9.6
Table 2. Strata information revealed by borehole K82. M-G represents medium-grained and C-G represents coarse-grained.
No.LithologyThickness
(m)
No.LithologyThickness
(m)
No.LithologyThickness
(m)
1Quaternary95.713Fine Sandstone5.225Fine Sandstone9.4
2Fine Sandstone54.014Sandy Mudstone9.626Sandy Mudstone36.9
3M-G Sandstone17.515Fine Sandstone8.227Sandy Mudstone23.8
4Fine Sandstone40.616Siltstone21.128Fine Sandstone9.8
5Siltstone13.417Sandy Mudstone8.729Siltstone26.6
6Fine Sandstone32.218Fine Sandstone10.030Sandy Mudstone7.5
7M-G Sandstone27.719M-G Sandstone5.031M-G Sandstone19.4
8Siltstone12.420Sandy Mudstone12.132Siltstone14.9
9Fine Sandstone64.321Sandy Mudstone7.733Coal6.1
10M-G Sandstone20.122Sandy Mudstone11.534Floor44.1
11Fine Sandstone42.023M-G Sandstone9.9
12Sandy Mudstone8.824Sandy Mudstone10.1
Publisher’s Note: MDPI stays neutral with regard to jurisdictional claims in published maps and institutional affiliations.

