
Capturing Twitter Negativity Pre- vs. Mid-COVID-19 Pandemic: An LDA Application on London Public Transport System

 ,
,  ,
,  ,
,  and
and
Abstract
:1. Introduction
- What was the impact of COVID-19 on the sentiment polarity of tweets, what are the main topics discussed, and which are the most important keywords that emerged through tweets with negative polarity?
- Can traditional methods and tools like sentiment analysis techniques and sentiment lexicons operate efficiently during extreme circumstances such as a pandemic, and can they correctly classify tweets based on their sentiment and, in particular, those related to the negative sentiment?
2. Literature Review
3. Methodology
3.1. Data Collection
- London is the capital and largest city of England and the United Kingdom, as well as one of the world’s most important global cities. With a population of nearly 9,000,000 people, London can be considered as an ideal study area for the collection of social media posts from a very large number of people.
- The official language of the country is English, a fact necessary for carrying out specific analytic processes, such as sentiment analysis, as most sentiment lexicon dictionaries are suitable only for the English language.
- London was initially one of the worst affected regions of England. As of 26 June 2021, in the UK, there had been more than 4.7 million confirmed cases and 128,330 deaths among people who had recently tested positive—the world’s nineteenth-highest death rate by population and the second-highest death toll in Europe after Russia [35,36,37].
- Public transport services are overseen by the executive agency for transport in London, Transport for London (TfL) which manages the majority of public transportation in the agglomeration. This is particularly important for the present research as social media data collection for public transport services focuses on a single entity.
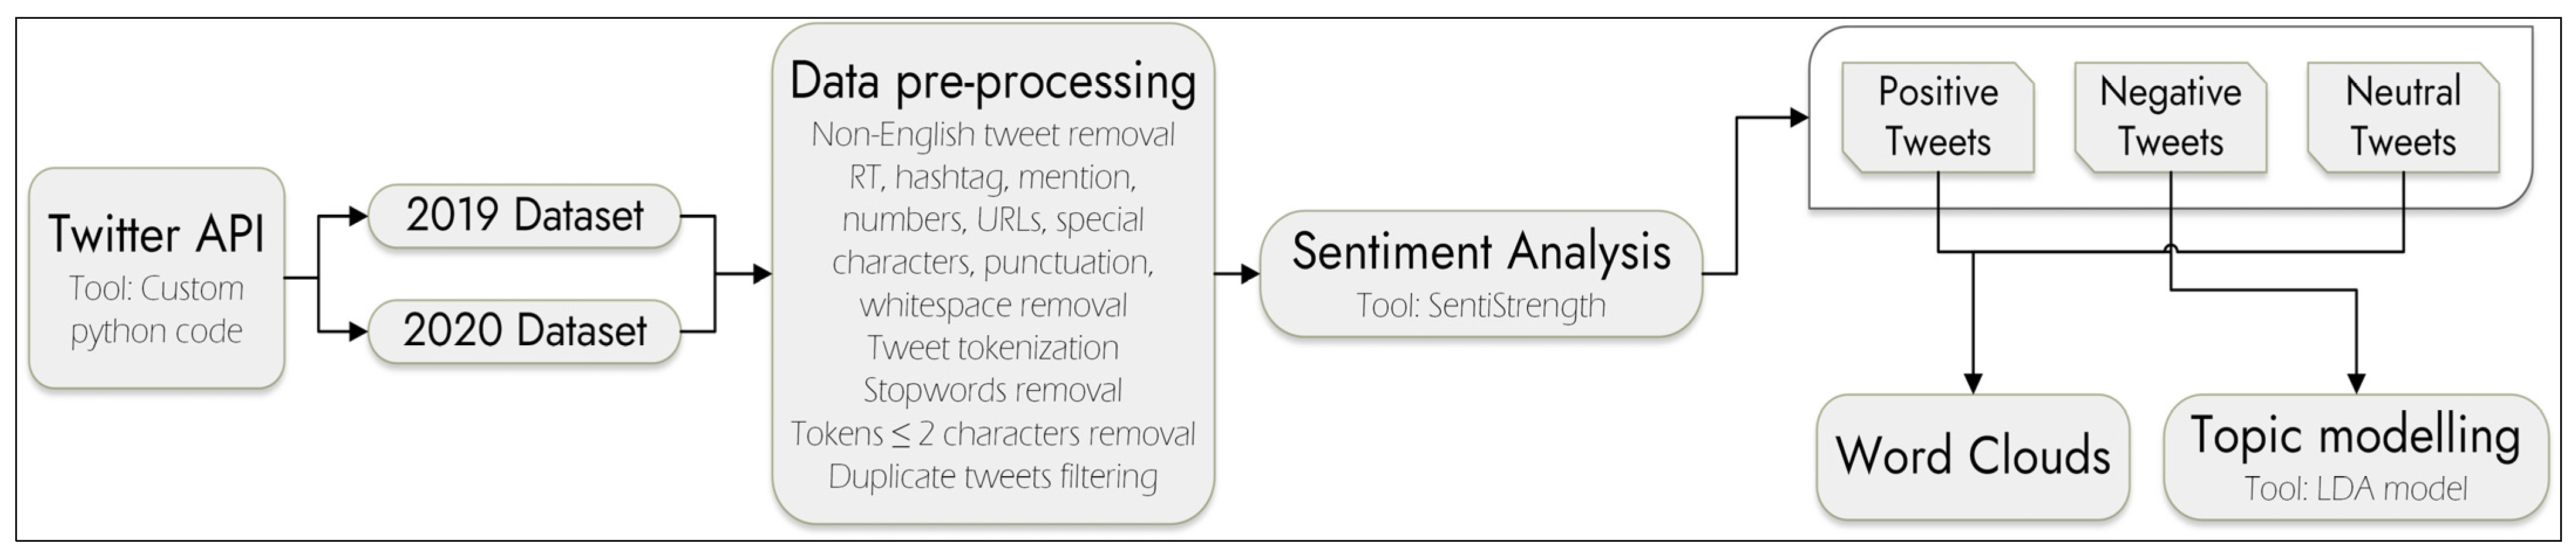
3.2. Data Pre-Processing
3.3. Sentiment Analysis
3.4. Word Clouds
3.5. Latent Dirichlet Allocation (LDA)
4. Results
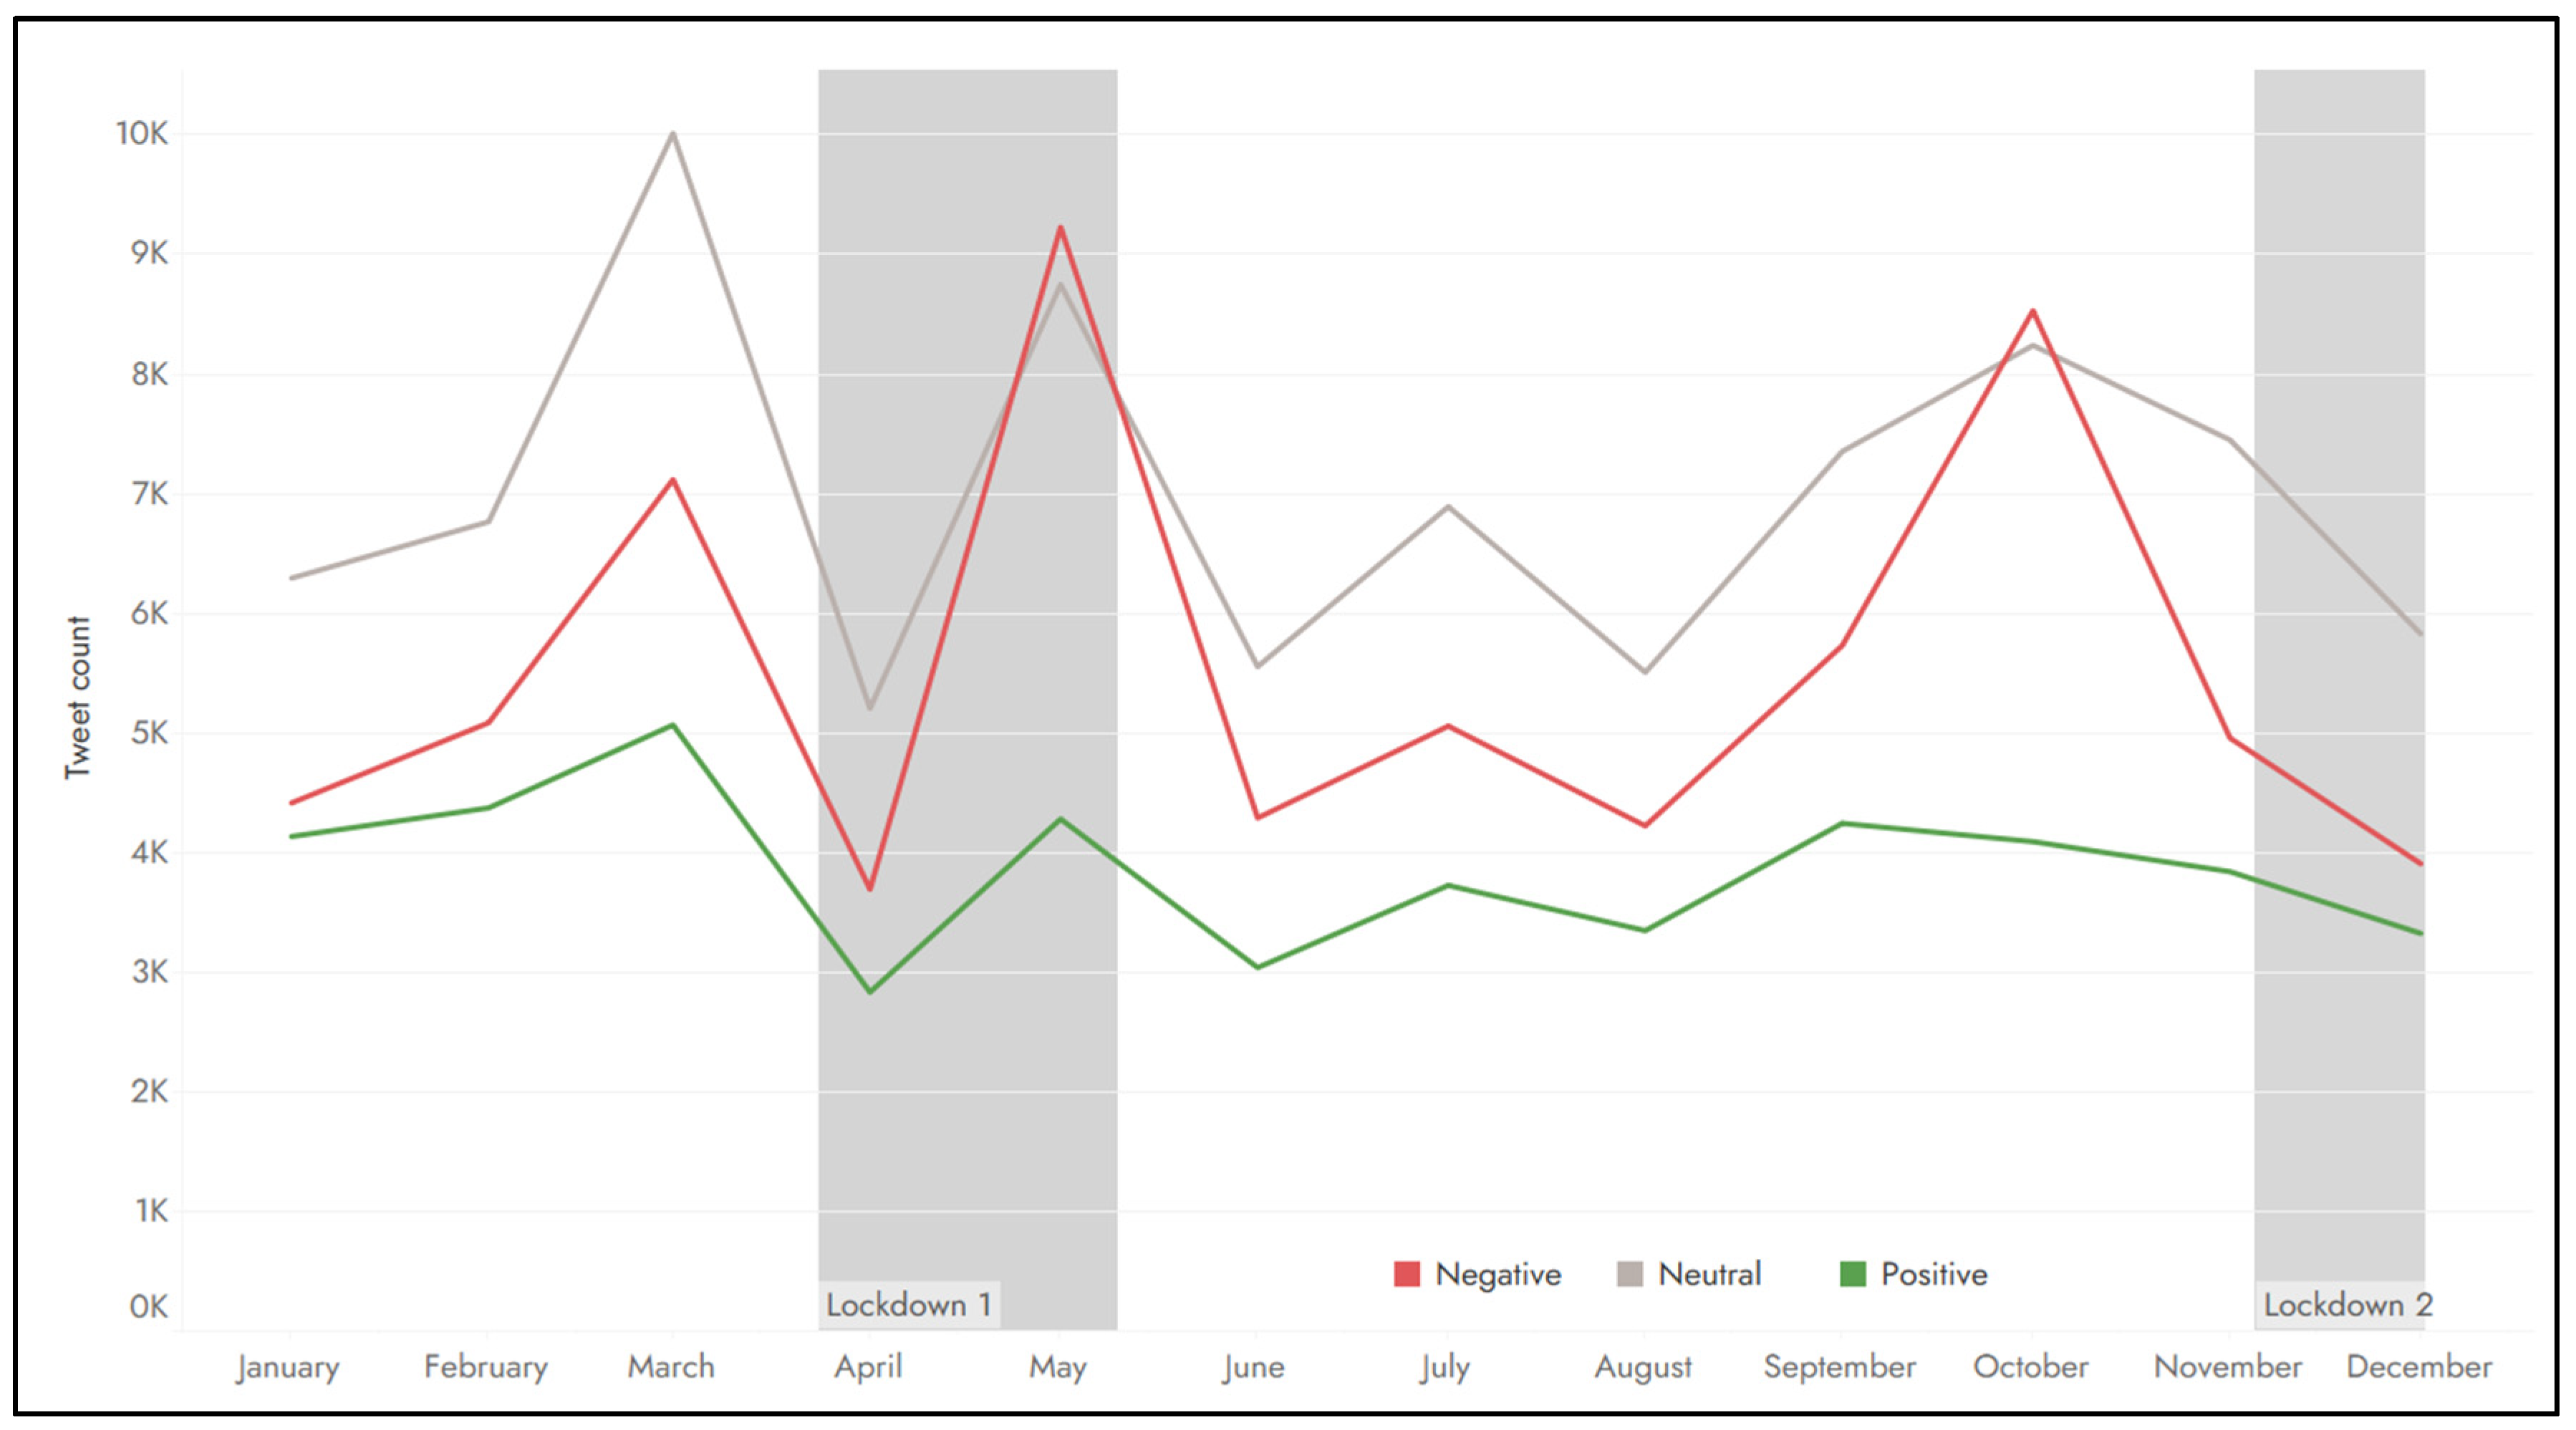
4.1. Sentiment Analysis
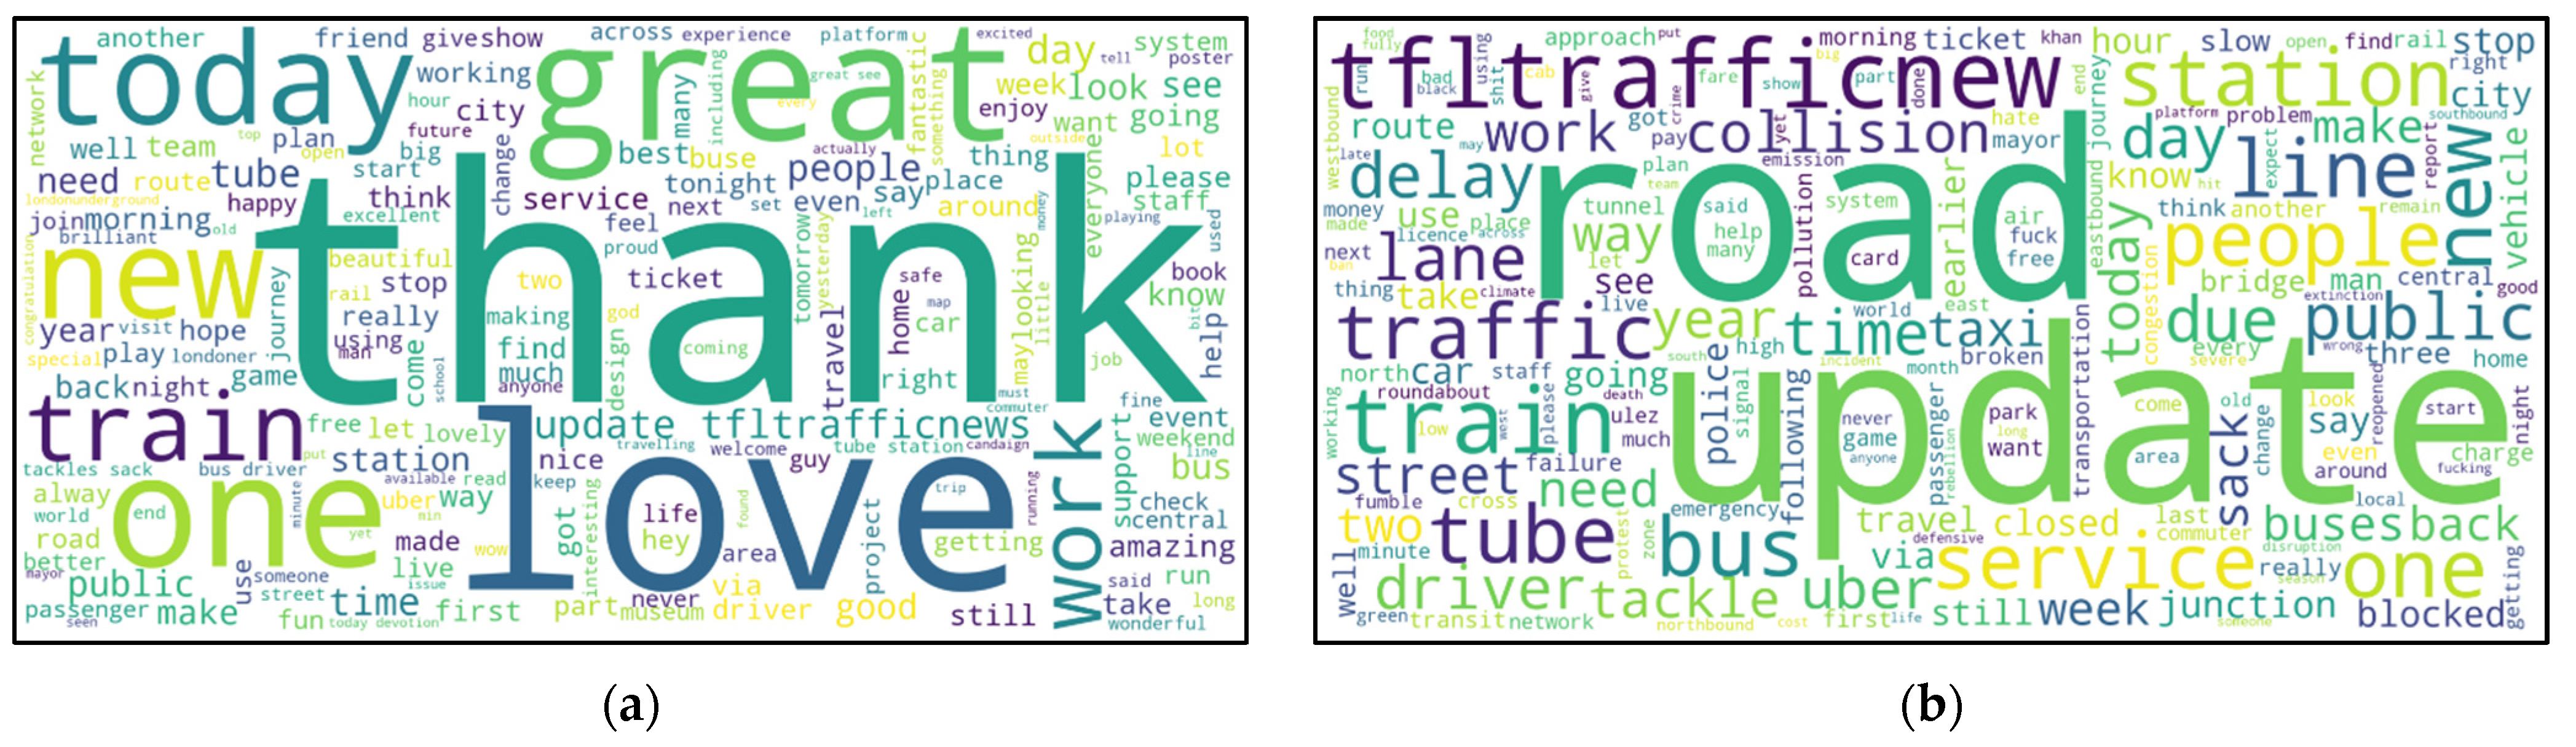
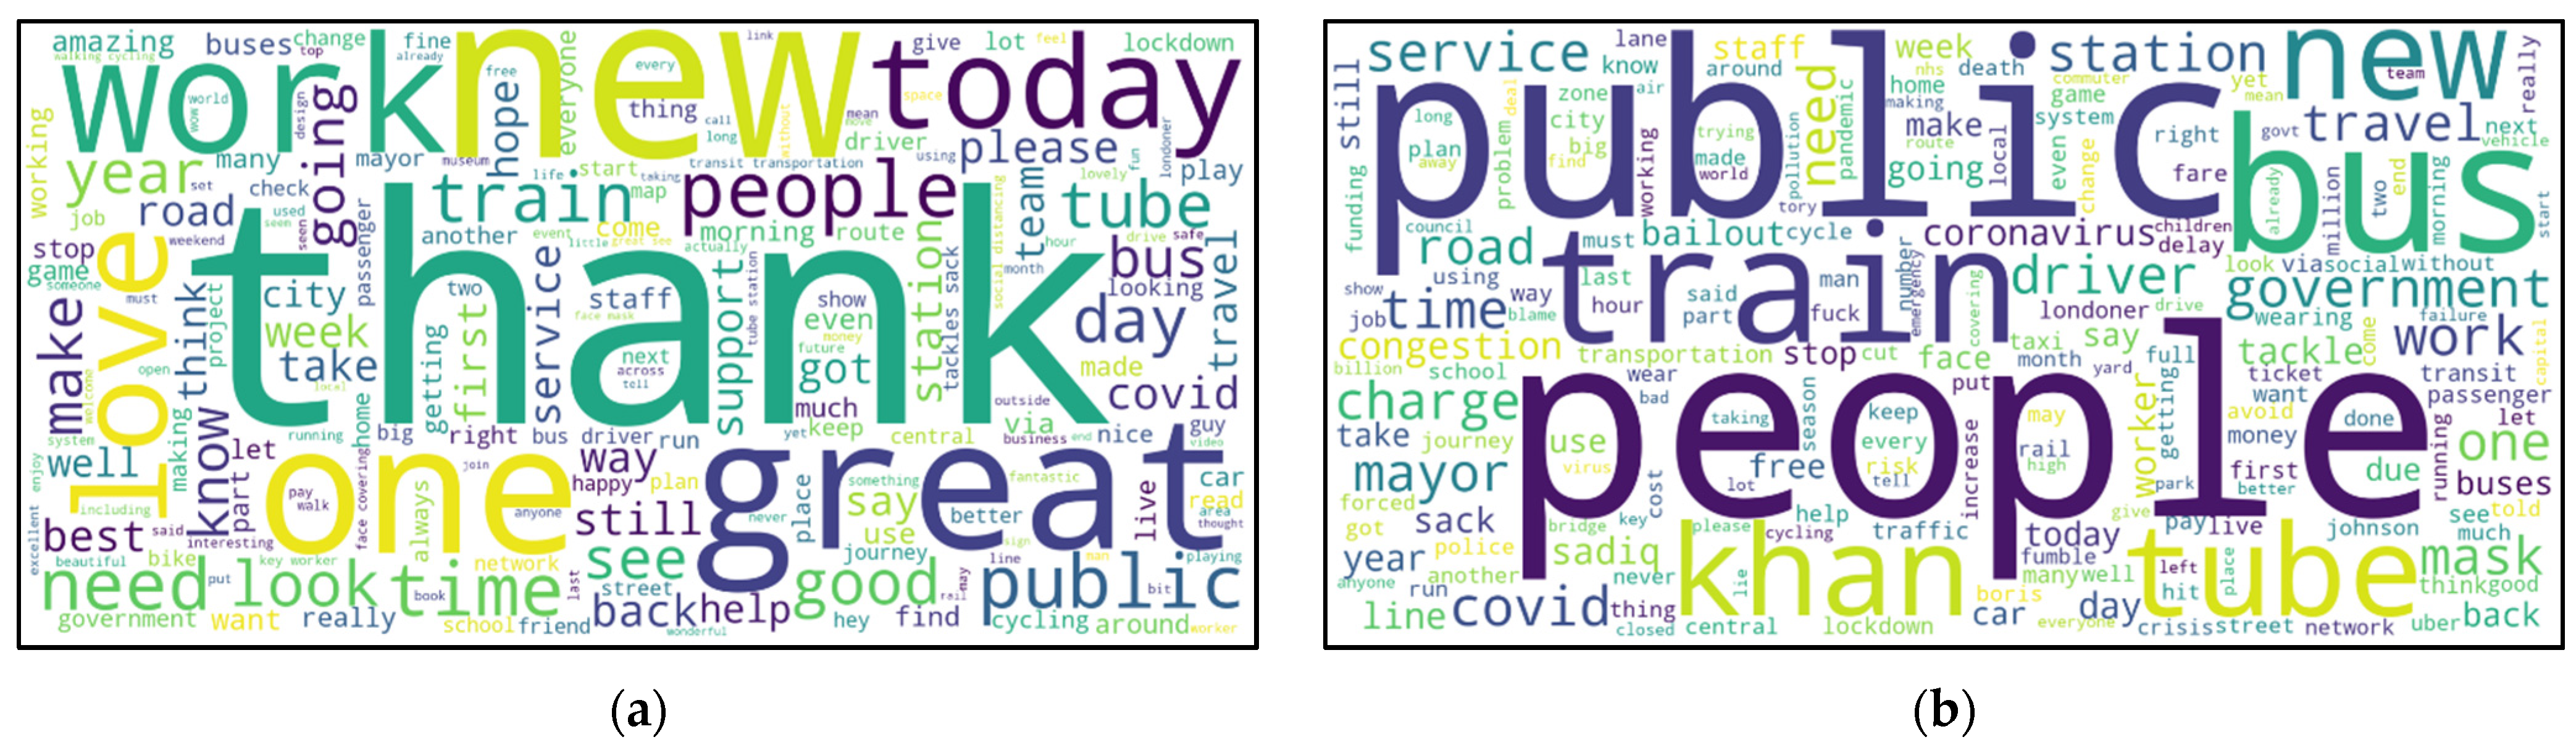
4.2. Word Clouds
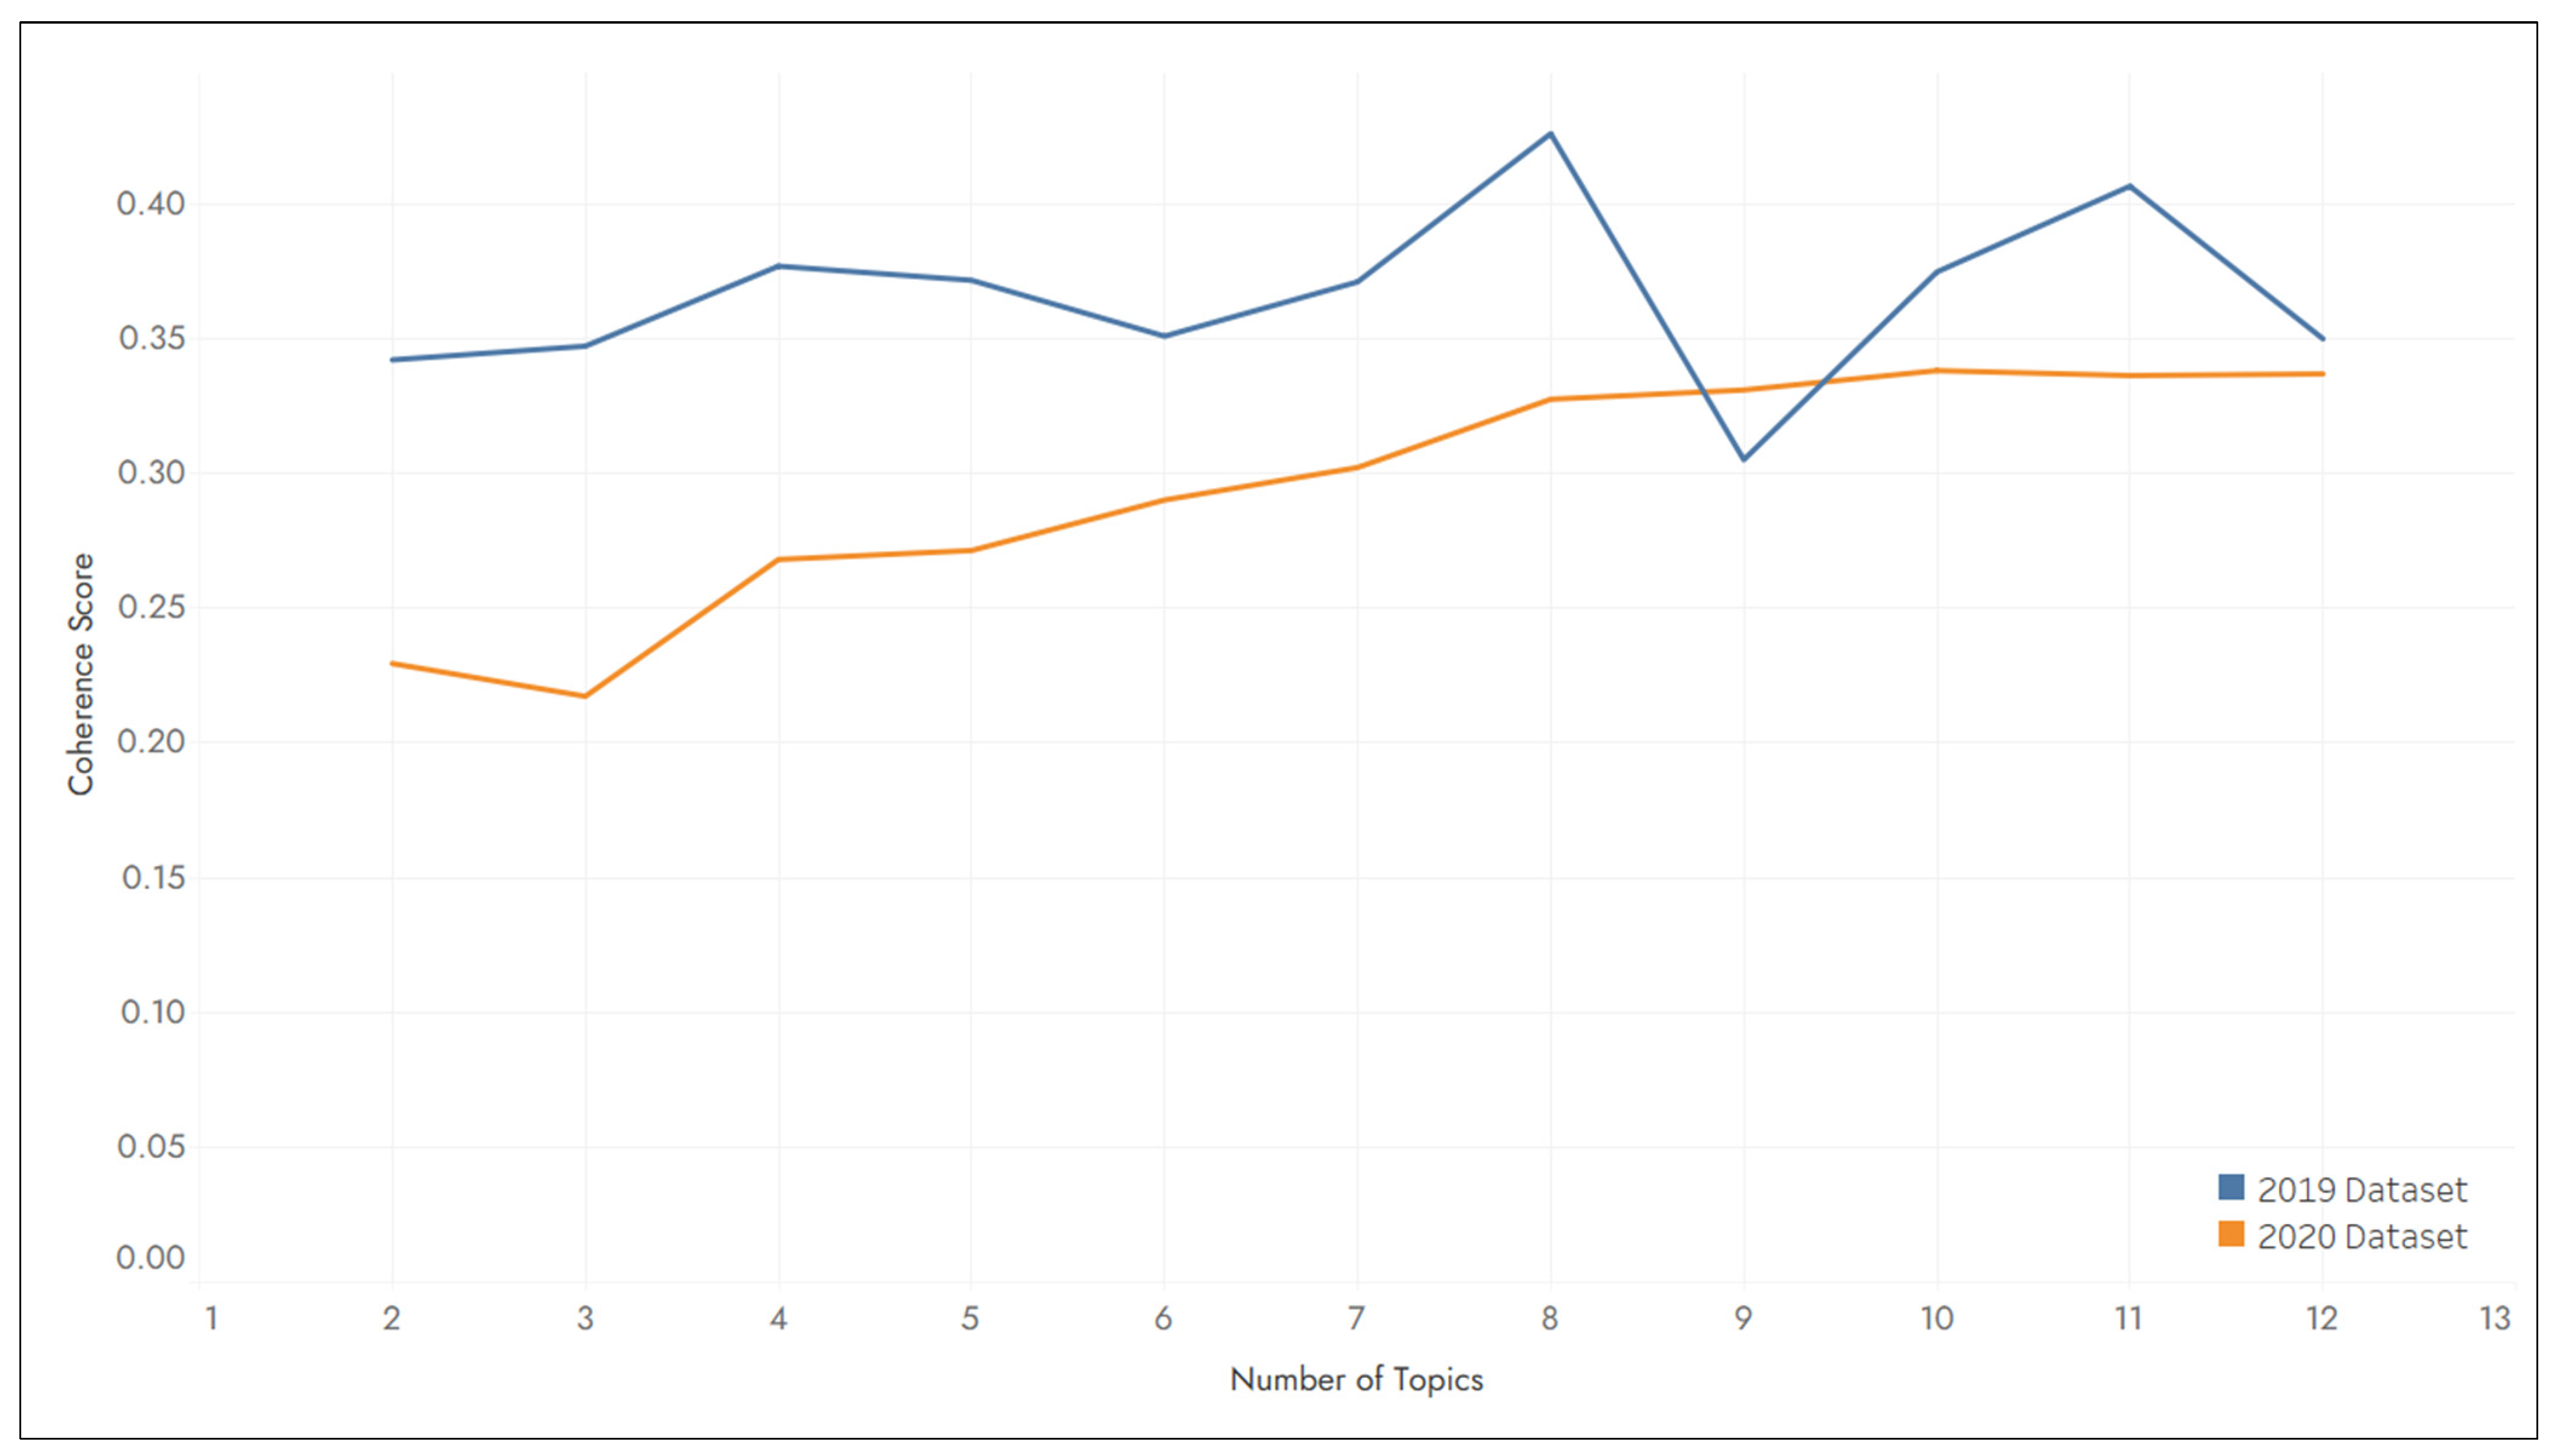
4.3. Topic Modeling
5. Conclusions
Author Contributions
Funding
Institutional Review Board Statement
Informed Consent Statement
Data Availability Statement
Conflicts of Interest
References
- WHO Coronavirus (COVID-19) Dashboard|WHO Coronavirus (COVID-19) Dashboard with Vaccination Data. Available online: https://covid19.who.int/ (accessed on 29 July 2021).
- Abdullah, M.; Dias, C.; Muley, D.; Shahin, M. Exploring the Impacts of COVID-19 on Travel Behavior and Mode Preferences. Transp. Res. Interdiscip. Perspect. 2020, 8, 100255. [Google Scholar] [CrossRef]
- Campisi, T.; Basbas, S.; Skoufas, A.; Akgün, N.; Ticali, D.; Tesoriere, G. The Impact of COVID-19 Pandemic on the Resilience of Sustainable Mobility in Sicily. Sustainability 2020, 12, 8829. [Google Scholar] [CrossRef]
- Politis, I.; Georgiadis, G.; Nikolaidou, A.; Kopsacheilis, A.; Fyrogenis, I.; Sdoukopoulos, A.; Verani, E.; Papadopoulos, E. Mapping Travel Behavior Changes during the COVID-19 Lock-down: A Socioeconomic Analysis in Greece. Eur. Transp. Res. Rev. 2021, 13, 21. [Google Scholar] [CrossRef]
- Budd, L.; Ison, S. Responsible Transport: A Post-COVID Agenda for Transport Policy and Practice. Transp. Res. Interdiscip. Perspect. 2020, 6, 100151. [Google Scholar] [CrossRef] [PubMed]
- Nikitas, A.; Tsigdinos, S.; Karolemeas, C.; Kourmpa, E.; Bakogiannis, E. Cycling in the Era of COVID-19: Lessons Learnt and Best Practice Policy Recommendations for a More Bike-Centric Future. Sustainability 2021, 13, 4620. [Google Scholar] [CrossRef]
- Politis, I.; Georgiadis, G.; Papadopoulos, E.; Fyrogenis, I.; Nikolaidou, A.; Kopsacheilis, A.; Sdoukopoulos, A.; Verani, E. COVID-19 Lockdown Measures and Travel Behavior: The Case of Thessaloniki, Greece. Transp. Res. Interdiscip. Perspect. 2021, 10, 100345. [Google Scholar] [CrossRef]
- Social Media & COVID-19: A Global Study of Digital Crisis Interaction among Gen Z and Millennials. Available online: https://www.who.int/news-room/feature-stories/detail/social-media-COVID-19-a-global-study-of-digital-crisis-interaction-among-gen-z-and-millennials (accessed on 29 July 2021).
- Nikolaidou, A.; Papaioannou, P. Utilizing Social Media in Transport Planning and Public Transit Quality: Survey of Literature. J. Transp. Eng. Part A Syst. 2018, 144, 128. [Google Scholar] [CrossRef]
- Nikitas, A.; Michalakopoulou, K.; Njoya, E.T.; Karampatzakis, D. Artificial Intelligence, Transport and the Smart City: Definitions and Dimensions of a New Mobility Era. Sustainability 2020, 12, 2789. [Google Scholar] [CrossRef] [Green Version]
- Rathore, A.K.; Kar, A.K.; Ilavarasan, P.V. Social Media Analytics: Literature Review and Directions for Future Research. Decis. Anal. 2017, 14, 229–249. [Google Scholar] [CrossRef]
- Apostolidis, L.; Papadopoulos, S.; Liatsikou, M.; Fyrogenis, I.; Papadopoulos, E.; Keikoglou, G.; Alexiou, K.; Chondros, N.; Kompatsiaris, I.; Politis, I. I-CHANGE: A Platform for Managing Dockless Bike Sharing Systems. In Proceedings of the Lecture Notes in Computer Science (Including Subseries Lecture Notes in Artificial Intelligence and Lecture Notes in Bioinformatics), Cagliari, Italy, 1–4 July 2020; Volume 12250. [Google Scholar]
- Gal-Tzur, A.; Grant-Muller, S.M.; Kuflik, T.; Minkov, E.; Nocera, S.; Shoor, I. The Potential of Social Media in Delivering Transport Policy Goals. Transp. Policy 2014, 32, 115–123. [Google Scholar] [CrossRef]
- Jahanbin, K.; Rahmanian, V. Using Twitter and Web News Mining to Predict COVID-19 Outbreak. Asian Pac. J. Trop. Med. 2020, 13, 378. [Google Scholar]
- Cinelli, M.; Quattrociocchi, W.; Galeazzi, A.; Valensise, C.M.; Brugnoli, E.; Schmidt, A.L.; Zola, P.; Zollo, F.; Scala, A. The COVID-19 Social Media Infodemic. Sci. Rep. 2020, 10, 16598. [Google Scholar] [CrossRef]
- Zhao, Y.; Cheng, S.; Yu, X.; Xu, H. Chinese Public’s Attention to the COVID-19 Epidemic on Social Media: Observational Descriptive Study. J. Med. Internet Res. 2020, 22, 18825. [Google Scholar] [CrossRef] [PubMed]
- Sanders, A.C.; White, R.C.; Severson, L.S.; Ma, R.; McQueen, R.; Paulo, H.C.A.; Zhang, Y.; Erickson, J.S.; Bennett, K.P. Unmasking the Conversation on Masks: Natural Language Processing for Topical Sentiment Analysis of COVID-19 Twitter Discourse. medRxiv 2020. [Google Scholar] [CrossRef]
- Andreadis, S.; Antzoulatos, G.; Mavropoulos, T.; Giannakeris, P.; Tzionis, G.; Pantelidis, N.; Ioannidis, K.; Karakostas, A.; Gialampoukidis, I.; Vrochidis, S.; et al. A Social Media Analytics Platform Visualising the Spread of COVID-19 in Italy via Exploitation of Automatically Geotagged Tweets. Online Soc. Netw. Media 2021, 23, 134. [Google Scholar] [CrossRef]
- Yang, T.; Shen, K.; He, S.; Li, E.; Sun, P.; Chen, P.; Zuo, L.; Hu, J.; Mo, Y.; Zhang, W.; et al. CovidNet: To Bring Data Transparency in the Era of COVID-19. 2020. Available online: https://arxiv.org/pdf/2005.10948.pdf (accessed on 29 November 2021).
- Technical Analytics White Paper|OmniSci. Available online: https://www2.omnisci.com/resources/technical-whitepaper/lp?_ga=2.192127720.316702718.1564495503-925270820.1564495503 (accessed on 29 July 2021).
- Li, C.; Chen, L.J.; Chen, X.; Zhang, M.; Pang, C.P.; Chen, H. Retrospective Analysis of the Possibility of Predicting the COVID-19 Outbreak from Internet Searches and Social Media Data, China, 2020. Eurosurveillance 2020, 25, 2000199. [Google Scholar] [CrossRef]
- COVID-19: The First Study to Look at Whether Fake News Actually Changes People’s Behaviour. Available online: https://theconversation.com/COVID-19-the-first-study-to-look-at-whether-fake-news-actually-changes-peoples-behaviour-144819 (accessed on 29 July 2021).
- Sharma, K.; Seo, S.; Meng, C.; Rambhatla, S.; Liu, Y. COVID-19 on Social Media: Analyzing Misinformation in Twitter Conversations. 2020. Available online: https://arxiv.org/pdf/2003.12309v4.pdf (accessed on 29 November 2021).
- Wang, T.; Lu, K.; Chow, K.P.; Zhu, Q. COVID-19 Sensing: Negative Sentiment Analysis on Social Media in China via BERT Model. IEEE Access 2020, 8, 138162–138169. [Google Scholar] [CrossRef]
- De las Heras-Pedrosa, C.; Sánchez-Núñez, P.; Peláez, J.I. Sentiment Analysis and Emotion Understanding during the COVID-19 Pandemic in Spain and Its Impact on Digital Ecosystems. Int. J. Environ. Res. Public Health 2020, 17, 5542. [Google Scholar] [CrossRef]
- Naseem, U.; Razzak, I.; Khushi, M.; Eklund, P.W.; Kim, J. COVIDSenti: A Large-Scale Benchmark Twitter Data Set for COVID-19 Sentiment Analysis. IEEE Trans. Comput. Soc. Syst. 2021, 8, 1003–1015. [Google Scholar] [CrossRef]
- Kruspe, A.; Häberle, M.; Kuhn, I.; Zhu, X.X. Cross-Language Sentiment Analysis of European Twitter Messages during the COVID-19 Pandemic. 2020. Available online: https://arxiv.org/pdf/2008.12172.pdf (accessed on 29 November 2021).
- Jang, H.; Rempel, E.; Roth, D.; Carenini, G.; Janjua, N.Z. Tracking COVID-19 Discourse on Twitter in North America: Infodemiology Study Using Topic Modeling and Aspect-Based Sentiment Analysis. J. Med. Internet Res. 2021, 23, e25431. [Google Scholar] [CrossRef] [PubMed]
- de Vos, J. The Effect of COVID-19 and Subsequent Social Distancing on Travel Behavior. Transp. Res. Interdiscip. Perspect. 2020, 5, 100121. [Google Scholar] [CrossRef]
- Basbas, S. COVID-19 and Public Transport Demand Trends in Sicily: Analyzing External Factors and Governmental Recommendations. Eur. Transp./Trasp. Eur. 2021, 83, 9. [Google Scholar] [CrossRef]
- Przybylowski, A.; Stelmak, S.; Suchanek, M. Mobility Behaviour in View of the Impact of the COVID-19 Pandemic—Public Transport Users in Gdansk Case Study. Sustainability 2021, 13, 364. [Google Scholar] [CrossRef]
- Aparicio, J.T.; Arsenio, E.; Henriques, R. Understanding the Impacts of the COVID-19 Pandemic on Public Transportation Travel Patterns in the City of Lisbon. Sustainability 2021, 13, 8342. [Google Scholar] [CrossRef]
- Troko, J.; Myles, P.; Gibson, J.; Hashim, A.; Enstone, J.; Kingdon, S.; Packham, C.; Amin, S.; Hayward, A.; Van-Tam, J.N. Is Public Transport a Risk Factor for Acute Respiratory Infection? BMC Infect. Dis. 2011, 11, 16. [Google Scholar] [CrossRef] [PubMed] [Green Version]
- Cartenì, A.; di Francesco, L.; Henke, I.; Marino, T.V.; Falanga, A. The Role of Public Transport during the Second COVID-19 Wave in Italy. Sustainability 2021, 13, 11905. [Google Scholar] [CrossRef]
- COVID-19 Data Visualisation. Available online: https://pandemic.internationalsos.com/2019-ncov/COVID-19-data-visualisation (accessed on 29 July 2021).
- Mortality Analyses—Johns Hopkins Coronavirus Resource Center. Available online: https://coronavirus.jhu.edu/data/mortality (accessed on 29 July 2021).
- Pak, A.; Paroubek, P. Twitter as a Corpus for Sentiment Analysis and Opinion Mining. In Proceedings of the 7th International Conference on Language Resources and Evaluation, LREC 2010, Valletta, Malta, 17–23 May 2010. [Google Scholar]
- Twitter: Number of Users Worldwide 2019–2020|Statista. Available online: https://www.statista.com/statistics/303681/twitter-users-worldwide/ (accessed on 29 July 2021).
- Twitter API Academic Research. Available online: https://developer.twitter.com/en/products/twitter-api/academic-research (accessed on 29 July 2021).
- Twitter API Academic Research Resources. Available online: https://developer.twitter.com/en/use-cases/do-research/academic-research/resources (accessed on 29 July 2021).
- Thelwall, M.; Buckley, K.; Paltoglou, G.; Cai, D.; Kappas, A. Sentiment in Short Strength Detection Informal Text. J. Am. Soc. Inf. Sci. Technol. 2010, 61, 2544–2558. [Google Scholar] [CrossRef] [Green Version]
- Abbasi, A.; Hassan, A.; Dhar, M. Benchmarking Twitter Sentiment Analysis Tools. In Proceedings of the 9th International Conference on Language Resources and Evaluation, LREC 2014, Reykjavik, Iceland, 26–31 May 2014. [Google Scholar]
- Jongeling, R.; Sarkar, P.; Datta, S.; Serebrenik, A. On Negative Results When Using Sentiment Analysis Tools for Software Engineering Research. Empir. Softw. Eng. 2017, 22, 2543–2584. [Google Scholar] [CrossRef] [Green Version]
- Ribeiro, F.N.; Araújo, M.; Gonçalves, P.; André Gonçalves, M.; Benevenuto, F. SentiBench—A Benchmark Comparison of State-of-the-Practice Sentiment Analysis Methods. EPJ Data Sci. 2016, 5, 23. [Google Scholar] [CrossRef] [Green Version]
- Blei, D.M.; Ng, A.Y.; Jordan, M.I. Latent Dirichlet Allocation. J. Mach. Learn. Res. 2003, 3, 993–1022. [Google Scholar] [CrossRef]
- Sievert, C.; Shirley, K. LDAvis: A Method for Visualizing and Interpreting Topics. 2015. Available online: https://aclanthology.org/W14-3110.pdf (accessed on 29 November 2021).
- Hale, T.; Angrist, N.; Goldszmidt, R.; Kira, B.; Petherick, A.; Phillips, T.; Webster, S.; Cameron-Blake, E.; Hallas, L.; Majumdar, S.; et al. A Global Panel Database of Pandemic Policies (Oxford COVID-19 Government Response Tracker). Nat. Hum. Behav. 2021, 5, 529–538. [Google Scholar] [CrossRef] [PubMed]
- Vickerman, R. Will COVID-19 Put the Public Back in Public Transport? A UK Perspective. Transp. Policy 2021, 103, 95–102. [Google Scholar] [CrossRef] [PubMed]
- Coronavirus Lockdown: What Are the New Rules Announced by Boris Johnson?|Coronavirus|The Guardian. Available online: https://www.theguardian.com/world/2020/may/10/uk-coronavirus-lockdown-what-has-boris-johnson-announced (accessed on 28 July 2021).
- Local COVID-19 Alert Level Update: 15 October 2020—GOV.UK. Available online: https://www.gov.uk/government/news/local-COVID-19-alert-level-update-15-october-2020 (accessed on 29 July 2021).
- Coronavirus: TfL Secure Two-Week Extension of Bailout—BBC News. Available online: https://www.bbc.com/news/uk-england-london-54568920 (accessed on 29 July 2021).
- Medford, R.J.; Saleh, S.N.; Sumarsono, A.; Perl, T.M.; Lehmann, C.U. An “Infodemic”: Leveraging High-Volume Twitter Data to Understand Early Public Sentiment for the Coronavirus Disease 2019 Outbreak. Open Forum Infect. Dis. 2020, 7, ofaa258. [Google Scholar] [CrossRef] [PubMed]
- Extinction Rebellion Rush-Hour Protest Sparks Clash on London Underground|Extinction Rebellion|The Guardian. Available online: https://www.theguardian.com/environment/2019/oct/17/extinction-rebellion-activists-london-underground (accessed on 29 July 2021).
- Belly Mujinga’s Death: Searching for the Truth—BBC News. Available online: https://www.bbc.com/news/uk-54435703 (accessed on 29 July 2021).
- Transport Use during the Coronavirus (COVID-19) Pandemic—GOV.UK. Available online: https://www.gov.uk/government/statistics/transport-use-during-the-coronavirus-COVID-19-pandemic (accessed on 29 July 2021).


| 2019 | 2020 | |
|---|---|---|
| Initial number of tweets | 285,123 | 254,252 |
| Tweets with English language | 267,421 | 237,463 |
| Final number of tweets | 222,136 | 196,488 |
| Number of unique users | 98,886 | 90,293 |
| Number of tweets per user | 2.25 | 2.18 |
| Tweets with geolocation | 494 | 478 |
| Average number of tweets (per day) | 609 | 538 |
| Average number of tweets (per month) | 18,511 | 16,374 |
| Topics | Keywords | Description | Percentage of Tokens |
|---|---|---|---|
| 2019 Dataset | |||
| Topic 1 | bus, get, train, time, service, like, people, tube, minutes, hate, journey, driver, stop, money, home, every, hour, could, day, line, pay, know, worst, need, morning, use, card, shit, back, even | Public transport quality issues | 18.4 |
| Topic 2 | people, public, one, day, another, man, need, tube, think, packages, demonstration, mayor, black, car, woman, get, want, cars, ulez, cab, ultra, children, khan, uber, use, low, around, anti, tax, health | TfL general announcements (news, advertisements, etc.) | 15.5 |
| Topic 3 | update, tfltrafficnews, road, collision, traffic, lane, due, junction, blocked, closed, slow, earlier, approach, following, street, reopened, delays, westbound, eastbound, emergency, southbound, northbound, broken, lanes, roundabout, one, expect, circular, fully, north | Traffic and public transport incident reports | 14.7 |
| Topic 4 | pollution, air, caution, ulez, new, today, charge, blackwall, congestion, roads, taxis, use, drivers, devices, alistair, beg, hubs, vehicle, vehicles, liste, uber, god, zone, times, quality, emission, cars, sent, poor, public | Traffic incidents and environmental impact | 13.3 |
| 2020 Dataset | |||
| Topic 1 | people, bus, public, buses, work, social, get, transportation, transit, stop, distancing, packed, many, home, take, going, travel, drivers, think, road, mylondon, staff, die, tube, like, need, driver, service, new, cars | Pandemic measures in public transport | 14.9 |
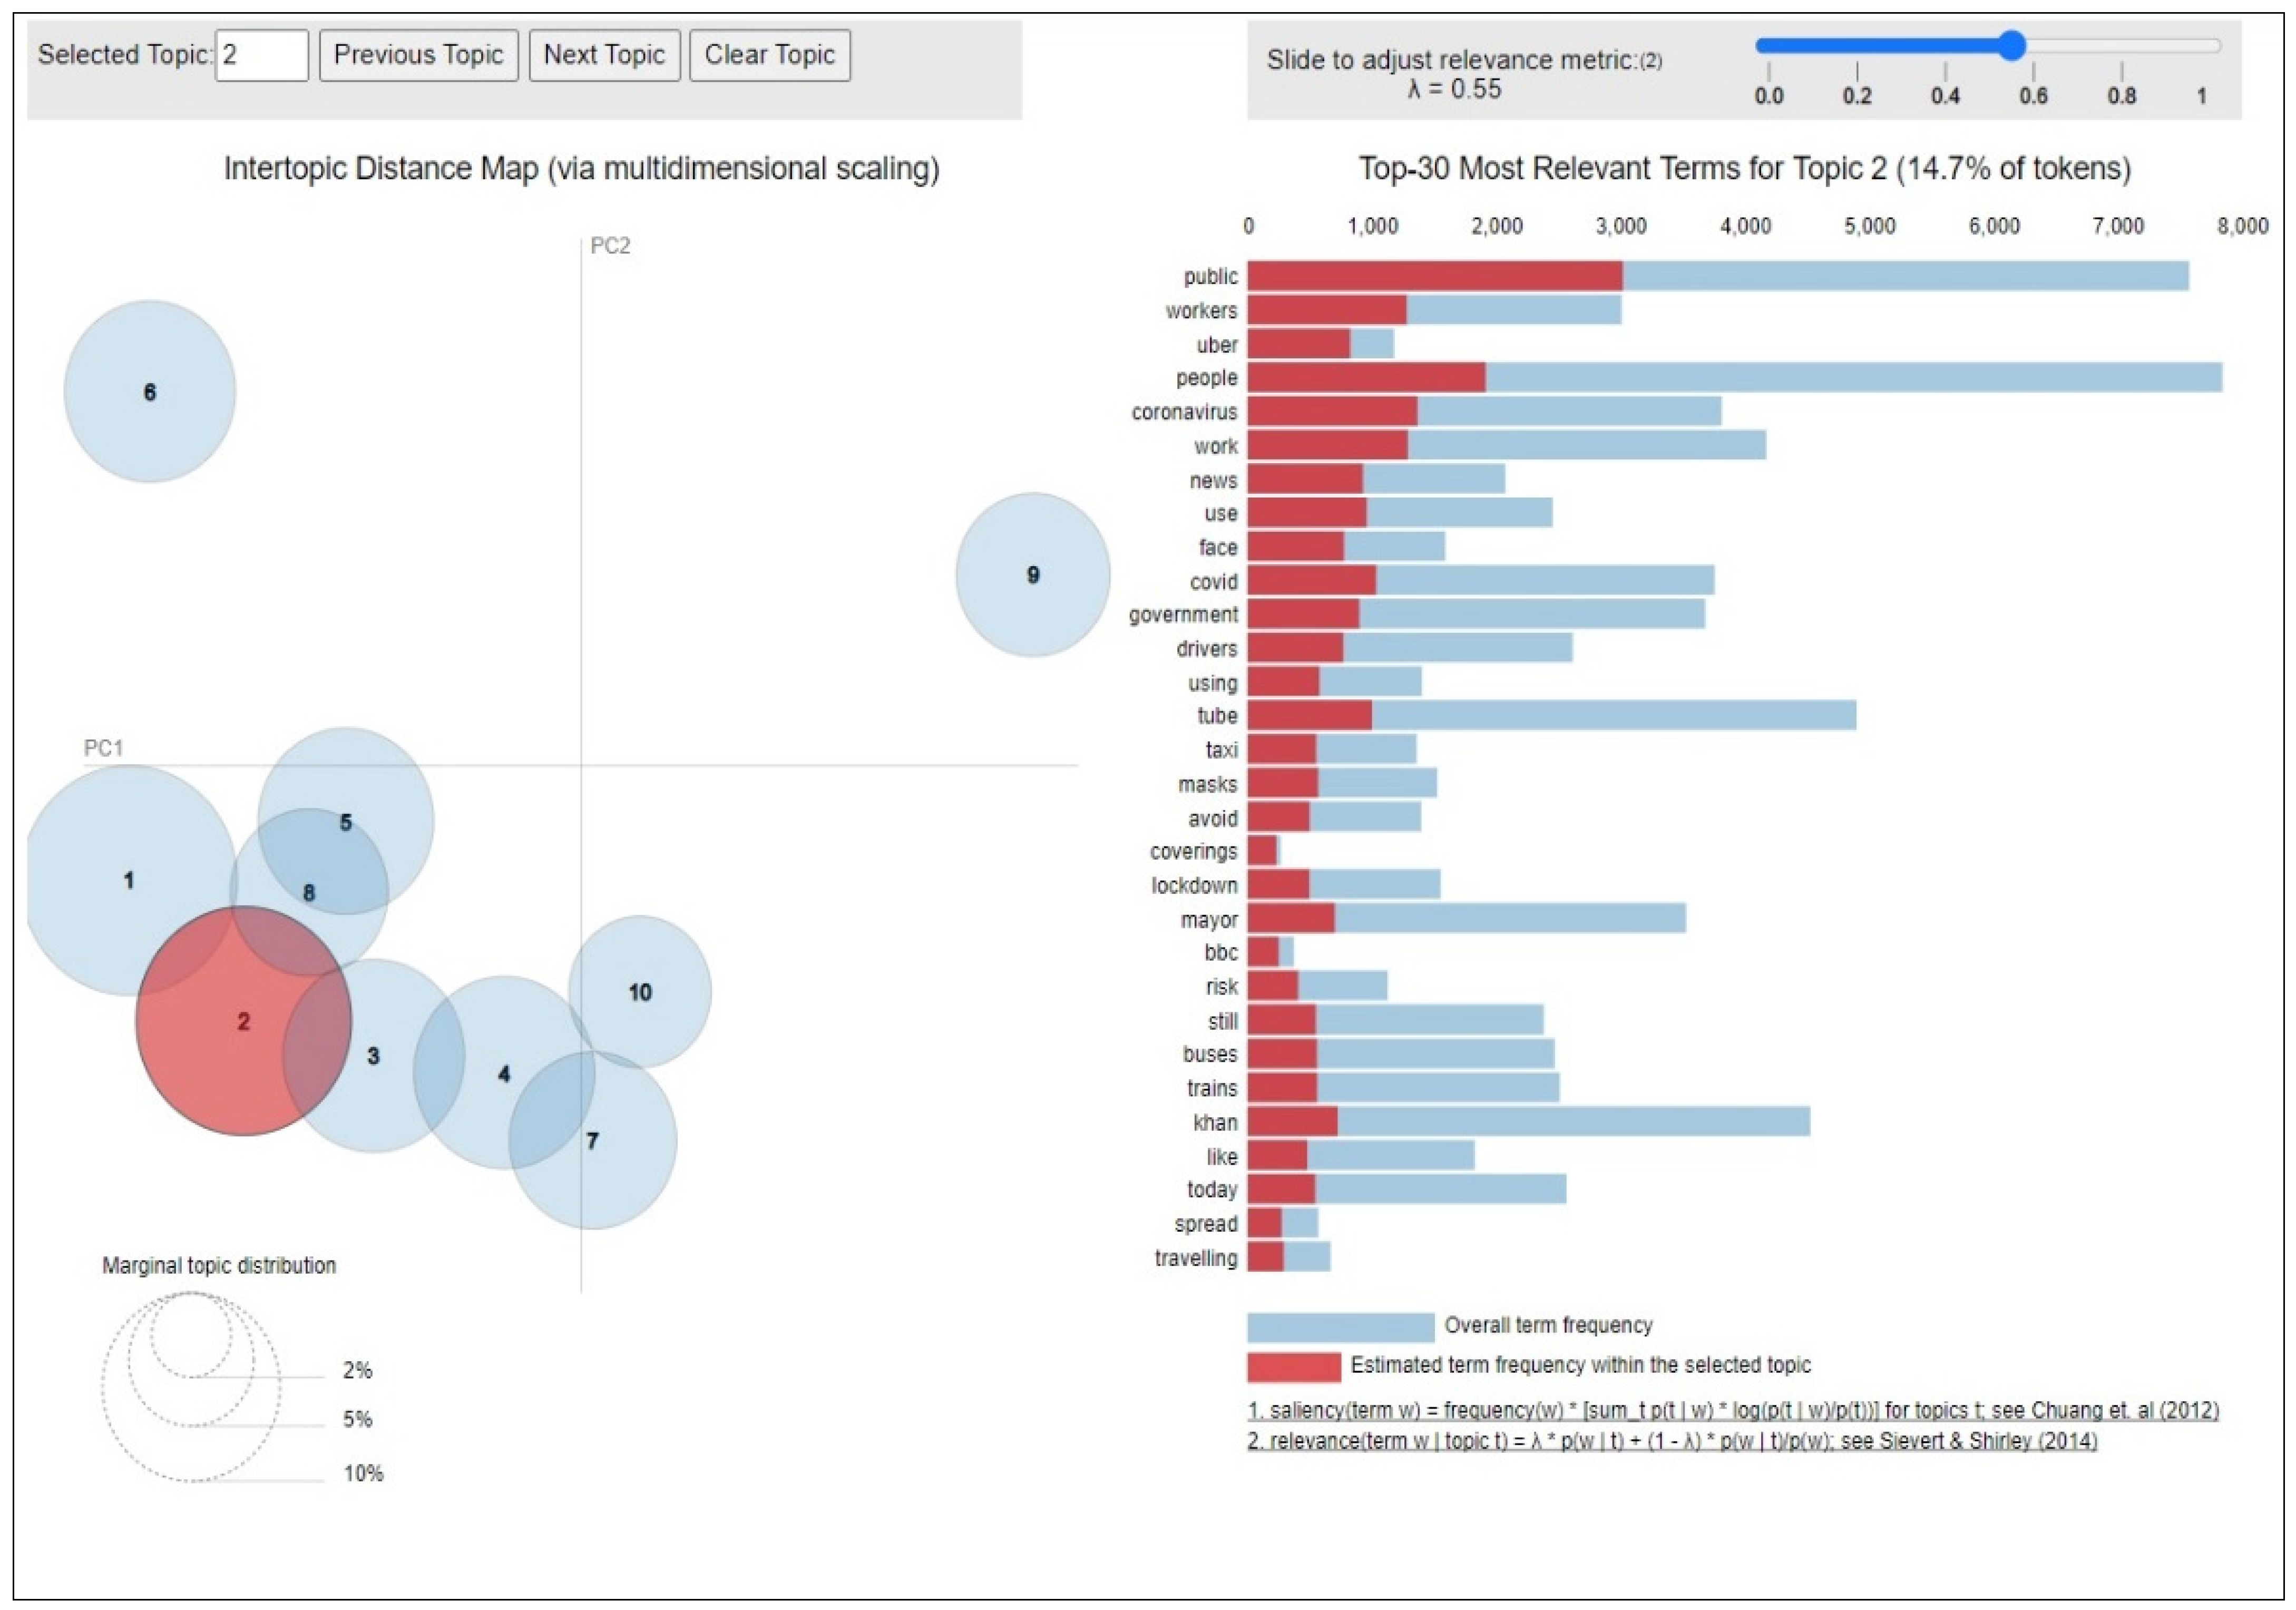
| Topic 2 | public, workers, uber, people, coronavirus, work, news, use, face, COVID, government, drivers, using, tube, taxi, masks, avoid, coverings, lockdown, mayor, bbc, risk, still, buses, trains, khan, like, today, spread, travelling | Health and safety protocols | 14.7 |
| Topic 3 | free, charge, public, congestion, new, get, travel, use, standard, tube, bailout, evening, one, avoid, bus, transit, increase, pay, transportation, COVID, work, car, cycling, peak, monday, mad, day, possible, government, news | Traffic and public transport operational conditions | 10.4 |
| Topic 4 | khan, sadiq, banksy, mayor, bailout, outbreak, boris, belly, money, jonhson, coronavirus, mujinga, cycle, wildlife, system, government, ban, city, years, blame, says, govt, waste, emergency, one, debt, lanes, poor, artist, award | Government and social consequences of the pandemic | 10.3 |
Publisher’s Note: MDPI stays neutral with regard to jurisdictional claims in published maps and institutional affiliations. |
© 2021 by the authors. Licensee MDPI, Basel, Switzerland. This article is an open access article distributed under the terms and conditions of the Creative Commons Attribution (CC BY) license (https://creativecommons.org/licenses/by/4.0/).
Share and Cite
Politis, I.; Georgiadis, G.; Kopsacheilis, A.; Nikolaidou, A.; Papaioannou, P. Capturing Twitter Negativity Pre- vs. Mid-COVID-19 Pandemic: An LDA Application on London Public Transport System. Sustainability 2021, 13, 13356. https://doi.org/10.3390/su132313356
Politis I, Georgiadis G, Kopsacheilis A, Nikolaidou A, Papaioannou P. Capturing Twitter Negativity Pre- vs. Mid-COVID-19 Pandemic: An LDA Application on London Public Transport System. Sustainability. 2021; 13(23):13356. https://doi.org/10.3390/su132313356
Chicago/Turabian StylePolitis, Ioannis, Georgios Georgiadis, Aristomenis Kopsacheilis, Anastasia Nikolaidou, and Panagiotis Papaioannou. 2021. "Capturing Twitter Negativity Pre- vs. Mid-COVID-19 Pandemic: An LDA Application on London Public Transport System" Sustainability 13, no. 23: 13356. https://doi.org/10.3390/su132313356
APA StylePolitis, I., Georgiadis, G., Kopsacheilis, A., Nikolaidou, A., & Papaioannou, P. (2021). Capturing Twitter Negativity Pre- vs. Mid-COVID-19 Pandemic: An LDA Application on London Public Transport System. Sustainability, 13(23), 13356. https://doi.org/10.3390/su132313356