Abstract
A seemingly unresolved debate in urban planning is the call for compactness and the provision of intra-urban green spaces. This article defines a multi-scalar spatial planning model for peri-urban areas and urban voids able to reconcile medium to high building densities with the provision of ecosystem services. The research is framed within design science research, and the theoretical definition of the model was followed by its application to the International Hub for Sustainable Development (HIDS) proposed by the University of Campinas, Brazil. The model’s parameters and indicators derive from a literature review, case studies, and GIS spatial analyses. A series of expert workshops and a survey were carried out to test and validate the model. The results show that the model can support knowledge-based development in peri-urban areas with high levels of population density while ensuring good accessibility to green spaces and productive landscapes. The model can serve as a planning and design tool and support the development of public policies for other contexts committed to more resilient and sustainable development.
1. Introduction
Since the post-war period, urban sprawl has been on the increase worldwide. In fact, most urban areas have expanded their areas beyond their population growth rates [1,2]. Sprawl poses a range of challenges to urban management, with increased needs for expanding infrastructure, transport, and other services; for residents, in terms of lack of access to those; and to ecology due to land fragmentation, degradation and destruction of habitats. Additionally, increased rates of urbanisation are linked to higher urban temperatures and greenhouse gas emissions. While climate change is our most pressing issue, not a single G20 country is in line with the Paris Agreement [3]. Controlling land take remains one of the main difficulties for local governments in developing countries [4]. Competing agendas are at play since the real state sector is a significant employer, a motor of economic growth, and housing needs are still to be met. Yet, equating urban development with local needs in a sustainable and resilient manner is critical.
The call for dense, compact, mixed-use and traditional urban structures were at the core of the severe criticism placed against modernist planning at the birth of urban design as a discipline in the 1960s. The 1990s saw a renewed interest in compactness as a potential counter option to urban sprawl towards a more sustainable way of urban living [5]. Principles of the compact city model include compactness, density, diversity, mixed uses, sustainable modes of transportation and green spaces [6]. Although many authors claim this model to be capable of absorbing urban population while also protecting the environment [7,8,9], revisions of the model question its capacity to effectively bring nature close to residents [10,11]. Haaland and Konijnendik showed that the provision of urban green space in compact cities is a major challenge and that densification processes tend to pose threats to existing and planned urban green spaces [12]. Within the frame of the compact city, the loss of urban green spaces is seen across typologies [13], including allotment areas [14] and recreational sites [15].
In turn, since the emergence of the garden city idea, approaches that put good access to green spaces and their generous provision at the core are posited as contrasting to the compact city model. Popular preference to live in detached houses, in privacy and close to nature, has fuelled the splendid growth that suburban development has had in the last 70 years [16] and may have a resurgence given the recent mobility patterns suggesting a potential move away from urban areas seen during the COVID-19 pandemic. Planning debates have shown a persisting dichotomist approach in considering the benefits and shortfalls of such models [17,18].
While principles of urban sustainability such as compactness, medium-high density, walkability and liveability continue to be significant, the question of the presence and the roles of nature in urban planning has recently taken centre stage. The concept of green infrastructure (GI), defined as a strategically planned network of natural and seminatural areas aimed at delivering a range of ecosystem services [19], and more recently that of nature-based solutions (NBS), as actions inspired by, supported by or copied from nature that aim to help societies address a variety of environmental, social and economic challenges [20], have been used in the planning, delivery and stewardship of ecosystem services in and around urban areas. There is considerable evidence that green spaces bring a range of benefits to people [21,22], such as stress reduction [23], beauty, places for active and passive recreation and direct contact with nature [24]. During the recent pandemic, it was noted how their use increased, despite lockdowns and restrictions to mobility [25,26]. In cities, green spaces reduce temperatures, help prevent flooding and improve air quality, among other advantages [27,28]. More and more, nature is considered a key ally in combatting climate change [29,30].
Sustainable cities can arguably have many forms [31,32]. Planning debates on the roles of urban morphology on indicators related to sustainability often consider distinct planning models potentially appropriate to face current global challenges. Research on planning models has shown progress on integrating ecosystem services into planning [4,33] and on seeking to overcome the distance between compactness and the provision of ecosystem services in cities through new frameworks and methods [34,35]. Artmann et al., for instance, proposed a framework combining the concepts of smart growth with that of green infrastructure [36], and Ritcher and Behnisch put forward a methodology for multicriteria assessment of environmental concerns [37]. There has been too modelling research into aspects of density and accessibility to green space [38,39,40]. Despite advancements, research on linking compactness and the green city often treats density as a parameter instead of a central element of the equation. Furthermore, there is a lack of multi-scalar models dealing with the peri-urban areas and in the context of developing countries [41].
This article aims to present, test and validate a spatial conceptual model able to balance density and green spaces in the planning and design of peri-urban contexts, particularly for knowledge-based urban development areas. It addresses the following research questions: (1) how can medium/high densities be reconciled with the provision of green spaces in a peri-urban context for knowledge-based urban development? (2) in which way can the definition of a spatial planning model help in the proposition of solutions for a new development area? (3) How can the model contribute to a circular economy? (4) How can both urbanity and access to nature in a liveable and healthy environment be provided?
The model shows that achieving compactness and high densities do not exclude the adequate provision of green spaces. The multi-scalar approach employed allowed for the integration of ecosystem services into design thinking, and the integration of urban, peri-urban and hinterland areas.
The next sections describe the background of this research and the methods utilised. The presentation of the spatial planning model in its three scales: micro, meso and macro follows. Subsequently, the model is applied to the case of the International Hub for Sustainable Development (HIDS) in Campinas, Brazil. The discussion brings together the key findings, puts them in relation to the state of the art, and suggests further research directions. We conclude with reflections on how this research addresses the question of compactness and greenery in cities today for knowledge-based urban development in peri-urban areas.
2. Background
The starting point of this research was the current planning of HIDS. Considering the need to prevent further land fragmentation due to sprawl, infilling with the generation of compact and multifunctional urban spaces has become crucial for creating liveable and sustainable environments [9].
In Brazil, as in other Latin American countries, new urban patterns mostly associated with the upper-middle classes, such as gated communities, have emerged in the past decades as a reaction to increasing urban violence. This resulted in low-density, scattered urbanization around metropolitan areas [42], leading to even higher social segregation and negative environmental impacts [43,44,45]. As a result, the peri-urban circles around large cities in these countries often show an asymmetrical occupation of poor and affluent populations. Different factors led to this uneven distribution, such as the presence of landfills, in the former case, or amenities such as natural parks or university campuses, in the latter.
The city of Campinas, in the state of São Paulo, is the fifth largest urbanised area in Brazil and displays a typical pattern of uneven peri-urban areas. Favelas were formed in the western skirts of the city, while upper-class residential neighbourhoods and gated communities were implemented in the north, close to former prominent coffee plantations and to the University of Campinas’ (UNICAMP) campus, created in the 1960s. The university’s presence stimulated the subdivision of existing farms into residential neighbourhoods and gated communities, increasing land value and resulting in real estate speculation and a discontinuous urban fabric interspersed with natural forest patches and protected areas.
The case of Campinas is a recurring pattern. During the 20th century, many university campuses were founded in the peri-urban areas of Brazilian cities, where land was affordable. However, these universities are now interested in implementing a more bustling and diverse urbanization model around them to attract high-technology firms and establish innovation hubs. Yigitcanlar has defined the new “knowledge-based urban developments” as “a place containing economic prosperity, environmental sustainability, just socio-spatial order and good governance” [46]. They support the production of knowledge through interactions between the interested parties that make this process possible. The current view of such areas has been represented by a quintuple helix model of innovation, in which society and the environment extend the triple helix model of academia (the university), industry and government. The built environment is thus an essential part of the system, shaping and accommodating the production of knowledge [47]. Knowledge districts bring together universities, research centres, and companies to promote the transfer of the most advanced scientific knowledge to the productive sector. They depend on dense and active urban spaces to promote social interaction and foster innovation. Their desirable qualities include not only scientific facilities and services but also social amenities, such as accessible public spaces with unique surroundings, such as waterfront locations, national parks or historical sites [48].
In face of the growing importance of the knowledge economy, and with the lack of adequate models for creating the desired ambience and at the same time dealing with the natural fragilities of peri-urban regions, city planners often find themselves stuck between gated communities’ developers’ expectations and the need to implement knowledge-based urban areas, which could be more sustainable both socially, environmentally and economically.
3. Materials and Methods
This research is framed within Design Science Research, which advocates the reduction of the gap between theory and practice, proposing solutions to real problems. By applying the solutions and evaluating their results, knowledge and new theoretical frameworks for science can be generated through an evidence-based approach, not only in an exploratory and descriptive way, but also prescriptive [49,50,51]. It too draws from research through design, as the design process is an integral part of the research [52,53]. A spatial planning model articulating density parameters with the provision of greenery was developed and subsequently applied to the planning and design of HIDS.
We built on Nassauer and Opdam’s analytic framework [54] for knowledge innovation (Figure 1), which goes from process analysis to a phase of translating the acquired knowledge into planning and design rules and, finally, their application to a site-specific case. Hence, the first stage of the work involved the definition of parameters of compactness and landscape metrics and indicators (Figure 1’s green rectangle). This was done through an expert workshop, literature review and case studies analyses [55]. In the second stage (blue rectangle), the spatial concept model was developed across three main scales: the urban block, the district, and the city, considering the area of HIDS. Further details of specific methods employed in the definition of the model are presented in the respective sections. In the third stage (Figure 1’s pink rectangle), policy analyses and regulations relevant to the HIDS’ site were undertaken, and spatial data collected and generated. Subsequently, the model was presented and discussed in focus groups with experts in environmental sciences and urban planning, and in a public event with experts in agroforestry. Finally, the model was applied to the HIDS area through a series of design events. As Madureira and Monteiro showed, the relationships between density and green spaces are strongly mediated by the quality of the latter [56]. Hence, this research brings together quantitative data, its analysis and evaluation, and qualitative design. These events involved academics, the local authority planning department and other stakeholders. A questionnaire on the usability of the model was completed by the design teams at the end of the process, which helped to evaluate and validate the model. They were asked whether and, if so, how the model was useful in the design process and for feedback on its potential improvements.
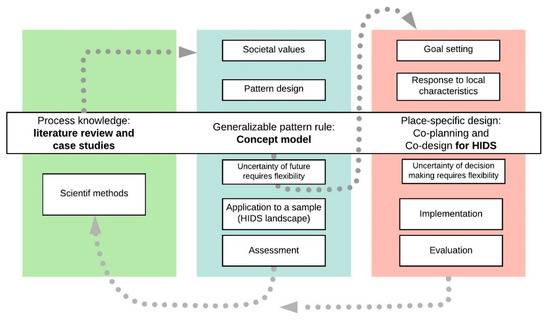
Figure 1.
Diagram of the methodological framework.
4. The Spatial Planning Model
This section presents the spatial planning model proposed to reconcile density with the presence of nature, in a context of knowledge-based urban developments. It was developed to find a balance between the delivery of a range of ecosystem services, while concomitantly allowing for medium-high densities. Density is here considered as the net housing density and net building density. Net housing density refers to the number of dwelling units per hectare of net residential area (considering only predominantly residential plots). The net building density is represented by the Floor Area Ratio (FAR), which means the relationship between the total amount of the building’s floor area (gross floor area) and the total area of the plot on which it stands.
The following subsection introduces the scale of the urban block, which will be followed by the meso and macro scales. The work in the various scales was cyclically revised after the results from the various stages were produced. The whole model was evaluated, finetuned and validated through the process of its application to the planning of HIDS.
4.1. The Urban Block
This initial stage of development sought to explore the concept of an “ideal urban block”. It was developed from the guidelines and parameters established by Sanches [55] and complemented by the analyses of more than 400 case studies worldwide and a literature review. The following metrics were selected to maximise the provision of green spaces while providing the highest density. For green spaces, they are a minimum of 35% of green space area, a maximum of 26 green spots, the minimum average size of the green areas of 240 m2, and the maximum average distance between green spots of 7 m. With regards to the built-form and density, they are as follows: intra-block parking area of up to 10% to minimise its presence, the maximum Building Coverage Ratio (BCR) of 57%, the minimum Floor Area Ration (FAR) of 1.5, the minimum of 220 density of dwelling units per hectare (du/ha), and the minimum size of apartments of 90 m2 (Figure 2).
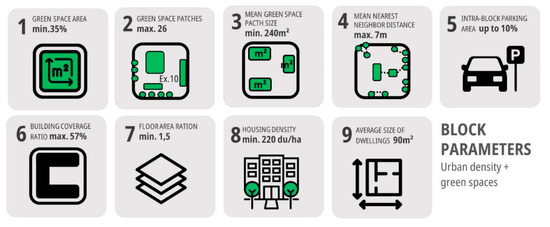
Figure 2.
The urban block metrics.
A design workshop was subsequently organised with a multidisciplinary group of experts (see Section 4.3) who were asked to employ and test the selected metrics in proposals for a generic urban block.
Besides the metrics adopted in the workshop, types of intra-block green spaces were categorised based on accessibility and use. This stage was too based on literature review and analyses of case studies [55]. Four types were defined (Figure 3):
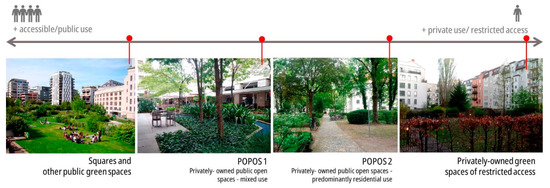
Figure 3.
Types of intra-urban green spaces defined for the spatial planning model ordered by level of accessibility and use, from public to private.
- Squares and other green public spaces;
- Privately-owned public open spaces (POPOS 1) [57], which are private green spaces where mixed uses prevail on the ground floor, with active facades. The inner area of the block is accessible, with entrances on at least two sides of the block;
- Privately-owned public open spaces—2 (POPOS 2). Predominant in residential areas, in open or semi-open blocks, these green spaces allow access to non-residents but are more secluded;
- Privately-owned green spaces of restricted access. These are residential courtyards and gardens with resident-only access.
4.2. The Meso Scale: The Neighbourhood and the District
The second stage addressed the neighbourhood and district scales. By defining the typology of green spaces at this scale, we sought to equate urban and ecological connectivity issues and explore different degrees of urban density (housing and general building). The types of green spaces selected were linear, given their ability to extend throughout the territory and link to existing natural patches and agricultural areas (Figure 4). They are:
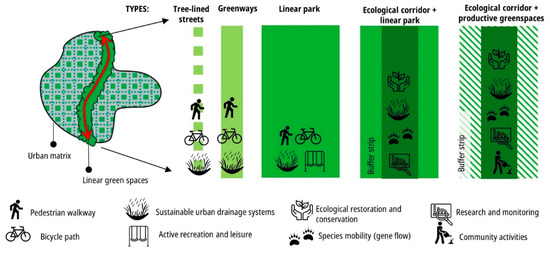
Figure 4.
Types of linear green spaces in the spatial planning model at the neighbourhood and district scales.
- Tree-lined streets: street, avenues, boulevards that are predominantly tree-lined and, when possible, with permeable pavements and flowerbeds on the sidewalks.
- Greenways: green corridors with pedestrians and bicycle paths, in which active mobility is the primary function.
- Linear parks: linear green spaces, providing multiple ecosystem services.
- Ecological corridor and parks (buffer strip): forested corridors connected to natural patches of relevant ecological value. They allow for the movement of fauna and provide a buffer strip with uses akin to linear parks to minimise edge effects (whether anthropic or natural) [58,59,60,61].
- Ecological corridor and productive green spaces (buffer strip): similar to the type above, but with buffer strips for productive uses, which can be areas of urban agriculture, agroforestry or forestry with native species.
The minimum widths of these green spaces must be adapted to their local context. Since Campinas, Brazil, is the location of our test case, we adopted the minimum requirements as stipulated by its local legislation.
Productive green spaces associated with ecological corridors take into account circular economy precepts [62]. Food and forestry products produced are intended to be primarily consumed and used on site. This approach supports the development of community-driven urban allotments, which provide direct access to zero-kilometre food and encourage healthier food consumption habits [63]. Locally sourced timber would be employed in the building construction. Other benefits include the reduction of CO2 emissions related to the reduced need for the transportation of goods and the use of renewable materials. The model can thus be a thriving force to foster circular economy.
Following a density gradient logic, based on a series of studies on the impact of urbanisation on urban biodiversity, such as due to noise levels, traffic, number of people circulating, housing density and the height of buildings [61,64], we established three intervals (high, medium, low): the closer to a natural area with high ecological value (ecological corridors and natural patches) the lower the housing density and the floor to area ratio (FAR).
The linear green areas with a vocation for recreation and leisure (greenways and linear parks), and therefore destined for the intense use of the population, do not fit into this logic of gradients. As such, placing medium and high-density areas close to them would allow for the greatest number of people to benefit from their use.
The indicators of built-up and housing densities (high, medium and low ranges) were obtained with the aid of Principal Component Analysis (PCA), a multivariate analysis visualisation technique, from the raw data from Sanches [55]. The high-density intervals we use in the model are the ones previously defined for the urban block scale (Figure 2). In turn, the medium and low-density ranges were extracted from the data from sample blocks that distanced from the vectors of the PCA corresponding to the built-up and housing density variables (FAR and DOMIC) towards the vectors corresponding to the variables of the percentage of vegetation cover and the average size of green spots (PLAND and PATCH). Therefore, the lower the density, the greater the tree cover; that is, there is a negative relationship between these two parameters. The sample blocks selected as reference are indicated by the dotted circles in the PCA of Figure 5.
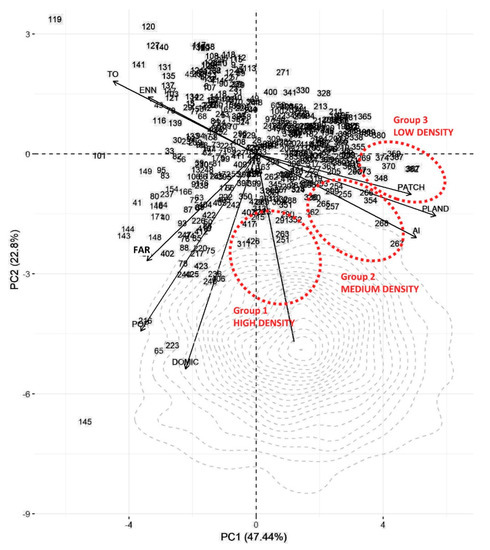
Figure 5.
Principal component analysis (PCA) ordination (triplot) for urban block data with density (DOMIC and FAR) and landscape ecology (PATCH and PLAND) variables. The PCA was used to set parameters of density intervals and percentage of vegetation cover. DOMIC and FAR are housing density and built-up density, respectively. PATCH and PLAND are average size of green spots and percentage of vegetation cover, respectively.
The model assumes a feasible scenario of implementation. Hence, we set housing density ranges (high, medium and low), and their respective FAR and maximum BCR, and the lowest minimum percentage of vegetation within the blocks, as seen in Figure 6.
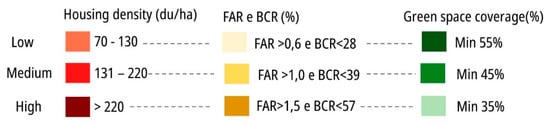
Figure 6.
Parameters of net housing density, net built-up density (FAR), building coverage rate (BCR) and vegetation cover rates with intervals defined from the PCA.
4.3. The Regional Scale
The third stage addressed the regional scale, and how to articulate the meso scale to the peri-urban landscapes, often marked by the coexistence of sprawl, agricultural areas, natural patches and traffic infrastructure, as is the case of HIDS. The main premises were to minimise the negative effect of highways as barriers to ecological and urban connectivity and the edge effect in the transition of contrasting land uses. At the same time, the aim was to push for compactness in order to support sustainable urban development, minimising sprawl over protected natural and productive areas.
Greenways were identified as a type of green space that would link the development area to the surroundings supporting active mobility. Ecological corridors were too employed at this scale to promote ecological connectivity of natural patches, natural areas of permanent protection, and natural reserves within the surrounding agricultural areas.
4.4. The Spatial Planning Model across Scales
Figure 7 presents the general framework of the development of the spatial planning model. It articulates the concepts, guidelines and theoretical principles explained above regarding the combined planning of green areas in a scenario of increasing urban density.
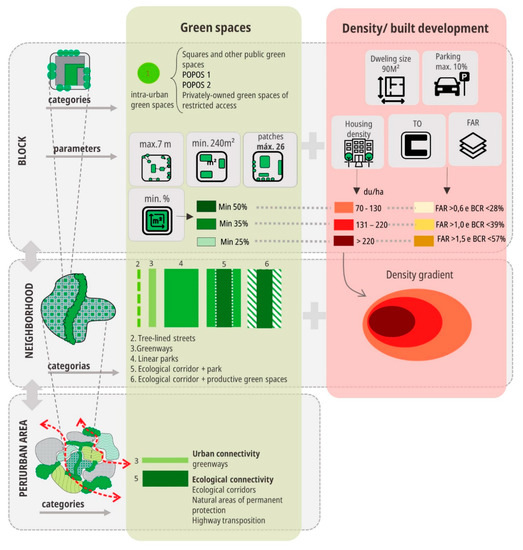
Figure 7.
Framework of the definition of the spatial planning model. The two themes, green areas and density, run across the scales (urban block, neighbourhood/district and the city/region).
The model is broken down into layers in Figure 8 to clarify its structure further and enhance its readability. Prior to implementing the density and green space layers, it is necessary to identify significant pre-existences such as urbanised areas and natural patches in the vicinity or on the edges of the site.
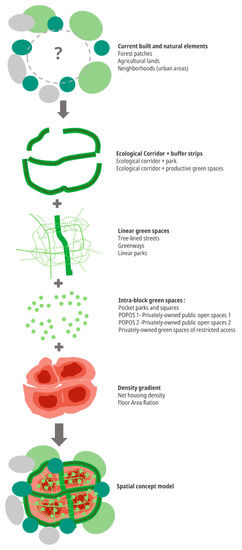
Figure 8.
The model broken down into green space layers and density gradients.
As a first layer, ecological corridors protected by buffer strips, which could be productive green spaces (agriculture, agroforestry, and forestry of native species) or parks are established as a priority. The second layer comprises the other types of linear green spaces: tree-lined roads, greenways and parks, which fulfil the role of ecological connectivity, active mobility and leisure. It is worth noting that the greenways are meant to go beyond the intervention area, linking across scales. The third layer comprises the green areas within the blocks, here represented by nodes. They are intended to be articulated to the tree-lined roads and the greenways. The fourth layer consists of the occupation of the territory according to a density gradient (distributed in three intervals of housing density and three intervals of building density) in which the areas closest to ecological corridors must present the lowest density rates, which gradually increase towards the centre of the urbanised area. The minimum percentages of intra-block vegetation cover also change depending on the density range in which the block is located, as explained in Figure 6. With all the layers overlapping, we have the complete model that can be replicated in similar contexts to HIDS.
5. The Case Study: The International Hub for Sustainable Development (HIDS)
5.1. Background
Campinas’ High Technology Hub Development Company (Companhia de Desenvolvimento do Polo de Alta Tecnologia de Campinas—CIATEC) was conceived in Campinas in the late 1970s, as a second-generation park next to the University of Campinas. Located 15 km north of the city centre, it was then expected to become the Brazilian Silicon Valley. In the 1980s and 1990s, a few private companies and two large public research institutes settled in the area, which, however, lacked the necessary infrastructure investments, and most of the land remained undeveloped.
According to Gyurkovics e Lukovics [65], first and second generation technology parks were based, respectively, on the “science push”and “market pull” models of innovation, and they were typically located inside or next to university campuses. Third generation parks, on the other hand, tend to be located in bustling city centres, and they are based on a different innovation approach, known as interactive or feedback-based, typically developed through living labs. They look less like parks and more like hubs, districts, or simply knowledge-based urban areas, and their aim is to “improve the welfare of the local community” and “the development of their regions”, connecting “the regional economy to the processes of knowledge-based economy”.
After acquiring a large land parcel in CIATEC in 2014, the University of Campinas proposed converting this second-generation science park into a third-generation innovation area, named International Hub for Sustainable Development (HIDS in the Portuguese acronym) (Figure 9). This conversion not only involves introducing new and updated infrastructure but also a renovation in terms of culture and objectives. The most significant change is the focus on a new economy that explores opportunities related to sustainable development, such as clean energy and lower impact urbanization. In order to achieve this goal, housing, services and public spaces must be introduced to generate density and a diverse and active urban environment, attracting innovative firms and creative researchers. At the same time, the area encloses historical heritage and natural forest fragments that must be protected and connected through ecological corridors. A careful environmental plan must be carried out in order to set up an exemplary scheme that is in harmony with the hub’s new guidelines. Moreover, the literature shows that many of the characteristics searched and valued by third-generation innovation hubs’ users relate to the quality of green areas and open public spaces. For this reason, the site seemed a perfect opportunity for the application of our model.
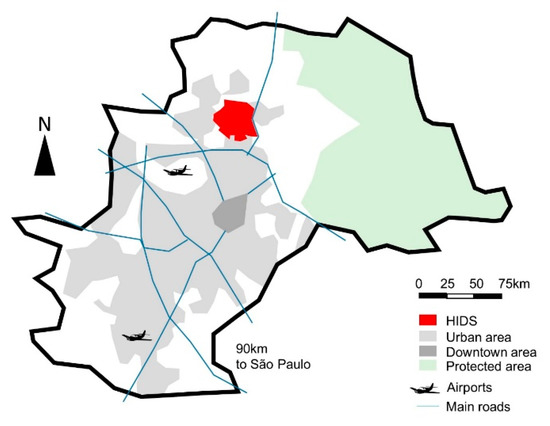
Figure 9.
Location map of HIDS, in Campinas.
5.2. The Site-Specific Data Collection
Geo-referenced data was collected from the municipality of Campinas data portal and statistical data from the IBGE website (Brazilian Institute of Geography and Statistics). The collection of secondary data covered themes such as environmental, socio-economic, spatial characteristics and planning legislation. Primary data comprising spatial, tabular, and textual data relating to HIDS was produced. It included land cover, the quantification of each land cover class, and the calculation of metrics, such as FAR and BCR. To obtain the land cover data, supervised classification was used. This remote sensing technique classifies the land cover from satellite images based on spectral and texture characteristics. Satellite images were obtained from Planet’s Skysat satellite sensor, with a spatial resolution of 3m and RGB and Near Infrared (NIR) spectral bands (bands 1,2,3 and 4—imaging date from 8 September 2020). The classifier selects the sampling units of pixels representing each land cover class, and the software generates an automatically classified image. The final product is a raster image, whose values for each pixel correspond to a certain cover class. We use the open source QGIS software and the Dzetsaka classifier (plugin) with the Random Forest classification algorithm. The land cover categories defined were: (1) tree and shrub, (2) herbaceous, grassland and agricultural land (3) impermeable areas, (4) river or lake and (5) bare soil.
The existing buildings in the HIDS urbanised cores were manually mapped, and the total built area was surveyed to determine the FAR and the BCR. This allowed for an understanding of the initial conditions related to density and availability of green spaces. Accordingly, “buildings” were added to the land cover map. For the calculation of the FAR and the BCR the total land area of each nucleus was considered, excluding the road system; that is, only the area of the blocks, which eventually houses, in addition to buildings, parking lots and common green areas, was used. After the mapping, the land cover classes were quantified in hectares and percentage in relation to the total area of HIDS and the area of each urbanised nucleus within it.
The result of the supervised classification obtained a Kappa index of 99.74% accuracy. The amount of each land cover class is shown in the pie chart below (Figure 10).
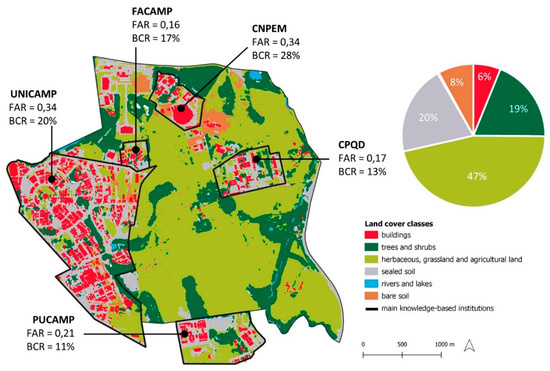
Figure 10.
HIDS’ land cover map and percentage of each class.
As expected, herbaceous and grass cover (including agricultural areas) is the predominant land cover (47%). However, the proportion of impermeable areas (20%), consisting of general pavements, parking lots and roads, exceeds the proportion of tree cover (19%). This is not surprising given the existing car culture, associated with precarious public transportation, making the automobile the primary means of mobility for many.
When we consider only the urbanised areas, the proportion of tree cover, herbaceous areas, and impermeable surfaces is very different from the HIDS as a whole, as shown in Figure 10. In this case, impermeable pavements are predominant, reaching 42% of the total, due to large areas destined for parking and paved roads. The buildings and tree cover reach similar values.
Low BCRs and FARs were observed, when compared to those practiced in the city of Campinas, and to the values established in the city’s master plan. Analysed alongside the tree cover, it is evident that although buildings do not intensely occupy the ground, the open areas present a much more limited tree cover than the site could accommodate.
5.3. The Application of the Model
This first stage was carried out through an international workshop (July 2020) that asked participants to consider how greenness, compactness and density could be achieved simultaneously at the scale of the urban block, alongside other sustainability criteria, with the use of computational tools.
One of the urban design proposals developed during the workshop is presented in Figure 11. It shows the compatibility between concepts and parameters of compact and dense green blocks and other sustainability criteria. In this example, as set in the spatial model, the vegetation cover reached 35% of the block area with a minimum FAR of 1.5 (performed with a FAR of 4.3). Inner-block green spaces are evenly distributed and relate to one another across adjacent blocks. Housing represented 60% of the total land us. The density achieved was 286 dwellings/ha (which met the parameter of a minimum of 220 du/ha). The results show that the green space and building density parameters were not mutually exclusive, and sound proposals were achieved.
Figure 11.
Urban design proposal developed during the international workshop in July 2020. Reproduced with permission of team participants.
Subsequently, the complete spatial concept model was applied to the full extent of the HIDS’ area in two expert workshops with planning professionals and architects. Prior to the design explorations, a presentation of the model took place and a list of the indicators given to participants.
The second exercise consisted of applying the spatial concept model from the macro to micro scale (January–February 2021). Firstly, participants had to consider the site’s related policies and characteristics (i.e., environmental regulations, water streams/bodies; natural forest patches, topography, existing buildings, road system, points of interest) and other requirements, such as sustainable mobility, at the macro scale. At the meso and micro scale, participants were challenged to develop a proposal for typical urban blocks for the HIDS’ area.
The exercise’s aims were to protect the current streams and natural vegetation, to promote high-density urban development, to connect the new urban blocks to current facilities in the HIDS and to the surrounding urban fabric. The spatial concept model was a tool offered to the participants to achieve these aims.
Nonetheless, each team was challenged with a different set of requirements: the first team had a pre-defined street network system as a constraint; the second team had to consider the current land ownership boundaries; and the third team did not have any constraints. This was intended as a way to explore the applicability of the model across different scenarios.
The urban designs presented some shared solutions: all teams worked with the model’s green spaces typologies such as the ecological corridors and buffer strips along them, which predominantly host productive functions (i.e., urban agriculture, agroforestry, community gardens), and linear parks. The three teams also proposed a large park in the Anhumas Valley, located in the east part of the HIDS, to protect the Anhumas River and its embankments (Figure 12, Figure 13 and Figure 14). Figure 12 shows one of such proposals. The team employed the urban density gradient logic set in the model as a starting strategy. As in the model, its greenways are independent of the street network, and linked to other green spaces categories, such as the Anhumas Park.
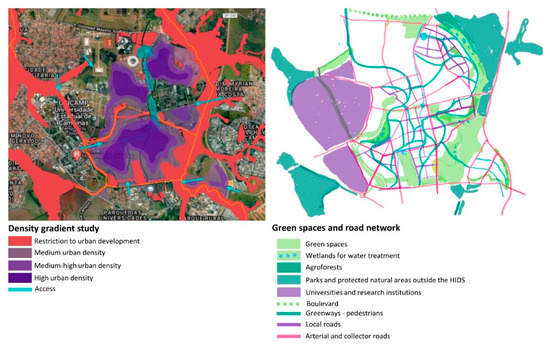
Figure 12.
Urban design proposal by Team 1 (pre-defined street network requirement). Reproduced with permission of team participants.
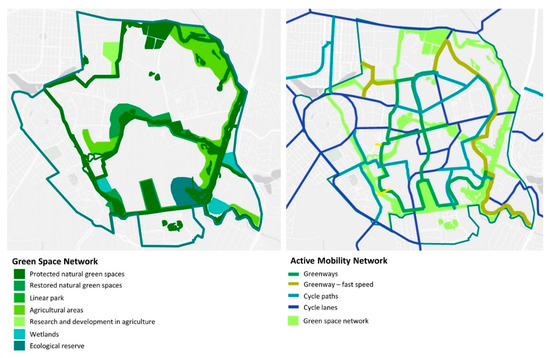
Figure 13.
Mobility network solution developed by Team 2 (fixed land ownership boundaries requirement). Reproduced with permission of team participants.
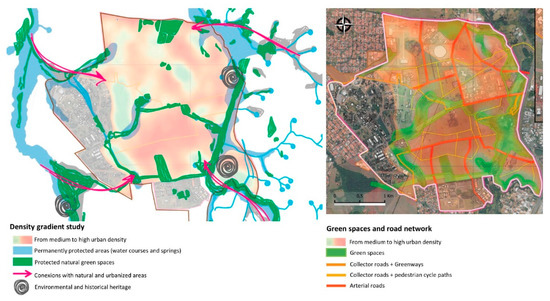
Figure 14.
The gradient of urban density related to green spaces and arterial road network proposed by Team 3 (no constraints). Reproduced with permission of team participants.
Besides the green spaces categories suggested in the model, Team 2 proposed wet-lands as a new green space category for water treatment purposes. They also included greenways along the boundary of Anhumas Park (Figure 13).
One of the main aspects of Team 3’s proposal is the adoption of the model’s density gradient - the closer to arterial roads, the higher the urban density; in contrast, the closer to protected natural green space (e.g., ecological corridors), the lower the urban density. Since the team was not bound by any design constraint, the model’s gradient density helped the team design the road system avoiding placing arterial avenues close to ecologically significant green spaces (Figure 14). The greenways were also designed independently of the arterial road network and linked to other green spaces.
All the teams went forward in the design process, resulting also in a neighbourhood design proposal at the level of massing, and the design of urban blocks, as a first exploratory design which were improved in the third exercise to be shown as follows.
In the third and last exercise (March–June 2021) participants were asked to further develop a smaller area of HIDS, working in the meso and micro scales. Two teams were responsible to develop two different urban centralities, named Central Plateau and South Centre. These areas were chosen because the Central Plateau is HIDS’ geographical centre, hence equidistant from existing facilities and institutions; and the South Centre because it presents the longest edge between public and private land within HIDS.
The teams were asked to develop mixed-use neighbourhoods (housing, retail, offices, public equipment/institutional use as schools, administration, etc., and science labs) and create two building density scenarios: FAR 2.5 and 3.5. Both design proposals adopted multifamily residential buildings as a solution to provide higher density. No buildings (residential, offices and retail) exceed seven storeys.
Although they pursued the same aim, each team adopted a distinctive urban morphological solution. The Central Plateau was developed considering the block as the minimum design unit, presenting the following morphological types: ¼ open block, half urban block and closed urban block [66]. These morphological solutions often generated a single larger green space courtyard in the block and assured aggregated green spaces, which helped achieve the maximum number of green patches and average green patch size set by the spatial model (Figure 15).
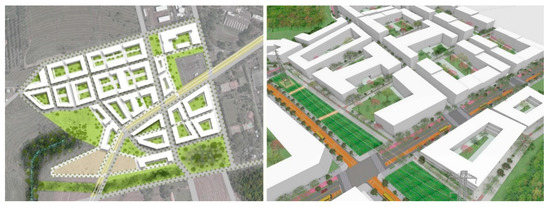
Figure 15.
Urban design proposal for the Central Plateau. Reproduced with permission of team participants.
In contrast, the South Centre proposal was based on plots as the minimum design unit, presenting point-block buildings and slab buildings with plinths as the morphological typologies [66]. Nevertheless, the team sought to establish green space continuity throughout the blocks by employing privately-owned public open spaces (POPOS) as per the spatial model (Figure 16).
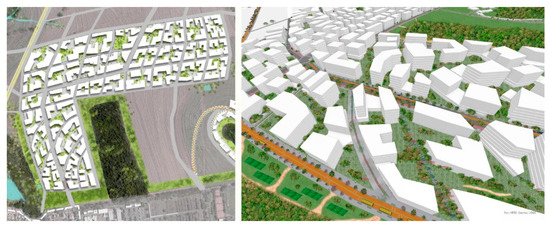
Figure 16.
Urban design proposal for the South Centre. Reproduced with permission of team participants.
Quantitative data about the proposal’s performance compared to the model’s parameters is shown in Table 1. We can see that the green space area, housing density value, FAR, BCR, parking area and average dwelling size are either very close to the model’s parameters or reaches even higher values and better performances.

Table 1.
The design’s performance compared to the model’s parameters.
5.4. Evaluation and Validation of the Model
One of the most relevant aspects of this research was validating the spatial planning model through its practical application in the design exercises discussed previously. Through the series of workshops, an iterative process of testing and evaluating results generated improved propositions that, in turn, took the designs in new directions [67]. The design science research approach undertaken meant the definition of evidence-based solutions and the evaluation of their results in real-time. This, in turn, can contribute towards reducing the gap between theory and practice. The ability to continuously assess both the projects and the model was one of the main benefits of the approach.
The survey carried out with the design teams after the third exercise confirmed that the quantitative and qualitative parameters provided at the beginning were constantly considered, even though some found it challenging to follow them through all stages of the design process. In the end, the participants considered the model helpful for the definition of an urban landscape with the desired qualities.
The green space categories at the meso scale were adopted by most participants as strategies for ecological connectivity, urban connectivity, to enhance biodiversity and to provide a range of ecosystem services. The density parameters were fully adopted or used as the starting point for the setting of other indicators.
As a model is a simplification of reality, it must be selective. In this research, the focus was on density and green spaces. Nevertheless, participants felt the need to integrate other aspects in the design process (e.g., urban climate, energy efficiency, mobility and TOD—Transit-Oriented Development, sustainable water management, vitality and liveability, etc.). In some cases, however, participants applied the model literally, laying down some spatial elements as schematically suggested, such as the linear parks and density gradient distribution. This misunderstanding of the model’s application must be avoided, since it may lead to a limited and less creative proposal.
In all exercises, participants freely adopted an intermediate density level morphological solution influenced by the recommendation of recognized experts in urban planning and most recent literature [8,68,69] as a way to achieve a better-quality urban design. Thus, the model was not applied and tested in morphological solutions that are in the extremes of the BCR range, i.e., detached single family houses and high-rise buildings [70]. This is in line with the model’s intention, since it focuses on knowledge-based developments in peri-urban areas, where these morphological types are not desirable.
Although the model has been applied in urban design proposals of intermediate density, we noticed how variable and diverse the morphological solutions could be for an existing area and a real context, demonstrating the feasibility to embed qualitative guidelines and reaching ideal green space and density parameters, thus enabling its validation.
6. Discussion
Low-density monofunctional sprawl on urban fringes remains one of the most unsustainable patterns of urbanisation. Although promising proximity to green areas or the countryside, their very proliferation threats both. They lead to the disaggregation of urban form and landscape fragmentation, relying on private modes of transportation and putting pressure on municipal governments to extend the reach of services [71]. This article proposes a mixed-use spatial planning model that balances compactness, densification, and the delivery of ecosystem services in peri-urban areas. It aims to support sustainable and resilient development at the urban fringes associated with the establishment of new knowledge-based areas, and to connect intra-urban areas and the hinterland [72].
Knowledge-based urban development requires space commonly found through urban regeneration projects or in peri-urban areas. It has been shown that such developments, besides spurring innovation and the dissemination of knowledge [73], can become new economic and social nodes in cities. Yet, they are often seen as enclaves with a limited range of land uses, and underdelivering on aspects of liveability and ecological connectivity. The results revealed insights on how to address these challenges concomitantly.
Firstly, as suggested by Artmann, Inostroza and Fan, there is a need for innovative concepts and comprehensive planning strategies across scales for compact and green cities [17]. This research confirms that a multi-scalar and systemic approach is necessary to bridge the gap between compactness, densification and the provision of green spaces in cities. Multifunctionality, argued by Hansen et al. [74] as a crucial strategy for green space in compact cities, is acknowledged as a vital principle. This was achieved by linking quantitative data with design science research, which allowed for the development of solutions in which evidence-based design and real-time testing are realised throughout the process. As models lack the complexity of reality itself, planning must ensure that challenges are holistically addressed. The model here proposed is flexible and must be tailored to context. Local policies and site-specific considerations ought to directly inform it.
Secondly, following the initial input of the model, design activities were crucial to assess its effectiveness to guide the development of proposals and finetune it. On the one hand, such an approach can enrich meaningful participatory processes [75], as a continuous loop [67] of testing, reaching results and assessing them occurs, and, on the other hand, addressing design quality [56]. In this process, after the model’s evaluation, further considerations according to place-specific needs were identified. For instance, including additional building density parameters at the block level, such as maximum building height, to encourage compactness while providing morphological solutions at human-scale, could be helpful. Furthermore, mixed-use parameters, such as percentage of retail/offices or employment density, could contribute to walkability and liveability. The definition of “Ecological corridor and park” and “Ecological corridor and productive greens spaces” must minimise possible conflicts between vegetable growing and biodiversity conservation (e.g., wildlife risks due to increased predation, exotic species negatively affecting local ones, farming yields being affected by the consumption of vegetables by wild animals, etc). Furthermore, creating a minimum percentage for local food production could ensure that the benefits deriving from this activity are embedded into the model. There is scope for further research into computational approaches for implementing the block-level parameters and evolutionary algorithms to generate design options for the maximisation of specific attributes. In addition, future activities ought to further the use of the model as a tool for participatory design with local communities and stakeholders. Since the model is abstract, the agreement upon it can guarantee that ecological principles will be followed, but still leave room for the design of alternative urban forms, as shown above in the exercises developed.
Thirdly, studies about place quality in innovation districts highlight the importance of providing mixed uses and a variety of public open spaces designed and managed to spur interaction, learning and networking. In such contexts, public open spaces when “designed and programmed well (…) can be the connective tissue between people and firms, effectively serving as the heart of a healthy and vibrant innovation ecosystem” [76]. Furthermore, dense, walkable, and highly connected urban areas encourage a collaborative and open culture of innovation. They favour face-to-face encounters, an important aspect for innovation sectors that often demand the exchange of complex, tacit knowledge among their workers [77]. Recommendations have also been made for setting parameters for zoning-related parking to reduce it to a minimum and place it in specific sites to encourage multimodal transportation, including active mobility. The model addresses both issues. Linear parks, either as a category in itself or as buffer strips, establish a large perimeter of contact to mixed-use areas, enhancing connections to the urban fabric. The green spaces inside the blocks, whether squares or POPOS, enable “third places” which are “particularly desirable for young tech employees compelled to rent micro-units or share spaces to keep monthly rent low” [78]. The parameter of a maximum parking area at block scale also contributes to enlarging inner-block open spaces and encouraging active mobility when linked to greenways for slow mobility, as defined in the model.
Fourthly, addressing climate change through urban development must include principles of circular economy [62]. The question of the economic viability of sustainable solutions frequently challenges their consideration in favour of standard practices. This research shows that taking a positive approach towards policy “restrictions” and regulations and using them as guidelines for a configuration of hybrid and multifunctional spaces unlocks a range of economically viable benefits within the frame of sustainable urban development. Furthermore, such an approach enhances the sites’ resilience, generating uses and functionalities that span various anthropic and natural needs. The research advances thinking in how the choices of direct ecosystem services to be delivered and understanding their socio-economic values can be catalysers for employing nature-based solutions. Direct ecosystem services such as food [79] and timber [80] that can be consumed and employed locally are just some of such viable solutions.
Finally, the research shows that a spectrum of residential and building density can be developed in tandem with ranges of green space provision. Furthermore, we argue that, especially in new development, the definition of green infrastructure and nature-based solutions must be established concomitantly to the built form, indexes of density and other land uses. The integration of GI and NBS into overarching planning processes maximises the possibility of a balanced environment where the benefits of urbanity and those from ecosystem services can be achieved.
7. Conclusions
Compactness, density and green space are not mutually exclusive. Green infrastructure and nature-based solutions need to be integrated into planning processes, and not considered as separate add-ons. The spatial structure suggested by the model provides the armature for a range of horizontal and vertical nature-based solutions of various scales to be included into the final plan.
Aligning density gradients with the provision of selected ecosystem services can enhance accessibility to green areas and minimize conflicts and trade-offs across potentially competing needs, such as the integrity of ecological corridors and high anthropic use of open spaces.
Peri-urban contexts are the very place where sprawl occurs. Such areas are normally object of low-density development, fragmentation due to infrastructural building and the force field where agricultural and natural land is taken. In turn, given the availability of land and consequential larger potential to offer ecosystem services, they must be a focus of attention. The model articulates development with the planning for enhanced ecosystem services, bringing higher densities to the urban fringe and establishing ecological connectivity between the consolidated urban areas and the hinterland.
Hybrid landscapes that articulate urban allotments and gardens and agroforestry with development areas can support circular economy principles. Access to zero-kilometre food and materials (i.e., timber) for building and furniture construction can strengthen well-being while boosting local jobs and economic benefits for residents. In addition, agroforestry can provide ecologically sound transitions from inner urban areas to rural landscapes, enhancing biodiversity and supporting agricultural production.
As such, the role of design is crucial. The model is a vehicle developed from quantitative and qualitative approaches to combine urban and environmental planning preoccupations and principles. It provides both urbanity and access to nature. Its application into plans must incorporate a comprehensive analysis of the territory and its specific needs. The transformation of the peri-urban areas as here proposed can allow for a reconfiguration of planning from the edges, supporting more sustainable, liveable, and resilient environments.
Author Contributions
Conceptualization, all authors; methodology, P.S. and G.C.; software, P.S.; validation, P.S. and G.C.; formal analysis, P.S. and G.C.; investigation, F.L.d.O.; data curation, P.S.; writing—original draft preparation, F.L.d.O. and P.S; writing—review and editing, F.L.d.O.; visualisation, P.S.; supervision, F.L.d.O. and G.C.; funding acquisition, all authors. All authors have read and agreed to the published version of the manuscript.
Funding
This research was funded by São Paulo Research Foundation (FAPESP), grant number 2019/25369-3, CNPq, grant number 304370/2020-7, and Politecnico di Milano. It was also financed in part by the Coordenação de Aperfeiçoamento de Pessoal de Nível Superior—Brasil (CAPES)—Finance Code 001.
Institutional Review Board Statement
This study was approved by the Ethics Committee of University of Campinas (protocol code: 50658921.0.0000.8142 and date of approval: 3 October 2021).
Informed Consent Statement
Informed consent was obtained from all subjects involved in the study.
Acknowledgments
We thank the reviewers for their comments, and all the participants of the design events. For the permission to reproduce their urban design images, we thank: Fabio Bellucci, Gabriela Bozzola, Juliana Milanez, Isabella Cavalcanti and Sandro Martinez (Figure 11); Nathalia da Mata Mazzonetto Pinto, Barbara de Holanda Maia Teixeira, Thais Michelão Martins, Helenylson Jesus Pereira and Tiffany Liu (Figure 12); Marcelo Meloni Montefusco, Juan Pietro Cucolo Marçula, Luiza de Bastos Gaillac, Rita de Cássia Gouveia Jácome and Valdiere Braga (Figure 13); Isabella Eloy Cavalcanti, Guilherme Pires Veiga Martins, Gabriela Rosa and Jessica Rabito Chaves (Figure 14); Helenylson Jesus Pereira, Barbara de Holanda Maia Teixeira, Jessica Rabito Chaves, Marcelo Meloni Montefusco and Juan Pietro Cucolo Marçula (Figure 15); and Luiza de Bastos Gaillac, Isabella Eloy Cavalcanti, Rita de Cássia Gouveia Jácome and Valdiere Custódio Braga (Figure 16).
Conflicts of Interest
The authors declare no conflict of interest.
References
- United Nations. The Sustainable Development Goals Report 2020; Department of Economic and Social Affairs: New York, NY, USA, 2020. [Google Scholar]
- European Commission. Land Take in Europe. Available online: https://ec.europa.eu/environment/strategy/biodiversity-strategy-2030_en (accessed on 10 November 2021).
- Climate Action Tracker. Climate Target Updates Slow as Science Ramps up Need for Action; Climate Action Tracker: Berlin, Germany, 2021. [Google Scholar]
- Lemes de Oliveira, F.; Bezerra, M.d.C.d.L.; Teba, T.; Oliveira, A. The environment-culture-technology nexus framework: An approach for assessing the challenges and opportunities for implementing nature-based solutions in Brazil. In Nature-Based Solutions for Sustainable Urban Planning: Greening Cities, Shaping Cities; Mahmoud, I.H., Morello, E., Lemes de Oliveira, F., Geneletti, D., Eds.; Springer: Berlin/Heidelberg, Germany, 2021. [Google Scholar] [CrossRef]
- Jenks, M.; Burton, E.; Williams, K. The Compact City: A Sustainable Urban Form? E & FN Spon: London, UK, 1996; 250p. [Google Scholar]
- Bibri, S.E.; Krogstie, J.; Kärrholm, M. Compact city planning and development: Emerging practices and strategies for achieving the goals of sustainability. Dev. Built Environ. 2020, 4, 100021. [Google Scholar] [CrossRef]
- Andersson, E.; Barthel, S.; Borgstrom, S.; Colding, J.; Elmqvist, T.; Folke, C.; Gren, A. Reconnecting cities to the biosphere: Stewardship of green infrastructure and urban ecosystem services. Ambio 2014, 43, 445–453. [Google Scholar] [CrossRef] [PubMed]
- Rogers, R.; Gumuchdjian, P. Cities for a Small Planet; Faber and Faber: London, UK, 1997. [Google Scholar]
- Urban Task Force. Towards An Urban Renaissance: The Report of The Urban Task Force Chaired by Lord Rogers of Riverside; Urban Task Force: Sydney, Australia, 1999. [Google Scholar]
- Williams, K.; Jenks, M.; Burton, E. Achieving Sustainable Urban Form; E & FN Spon: London, UK, 2000. [Google Scholar]
- Breheny, M. Urban compaction: Feasible and acceptable? Cities 1997, 14, 209–217. [Google Scholar] [CrossRef]
- Haaland, C.; van den Bosch, C.K. Challenges and strategies for urban green-space planning in cities undergoing densification: A review. Urban For. Urban Green. 2015, 14, 760–771. [Google Scholar] [CrossRef]
- Littke, H. Planning the Green Walkable City: Conceptualizing Values and Conflicts for Urban Green Space Strategies in Stockholm. Sustainability 2015, 7, 11306–11320. [Google Scholar] [CrossRef]
- Tappert, S.; Klöti, T.; Drilling, M. Contested urban green spaces in the compact city: The (re-)negotiation of urban gardening in Swiss cities. Landsc. Urban Plan. 2018, 170, 69–78. [Google Scholar] [CrossRef]
- Brokking, P.; Mörtberg, U.; Balfors, B. Municipal Practices for Integrated Planning of Nature-Based Solutions in Urban Development in the Stockholm Region. Sustainability 2021, 13, 10389. [Google Scholar] [CrossRef]
- Modarres, A.; Kirby, A. The suburban question: Notes for a research program. Cities 2010, 27, 114–121. [Google Scholar] [CrossRef]
- Artmann, M.; Inostroza, L.; Fan, P. Urban sprawl, compact urban development and green cities. How much do we know, how much do we agree? Ecol. Indic. 2019, 96, 3–9. [Google Scholar] [CrossRef]
- Wellmann, T.; Schug, F.; Haase, D.; Pflugmacher, D.; van der Linden, S. Green growth? On the relation between population density, land use and vegetation cover fractions in a city using a 30-years Landsat time series. Landsc. Urban Plan. 2020, 202, 103857. [Google Scholar] [CrossRef]
- European Commission. Green Infrastructure; European Commission: Luxembourg, 2010.
- European Commission. Towards An EU Research and Innovation Policy Agenda for Nature-Based Solutions & Re-Naturing Cities—Final Report of the Horizon 2020 Expert Group on ‘Nature Based Solutions and Re-Naturing Cities’; European Commission: Luxembourg, 2015.
- Lee, A.C.K.; Maheswaran, R. The health benefits of urban green spaces: A review of the evidence. J. Public Health 2011, 33, 212–222. [Google Scholar] [CrossRef]
- Kabisch, N.; van den Bosch, M.; Lafortezza, R. The health benefits of nature-based solutions to urbanization challenges for children and the elderly—A systematic review. Environ. Res. 2017, 159, 362–373. [Google Scholar] [CrossRef] [PubMed]
- Ward Thompson, C.; Roe, J.; Aspinall, P.; Mitchell, R.; Clow, A.; Miller, D. More green space is linked to less stress in deprived communities: Evidence from salivary cortisol patterns. Landsc. Urban Plan. 2012, 105, 221–229. [Google Scholar] [CrossRef]
- Soga, M.; Gaston, K.J. Extinction of experience: The loss of human-nature interactions. Front. Ecol. Environ. 2016, 14, 94–101. [Google Scholar] [CrossRef]
- da Schio, N.; Phillips, A.; Fransen, K.; Wolff, M.; Haase, D.; Ostoić, S.K.; Živojinović, I.; Vuletić, D.; Derks, J.; Davies, C.; et al. The impact of the COVID-19 pandemic on the use of and attitudes towards urban forests and green spaces: Exploring the instigators of change in Belgium. Urban For. Urban Green. 2021, 65, 127305. [Google Scholar] [CrossRef]
- Uchiyama, Y.; Kohsaka, R. Access and use of green areas during the covid-19 pandemic: Green infrastructure management in the “new normal”. Sustainability 2020, 12, 9842. [Google Scholar] [CrossRef]
- Haase, D.; Larondelle, N.; Andersson, E.; Artmann, M.; Borgstrom, S.; Breuste, J.; Gomez-Baggethun, E.; Gren, A.; Hamstead, Z.; Hansen, R.; et al. A quantitative review of urban ecosystem service assessments: Concepts, models, and implementation. Ambio 2014, 43, 413–433. [Google Scholar] [CrossRef]
- Kabisch, N.; Frantzeskaki, N.; Pauleit, S.; Naumann, S.; Davis, M.; Artmann, M.; Haase, D.; Knapp, S.; Korn, H.; Stadler, J.; et al. Nature-based solutions to climate change mitigation and adaptation in urban areas: Perspectives on indicators, knowledge gaps, barriers, and opportunities for action. Ecol. Soc. 2016, 21, 39. [Google Scholar] [CrossRef]
- Kabisch, N.; Korn, H.; Stadler, J.; Bonn, A. Nature-Based Solutions to Climate Change Adaptation in Urban Areas: Linkages between Science, Policy and Practice; Springer: Amsterdam, The Netherland, 2017. [Google Scholar]
- European Commission. EU Biodiversity Strategy for 2030. Available online: https://www.eea.europa.eu/policy-documents/eu-biodiversity-strategy-for-2030-1 (accessed on 10 November 2021).
- Echenique, M.H.; Hargreaves, A.J.; Mitchell, G.; Namdeo, A. Growing Cities Sustainably: Does Urban Form Really Matter? J. Am. Plan. Assoc. 2012, 78, 121–137. [Google Scholar] [CrossRef]
- Frey, H. Designing The City: Towards a More Sustainable Urban Form; E & FN Spon: London, UK, 1998. [Google Scholar]
- Cortinovis, C.; Geneletti, D. Ecosystem services in urban plans: What is there, and what is still needed for better decisions. Land Use Policy 2018, 70, 298–312. [Google Scholar] [CrossRef]
- Lemes de Oliveira, F. Green Wedge Urbanism: History, Theory and Contemporary Practice; Bloomsbury: London, UK, 2017. [Google Scholar]
- Lemes de Oliveira, F. Towards a Spatial Planning Framework for the Re-naturing of Cities. In Planning Cities with Nature: Theories, Strategies and Methods; Lemes de Oliveira, F., Mell, I., Eds.; Springer: Amsterdam, The Netherland, 2019; pp. 81–95. [Google Scholar]
- Artmann, M.; Kohler, M.; Meinel, G.; Gan, J.; Ioja, I.-C. How smart growth and green infrastructure can mutually support each other—A conceptual framework for compact and green cities. Ecol. Indic. 2019, 96, 10–22. [Google Scholar] [CrossRef]
- Richter, B.; Behnisch, M. Integrated evaluation framework for environmental planning in the context of compact green cities. Ecol. Indic. 2019, 96, 38–53. [Google Scholar] [CrossRef]
- D’Acci, L. A new type of cities for liveable futures. Isobenefit Urbanism morphogenesis. J. Environ. Manag. 2019, 246, 128–140. [Google Scholar] [CrossRef] [PubMed]
- Orsi, F. Centrally located yet close to nature: A prescriptive agent-based model for urban design. Comput. Environ. Urban Syst. 2019, 73, 157–170. [Google Scholar] [CrossRef]
- Hamdan, D.M.A.; Lemes De Oliveira, F. Urban planning and nature: Parametric modelling as a tool for responsive greening of cities. In Planning for Transition: AESOP 2019 Conference—Book of Papers; Association of European Schools of Planning: Portsmouth, UK, 2019; pp. 1143–1155. [Google Scholar]
- Romero-Duque, L.P.; Trilleras, J.M.; Castellarini, F.; Quijas, S. Ecosystem services in urban ecological infrastructure of Latin America and the Caribbean: How do they contribute to urban planning? Sci. Total Environ. 2020, 728, 138780. [Google Scholar] [CrossRef]
- Costa, S.M.F.D.; Forlin, L.G.; Carmo, M.B.S.; Silva, R.L.D. Study of gated communities in Brazil: New developments and typologies in the Paraíba Valley, SP. Bol. De Geogr. 2014, 32, 87. [Google Scholar] [CrossRef]
- Villaça, F. São Paulo: Urban segregation and inequality. Estud. Avançados 2011, 25, 37–58. [Google Scholar] [CrossRef]
- Polidoro, M.; de Lollo, J.A.; Barros, M.V.F. Environmental impacts of urban sprawl in Londrina, Paraná, Brazil. J. Urban Environ. Eng. 2011, 5, 73–83. [Google Scholar] [CrossRef]
- Torres, H.; Alves, H.; Aparecida De Oliveira, M. São Paulo peri-urban dynamics: Some social causes and environmental consequences. Environ. Urban. 2007, 19, 207–223. [Google Scholar] [CrossRef]
- Yigitcanlar, T.; Velibeyoglu, K.; Baum, S. (Eds.) Knowledge-Based Urban Development: Planning and Applications in the Information Era; IGI Global: Hershey, PA, USA, 2008; 23p, ISBN 978-1-59904-720-1. [Google Scholar]
- Magdaniel, F.C. Campuses, Cities and Innovation: 39 International Cases Accommodating Tech-Based Research; TU Delft, Faculty of Architecture, Department of Management in the Built Environment: Delft, The Netherlands, 2018. [Google Scholar]
- Esmaeilpoorarabi, N.; Yigitcanlar, T.; Guaralda, M.; Kamruzzaman, M. Evaluating place quality in innovation districts: A Delphic hierarchy process approach. Land Use Policy 2018, 76, 471–486. [Google Scholar] [CrossRef]
- van Aken, J.E.; Romme, G. Reinventing the future: Adding design science to the repertoire of organization and management studies. Organ. Manag. J. 2009, 6, 5–12. [Google Scholar] [CrossRef]
- Dresch, A.; Lacerda, D.P.; Valle Antunes, J.A., Jr. (Eds.) Design Science Research: A Method for Science and Technology Advancement; Springer: Berlin/Heidelberg, Germany, 2015. [Google Scholar]
- March, S.T.; Smith, G.F. Design and natural science research on information technology. Decis. Support Syst. 1995, 15, 251–266. [Google Scholar] [CrossRef]
- Lenzholzer, S.; Duchhart, I.; Koh, J. ‘Research through designing’ in landscape architecture. Landsc. Urban Plan. 2013, 113, 120–127. [Google Scholar] [CrossRef]
- Roggema, R. Research by Design: Proposition for a Methodological Approach. Urban Sci. 2017, 1, 2. [Google Scholar] [CrossRef]
- Nassauer, J.; Opdam, P. Design in science: Extending the landscape ecology paradigm. Landsc. Ecol. 2008, 23, 633–644. [Google Scholar] [CrossRef]
- Sanches, P. Cidades Compactas e Mais Verdes: Conciliando Densidade Urbana e Vegetação Por Meio do Desenho Urbano; Universidade de São Paulo: Piracicaba, Brazil, 2020. [Google Scholar]
- Madureira, H.; Monteiro, A. Going Green and Going Dense: A Systematic Review of Compatibilities and Conflicts in Urban Research. Sustainability 2021, 13, 10643. [Google Scholar] [CrossRef]
- Kayden, J. Privetly-Owned Public Space; Wiley: New York, NY, USA, 2000. [Google Scholar]
- Bentrup, G. Conservation Buffers—Design Guidelines for Buffers, Corridors, and Greenways; Department of Agriculture, Forest Service: Asheville, NC, USA, 2008. [Google Scholar]
- Cook, E.A.; Van Lier, H.N. Landscape Planning and Ecological Networks: Developments in Landscape Management and Urban Planning; Elsevier: Amsterdam, The Netherland, 1994. [Google Scholar]
- Fernández-juricic, E. Avian spatial segregation at edges and interiors of urban parks in Madrid, Spain. Biodivers. Conserv. 2001, 10, 1303–1316. [Google Scholar] [CrossRef]
- MacGregor-Fors, I.; Schondube, J.E. Gray vs. green urbanization: Relative importance of urban features for urban bird communities. Basic Appl. Ecol. 2011, 12, 372–381. [Google Scholar] [CrossRef]
- Korhonen, J.; Honkasalo, A.; Seppala, J. Circular Economy: The Concept and its Limitations. Ecol. Econ. 2018, 143, 37–46. [Google Scholar] [CrossRef]
- Skar, S.L.G.; Pineda-Martos, R.; Timpe, A.; Polling, B.; Bohn, K.; Kulvik, M.; Delgado, C.; Pedras, C.M.G.; Paco, T.A.; Cujic, M.; et al. Urban agriculture as a keystone contribution towards securing sustainable and healthy development for cities in the future. Blue-Green Syst. 2020, 2, 1–27. [Google Scholar] [CrossRef]
- Ortega-Álvarez, R.; MacGregor-Fors, I. Living in the big city: Effects of urban land-use on bird community structure, diversity, and composition. Landsc. Urban Plan. 2009, 90, 189–195. [Google Scholar] [CrossRef]
- Gyurkovics, J.; Lukovics, M. Generations of Science Parks in the Light of Responsible Innovation. In Responsible Innovation; Buzás, N., Lukovics, M., Eds.; University of Szeged, Faculty of Economics and Business Administration: Szeged, Hungary, 2014; pp. 193–208. [Google Scholar]
- A+T Research Group. 50 Urban Blocks; A+T Architecture Publishers: Vitoria-Gasteiz, Spain, 2017. [Google Scholar]
- Roggema, R. From Nature-Based to Nature-Driven: Landscape First for the Design of Moeder Zernike in Groningen. Sustainability 2021, 13, 2368. [Google Scholar] [CrossRef]
- Farr, D. Sustainable Urbanism: Urban Design with Nature; John Wiley & Sons: Hoboken, NJ, USA, 2011. [Google Scholar]
- Gehl, J. Cities for People; Island Press: Washington, DC, USA, 2013. [Google Scholar]
- Pont, M.B.; Haupt, P.A. Spacematrix. Space, Density and Urban Form; NAi Publishers: Rotterdam, The Netherlands, 2010. [Google Scholar]
- Hedblom, M.; Andersson, E.; Borgström, S. Flexible land-use and undefined governance: From threats to potentials in peri-urban landscape planning. Land Use Policy 2017, 63, 523–527. [Google Scholar] [CrossRef]
- Salvati, L.; Ranalli, F.; Gitas, I. Landscape fragmentation and the agro-forest ecosystem along a rural-to-urban gradient: An exploratory study. Int. J. Sust. Dev. World 2014, 21, 160–167. [Google Scholar] [CrossRef]
- Johnston, A. The roles of universities in knowledge-based urban development: A critical review. Int. J. Knowl.-Based Dev. 2019, 10, 213–231. [Google Scholar] [CrossRef]
- Hansen, R.; Olafsson, A.S.; van der Jagt, A.P.N.; Rall, E.; Pauleit, S. Planning multifunctional green infrastructure for compact cities: What is the state of practice? Ecol. Indic. 2019, 96, 99–110. [Google Scholar] [CrossRef]
- Mahmoud, I.H.; Morello, E.; Ludlow, D.; Salvia, G. Co-creation Pathways to Inform Shared Governance of Urban Living Labs in Practice: Lessons from Three European Projects. Front. Sustain. Cities 2021, 3, 690458. [Google Scholar] [CrossRef]
- Wagner, J.; Davies, S.; Sorring, N.; Vey, J. Advancing a New Wave of Urban Competitiveness: The Role of Mayors in the Rise of Innovation Districts; Brookings: Washington, DC, USA, 2017. [Google Scholar]
- Wagner, J.; Watch, D. Innovation Spaces: The New Design of Work; Anne, T., Robert, M., Eds.; Bass Initiative on Innovation and Placemaking at Brookings: Washington, DC, USA, 2017. [Google Scholar]
- Vey, J.; Hachadorian, J.; Wagner, J.; Andes, S.; Storring, N. Assessing Your Innovation District: A How-to Guide. Brookings Institute. Available online: https://www.brookings.edu/research/assessing-your-innovation-district-a-how-to-guide (accessed on 11 November 2021).
- Deksissa, T.; Trobman, H.; Zendehdel, K.; Azam, H. Integrating Urban Agriculture and Stormwater Management in a Circular Economy to Enhance Ecosystem Services: Connecting the Dots. Sustainability 2021, 13, 8293. [Google Scholar] [CrossRef]
- Kampelmann, S. Wood works: How local value chains based on urban forests contribute to place-based circular economy. Urban Geogr. 2020, 41, 911–914. [Google Scholar] [CrossRef]


Publisher’s Note: MDPI stays neutral with regard to jurisdictional claims in published maps and institutional affiliations. |
© 2021 by the authors. Licensee MDPI, Basel, Switzerland. This article is an open access article distributed under the terms and conditions of the Creative Commons Attribution (CC BY) license (https://creativecommons.org/licenses/by/4.0/).