Abstract
With the increasing aging of the world’s population, research on the equitable allocation of elderly care facilities has received increasing attention, but measuring the accessibility of community care facilities (CCFs) in rural areas has received little attention. In this study, which covered 7985 CCFs in 223,877 villages, we measured the accessibility of CCFs in rural areas of Hubei Province by using the nearest distance method. Based on the accessibility calculation, the spatial disparities and agglomeration characteristics of spatial accessibility were analyzed, and the correlated variables related to the accessibility were analyzed from both natural environment and socioeconomic aspects by employing a geographically weighted regression (GWR) model. Our results show that 87% of villages have a distance cost of less than 7121 m and 81% of townships have a distance cost of less than 5114 m; good spatial accessibility is present in the eastern and central regions, while poor spatial accessibility is shown in a small number of areas in the west. The results from the clustering analysis show that the hot spot areas are mainly clustered in the western mountainous areas and that the cold spot areas are mainly clustered around Wuhan city. We also observed that area, elevation, population aged 65 and above, and number of villages are significantly correlated with accessibility. The results of this study can be used to provide a reference for configuration optimization and layout planning of elderly care facilities in rural areas.
1. Introduction
The world’s elderly population continues to grow, as fertility rates in many countries have fallen to very low levels and populations are living longer [1]. The World Population Prospects 2019, released by the United Nations, declared that the ratio of people over 65 to the total population reached 1:11 in 2019, and this ratio will reach 1:6 by 2050 [2]. China is the most populous developing country in the world. The seventh national census showed that the population aged 65 and above accounted for 13.5% of the total population, reaching 190 million, with different distributions in rural areas (17.72%) and in cities (6.61% lower than in rural areas) [3], highlighting the notion that aging is more severe in rural areas of China.
The growth of the elderly population inevitably creates a huge demand for elderly services. SDG (Sustainable Development Goal) 11 emphasizes the importance of ensuring access to adequate, safe, and affordable basic services for all by 2030, with special attention to the needs of older people [4]. Therefore, to alleviate this need for basic services, WHO (World Health Organization) has long proposed policy frameworks, such as “active aging” and “aging in place” [5,6]. This “aging in place” is a concept that supports older people living independently for as long as possible in their place of residence [7]. China is actively implementing these policies, advocating for community care services and providing assistance and support to the elderly in need, and the country has developed a series of initiatives for rural areas. For example, in 2017, the Ministry of Civil Affairs and eight other departments jointly issued the Opinions on Strengthening Care Services for Older People Left Behind in Rural Areas, proposing to improve the construction of rural elderly care facilities and provide rural elderly people with nearby and convenient elderly services [8].
In international studies, elderly care facilities are generally classified as home and community care facilities (HACCFs) and residential aged care facilities (RACFs) [9,10]. Community care facilities (CCFs) have been developed in China, especially in many rural areas. Thus, according to the spirit of the above-mentioned documents, in this study, CCFs mainly refer to community elderly service centers, mutual care activity centers, and elderly activity centers, which are led by the government, and relevant institutions or social organizations provide services such as meal assistance, cleaning assistance, walking assistance, bathing assistance, and medical assistance to the elderly at home. Moreover, the elderly usually use these facilities only during the daytime. Due to the scattered living and low income level of the rural elderly, CCFs provide more practical and feasible services for them without providing accommodation.
Spatial accessibility focuses on the distance barrier between the supply and demand points of a link, which is the most commonly used indicator when measuring the spatial distribution of the above-discussed facilities [11,12]. An assessment of the spatial accessibility of CCFs can help identify under-served areas for the elderly and effectively measure the equity of the spatial layout of CCFs, which, in turn, can lead to recommendations for the optimized allocation of resources for elderly care facilities.
By reviewing the literature, it can be found that relevant studies pay more attention to the assessment of spatial accessibility of RACFs [13,14,15,16], while the assessment of accessibility of CCFs is seldom studied. Wu H C and Tseng M H used government data from Taiwan Province for 2017 to assess geographic accessibility of CCFs using six measures, constructed a comprehensive evaluation index, and proposed three steps for policy planning and improvement for older adults [17]. Liu S et al. evaluated the spatial accessibility of CCFs in the Beilin District of Xi’an and proposed a feasible reference for fully understanding the spatial allocation of CCF resources in the city [18]. The above-mentioned study areas and analysis methods still need further refinement and enrichment, and the assessment of the accessibility of CCFs in rural areas, in particular, needs to be strengthened.
This study aimed to assess the accessibility of CCFs in rural areas and analyze their correlated variables to provide a reference for configuration optimization and layout planning of elderly service facilities in rural areas. The applied innovations and contributions of this paper are as follows: (1) The nearest distance method was first used to measure the accessibility of CCFs and to analyze the spatial disparities in the accessibility of CCFs in rural areas of Hubei Province, China, at two levels: the village level and the township level. This method can also be applied to other rural areas in future studies. (2) Spatial autocorrelation was used to measure the spatial cluster of the accessibility of CCFs at the township level and to identify the overall spatial aggregation characteristics and local special areas. (3) Based on the geographically weighted regression model, the potential correlated variables of CCF accessibility in rural areas were explored from the perspective of natural environment and socioeconomic aspects.
2. Materials and Methods
2.1. Study Area and Data Preparation
2.1.1. Study Area
Hubei Province is located in central China (Figure 1a) and includes 12 prefecture-level cities, 3 provincial-level cities (Xiantao, Tianmen, Qianjiang), and 1 provincial-level forest area (Shennongjia Forestry District). It is surrounded by mountains in the east, west, and north.
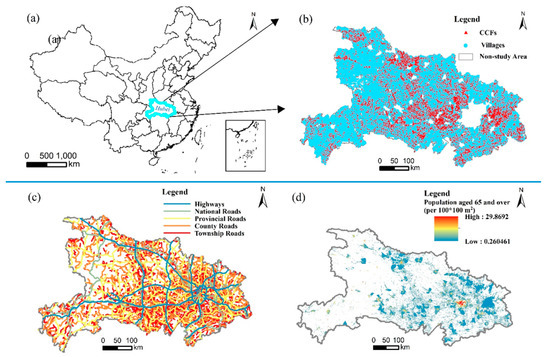
Figure 1.
Study area: (a) location of Hubei Province; (b) CCF and village locations; (c) road network; (d) population aged 65 and over.
Based on previous studies [19], scholars tend to define the areas outside the municipal and county jurisdictions as rural areas. However, it should be noted that since urbanization is still in progress in China, villages still exist in municipal and county jurisdictions. To further refine the study, the rural areas in this paper are defined as all townships where villages exist. In this study, 962 townships in Hubei Province belonged to rural areas (Figure 1b).
According to the 7th National Census Bulletin (No. 4) of Hubei Province, the elderly population aged 65 years and above in Hubei Province in 2020 was 8,424,300, accounting for 14.59% of the resident population [20], and aging here is higher than the national average. Moreover, statistics released by the Hubei Provincial Bureau of Statistics have long shown that its rural areas are aging at a faster rate [21], and elderly services in rural areas have become an extremely important issue for the Hubei provincial government and society.
2.1.2. Data Preparation
- Villages. This paper uses villages as the smallest spatial scale to explore the spatial accessibility of CCFs in rural areas of Hubei Province. A village is usually formed naturally by one or more families living together, and it is the smallest relatively independent settlement unit in rural areas. These villages are numerous, widely distributed, and vary in size from isolated villages with only a few households (e.g., in mountainous areas) to large villages with hundreds of people (e.g., in densely populated plain areas). In this study, the spatial locations of villages were obtained via the points of information (POIs) of Baidu Map [22]. These POIs provided by Baidu Maps are point-based spatial location data, which can be any meaningful point in map representation, such as a building, store, or attraction. We searched villages by administrative area on Baidu Map with the help of crawler tools and obtained geospatial location information of a total of 223,877 villages in the study area, including their names, latitude and longitude, and types (Figure 1b).
- CCFs. The CCF data (including attributes such as name, address, and person in charge, but excluding data on quality of health care) were collected from the Hubei Pension Service Information Network [23], which is maintained by Hubei Elderly Care Institutions Association, mainly providing information on elderly care service policy, elderly care service reform, and elderly care institutions. This data acquisition process is not restricted; we first collected and organized the names of a total of 7985 CCFs in the study area with the help of web crawler tools and extracted their locations by Baidu Map coordinates (Figure 1b). In order to ensure the achievement of research purposes and verify the reliability of data sources, we conducted field survey and telephone interview on CCFs in Hubei Province. A total of 17 Civil Affairs Department staff and 216 elderly residents from 9 cities participated in the survey. The survey shows that the elderly are willing to choose the nearest CCFs and receive corresponding services, and the CCFs data provided by the website are consistent with the reality and have high reliability.
- Road Network. The road network data were used to calculate the distance cost between villages and CCFs. Data were collected using the Geofabrik tool [24], which provides a continuously updated geographical extract of the OpenStreetMap database [25]. This also includes road network vector data, which we extracted and classified into the following categories: highways, national roads, provincial roads, county roads, and township roads (see Figure 1c).
- Aged Population. The aged population (aged 65 and above in this study) is directly related to the potential demands for CCFs, which is very important to accurately assess variables correlating with the spatial accessibility of CCFs in rural areas. We extracted the gridded population data for the study area at a 100 m spatial resolution from the WorldPop database [26]. The datasets were built using a random-forest-based semi-automated dasymetric mapping method [27]. The regional population in the census was redistributed into fine spatial units by borrowing geographic attributes (e.g., topography, climate, land cover, and land use) and the density of human-built features (e.g., roads, buildings, and nighttime lights). The data downloaded from the WorldPop database are as of November 2020. The spatial distribution of elderly population in the study area is shown in Figure 1d.
- Other Data. The township boundary data (scale 1:250), digital elevation model (DEM), slope data, and terrain relief were obtained from the Resource and Environment Science and Data Center of Chinese Academy of Sciences [28]. Terrain relief was defined as the difference between the highest elevation and the lowest elevation within each township [29].
2.2. Methods
2.2.1. Accessibility Calculation
Various measurement methods have been developed for accessibility calculations, including the nearest distance method [19,30], kernel density method [31,32,33], potential model [14], gravity model [34,35,36], and two-step floating catchment area (2SFCA) method [37,38]. In particular, the 2SFCA method and its modifications are the most widely used among these methods because they consider both the distance cost and supply/demand ratio [39,40,41,42].
However, the nearest distance method was chosen for this study for the following two reasons: (1) based on the road network, the nearest distance method to calculate the accessibility (shortest path from the point of residence to the CCFs) can directly reflect the spatial equity and convenience of rural residents’ access to the corresponding services [43]; (2) on this basis, calculating the average shortest distance of an administrative unit allows for a clear and straightforward interpretation and analysis of a unit, which makes it easier to be understood by decision makers [30].
The spatial accessibility of the CCFs was analyzed at the village and township levels. We used the nearest distance method to quantify the linkage between the resident’s location and CCFs in the study area. Based on the road network (after topology examination) in Hubei, the origin–destination (O–D) cost matrix was constructed by using the ArcGIS network analysis tool, and the shortest distance of each village to CCFs was calculated. The accessibility of each township to CCFs is represented as average accessibility of all villages in administrative divisions, which is expressed as follows [19]:
where n is the number of villages in region i, and Dk is the cost of distance from residence k to the nearest CCF. The lower the value of Ai, the better the accessibility of region i.
2.2.2. Spatial Autocorrelation
For the analysis of the spatial clustering scenarios of spatial accessibility of CCFs, spatial autocorrelation was analyzed to identify spatial aggregation areas and special areas. Spatial autocorrelation includes global spatial autocorrelation and local spatial autocorrelation.
- 1.
- Global spatial autocorrelation
Global spatial autocorrelation can analyze the degree of spatial correlation of spatial objects in the whole region, which is measured by global Moran’s I index. The calculation formula is as follows [44]:
where N is the number of townships, Ai is the attribute value of township i, Aj is the attribute value of township j, is the mean value of Ai, and Wij is the spatial weight matrix between townships i and j. If township i is adjacent to township j, Wij equals 1; if township i is not adjacent to j, Wij equals 0. The value range of I is [−1, 1]: if I > 0 and passes the significance test, it indicates a positive correlation between the attribute values; if I < 0 and passes the significance test, the attribute values are negatively correlated; and if I = 0 and passes the significance test, the spatial distribution of the attribute values has randomness.
Whether it passes the significance test or not needs to be judged by the standardized statistical data Z. When the confidence level is 0.05, the absolute value of Z is equal to 1.96, which means that when the absolute value of Z exceeds 1.96, the spatial autocorrelation passes the significance test.
- 2.
- Local spatial autocorrelation
Global autocorrelation does not show the specific spatial location of clusters or outliers; thus, local autocorrelation also needs to be introduced. Local autocorrelation is used to analyze the degree of association between each spatial unit attribute and its neighboring spatial unit attributes, which is measured by the local Getis–Ord statistic. The local Getis–Ord statistic can further detect the spatial clustering of high- and low-value elements, which is calculated as follows [45]:
The standardized treatment of is Z () = [ − E ()]/, where E () and VAR () represent the mathematical expectation and variation coefficient of , respectively, and Wij(d) represents the spatial distance weight. The significant positive Z () value indicates that the townships with high attribute values tend to show spatial agglomeration, forming a “hot spot” area. The significant negative Z () value indicates that the townships with low attribute values tend to show spatial agglomeration, forming a “cold spot” area.
2.2.3. Geographically Weighted Regression
In order to further explore the correlated variables of spatial accessibility of CCFs in rural areas, the geographically weighted regression (GWR) model was introduced. The GWR model is a spatial regression model based on local smoothness [46], which is different from the traditional multiple linear regression model that assumes that things have no spatial correlation and homogeneous distribution. It incorporates the spatial location attribute of data in the regression model, which can reveal the spatial differences in the relationship between variables. The general form of the model is as follows:
where yi is the dependent variable of township i, (ui,vi) is the geographical coordinate of township i, β0(ui,vi) is the constant regression term, βk(ui,vi) is the k-th regression coefficient of township i, n is the number of townships, xik is the value of the k-th independent variable at i, and εi is the random error term. Furthermore, the regression coefficient of the model can be expressed as [47]
where X is the matrix of independent variables, and W(ui,vi) denotes the matrix of spatial weights at township i.
3. Results
3.1. Spatial Accessibility Analysis
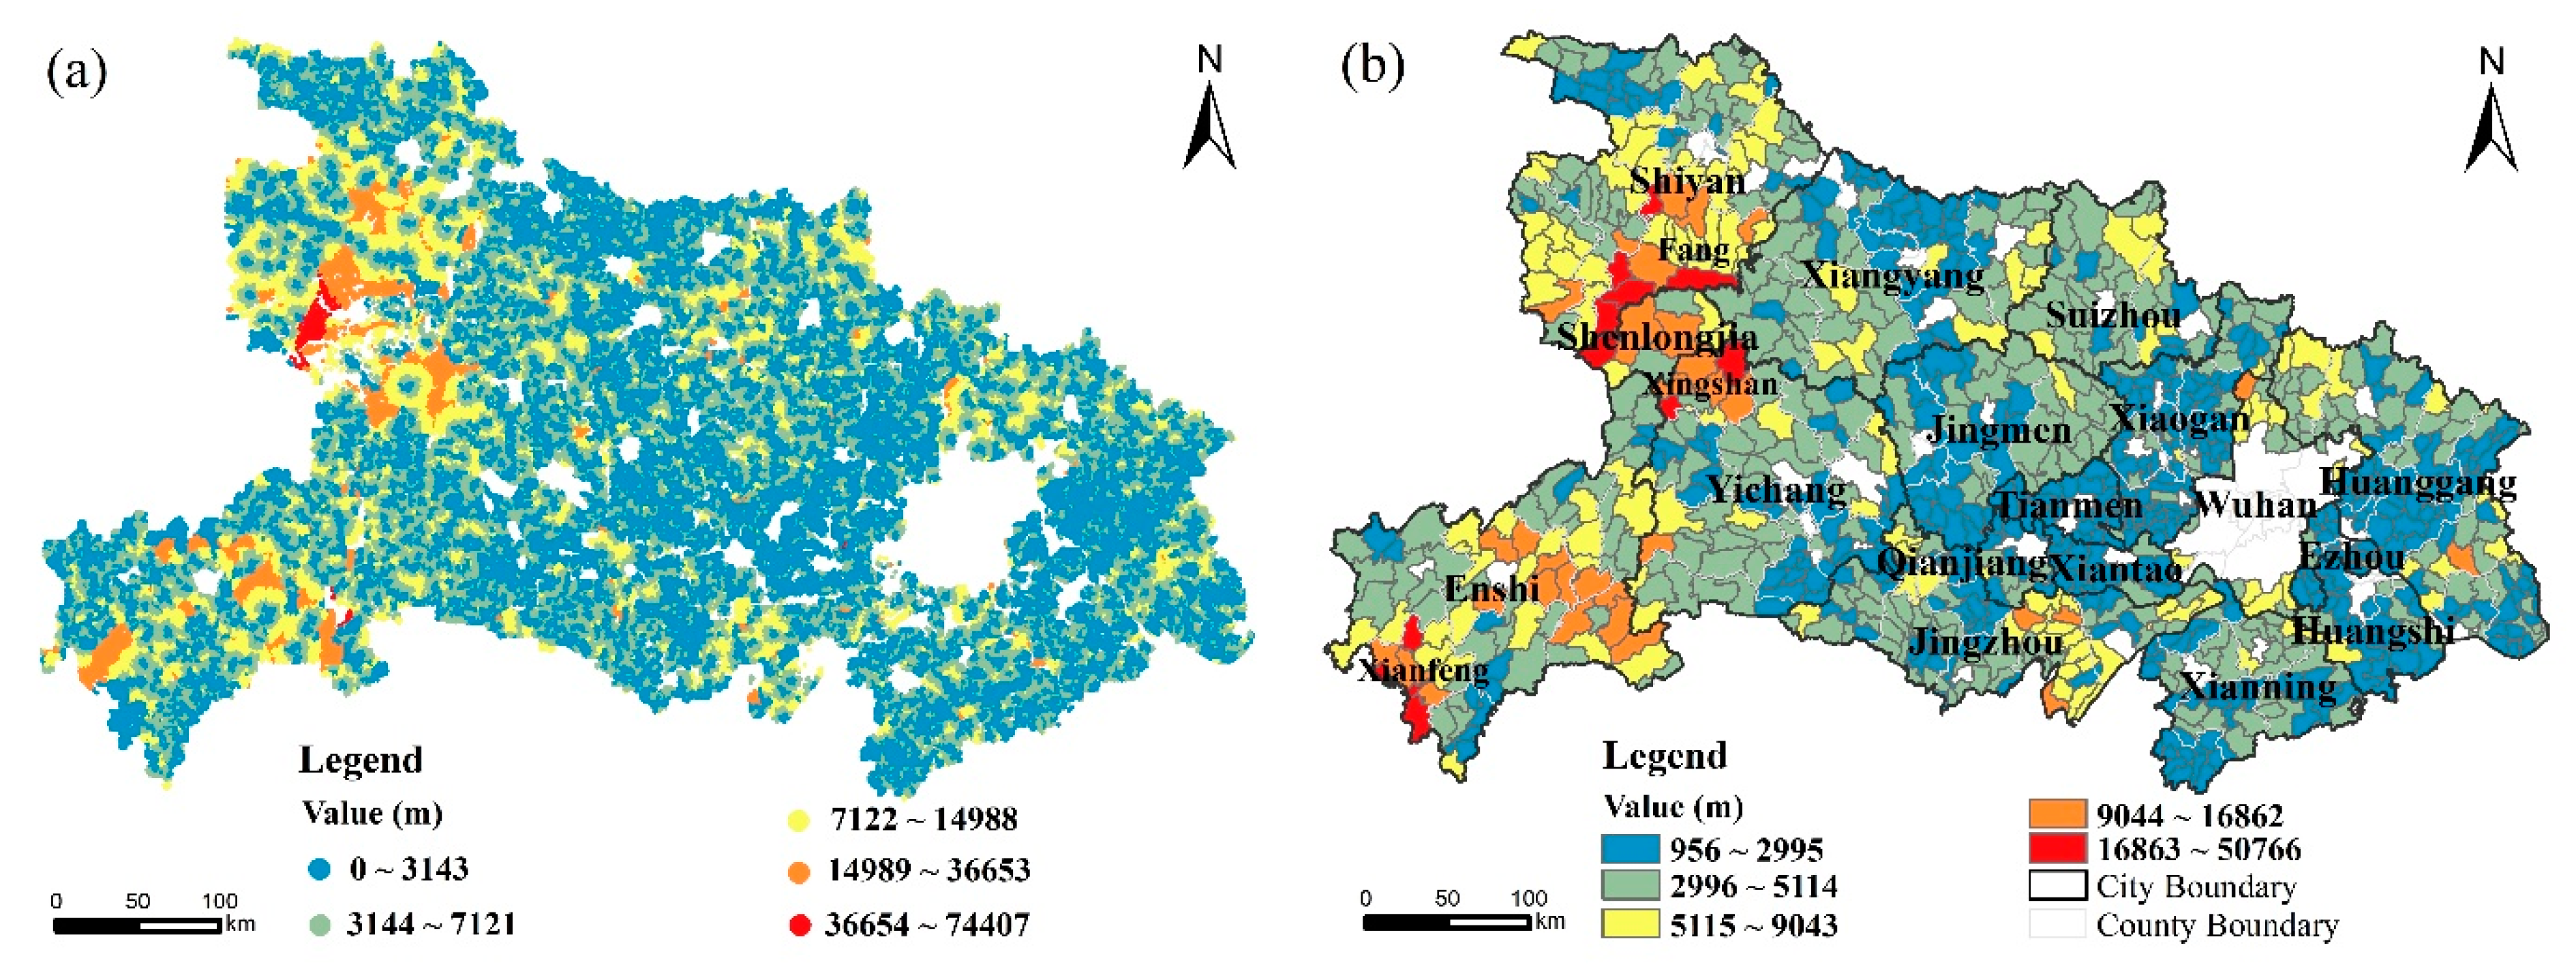
As shown in Figure 2, the distance cost of CCFs at two different levels was calculated using the nearest distance method and Equation (1). Based on the distribution of the distance cost of CCFs at two different levels, the accessibility of CCFs was classified into five categories (i.e., very high, high, medium, low, and very low) using Jenks’ natural breaks classification (JNBC), as shown in Table 1.
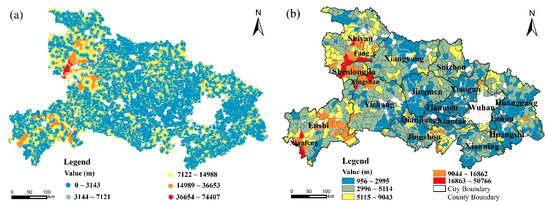
Figure 2.
Spatial distribution of distance cost of CCFs in rural areas of Hubei Province: (a) village level; (b) township level.

Table 1.
Statistics and classification of accessibility of CCFs at two levels.
The village level and the township level are shown in Figure 2a,b, respectively. The statistics show that 194,782 (87%) villages have high or very high accessibility, while 5017 (2.2%) have low or very low accessibility, showing significant spatial disparities in the accessibility of CCFs at the village level. The statistics show that 783 (81.4%) townships have high or very high accessibility, while 46 (4.8%) townships have low or very low accessibility.
The spatial distributions of accessibility at the two levels are generally consistent with each other. Moreover, the villages with low accessibility at the village level are mainly distributed in the northwest and southwest of Hubei Province. Correspondingly, for the townships level, the areas of very low accessibility are located in Shennongjia Forestry District, Fang County in Shiyan city, Xianfeng County in Enshi Tujia and Miao Autonomous Prefecture, and Xingshan County in Yichang city, indicating that the accessibility of CCFs in these areas needs to be improved.
3.2. Spatial Clustering Analysis
3.2.1. Global Spatial Autocorrelation Analysis
The global autocorrelation results for the spatial accessibility of CCFs at the township level show that the Moran’s I index was 0.3174, the Z-score was 19.4528, and the p-value was 0.0000. It can be observed that the values of the analyzed dataset pass the significance test and show a significant spatial autocorrelation. Therefore, the accessibility of CCFs in rural areas of Hubei Province has obvious spatial clustering characteristics.
3.2.2. Local Spatial Autocorrelation Analysis
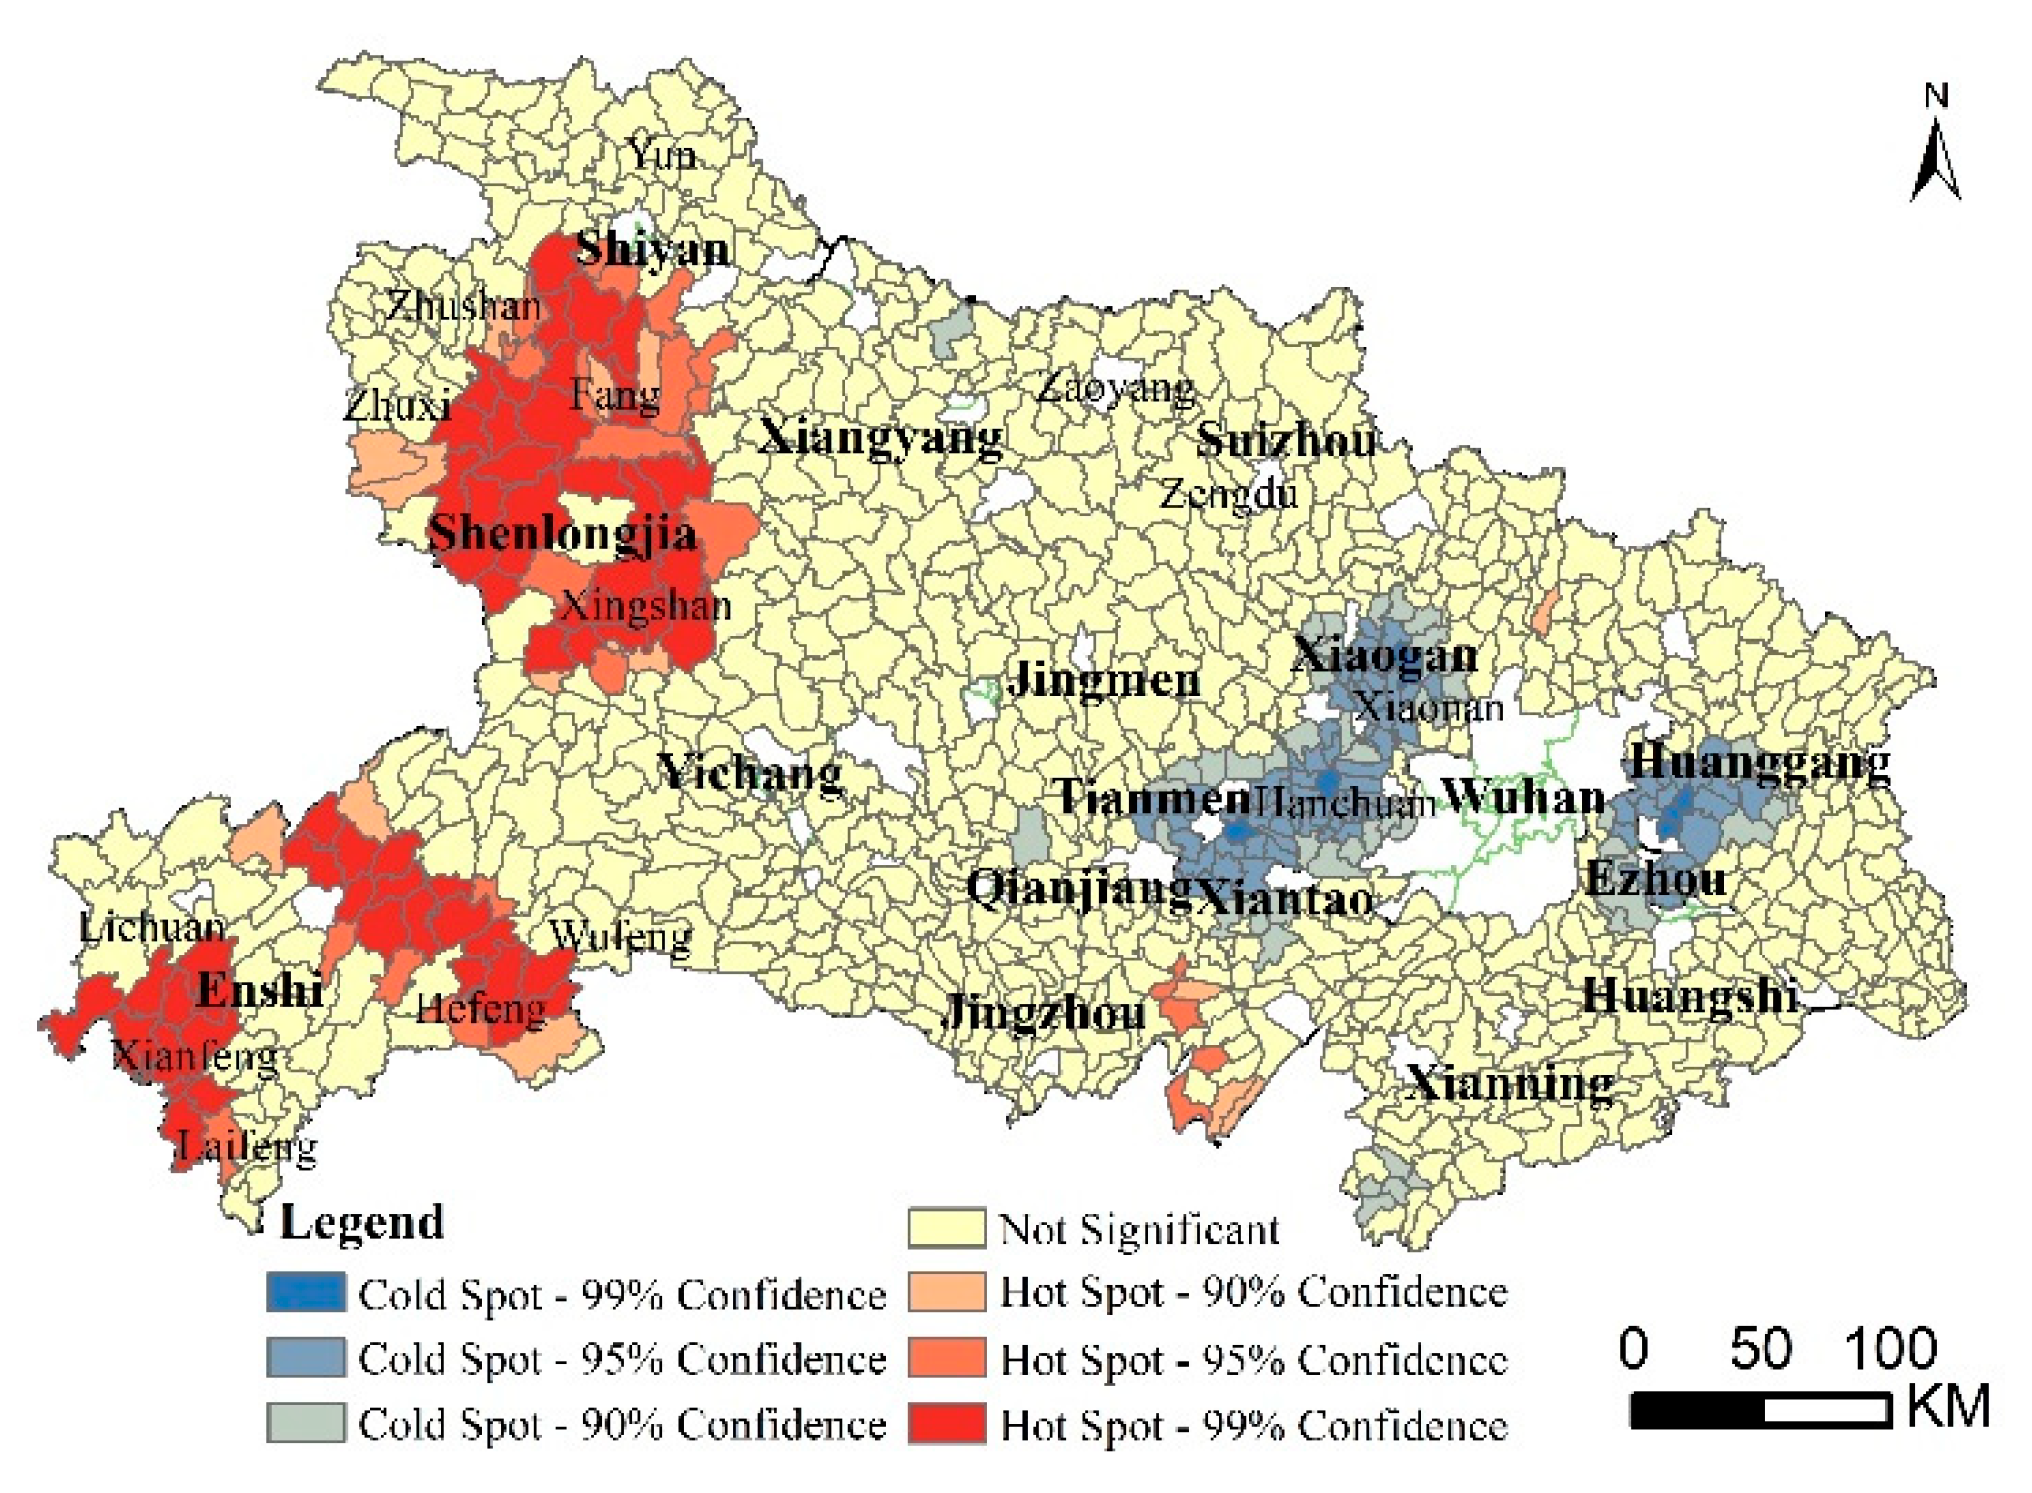
Figure 3 shows the hot spot map of local spatial autocorrelation analysis of accessibility of CCFs in rural areas of Hubei Province. Based on Equation (3), the results show that the hot spot areas are mainly concentrated in the contiguous areas of Shiyan city, Shennongjia Forestry Area, Yichang city, and the central and southwestern parts of Enshi Tujia and Miao Autonomous Prefecture. The cold spot area is located in the east and west of Wuhan city, including the contiguous areas of Xiaogan, Tianmen, and Xiantao on the west side and Huanggang and Ezhou on the east side. These areas are low-value aggregation areas for distance costs.

Figure 3.
Hot spot map of local spatial autocorrelation analysis of accessibility of CCFs in rural areas of Hubei Province.
3.3. Analysis of Correlated Variables
In order to further study the causes of the observed spatial disparities in accessibility, this paper analyzes the potential correlated variables from both natural environmental and socioeconomic aspects. More specifically, area, elevation, slope, and terrain relief are selected as natural environmental factors, and the population aged 65 and above, the number of villages, and road network density are selected as socioeconomic factors. Additionally, stepwise regression is used to examine multiple collinearity between independent variables in SPSS 22 [48]. It can be observed that the four explanatory variables of area, elevation, the population aged 65 and above, and the number of villages pass the significance and covariance tests.
3.3.1. Regression Comparison of OLS and GWR
To better utilize the GWR model, some related processing work should be noted. The applicability of the GWR model needs to be determined by comparing the output results of ordinary least square (OLS) and GWR. In the GWR model construction, a Gaussian function is selected to determine the weights, and the optimal bandwidth is determined by the Akaike information criterion (AIC) method. Comparing the results of OLS and GWR in Table 2, on the one hand, the values of R2 and adjusted R2 of the OLS model are 0.2757 and 0.2727, respectively. While the GWR model has a greater improvement compared with that of the OLS model, its R2 and adjusted R2 values are 0.6282 and 0.5530, respectively; on the other hand, the AICc value of GWR is smaller than that of OLS. According to Fotheringham et al. [49], if the AICc value of the GWR model is smaller than that of the OLS model, the GWR model is appropriate. This implies that the GWR model in this study is more suitable than the OLS model for the regression fitting of spatial accessibility and explanatory variables.
Table 2.
Results of OLS and GWR.
3.3.2. Analysis of Correlated Variables Based on GWR
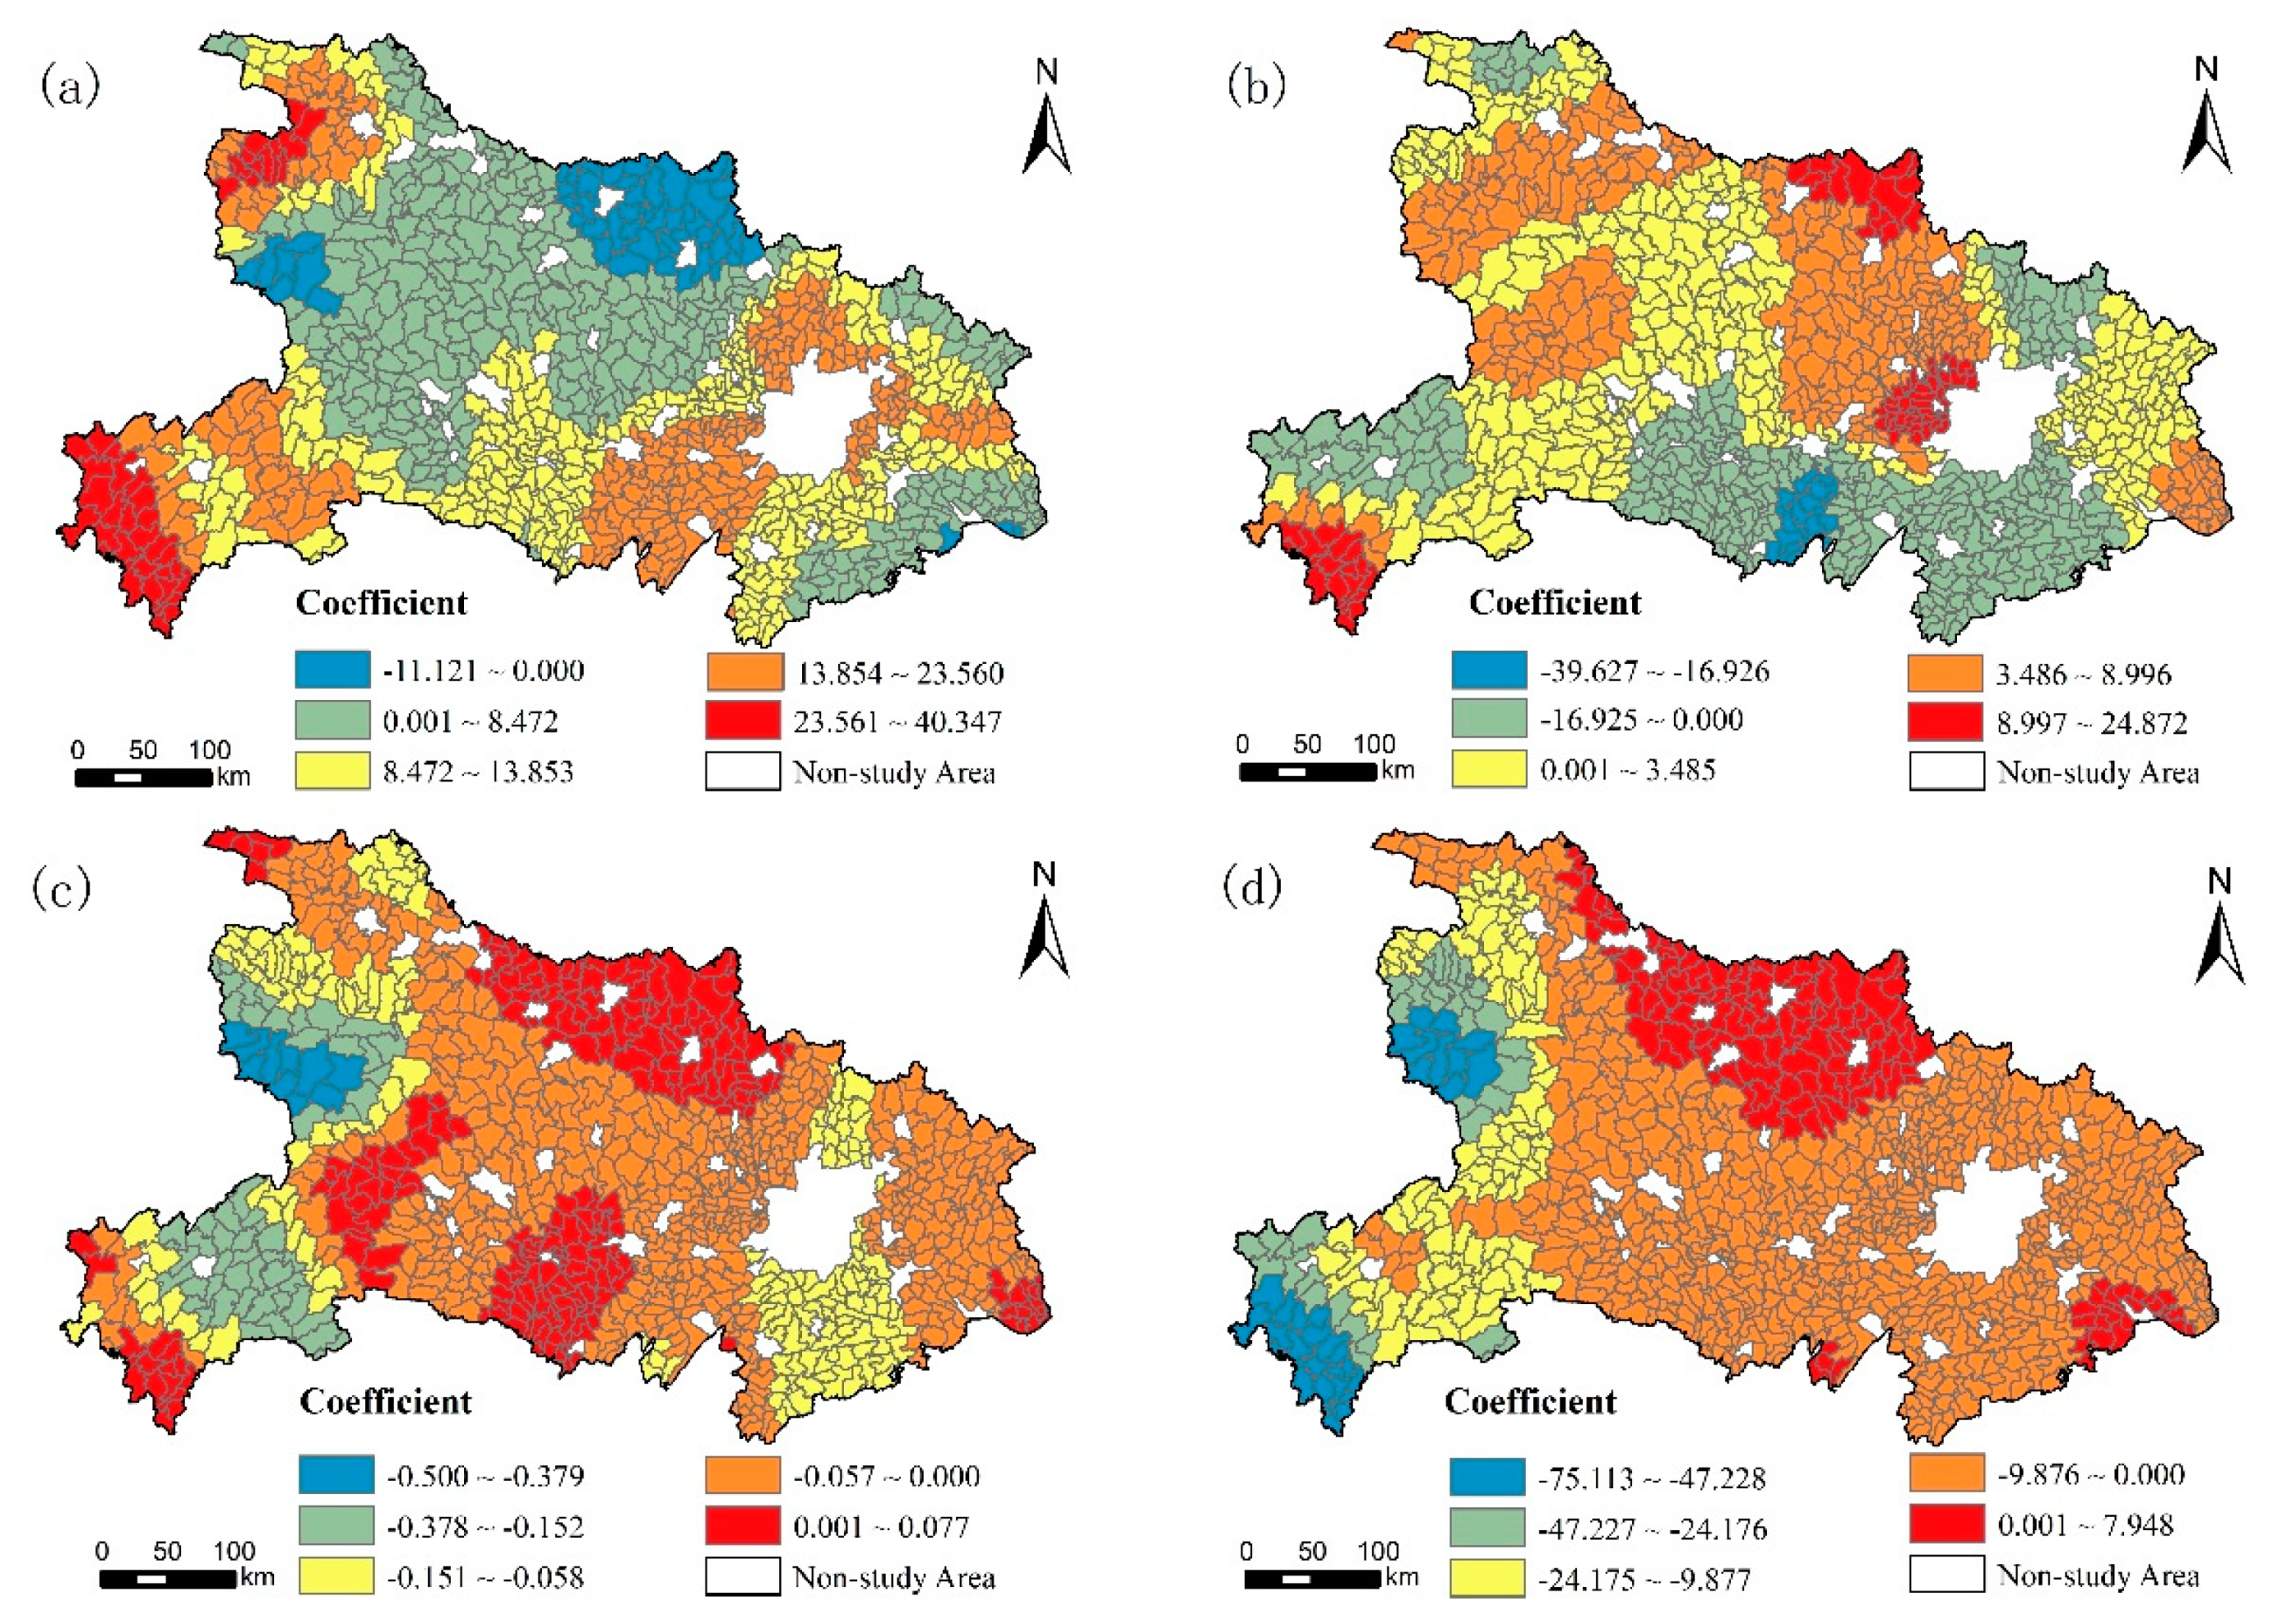
As shown in Figure 4a, area has a significant positive correlation with accessibility, with an average regression coefficient of 10.7439. The possible reasons for this are twofold: on the one hand, the larger the administrative area is, the higher the population it can carry, thus intensifying the demand for elderly resources and reducing accessibility; on the other hand, although the administrative area is large, it is mainly concentrated in mountainous areas, which can carry a lower population and thus may result in lower accessibility due to inconvenient transportation. The most positively affected areas are mainly concentrated in the southwestern part of Enshi Tujia and Miao Autonomous Prefecture and the western part of Shiyan city, the former including continuous townships in Laifeng County, Xianfeng County, and Lichuan city, and the latter including some townships in Yun County, Zhushan County, and Zhuxi County. The regression coefficients for all of these areas exceed 23.561. This indicates that the distance cost of accessibility in these areas significantly increases with the increase in area.

Figure 4.
Spatial distribution of regression coefficients of various correlated variables in the geographically weighted regression (GWR) model: (a) regression coefficient for area; (b) regression coefficient for elevation; (c) regression coefficient for the population aged 65 and over; (d) regression coefficient for the number of villages.
The effect of elevation on accessibility is weaker than area in terms of natural factors and is mainly positively correlated with accessibility (Figure 4b). The most positively affected areas include Xianfeng County and Laifeng County in the southwest of Enshi Tujia and Miao Autonomous Prefecture, Zaoyang city in Xiangyang city to Zengdu District in Suizhou city, and finally, Xiaonan District and Hanchuan city in Xiaogan city. The regression coefficients for these areas exceed 8.997, indicating that the cost of accessibility distance in these areas increases to some extent with elevation.
Figure 4c shows that the population aged 65 and above has a predominantly negative correlation with accessibility, with an average regression coefficient of −0.0397. From the study area as a whole, most of the townships were negatively affected, with the deepest areas concentrated in Zhuxi, Zhushan, and Fang counties in Shiyan and the Shennongjia Forestry District. This suggests that the distance cost of accessibility to these areas decreases as the aging population increases.
As shown in Figure 4d, the number of villages is mainly negatively correlated with accessibility, with an average regression coefficient of −7.1065. In general, the greater the number of villages, the greater the number of elderly residents that can be served by a limited number of CCFs, which in turn reduces the distance cost of accessibility. Overall, the regression coefficients are negative for most townships in Hubei Province, and the most affected areas are concentrated in the southwest of Enshi Tujia and Miao Autonomous Prefecture, including consecutive townships from Lichuan city to Xianfeng County and then to Laifeng County.
4. Discussion
4.1. From the Perspective of Spatial Disparities
Based on the JNBC results of accessibility, the accessibility of CCFs in rural areas was classified into five categories (Figure 2 and Table 1). This provides a reference scheme for areas where it is difficult to assess the lack of elderly services and imbalances and contributes to the rational allocation of elderly resources. We found that the accessibility of CCFs in rural areas in the central and eastern parts of Hubei Province is relatively good, while some rural areas in the west have a poor accessibility level. The western part of Hubei Province is mostly mountainous, which indicates that the accessibility of CCFs in a region is influenced by the topography to some extent, which is consistent with the results of other studies [19,30,50]. Meanwhile, we found through fieldwork that the main mode of transportation in rural China is the electric bicycle, and the Safety Technical Specification for Electric Bicycles (GB17761-2018) specifies a maximum speed limit of 25 km/h [51]. The highest value in the middle of the township scale accessibility distance cost (Table 1) is 9043 m, which can be approximately equal to 10,000 m for ease of calculation. This allows the relevant service personnel to arrive from the CCFs to the demand point in 24 min at the earliest. Therefore, townships with a distance cost higher than 10,000 m or a time cost higher than 24 min can also be identified as areas requiring improvement.
Notably, Hubei Province spans three of the 14 concentrated contiguous special poverty zones, including the Wuling Mountains, Qinba Mountains, and Dabie Mountains [52]. Although rural areas in Hubei Province, including these areas, have been lifted out of absolute poverty, the risk of returning to poverty and relative poverty will exist for a certain period of time, and the risk of returning to poverty is higher for the vulnerable group of elderly people who need additional care. It has been shown that lower accessibility of public services is one of the determinants of poverty in rural areas [53]. Moreover, in this study, there are also a small number of areas with relatively poor accessibility concentrated in the Wuling Mountains (e.g., some townships in Xianfeng County and Enshi Tujia Autonomous Prefecture) and the Qinba Mountains (e.g., some townships in Fang County and Shiyan city). Therefore, policy makers should also deepen their understanding of the correlation between accessibility in HCFs and poverty and prioritize interventions and policies in these areas to prevent the increased risk of returning to poverty due to inadequate public services.
4.2. From the Perspective of Spatial Clustering Analysis
The accessibility of CCFs in the rural areas of Hubei Province shows a pattern of spatial clustering. The accessibility of CCFs in the hot spot areas was very low and more concentrated in the western part of Hubei Province (Figure 3). On the one hand, the very low accessibility representative regions are Enshi city, Xianfeng County, and Hefeng County in Enshi Tujia Autonomous Prefecture, and Wufeng Tujia Autonomous County in Yichang city. These areas are located in the northeastern Wuling Mountains. On the other hand, the very low accessibility representative regions are Zhuxi County, Zhushan County, and Fang County in Shiyan city. These regions are located in the eastern Qinba Mountains. This indicates the very low accessibility of these areas, which matches the undulating topography of the mountains and their relatively underdeveloped economic level.
On the contrary, the cold spot areas in the spatial clustering analysis of cold hot spots are agglomerations with low-value distance cost, mainly located in the east and west of Wuhan city (Figure 3), including Xiaogan, Tianmen, Xiantao, Huanggang, and Ezhou, which are important members of the Wuhan city circle. The Wuhan city circle is not only the core area of Hubei’s economic development, but it is also an important strategic pivot point for the rise of central China. Wuhan city, as the leading city circle, has comparative advantages in location and transportation, forming a radiation drive to other districts close to Wuhan along the Yangtze River and highways and railroads. Therefore the accessibility of CCFs in these areas is relatively good, forming a gathering situation.
4.3. From the Perspective of Correlated Variable Analysis
Based on the results of the variables correlating with the accessibility of CCFs in rural areas from both natural environment and socioeconomic aspects (Figure 4), the Hubei government (especially the Civil Affairs Department) should take into account the correlated variables of the local situation and propose corresponding improvement initiatives when starting to deal with the spatial layout of CCFs. The GWR regression results show that there is a significantly positive correlation between area and distance cost of accessibility, but this effect is not absolute, and we should also fully consider the topography, the carrying population, and the real demand within the regional administrative area and thus increase the number of CCFs more rationally. Elevation and accessibility distance cost also show a positive correlation, and these areas are mainly concentrated in the southwest of Hubei Province and some townships with more complex topography, which is consistent with other studies [30,50]. Therefore, the influence of topography including elevation should be taken into account in these areas, and the CCFs should be further optimized. In addition, the number of empty nesters in rural areas of China is increasing, and the demand for elderly care services is growing [15]. The population over 65 years old shows mainly a significantly negative correlation with the distance cost of accessibility, with more elderly people having better accessibility, which is mainly driven by the demand for elderly services and the effective implementation of the policy of aging in place. For example, the distance cost of CCFs decreases in the Shennongjia Forestry District as the elderly population increases. This suggests that these areas are paying more attention to population aging and may provide lessons for other rural areas. The number of villages has a negative correlation with the distance cost of accessibility, indicating that places with a more bearable population have better accessibility. Therefore, in the process of implementing the rural revitalization strategy, the promotion of a moderate concentration of rural population is conducive to improving the accessibility of CCFs in rural areas.
5. Conclusions
In this study, we calculated the accessibility of CCFs in rural areas of Hubei Province at both village and township levels and analyzed their spatial characteristics and correlated variables to provide references for improving the configuration optimization and layout planning of elderly care facilities in rural areas. The spatial accessibility results show that there were significant spatial disparities in the accessibility of CCFs in rural areas of Hubei Province, with good accessibility areas located in most of the central and eastern areas and poor accessibility areas in the western areas. We found significant spatial clustering characteristics in the study area, with the hot spots with higher distance costs clustered mainly in the western mountainous areas and the cold spots with lower distance costs clustered mainly in the east and west of Wuhan city. Additionally, area and elevation were mainly positively correlated with the distance costs of CCFs, while the population aged 65 and above and the number of natural villages were mainly negatively correlated. The results enrich the study of accessibility of elderly care facilities and provide valuable insights into the impact of different correlated variables on the accessibility of CCFs in rural areas. Therefore, we suggest that as population aging continues to grow, policy makers should develop effective measures to reduce regional differences in the configuration of CCFs in rural areas within the context of local realities.
Author Contributions
Y.W. conceived and designed the experiments; Y.Y. performed the experiments; Y.Y., Y.C., X.T., L.W., S.C. and X.X. analyzed the data; Y.Y. wrote the paper. All authors have read and agreed to the published version of the manuscript.
Funding
This research was supported by the “Soil and Water Conservation Monitoring Research in Hubei Province” project (2017052601) funded by Hubei Anyuan Safety and Environmental Protection Technology Co., Ltd. (Wuhan, China).
Data Availability Statement
Not applicable.
Conflicts of Interest
The authors declare no conflict of interest.
References
- Lutz, W.; Sanderson, W.; Scherbov, S. The coming acceleration of global population aging. Nature 2008, 451, 716–719. [Google Scholar] [CrossRef]
- United Nations, Department of Economic and Social Affairs, Population Division. World Population Prospects 2019 Highlights; United Nations Publications: New York, NY, USA, 2019. [Google Scholar]
- Head of the Office of the Seventh National Census Leading Group of the State Council Interviewed by China News Service. Available online: http://www.stats.gov.cn/tjsj/zxfb/202105/t20210513_1817432.html (accessed on 1 June 2021).
- United Nations. Goal 11: Build Inclusive, Safe, Disaster-Resilient and Sustainable Cities and Human Settlements. Available online: https://www.un.org/sustainabledevelopment/cities/#tab-2267862e52845f3d178 (accessed on 3 June 2021).
- World Health Organization (WHO). Active Aging: A Policy Framework. 2002. Available online: http://apps.ho.int/iris/bitstream/handle/10665/67215/WHO_NMH_NPH_02.8.pdf (accessed on 5 June 2021).
- Zhou, S.; Xie, M.; Kwan, M. Ageing in place and ageing with migration in the transitional context of urban china: A case study of ageing communities in guangzhou. Habitat Int. 2015, 49, 177–186. [Google Scholar] [CrossRef]
- Kim, K.; Gollamud, S.S.; Steinhubl, S. Digital technology to enable aging in place. Exp. Gerontol. 2017, 88, 25–31. [Google Scholar] [CrossRef]
- Ministry of Civil Affairs of the People’s Republic of China. Opinions on Strengthening Care Services for the Elderly Left behind in Rural Areas. Available online: http://www.mca.gov.cn/article/gk/wj/201802/20180215007923.shtml (accessed on 7 June 2021).
- Rahman, M.; Byles, J.E. Older women’s patterns of home and community care use and transition to residential aged care: An Australian cohort study. Maturitas 2019, 131, 28–33. [Google Scholar] [CrossRef] [PubMed] [Green Version]
- Santoni, G.; Meinow, B.; Wimo, A.; Marengoni, A.; Fratiglioni, L.; Calderón-Larrañaga, A. Using an Integrated Clinical and Functional Assessment Tool to Describe the Use of Social and Medical Care in an Urban Community-Dwelling Swedish Older Population. J. Am. Med. Dir. Assoc. 2019, 20, 988–994. [Google Scholar] [CrossRef] [Green Version]
- Smoyer-Tomic, K.E.; Hewko, J.N.; Hodgson, M.J. Spatial accessibility and equity of playgrounds in Edmonton, Canada. Can. Geogr. 2004, 48, 287–302. [Google Scholar] [CrossRef]
- Lin, K.; Lu, Y.Q.; Liu, J.; Zhang, L.; Wang, T.N. Assessment of fair space of public product based on accessibility: A case of Yizheng city. Geogr. Res. 2009, 28, 215–224. [Google Scholar]
- Tao, Z.L.; Cheng, Y.; Dai, T.Q. Measuring spatial accessibility to residential care facilities in Beijing. Prog. Geogr. 2014, 33, 616–624. [Google Scholar]
- Ding, Q.X.; Zhu, L.X.; Luo, J. Analysing spatial accessibility to residential care facilities in Wuhan. Hum. Geogr. 2016, 31, 36–42. [Google Scholar]
- Cai, E.X.; Liu, Y.L.; Jing, Y.; Zhang, L.; Li, J.W.; Yin, C.H. Assessing Spatial Accessibility of Public and Private Residential Aged Care Facilities: A Case Study in Wuhan, Central China. ISPRS Int. J. Geo-Inf. 2017, 6, 304. [Google Scholar] [CrossRef] [Green Version]
- Wang, D.N.; Qiao, C.J.; Liu, S.J.; Wang, C.Y.; Yang, J.; Li, Y.; Huang, P. Assessment of Spatial Accessibility to Residential Care Facilities in 2020 in Guangzhou by Small-Scale Residential Community Data. Sustainability 2020, 12, 3169. [Google Scholar] [CrossRef] [Green Version]
- Wu, H.C.; Tseng, M.H. Evaluating Disparities in Elderly Community Care Resources: Using a Geographic Accessibility and Inequality Index. Int. J. Environ. Res. Public Health 2018, 15, 1353. [Google Scholar] [CrossRef] [Green Version]
- Liu, S.W.; Wang, Y.P.; Zhou, D.; Kang, Y.T. Two-Step Floating Catchment Area Model-Based Evaluation of Community Care Facilities’ Spatial Accessibility in Xi’an, China. Int. J. Environ. Res. Public Health 2020, 17, 5086. [Google Scholar] [CrossRef]
- Liu, S.R.; Qin, Y.C.; Xu, Y.N. Inequality and Influencing Factors of Spatial Accessibility of Medical Facilities in Rural Areas of China: A Case Study of Henan Province. Int. J. Environ. Res. Public Health 2019, 16, 1833. [Google Scholar] [CrossRef] [PubMed] [Green Version]
- The Seventh National Population Census Bulletin (No. 4). Available online: http://tjj.hubei.gov.cn/tjsj/tjgb/pcgb/qrp/202105/t20210526_3560276.shtml (accessed on 7 June 2021).
- Hubei Provincial Statistics Bureau. The Impact of Population Aging on the Socio-Economic Development of Hubei. Available online: http://tjj.hubei.gov.cn/tjsj/tjfx/qstjfx/201910/t20191026_24503.shtml (accessed on 7 June 2021).
- Baidu Map. Available online: http://api.map.baidu.com/lbsapi/getpoint/index.html (accessed on 7 June 2021).
- Hubei Pension Service Information Network. Available online: http://www.hb-pension.org/index.php/List/172.html (accessed on 15 June 2021).
- GEOFABRIK. Available online: https://www.geofabrik.de/ (accessed on 15 June 2021).
- OpenStreetMap (OSM). Available online: https://www.openstreetmap.org/ (accessed on 15 June 2021).
- WorldPop. Available online: https://www.worldpop.org/ (accessed on 15 June 2021).
- Stevens, F.R.; Gaughan, A.E.; Linard, C.; Tatem, A.J. Disaggregating census data for population mapping using random forests with remotely-sensed and ancillary data. PLoS ONE 2015, 10, e0107042. [Google Scholar]
- Resource and Environment Science and Data Center of Chinese Academy of Sciences. Available online: http://www.resdc.cn/ (accessed on 15 June 2021).
- Ge, Y.; Ren, Z.P.; Fu, Y.Y. Understanding the Relationship between Dominant Geo-Environmental Factors and Rural Poverty in Guizhou, China. ISPRS Int. J. Geo-Inf. 2021, 10, 270. [Google Scholar] [CrossRef]
- Yin, C.; He, Q.; Liu, Y.; Chen, W.Q.; Gao, Y. Inequality of public health and its role in spatial accessibility to medical facilities in China. Appl. Geogr. 2018, 92, 50–62. [Google Scholar] [CrossRef]
- Guagliardo, M.F. Spatial accessibility of primary care: Concepts, methods and challenges. Int. J. Health Geogr. 2004, 3, 3. [Google Scholar] [CrossRef] [Green Version]
- McLafferty, S.; Grady, S. Prenatal care need and access: A GIS analysis. J. Med. Syst. 2004, 28, 321–333. [Google Scholar] [CrossRef]
- Yang, D.; Goerge, R.; Mullner, R. Comparing GIS-based methods of measuring spatial accessibility to health services. J. Med. Syst. 2006, 30, 23–32. [Google Scholar] [CrossRef]
- Joseph, A.E.; Bantock, P.R. Measuring potential physical accessibility to general practitioners in rural areas: Amethod and case study. Soc. Sci. Med. 1982, 16, 85–90. [Google Scholar] [CrossRef]
- Hilisdon, M.; Panter, J.; Foster, C.; Jones, A. The relationship between access and quality of urban green space with population physical activity. Public Health 2006, 120, 1127–1132. [Google Scholar] [CrossRef] [PubMed]
- Yao, J.; Murray, A.T.; Agadjanian, V.A. geographical perspective on access to sexual and reproductive health care for women in rural Africa. Soc. Sci. Med. 2013, 96, 60–68. [Google Scholar] [CrossRef] [PubMed] [Green Version]
- Radke, J.; Mu, L. Spatial Decompositions, Modeling and Mapping Service Regions to Predict Access to Social Programs. Geogr. Inf. Sci. 2000, 2, 105–112. [Google Scholar] [CrossRef]
- Luo, W.; Wang, F.H. Measures of spatial accessibility to health care in a GIS environment: Synthesis and a case study in the Chicago region. Environ. Plan. B 2003, 30, 865–884. [Google Scholar] [CrossRef] [Green Version]
- McGrail, M.R. Spatial accessibility of primary health care utilising the two step floating catchment area method: An assessment of recent improvements. Int. J. Health Geogr. 2012, 11, 50. [Google Scholar] [CrossRef] [PubMed] [Green Version]
- Fransen, K.; Neutens, T.; Maeyer, P.D.; Deruyter, G. A commuter-based two-step floating catchment area method for measuring spatial accessibility of daycare centers. Health Place 2015, 32, 65–73. [Google Scholar] [CrossRef]
- Tao, Z.L.; Cheng, Y. Research progress of the two-step floating catchment area method and extensions. Prog. Geogr. 2016, 35, 589–599. [Google Scholar]
- Xing, L.; Liu, Y.; Liu, X. Measuring spatial disparity in accessibility with a multi-mode method based on park green spaces classification in Wuhan, China. Appl. Geogr. 2018, 94, 251–261. [Google Scholar] [CrossRef]
- Zhang, L.; Lu, Y.Q.; Zhao, Y.Z. Accessibility Assessment and Planning of Hospital—A Case Study on Yizheng City. Hum. Geogr. 2008, 23, 60–66. [Google Scholar]
- Oden, N.L. Spatial Processes: Models & Applications. Q. Rev. Biol. 1982, 2, 236. [Google Scholar]
- Anselin, L. Local indicators of spatial association—LISA. Geogr. Anal. 2010, 27, 93–115. [Google Scholar] [CrossRef]
- Fotheringham, A.S.; Charlton, M.E.; Brunsdon, C. Geographically weighted regression: A natural evolution of the expansion method for spatial data analysis. Environ. Plan. A 1998, 30, 1905–1927. [Google Scholar] [CrossRef]
- Brunsdon, C.; Fotheringham, A.S.; Charlton, M. Some notes on parametric significance tests for geographically weighted regression. J. Reg. Sci. 1999, 39, 497–524. [Google Scholar] [CrossRef]
- Liu, R.X.; Kuang, J.; Gong, Q.; Hou, X.L. Principal component regression analysis with SPSS. Comput. Methods Programs Biomed. 2003, 71, 141–147. [Google Scholar] [CrossRef]
- Fotheringham, A.S.; Kelly, M.H.; Charlton, M. The demographic impacts of the Irish famine: Towards a greater geographical understanding. Trans. Inst. Br. Geogr. 2013, 38, 221–237. [Google Scholar] [CrossRef]
- Wang, X.; Yang, H.; Duan, Z.; Pan, J. Spatial accessibility of primary health care in China: A case study in Sichuan Province. Soc. Sci. Med. 2018, 209, 14–24. [Google Scholar] [CrossRef]
- Safety Techniccal Specification for Electric Bicycle. 2018. Available online: https://www.miit.gov.cn/cms_files/filemanager/oldfile/miit/n1146285/n1146352/n3054355/n3057497/n3057502/c6176772/part/6176777.pdf (accessed on 20 June 2021).
- Ge, Y.; Hu, S.; Ren, Z.; Jia, Y.; Chen, Y. Mapping annual land use changes in china’s poverty-stricken areas from 2013 to 2018. Remote Sens. Environ. 2019, 232, 111285. [Google Scholar] [CrossRef]
- Liu, M.; Hu, S.; Ge, Y.; Heuvelink, G.; Huang, X. Using multiple linear regression and random forests to identify spatial poverty determinants in rural china. Spat. Stat. 2020, 42, 100461. [Google Scholar] [CrossRef]

Publisher’s Note: MDPI stays neutral with regard to jurisdictional claims in published maps and institutional affiliations. |
© 2021 by the authors. Licensee MDPI, Basel, Switzerland. This article is an open access article distributed under the terms and conditions of the Creative Commons Attribution (CC BY) license (https://creativecommons.org/licenses/by/4.0/).