Abstract
International bodies and numerous authors advocate a key role for Digital Government (DG) in improving public governance and achieving other policy outcomes. Today, a particularly relevant outcome is advancing Sustainable Governance (SG), i.e., the capacity to steer and coordinate public action towards sustainable development. This article performs an empirical study of the relationship between DG and SG using data about 41 OECD/EU countries from the United Nations’ E-Government Survey and the Bertelsmann’s Sustainable Governance Indicators project, covering the period from 2014 to 2020. We examine if DG progress pairs with SG progress, apply a DEA model to find out which countries are efficient in using DG for better SG, and uncover cases of imbalance where high DG pairs with poor SG and vice versa. The results show that the efficiency in using DG for SG strongly varies, and that some DG leaders persistently fail to advance or even regress their SG. These findings refute the claims about the benign role of DG and points at democracy as the “weak link” in the analyzed relation.
1. Introduction
Digital Government (DG) may be treated as an umbrella concept meaning “many things to different people according to one’s focus” [1] (p. 186), and engaged rhetoric may respond to different government priorities [2] (p. 23). DG does not have one settled definition; extracting the “perfect” one emerges as a scientific activity on its own [3], and circulating definitions vary in terms of scope—from information supply to e-democracy; subject—from citizens to all public stakeholders; and technology family—from personal computers to the Internet [4] (p. 9). To make things worse, DG is also called by various synonyms or near synonyms, such as “electronic government,” “electronic governance,” “transformational government,” and others. Here, we stick with the “digital government” label and study its relations with governance. A clarification for readers not familiar with this nomenclature: DG does not refer to a “digital” variant of “normal” government; it is rather about the use of digital technologies by government. What is more, a distinction between “government” and “governance” should be made: governance is a multi-stakeholder process and government at any level can be a stakeholder in this process [5].
However, what remains clear is that the systematic and institutional application of digital technology to public administration routines—a generic DG denotation—is not treated as a fancy tribute to the technical progress but a path to achieving tangible benefits for the state and society. Indeed, while these benefits appear fairly malleable, given the variety of state qualities that can be enhanced by DG, as technology becomes mightier and more ubiquitous, the expectations rise as well. On the other side, the early enthusiasm and faith in the revolutionary power of digital technology, e.g., “[DG] offers a historic opportunity to make the impossible possible for developing countries” [6] (p. 8), is nowadays scaled down to concrete expectations. According to [4] (pp. 8–10), potential benefits can range from general, e.g., service efficiency and improved access to citizens, to explicit, e.g., civic participation and cost containment.
From a normative standpoint, we expect that DG should improve various qualities of public governance. The literature contains various studies that confirm such expectations. The targets range again from general, e.g., DG for good governance [7,8] DG for public value creation [9,10], or DG for political modernization [11], to explicit, e.g., DG for government effectiveness [12], DG against bureaucracy and administrative burden [13], or DG against corruption [14,15]. A separate category consists of studies that handle high-value political issues. What is the relationship between DG and democracy? Does digitalization reveal its transformative power in government? Despite the hope in the healing power of digital technology [16], DG still hosts debate and controversy [17,18,19].
Among many expectations for producing high-value policy impact, DG is increasingly recognized as a key enabler for Sustainable Development (SD). This is declared by many international organizations, e.g., the European Commission intends to “harness ICT to promote smart, sustainable and innovative government” [20], the United Nations (UN) assures the strategic role of DG in the SD agenda [21,22,23], and the Organisation for Economic Co-operation and Development (OECD) notes that DG “can make a crucial contribution to sustainable development and growth” [24] (p. 5).
Such declarations are supported by an increasing body of research literature. For instance, the conceptualization of “Electronic Governance for Sustainable Development” (EGOV4SD) along with EGOV4SD bibliographic analysis are documented in [25]. The relationship between DG capacity and DG aspiration to advance SD in a country is scrutinized in [26]. The problem of measuring DG as one of the key SD “means of implementation” is undertaken in [27]. The factors that influence successful impact of DG on SD are analyzed in [28]. An update to the DG maturity models that reflects the developing country context is proposed in [29]. The literature also includes some quantitative studies on the relationships between DG and SD, e.g., the model of DG impact on dimensions of sustainability [30], a similar model using good governance as a mediating factor [31], DG influence on environmental sustainability in Small Island Developing States [32], etc.
However, the existing literature on DG for SD is limited in at least three aspects. First, most empirical studies focus on statistical analysis of the relationships between variables representing DG (sometimes loosely) and SD, and much less on the characteristic problems of specific countries, e.g., in a form of benchmarking [33]. Concerning the variables representing DG, Ref. [31] considers DG services but also engages the dimensions of human capital and technological infrastructure; Ref. [30,32] harness the aggregate concept of “e-government development,” as conveyed by the UN’s E-Government Development Index; and Ref. [34] focuses on the measurement of citizens’ attitudes towards DG. Second, the attention of most studies is on developing countries, whereas all countries pursue sustainable development and have particular circumstances to attain this goal. Developed countries in particular have to know their strengths, weaknesses, and positions in order not to reach a dead-end [35] (p. 94). Third, sustainable development is conditioned by governance organized in a sustainable manner [35], also called Sustainable Governance (SG), and the relationships between DG development and SG attainment remain mostly unexplored.
Thus, we undertake in this article a study of the relationships between the level of DG development and the attainment of various qualities of SG, referring to the measurement of DG and SG in 41 OECD or EU countries in the period 2014–2020. To this end, we confront the indicators of the United Nation’s E-Government Survey (DG measurement) with the Bertelsmann’s Sustainable Governance Indicators (SG measurement). The general goal is to examine whether and to what extent DG development is related to SG progress and how particular countries perform in this respect. More specifically, the empirical study is organized around three research questions regarding: (1) the country cases of significant imbalance between measured assessments of DG quality and SG quality, (2) the assessment of SG progress among the leaders in DG progress, and (3) DG-to-SG efficiency among the analyzed countries, with DG advancement in 2014 taken as input, and SG quality in 2020 taken as output. The results show that there are a few persistent cases of DG vs. SG imbalance consisting of countries that advance on DG but regress on SG. The results also partly confirm doubts towards DG as a democracy booster. The results should be of interest to policy-makers and public managers from the analyzed countries, and to designers/managers of the DG/SG measurement instruments.
The remainder of this article is organized as follows. In Section 2, we further elaborate on the foundations of this study, such as DG, SG, and the role of DG in advancing SG. In Section 3, we present the data and methods of the study. In Section 4, we disclose the results of this study, followed by discussion in Section 5, and conclusions in Section 6.
2. Background
As discussed earlier, from a normative standpoint, DG is expected both to improve the country’s quality of governance and to advance its pursuit of SD among other high-value public goals. Building upon the intersection of these domains, we proceed by first reviewing the concept of governance and its quality; second, we examine the role of governance in pursuing SD—so-called Sustainable Governance (SG); and third, we explore how DG can advance SG—Digital Sustainable Governance (DSG).
2.1. Governance
When speaking of public governance, the first challenge is to identify the semantic frames of this concept. Even though the term appears intuitive and understood by the non-specialist audience, this intuition may be misleading. According to Fukuyama, the term has at least three meanings. Public administration, i.e., “effective implementation of state policy” [36] (p. 89) is the one most relevant to what we discuss here. A governance-defining exercise undertaken in [37] concludes that “governance is the coordinated, polycentric management of issues purposefully directed towards particular outcomes” [37] (p. 257). The World Bank supplies a variety of definitions, from broad: “rules, enforcement mechanisms, and organization,” to public sector-specific: “the manner in which power is exercised in the management of a country’s economic and social resources for development” [38] (p. 3).
Descending the level of generality, we identify the demanded qualities of governance. Again, the range of ideas is broad, but typically boil down to eight features under the “good governance” label—participatory, consensus-oriented, accountable, transparent, responsive, effective and efficient, equitable and inclusive, and following the rule of law (GG) [39]. Equally, the GG concept is criticized for its shortages in terms of parsimony, differentiation, coherence, and—specifically—theoretical utility [40]. Indeed, GG carries different meanings based on who speaks about it: the international donor community, national governments, business entities, and non-governmental organizations [41]. The competition is typically fought along economic paradigms, and often won by the neoliberal option [42].
Beyond this debate, if governance is to be operationalized, in order to be measured and compared, a relevant framework and data are required. Among such frameworks, one of the most recognized is the World Bank’s Worldwide Governance Indicators [43], designed to survey governance globally and in six dimensions: Voice and Accountability, Political Stability and Absence of Violence/Terrorism, Government Effectiveness, Regulatory Quality, Rule of Law, and Control of Corruption [38] (p. 4).
2.2. Sustainable Governance
Even though the UN Sustainable Development Goals (SDG) lack a single goal dedicated to good governance [44], (good) governance is considered essential in the pursuit of the whole agenda. For instance, the role of governance is emphasized within Goal 16: “We cannot hope for sustainable development without peace, stability, human rights and effective governance, based on the rule of law” [44]. This position is supported by OECD: “The success of these goals [SDG] depends to a large extent on the coordination of implementation efforts through good public governance” [45].
A question that arises here is: can governance and sustainability (understood as a paradigm shift rather than just one of governance qualities) be aligned up to a level that one can speak about “sustainable governance,” and thus perfect integration rather than interrelation? In their search for an answer, Bosselmann et al. conclude that: “Sustainable governance is the set of written and unwritten rules that link ecological citizenship with institutions and norms of governance,” and thus, is separated from the conventional theories of governance, even in its “good” form [46] (p. xiv). This tension resonates with the findings of [47], which challenge GG as “the universal recipe for achieving sustainable development” since “there is no single form of good governance that can achieve sustainability” [47] (p. 569). Hence, an assertion that GG “does not guarantee sustainable development; however, its absence severely limits it and can, at worst, impede it” [48] (p. 1166).
Weighing the arguments above, it is justified not to treat SG as a brand new embodiment of governance strictly following the philosophy of SD, as present in the typical academic discourse and conceptualized in [46]. Instead, we can treat SG as a subset of governance that aggregates the features that are conducive to the pursuit of sustainability, hence, e.g., distinct from any “economy first” option. An example of such an approach is exposed in Bertelsmann’s Sustainable Governance Indicators [49], to be discussed further. Our preview of the articles published in the “Sustainability” journal (42 articles responding to the search phrase “sustainable governance” as of 25 October 2021) confirms that the majority of authors approach the topic with a similar view.
2.3. Digital Sustainable Governance
The UN consistently promotes DG as a driver for SD, as manifested in the selection of themes for three recent editions of the Global E-Government Survey: “E-Government in Support of Sustainable Development” [23], “Gearing E-Government to Support Transformation towards sustainable and resilient societies” [22], and “Digital Government in the Decade of Action for Sustainable Development” [21]. The UN’s DG-surveying initiative is well-aligned with the organization’s focus on the SDG agenda. Nonetheless, there are good reasons to assume that this association transcends intra-organizational alignment, particularly given its presence in the reports and documents issued by other organizations, as mentioned earlier.
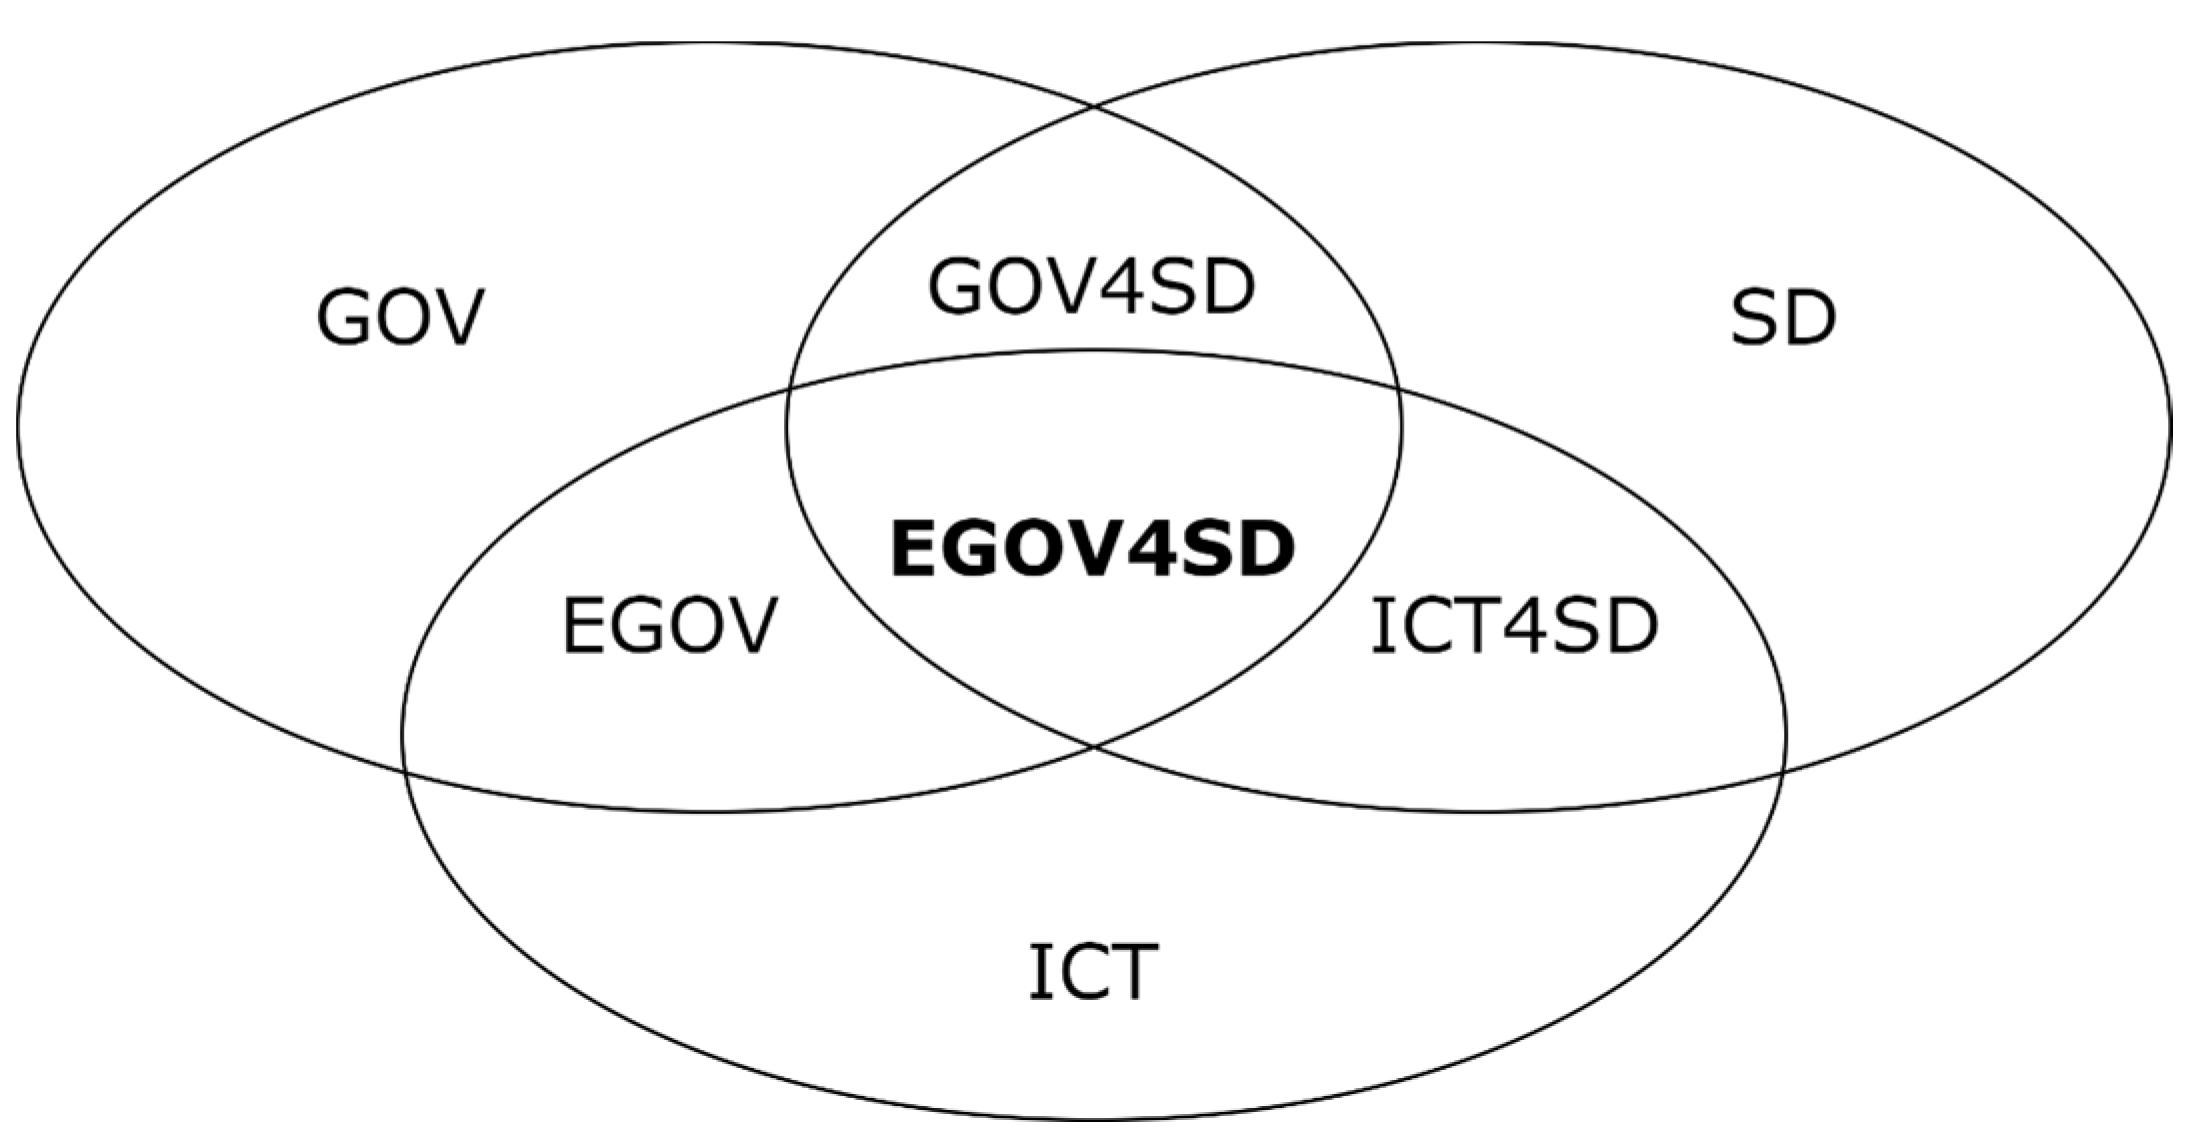
The nexus of the relationships between digitalization, governance, and SD is scientifically underexplored, as noticed in [25]. In order to organize the field, the study proposes a scheme depicted in Figure 1.

Figure 1.
Interrelations between the governance (GOV), sustainable development (SD), and digital technology (ICT) domains, adapted from [25] (p. S97).
The scheme indicates what emerges by the intersections of three domains—digital technology (ICT), governance (GOV), and SD. E-governance (EGOV) here is understood as ICT enabling governance—in our paper, it is Digital Government (DG). Governance enabling SD (GOV4SD) is Sustainable Governance (SG). The focus, however, lies in the intersection of all three domains (EGOV4SD)—in our paper, it is Digital Sustainable Governance (DSG). The “enabling” relationships highlight that the intersections are not symmetric: ICT is always a “service domain,” SD is always a “customer domain,” but GOV is a “customer domain” with respect to ICT and a “service domain” with respect to SD [25] (p. S96). By the same logic, EGOV—the intersection of two service domains with respect to SD—is also a service domain with respect to SD. Thus, when a service by DG fails to enhance SD, the likely cause is a political, managerial, or measurement problem.
The study in [26] further discusses these relations, stating that “public governance, digital technology and technology-enabled public governance are important means for SDG implementation” [26] (p. 604). However, in the author’s view, a certain level of DG development is required to support SD. Using the evolution model [50], where DG advances along a four-stage path—digitization, transformation, engagement, and contextualization—the research examines the so-called “aspiration-capacity gap.” This gap is expressed as a difference between a country’s DG assessment using the current edition of the UN’s E-Government Survey and a threshold level required to effectively engage DG in satisfying a certain SDG target. As a reflection, the message of this study confirms the need to observe the relatively developed countries, in which DG level is typically high enough to make it potentially useful for SD. Goal 17 calls it “means of implementation.”
An interesting insight into the quantifiable aspects of the problem can be found in [31]. The study is focused on Small Island Developing States (SIDS), which are generally lagging behind in DG development. Conceptually, it builds upon a range of SG qualities affected by DG, including, e.g., greater efficiency and effectiveness, and enhanced citizen participation and transparency [31] (p. 10). Statistically, it applies a model where DG impacts SD both directly and through good governance, unlike [25]. The study approximates the level of DG development by the UN E-Government Survey and most of the expected DG effects are revealed as statistically significant.
To briefly conclude this discussion, we note that while the idea of DG impacting SD directly is legitimate, conceptually and practically, the natural intermediary for this impact is Sustainable Governance (SG). We call the resulting theoretical construct Digital Sustainable Governance (DSG).
3. Materials and Methods
Methodological decisions guiding this research include decisions on research questions, data sources, selection of indicators from such sources, and statistical methods applied on the selected indicators. Such decisions are documented and justified in subsequent sections.
3.1. Research Questions
In light of the discussion on the relationships between DG, SG, and SD in Section 1 and Section 2, this study is focused on the research problem: “What is the relationships between the level of DG development and the attainment of various qualities of SG?”
To this end, it pursues three research questions: (1) What are the country cases of imbalance between DG and SG?; (2) Are countries making progress with DG also making progress with SG?; (3) How efficient are countries in using their DG to advance SG?
The study undertakes to examine these questions quantitatively for the pool of OECD/EU countries in the period from 2014 to 2020.
3.2. Data Sources
Regarding the nature of the research problem, we reached for data coming from two publicly-available and internationally-recognized datasets. The first assesses the level of DG (“digital side”) and the second the quality of SG (“analog side”) in a country. These sources are depicted in Table 1. Technically, we had to find the optimal balance between the comprehensiveness of the indicators, and the feasibility of the study, in terms of data availability, academic and managerial recognizability, etc.

Table 1.
Sources of data used in the study.
The UN E-Government Survey (EGS) [51] is arguably the most recognizable global DG benchmarking initiative. Given its presence in numerous studies and analyses, it is often treated as the de facto project of this kind. Although criticized for the shortages of the underlying framework and possible confusion caused by indiscriminate adoption, it remains the only fully global (193 countries in 2020) and long-lasting (biennial editions since 2003) DG survey. While its key deliverable is the E-Government Development Index (EGDI), for the reasons explained further, we decided not to use this index as a measure of a country’s DG advancement. We treat this data source as the operationalization of DG, keeping in mind that the fairly debatable frontiers of the DG concept potentially allow for alternative choices
The Bertelsmann’s Sustainable Governance Indicators (SGI) [49] are one of a few enduring projects that measure the countries’ public governance. The project is particularly relevant to this study as it is based on a framework that explicitly assesses the countries’ ability to “achieve sustainable policy outcomes and imbue political decision-making with a longer-term focus” [52] (p. 2). The geographical scope of the project is 41 OECD and EU member countries, and the data are supplied annually from 2014 to 2020. We treat this data source as the operationalization of SG.
To merge these two datasets, we took the SGI data for the years 2014, 2016, 2018, and 2020, and complemented them with the respective EGS records. Fortunately, the data, i.e., all records and variables, were complete. The aggregate dataset can be found in the Appendix A (Table A1).
3.3. Indicators
In each of the four years under analysis, every country is described by five indicators—two digital and three analog. Table 2 summarizes this set.
Table 2.
Indicators used in the study.
Further in this text, if values of a certain indicator refers to a particular year, a timestamp is appended in the following manner: EPI_14, DEM_20, etc.
Both EPI and OSI focus on how successful and comprehensive the government’s online presence and services are. The latter is more general; it captures the “scope and quality of online services” [21] (p. 231). The former is more specialized; it focuses on participatory mechanisms introduced along the stages of “e-information,” “e-consultation,” and “e-decision making” [21] (p. 250). In both cases, data are gathered through extensive questionnaires.
We decided not to reach for the EGDI values directly because only one-third of this index refers to DG per se, and the rest is about DG prerequisites, i.e., infrastructure and human capital [21] (p. 231). This approach of directly using EPI and OSI instead of EGDI is widespread in studies, e.g., [18,26,54], or benchmarking projects, e.g., Network Readiness Index [55].
POL, DEM, and GOV are the composite indicators representing three pillars of the SGI framework, with the aims to assess “sustainable policymaking by analyzing democratic institutional frameworks, governance capacities and outcomes in key policy areas” [53] (p. 4). These indicators integrate the information coming from the constituent thematic areas, obtained by aggregating numerous low-level variables. These areas are:
- POL—Economic, Social, and Environmental Policies [53] (pp. 8–9);
- DEM—Electoral Processes, Access to Information, Civil Rights and Liberties, and the Rule of Law [53] (pp. 10–11); and
- GOV—Executive Capacity and Accountability [53] (pp. 12–13).
Keeping in mind the relatively general character of the problems undertaken in this work, we decided to stick with the pillar-level measures. More detailed exploration is planned to be carried out in a future study.
3.4. Methods
To answer the three research questions, we took the steps described below.
Regarding the first research question, we reviewed the descriptive statistics of the dataset, calculated them in MS Excel 2010, and now present them in Table 3. The table shows a lot of variance in the distribution of the variables, beyond their range differences. EPI, OSI, and DEM consistently reveal negative skewness, so observations tend to occur in the upper part of the range; the opposite occurs in the case of POL. However, the situation is complicated, since the distributions are mostly platykurtic (negative kurtosis) and not all of them can be treated as unimodal (e.g., EPI_14).
Table 3.
Descriptive statistics of the dataset.
Given the above, to provide comparability between indicators and years, we decided to employ the measures of position, namely the interquartile range (IQR). By IQR, we took a difference between the third quartile (Q3) and the first quartile (Q1), which was meant to be covered by roughly half of the countries; the number of countries is odd (Excel’s QUARTILE.EXC formula was used to identify the quartiles). Therefore, for each indicator in each year, we adopted the following rule. If a country’s indicator value exceeds Q3 in a given year, the country is considered a “leader” in that year. If the value is below Q1, the country is considered a “laggard.” Thus, imbalance occurs in two cases:
- when a country is a leader in one of the digital domains but a laggard in one of the analog domains—DG surplus/SG deficit—or
- when a country is a leader in one of the analog domains but a laggard in one of the digital domains—SG surplus/DG deficit.
Regarding the second research question, we calculated the difference between the values of EPI and OSI in two marginal years 2014 and 2020. Considering the countries that boast the biggest digital progress, we examined the respective changes in the values of the analog indicators.
We also considered the difference between 2020 and 2014 when assessing the countries’ efficiency for the third research question. However, this time, we employed the approach of Data Envelopment Analysis (DEA), which is a nonparametric method for “evaluating the performance of a set of peer entities called Decision Making Units (DMUs), which convert multiple inputs into multiple outputs” [56] (p. 1) by means of linear programming. The approach was proposed in 1978 by Charnes, Cooper, and Rhodes [57] for “evaluating activities by not-for-profit entities” [57] (p. 429). In 40 years since the invention, numerous DEA extensions have emerged, engaging in diversified areas from country benchmarking [58] and recalculation of indices [59] to rearrangement of the DG measurement schemes [60].
In brief, the point is to scrutinize a unit’s efficiency, understood as a relation of weighted outputs to weighted inputs, in relation to the efficiency frontier. Thus, a “DMU is to be rated as fully (100%) efficient on the basis of available evidence if and only if the performances of other DMUs do not show that some of its inputs or outputs can be improved without worsening some of its other inputs or outputs” [56] (p. 3). In our case, DMUs are the 41 OECD/EU countries; the inputs are the countries’ DG efforts approximated through the values of EPI and OSI in 2014; the outputs are the qualities of SG approximated through the values of POL, DEM, and GOV in 2020; and the performance is about the efficient development of SG when enabled by DG.
To summarize, the assumed logic is that a country’s public managers decide (hence, “decision-making”) to invest in the development of DG, expecting its later effects on the quality of SG. Likewise, it should be noted that DG is certainly not the only enabler of SG. In fact, the real “production function,” i.e., the relation between inputs and outputs, can be fairly complicated; thus, the non-parametric approach of DEA allows for at least some comparison of countries’ efficiencies.
Therefore, efficiency here is understood as relative (i.e., considered within a particular group of the analyzed countries) level of utilization of the inputs (DG) for the sake of the outputs (SG). Given the logic of the DEA approach, a country’s efficiency is calculated in relation to the leader countries (“benchmarks”), and thus, by definition, the resultant value cannot exceed 1, which indicates full efficiency. Using EPI and OSI as the input proxies, and POL, DEM, and GOV as the output proxies, and considering the time frame from 2014 to 2020, this is motivated by preserving consistency with the earlier stages of this study. More general discussion on the sense and accuracy of these particular indicators is provided in Section 3.2 and Section 3.3.
Since we are more interested in a question “Is a country’s SG good enough given its DG?” than “Is a country’s DG too good for its SG?”, we selected the output-oriented variation of DEA. We also selected the variable return-to-scale (VRS) variation since the predefined borders of the SG indicators suggest that the outputs cannot be always increased in line with the inputs. The adopted output-oriented BCC (Banker Charnes Cooper) model [61] (p. 52) can be mathematically expressed in the form of a linear program depicted in Appendix B (Figure A1).
Calculations were performed using MS Excel 2010, except for the DEA computations, which were performed with Open Source DEA software [62].
4. Results
When countries seek to utilize DG in order to advance SG, the questions of imbalance, progression, and efficiency arise, as explained in Section 3.1. We respond to these questions using the data described in Section 3.2 and Section 3.3, and the methods presented in Section 3.4. The responses to the three research questions are provided in Section 4.1,Section 4.2,Section 4.3, respectively.
4.1. Imbalance
Regarding the first question, we uncovered several cases of imbalance: 11 representing DG surplus/SG deficit, and 7 representing SG surplus/DG deficit. Taking the total of 164 cases (4 years and 41 countries) analyzed in this study, the problem is not typical, but also not marginal given some persistent tendencies. Table 4 identifies the cases of DG surplus/SG deficit imbalance (left) and the cases of SG surplus/DG deficit imbalance (right). The table labels the performance of the countries’ digital or analog indicators using above-standard (+) or below-standard (−) markers.
Table 4.
Cases of DG surplus/SG deficit imbalance (left) and SG surplus/DG deficit imbalance (right).
Concerning the DG surplus/SG deficit imbalance, as one may notice, beyond a few one-time occurrences, e.g., Chile 2014, there are also countries that regularly display this imbalance. The most notable case is Japan, which reveals a systematic imbalance with the highly developed digital participation and relatively poorly assessed democracy. In 2014 and 2016, Japan shared this designation with South Korea. The table also reveals a surprising contrast between the quality of DG and the relatively low assessment of the quality of the economic, social, and environmental policies in the United States. In general, the main tension arises (in 6 out of 11 cases) between EPI and DEM.
Concerning the SG surplus/DG deficit imbalance, the tension between EPI and DEM also dominates in 5 out of 8 cases. It is worth noting the case of Switzerland, which was a two-time leader in two out of three SG domains, but a laggard in DG. Possibly even more characteristic is the assessment of Germany, where the contrast between the deficit for all DG indicators and the surplus for all SG indicators is complete. Additionally, the right side, unlike the left, is entirely dominated by the European cases.
4.2. Progression
Between 2014 and 2020, the OECD/EU countries improved their performance on average by: 0.20 (EPI), 0.15 (OSI), and 0.24 (POL). By contrast, DEM declined on average by 0.31.
Table 5 lists the top 10 countries that during 2014–2020 progressed the most in terms of DG, with EPI on the left and OSI on the right. The DG values are contrasted with the differences in the values of the SG indicators. As can be noticed, both lists consist of almost the same countries: the new (i.e., joining in 2004 or later) members of the European Union.
Table 5.
Top 10 countries in terms of DG progress 2014–2020 and respective differences in the governance indicators.
While the DG advancement was typically paired with the progress in POL and—in most cases—GOV, it is clear that almost all of these countries declined in terms of DEM. The cases of Poland and Turkey are particularly striking—they not only experienced a massive fall in the quality of democracy (−3.54 in the case of the former), they declined in all three SG domains. In contrast, Malta is the only country in the list that achieved positive results across all SG domains.
4.3. Efficiency
Considering the DG efficiency in the period from 2014 to 2020, it comes out that there are five efficient countries (objective value 1), and all of them are European: Denmark, Sweden, Bulgaria, Czechia, and Switzerland. Significantly enough, two of them are Scandinavian countries (and two more are at the forefront), known for their dedication to sensible implementation of digital solutions with long-term public benefits perspective in mind, and two are post-socialist countries starting with relatively low levels of DG advancement. Thus, their SG outcomes can be considered optimal given the initial levels of DG development. On the other side, countries like Turkey, Mexico, or Hungary reveal serious problems with the exploitation of the DG capacity for SG development. In general, while the leaders in this ranking clearly share some common features, e.g., the apparent domination of highly developed European countries, the other side reveals less obvious patterns, e.g., high geographical diversity. Thus, it is probably worth a separate study. Table 6 presents the ranking of the OECD/EU countries according to their computed DEA objective values, i.e., efficiency scores.
Table 6.
DG to SG efficiency scores in 2014–2020.
5. Discussion
Our study succeeded in uncovering the findings that are hidden when the countries’ DG (digital side) and SG (analog side) are analyzed separately. Our approach was based on the assumption that digitalization can, and often should, be studied with an explicit reference to its “analog” outcomes. If a country claims an increase in the values of its DG indicators, then a natural reaction is “Fine, but what the resulting changes were?” We showed that even if some conceptually-related change occurred, e.g., in the quality of SG, the direction of this change may not be aligned with what we expect from DG. In that sense, our work—even besides the results themselves—has the potential to promote a regular monitoring of the actual impact of DG on the qualities of SG. Previous efforts in this direction—albeit not sustainability-focused—should be also noted here, e.g., [33,54].
Speaking of the findings, we can discuss them in relation to specific research questions. First, we uncovered meaningful examples of digital-analog imbalances. For instance, Japan excels in the implementation of DG and traditionally technical innovations, but according to SGI, its governance is between mediocre and poor when it comes to the quality of democracy—problems with public decision-making, media freedom, appointments of justices, etc., are noted in this context [63]. Not to stick with SGI, the “Varieties of Democracy” project asks if Japan’s democracy is in retreat [64], noting that “democracy in Japan has been regressing since the 2010s” [64] (p. 10). Moreover, the cases of imbalance in the US, with its state-of-the-art DG and underperforming SG, are noticeable. In particular, SGI criticizes the country’s environmental policies, to notice that “The Trump administration has been a rapidly escalating disaster for environmental policy” [65]. On the other side, the cases of Switzerland and Germany feature relatively poor DG accompanied by fine SG. Thus, they provide an argument to those that claim that DG may be helpful but inessential for pursuing SG and SD.
Second, confronting the top DG performers with the respective changes in their SG reveals some disturbing facts. While policy performance and governance quality generally seem to benefit, or at least not decline, the regression of democracy is alarming. Even if we treat the latter as a symptom of the global trend [66], a question to be asked is: what is the economic sense of public investment in the development of DG services that realize the mechanisms of e-participation and e-democracy if, “One domain that seems impervious to the transformative effects of digital technologies is our model of democratic governance” [67] (p. 8). Two cases listed here are particularly striking: Poland and Turkey. Both declined in all three analog domains. While Poland was up to 2016 among the leaders of SG performance, its SGI standing declined dramatically since then, coinciding with the rule of the Law and Justice party. As the party still enjoys a high level of popular support, the decline may continue. A similar case is Turkey. The modern authoritarian tendencies in those and other countries are discussed in [68].
Third, when treating the relationship DG-SG globally, i.e., adopting a metaphor of production processes and applying DEA to the 2014–2020 span, it can be noted that five countries fully realize their input DG potential. On the other side, there is a group, including Turkey and Poland that should reconsider their DG investment strategies. The DEA methods are sensitive to the starting point, i.e., a country starting from a relatively low DG level, if it manages to advance its SG, can score high in this classification. Thus, the strongly ineffective cases deserve particular attention. To our knowledge, this method of analysis is original when applied to DG-SG relations, although one can indicate one paper approaching the problem from a methodological standpoint [60] and another focusing on the digital side only [69].
Besides the most direct conclusions, the findings of this study can also be put in a wider context of the critique directed towards the impact of digital technologies on sustainability, particularly on democratic and social qualities in various areas and at various levels of society. In their report oriented at smart cities, often labelled as “smart sustainable cities,” Morozov and Bria [70] raise the problem of the neoliberal approach to “digital capitalism,” which goes with its typical miasma, such as dogmatic austerity and ubiquitous privatization. The latter are often disguised behind the potentially attractive ideas of “smartness,” “intelligence,” etc. In her renowned work, Zuboff [71] confronts related problems, namely the use of digital technologies for privacy violation, advanced market exploitation of human behavior, and the undermining of democracy. Similar phenomena are discussed in [72], this time in the context of labor in “digital economy.” For instance, the authors scrutinize the value creation model of Facebook, to note that its “value is essentially based on a process of expropriation of the life skills of individuals” [72] (p. 2).
To summarize what we have learned, while the state of digital-analog imbalance is relatively scarce, the assumptions that significant DG progress automatically leads to better SG are simply false. The nature of the DG-SG relationships is rather complicated, with possible moderating and mediating factors worth further exploration. Democracy confirms its position as a “weak link” in this relation, confirming the observations made earlier in the studies, such as [18,73,74]. However, most studies approach the problem globally, where OECD/EU countries are generally highly ranked for their governance quality. This leads to focusing the observation on Bahrain, Kazakhstan, and other “openly” authoritarian regimes, mostly from Asia [17,73]. Focusing instead on the developed countries from OECD or EU helps capture less apparent problems, and makes particular sense for countries that have the full potential to effectively use DG for SD [26]. The findings may also lead to a call for better DG measurement instruments, i.e., the instruments that by design weight DG performance by a measure of its analog impact, e.g., the impact on SG or SD, thus eliminating possible distortions in the very first stage. The efforts of this kind include [33,54,75].
6. Conclusions
This study examined the relationships between Digital Government (DG) measured through the UN’s e-Participation Index and Online Services Index and Sustainable Governance (SG) measured through the Bertelsmann’s Sustainable Governance Indicators, in 41 OECD/EU countries in the period 2014–2020. Out of 164 analyzed cases, we uncovered 11 cases of DG surplus/SG deficit imbalance, and 7 cases of SG surplus/DG deficit imbalance. In the former category, most of the cases declined in democracy, with Poland and Turkey regressing in all three SG domains. The analysis of the DG-to-SG efficiency in 2014–2020 disclosed only five fully efficient countries—Denmark, Sweden, Bulgaria, Czechia, and Switzerland.
This research has certain limitations. First, the indicators come from just two sources. Second, the applied methods are clear, but their range is limited. Third, the examined DG-SG relationship should not be treated as a “cause-effect” chain. One can speak of a conceptually-reasoned comparison, not a developed model of impact, which would probably require a broader set of additional factors. Such factors could include, e.g., societal attitude to the country’s authorities [18], clarity of the government’s digital strategy including the explicit formulation of the DG’s “analog” goals, the country’s institutional quality, the openness of society towards the regular use of DG services, etc.
Another issue to address is the problem of generalization. In this study, we deliberately limited our selection to the relatively highly developed OECD/EU countries, first considering the high enough level of DG to effectively influence SG, and second, adapting the approach and data of the SGI framework. Thus, the results strictly refer to this particular group of countries. However, more global efforts are also worth taking, with some examples already present, e.g., [33]. For the obvious reasons, replicating this study with a wider geographical scope and the same set of indicators is currently impossible. Nonetheless, building upon the concept of DSG and rearranging the scheme of measurement, the perspectives of a global analysis exist, and such a study is within our future interests.
We hope that policy-makers, public managers, government analysts, and academics will find the methods and outcomes of this study useful in their future work. The main practical contribution is about revealing the worrying trends that happen in some highly developed countries, where DG progress appears to not find its reflection in the quality of governance. Thus, the study formulates a message to the policy-makers in the “unbalanced” countries: review and reformulate the policy in order to be able to benefit from digitalization. Another practical contribution is an empirical proof of shortages of the DG measurement methods. Even if they accurately assess the level of DG development, they should be enhanced with some references to a country’s actual DG impact. Furthermore, we trust that the results can give some input to the debate on how to effectively use DG in strengthening SG and, in turn, SD. On the theoretical side, we can primarily indicate the introduced concept of DSG that has the potential to provide a steady background for further studies of the intersection between DG and SG. Likewise, the study can contribute to the discussion on the borders and contents of the “digital democracy” concept, particularly by revealing how far the technical construct of “e-participation” may be from real democracy.
We plan to continue this study in the future. Among our plans are: an enhancement of the study using a bigger selection of indicators, increasing the span, engaging new methods, and examining the “problematic” cases through the in-depth qualitative studies.
Author Contributions
Conceptualization, J.D. and T.J.; methodology, J.D. and T.J.; software, J.D.; validation, J.D.; formal analysis, J.D.; investigation, J.D. and T.J.; resources, J.D.; data curation, J.D.; writing—original draft preparation, J.D.; writing—review and editing, J.D. and T.J.; visualization, J.D.; supervision, J.D. and T.J.; project administration, J.D. All authors have read and agreed to the published version of the manuscript.
Funding
This research was partly supported by the project “Nowoczesne metody wspomagania procesów zarządzania w gospodarce i administracji”, number 033109, funded by the Department of Informatics in Management, Faculty of Management and Economics, Gdańsk University of Technology, Poland.
Institutional Review Board Statement
Not applicable.
Informed Consent Statement
Not applicable.
Data Availability Statement
Publicly available datasets were analyzed in this study. This data can be found here: https://publicadministration.un.org/egovkb/en-us/data-center; https://www.sgi-network.org/2020/# (accessed on 1 October 2021).
Conflicts of Interest
The authors declare no conflict of interest.
Appendix A
Table A1.
Original data used in the study (sources: EGS, SGI).
Table A1.
Original data used in the study (sources: EGS, SGI).
| Country | 2014 | 2016 | ||||||||
|---|---|---|---|---|---|---|---|---|---|---|
| EPI | OSI | POL | DEM | GOV | EPI | OSI | POL | DEM | GOV | |
| Australia | 0.94 | 0.93 | 6.13 | 7.83 | 7.60 | 0.98 | 0.98 | 5.73 | 7.58 | 7.39 |
| Austria | 0.63 | 0.75 | 6.08 | 7.38 | 6.79 | 0.88 | 0.91 | 6.16 | 7.46 | 6.86 |
| Belgium | 0.63 | 0.68 | 6.06 | 7.37 | 6.71 | 0.64 | 0.71 | 6.00 | 7.43 | 6.73 |
| Bulgaria | 0.25 | 0.24 | 5.17 | 5.80 | 5.52 | 0.69 | 0.57 | 5.17 | 5.80 | 5.44 |
| Canada | 0.82 | 0.91 | 6.06 | 7.68 | 7.17 | 0.92 | 0.96 | 6.08 | 7.63 | 7.15 |
| Chile | 0.94 | 0.82 | 5.03 | 6.67 | 5.86 | 0.75 | 0.78 | 5.15 | 6.53 | 5.89 |
| Croatia | 0.33 | 0.46 | 5.04 | 5.63 | 4.96 | 0.78 | 0.75 | 5.04 | 5.92 | 4.94 |
| Cyprus | 0.31 | 0.47 | 4.48 | 6.37 | 3.73 | 0.53 | 0.54 | 4.66 | 6.20 | 4.10 |
| Czechia | 0.25 | 0.37 | 6.00 | 7.60 | 5.93 | 0.56 | 0.48 | 6.05 | 7.15 | 6.23 |
| Denmark | 0.55 | 0.66 | 7.53 | 8.95 | 8.23 | 0.81 | 0.78 | 7.75 | 8.90 | 8.28 |
| Estonia | 0.76 | 0.77 | 7.04 | 8.33 | 6.29 | 0.81 | 0.89 | 6.93 | 8.38 | 6.17 |
| Finland | 0.71 | 0.77 | 7.46 | 9.10 | 8.57 | 0.92 | 0.94 | 7.38 | 9.15 | 8.51 |
| France | 0.96 | 1.00 | 6.05 | 6.93 | 5.84 | 0.90 | 0.94 | 6.01 | 7.01 | 5.70 |
| Germany | 0.71 | 0.67 | 7.07 | 8.64 | 7.23 | 0.76 | 0.84 | 7.18 | 8.78 | 7.07 |
| Greece | 0.80 | 0.61 | 4.00 | 6.97 | 5.13 | 0.61 | 0.58 | 4.20 | 6.93 | 4.99 |
| Hungary | 0.45 | 0.56 | 5.02 | 5.03 | 5.32 | 0.49 | 0.63 | 5.18 | 4.11 | 4.90 |
| Iceland | 0.49 | 0.61 | 6.53 | 7.57 | 6.99 | 0.66 | 0.62 | 6.27 | 7.19 | 6.98 |
| Ireland | 0.65 | 0.68 | 5.92 | 8.34 | 6.68 | 0.71 | 0.72 | 6.37 | 8.15 | 6.89 |
| Israel | 0.86 | 0.87 | 5.55 | 6.91 | 6.72 | 0.83 | 0.86 | 5.40 | 6.70 | 6.63 |
| Italy | 0.78 | 0.75 | 4.91 | 6.84 | 5.83 | 0.92 | 0.87 | 5.30 | 7.23 | 6.20 |
| Japan | 0.96 | 0.94 | 5.76 | 6.14 | 6.05 | 0.98 | 0.88 | 5.75 | 5.89 | 6.24 |
| Latvia | 0.71 | 0.70 | 6.02 | 8.07 | 6.39 | 0.53 | 0.61 | 6.09 | 7.90 | 6.30 |
| Lithuania | 0.65 | 0.76 | 6.47 | 8.12 | 6.88 | 0.83 | 0.83 | 6.51 | 8.12 | 6.87 |
| Luxembourg | 0.55 | 0.62 | 6.62 | 7.77 | 7.41 | 0.69 | 0.72 | 6.80 | 7.83 | 7.39 |
| Malta | 0.47 | 0.40 | 5.14 | 5.32 | 5.62 | 0.78 | 0.80 | 5.29 | 5.52 | 5.89 |
| Mexico | 0.61 | 0.66 | 4.73 | 5.91 | 6.28 | 0.88 | 0.85 | 4.58 | 5.83 | 6.05 |
| Netherlands | 1.00 | 0.93 | 6.74 | 7.70 | 6.67 | 0.95 | 0.93 | 6.68 | 7.52 | 6.51 |
| New Zealand | 0.78 | 0.84 | 6.57 | 8.59 | 7.77 | 0.95 | 0.94 | 6.57 | 8.48 | 7.87 |
| Norway | 0.69 | 0.76 | 7.78 | 9.08 | 8.55 | 0.76 | 0.80 | 7.68 | 8.99 | 8.54 |
| Poland | 0.49 | 0.54 | 5.66 | 8.37 | 7.31 | 0.88 | 0.70 | 5.72 | 8.37 | 7.35 |
| Portugal | 0.65 | 0.64 | 5.11 | 7.51 | 5.39 | 0.66 | 0.75 | 5.35 | 7.35 | 5.25 |
| Romania | 0.47 | 0.44 | 5.03 | 5.20 | 4.70 | 0.63 | 0.46 | 5.08 | 5.10 | 4.72 |
| Slovakia | 0.63 | 0.49 | 5.39 | 7.05 | 5.87 | 0.54 | 0.44 | 5.38 | 6.95 | 5.63 |
| Slovenia | 0.39 | 0.43 | 5.74 | 7.45 | 5.72 | 0.73 | 0.85 | 5.92 | 7.55 | 5.79 |
| South Korea | 1.00 | 0.98 | 5.86 | 5.63 | 6.24 | 0.97 | 0.94 | 5.83 | 5.55 | 5.89 |
| Spain | 0.78 | 0.94 | 5.10 | 6.95 | 6.48 | 0.93 | 0.91 | 5.51 | 6.84 | 6.50 |
| Sweden | 0.61 | 0.70 | 7.87 | 9.25 | 8.51 | 0.76 | 0.88 | 7.92 | 9.19 | 8.49 |
| Switzerland | 0.37 | 0.50 | 7.48 | 8.70 | 7.00 | 0.58 | 0.60 | 7.47 | 8.61 | 7.00 |
| Turkey | 0.49 | 0.56 | 4.63 | 4.74 | 5.74 | 0.63 | 0.60 | 4.75 | 4.23 | 5.53 |
| United Kingdom | 0.96 | 0.90 | 6.67 | 7.34 | 7.18 | 1.00 | 1.00 | 6.83 | 7.37 | 7.46 |
| United States | 0.92 | 0.94 | 5.31 | 8.37 | 7.36 | 0.90 | 0.93 | 5.51 | 8.07 | 7.39 |
| Country | 2018 | 2020 | ||||||||
| EPI | OSI | POL | DEM | GOV | EPI | OSI | POL | DEM | GOV | |
| Australia | 0.98 | 0.97 | 5.77 | 7.58 | 7.37 | 0.96 | 0.95 | 5.92 | 7.22 | 7.14 |
| Austria | 0.83 | 0.87 | 6.27 | 7.36 | 6.89 | 0.98 | 0.95 | 6.20 | 7.36 | 6.73 |
| Belgium | 0.76 | 0.76 | 6.10 | 7.27 | 6.64 | 0.65 | 0.66 | 6.13 | 7.27 | 6.51 |
| Bulgaria | 0.87 | 0.76 | 5.41 | 5.73 | 5.47 | 0.89 | 0.77 | 5.36 | 5.45 | 5.36 |
| Canada | 0.91 | 0.93 | 6.65 | 7.82 | 7.36 | 0.94 | 0.84 | 6.62 | 7.95 | 7.46 |
| Chile | 0.82 | 0.83 | 5.31 | 6.71 | 5.91 | 0.86 | 0.85 | 5.34 | 6.54 | 5.88 |
| Croatia | 0.77 | 0.68 | 5.30 | 5.78 | 4.79 | 0.89 | 0.75 | 5.40 | 5.71 | 4.82 |
| Cyprus | 0.82 | 0.78 | 4.87 | 6.20 | 4.58 | 0.95 | 0.87 | 4.88 | 5.97 | 4.60 |
| Czechia | 0.62 | 0.65 | 6.27 | 7.31 | 6.29 | 0.73 | 0.72 | 6.13 | 7.27 | 6.32 |
| Denmark | 1.00 | 1.00 | 7.72 | 8.85 | 8.32 | 0.96 | 0.97 | 7.92 | 8.90 | 8.35 |
| Estonia | 0.91 | 0.90 | 7.04 | 8.48 | 6.34 | 1.00 | 0.99 | 7.08 | 8.64 | 7.15 |
| Finland | 1.00 | 0.97 | 7.47 | 9.15 | 8.35 | 0.95 | 0.97 | 7.42 | 9.15 | 8.49 |
| France | 0.97 | 0.98 | 6.44 | 7.14 | 6.51 | 0.90 | 0.88 | 6.83 | 7.19 | 6.61 |
| Germany | 0.92 | 0.93 | 7.36 | 8.70 | 7.22 | 0.75 | 0.74 | 7.09 | 8.70 | 7.47 |
| Greece | 0.88 | 0.82 | 4.47 | 6.76 | 5.55 | 0.79 | 0.71 | 4.66 | 7.04 | 5.64 |
| Hungary | 0.71 | 0.74 | 5.27 | 3.50 | 4.95 | 0.68 | 0.75 | 5.32 | 3.37 | 4.54 |
| Iceland | 0.69 | 0.73 | 6.39 | 6.80 | 7.01 | 0.77 | 0.79 | 6.43 | 6.53 | 6.83 |
| Ireland | 0.93 | 0.83 | 6.53 | 8.27 | 6.84 | 0.86 | 0.77 | 6.59 | 8.21 | 6.96 |
| Israel | 0.83 | 0.83 | 5.52 | 6.43 | 6.58 | 0.71 | 0.75 | 5.50 | 6.37 | 6.38 |
| Italy | 0.96 | 0.95 | 5.65 | 7.30 | 6.25 | 0.82 | 0.83 | 5.38 | 6.90 | 5.53 |
| Japan | 0.98 | 0.95 | 5.82 | 5.80 | 6.17 | 0.99 | 0.91 | 6.09 | 5.67 | 6.38 |
| Latvia | 0.69 | 0.67 | 6.23 | 7.87 | 6.38 | 0.58 | 0.58 | 6.32 | 7.87 | 6.42 |
| Lithuania | 0.80 | 0.80 | 6.57 | 8.12 | 6.80 | 0.74 | 0.85 | 6.63 | 8.12 | 6.99 |
| Luxembourg | 0.94 | 0.92 | 7.05 | 7.83 | 7.40 | 0.70 | 0.76 | 7.33 | 7.62 | 7.23 |
| Malta | 0.85 | 0.84 | 5.71 | 5.74 | 6.07 | 0.83 | 0.81 | 5.84 | 5.79 | 6.15 |
| Mexico | 0.94 | 0.92 | 4.64 | 4.67 | 5.58 | 0.82 | 0.82 | 4.66 | 5.11 | 5.70 |
| Netherlands | 0.99 | 0.93 | 6.79 | 7.30 | 6.71 | 0.96 | 0.91 | 6.86 | 7.07 | 6.45 |
| New Zealand | 0.98 | 0.95 | 6.63 | 8.43 | 7.87 | 0.99 | 0.93 | 6.66 | 8.29 | 7.63 |
| Norway | 0.98 | 0.95 | 7.73 | 8.99 | 8.43 | 0.90 | 0.88 | 7.83 | 8.99 | 8.47 |
| Poland | 0.89 | 0.93 | 5.36 | 5.29 | 5.71 | 0.96 | 0.86 | 5.39 | 4.83 | 5.50 |
| Portugal | 0.90 | 0.93 | 5.71 | 7.49 | 5.44 | 0.82 | 0.84 | 5.99 | 7.59 | 5.98 |
| Romania | 0.71 | 0.66 | 5.16 | 5.10 | 4.65 | 0.81 | 0.72 | 5.17 | 4.85 | 4.51 |
| Slovakia | 0.81 | 0.74 | 5.50 | 6.79 | 5.61 | 0.70 | 0.72 | 5.51 | 6.48 | 5.22 |
| Slovenia | 0.81 | 0.80 | 6.26 | 7.46 | 5.80 | 0.86 | 0.85 | 6.40 | 7.30 | 6.01 |
| South Korea | 1.00 | 0.98 | 5.83 | 6.22 | 6.27 | 1.00 | 1.00 | 5.81 | 6.76 | 6.28 |
| Spain | 0.98 | 0.94 | 5.81 | 7.11 | 6.40 | 0.85 | 0.89 | 6.27 | 7.28 | 6.58 |
| Sweden | 0.94 | 0.94 | 8.05 | 9.19 | 8.55 | 0.82 | 0.90 | 8.01 | 9.29 | 8.63 |
| Switzerland | 0.84 | 0.85 | 7.56 | 8.68 | 7.06 | 0.90 | 0.83 | 7.57 | 8.68 | 7.31 |
| Turkey | 0.86 | 0.89 | 4.63 | 2.96 | 4.86 | 0.89 | 0.86 | 4.46 | 2.85 | 4.25 |
| United Kingdom | 0.98 | 0.98 | 6.83 | 7.46 | 7.33 | 0.98 | 0.96 | 7.02 | 7.26 | 7.22 |
| United States | 0.98 | 0.99 | 4.91 | 7.41 | 6.53 | 1.00 | 0.95 | 4.79 | 7.00 | 6.16 |
Appendix B
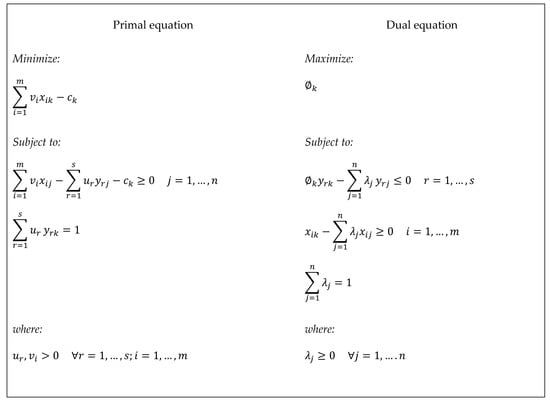
Figure A1.
BCC VRS output-oriented model.
Figure A1.
BCC VRS output-oriented model.

References
- Paoli, A.D. Challenging Conceptual and Empirical Definition of e-Government toward Effective e-Governance. Int. J. Soc. Sci. Humanit. 2015, 5, 186–194. [Google Scholar] [CrossRef]
- OECD. The E-Government Imperative; OECD: Paris, France, 2003. [Google Scholar]
- Hu, G.; Pan, W.; Lu, M.; Wang, J. The widely shared definition of E-Government. Electron. Libr. 2009, 27, 968–985. [Google Scholar] [CrossRef] [Green Version]
- Wirtz, B.W.; Daiser, P. E-Government: Strategy Process Instruments. In Textbook for the Digital Society, 2nd ed.; The Deutsche Nationalbiblio: Speyer, Germany, 2017; ISBN 978-3-947353-00-2. [Google Scholar]
- Bryant, C. Government versus Governance: Structure versus process. EchoGéo 2018. [Google Scholar] [CrossRef]
- United Nations. UN Global E-government Survey 2003; United Nation: New York, NY, USA, 2003. [Google Scholar]
- Suhardi, S.; Sofia, A.; Andriyanto, A. Evaluating e-Government and Good Governance Correlation. J. ICT Res. Appl. 2015, 9, 236–262. [Google Scholar] [CrossRef] [Green Version]
- Kettani, D.; Moulin, B. Evaluation of Outcomes/Impacts on Good Governance. In E-Government for Good Governance in Developing Countries: Empirical Evidence from the eFez Project; Anthem Press: London, UK; New York, NY, USA, 2014; p. 298. ISBN 978-0-85728-125-8. [Google Scholar]
- Panagiotopoulos, P.; Klievink, B.; Cordella, A. Public value creation in digital government. Gov. Inf. Q. 2019, 36, 101421. [Google Scholar] [CrossRef]
- Bannister, F.; Connolly, R. ICT, public values and transformative government: A framework and programme for research. Gov. Inf. Q. 2014, 31, 119–128. [Google Scholar] [CrossRef]
- Xia, S. E-Governance and Political Modernization: An Empirical Study Based on Asia from 2003 to 2014. Adm. Sci. 2017, 7, 25. [Google Scholar] [CrossRef] [Green Version]
- Wallis, J.; Zhao, F. e-Government Development and Government Effectiveness: A Reciprocal Relationship. Int. J. Public Adm. 2017, 41, 479–491. [Google Scholar] [CrossRef]
- Gallo, C.; Giove, M.; Millard, J.; Thaarup, R. Study on eGovernment and the Reduction of Administrative Burden; European Union: Brussels, Belgium, 2014; ISBN 9789279358821. [Google Scholar]
- Basyal, D.K.; Basyal, D.K.; Poudyal, N.; Poudyal, N.; Seo, J.-W.; Seo, J.-W. Does E-government reduce corruption? Evidence from a heterogeneous panel data model. Transform. Gov. People Process. Policy 2018, 12, 134–154. [Google Scholar] [CrossRef]
- Lupu, D.; Lazăr, C.G. Influence of e-government on the Level of Corruption in some EU and Non-EU States. Procedia Econ. Financ. 2015, 20, 365–371. [Google Scholar] [CrossRef] [Green Version]
- Meeks, B.N. Better democracy through technology. Commun. ACM 1997, 40, 75–78. [Google Scholar] [CrossRef]
- Maerz, S.F. The electronic face of authoritarianism: E-government as a tool for gaining legitimacy in competitive and non-competitive regimes. Gov. Inf. Q. 2016, 33, 727–735. [Google Scholar] [CrossRef]
- Stier, S. Political determinants of e-government performance revisited: Comparing democracies and autocracies. Gov. Inf. Q. 2015, 32, 270–278. [Google Scholar] [CrossRef]
- Spirakis, G.; Spiraki, C.; Nikolopoulos, K. The impact of electronic government on democracy: E-democracy through e-participation. Electron. Gov. Int. J. 2010, 7, 75. [Google Scholar] [CrossRef]
- European Commission. The European eGovernment Action Plan 2011–2015: Harnessing ICT to Promote Smart, Sustainable & Innovative Government; World Conservation Union: Gland, Switzerland, 2010. [Google Scholar]
- United Nations. E-Government Survey 2020: Digital Government in the Decade of Action for Sustainable Development; United Nations: New York, NY, USA, 2020. [Google Scholar]
- United Nations. E-Government Survey 2018: Gearing E-Government to Support Transformation towards Sustainable and Resilient Societies; United Nations: New York, NY, USA, 2018. [Google Scholar]
- United Nations. E-Government Survey 2016: E-Government in Support of Sustainable Development; United Nations: New York, NY, USA, 2016. [Google Scholar]
- OECD. Recommendation of the Council on Digital Government Strategies. In Public Governance and Territorial Development Directorate; OECD: Paris, France, 2014. [Google Scholar]
- Estevez, E.; Janowski, T. Electronic Governance for Sustainable Development—Conceptual framework and state of research. Gov. Inf. Q. 2013, 30, S94–S109. [Google Scholar] [CrossRef]
- Janowski, T. Implementing Sustainable Development Goals with Digital Government—Aspiration-capacity gap. Gov. Inf. Q. 2016, 33, 603–613. [Google Scholar] [CrossRef]
- Marcovecchio, I.; Thinyane, M.; Estevez, E.; Janowski, T. Digital Government as Implementation Means for Sustainable Development Goals. Int. J. Public Adm. Digit. Age 2019, 6, 1–22. [Google Scholar] [CrossRef] [Green Version]
- Othman, M.H.; Razali, R.; Nasrudin, M.F. Key factors for e-government towards sustainable development goals. Int. J. Adv. Sci. Technol. 2020, 29, 2864–2876. [Google Scholar]
- Joshi, P.R.; Islam, S. E-Government Maturity Model for Sustainable E-Government Services from the Perspective of Developing Countries. Sustainability 2018, 10, 1882. [Google Scholar] [CrossRef] [Green Version]
- Lopatkova, Y.; Agbozo, E.; Belyaeva, Z. Exploring the Relationship between E-Government and Sustainable Development. In Proceedings of the XIV International Conference “Russian Regions in the Focus of Changes”, Yekaterinburg, Russian, 18–20 November 2019. [Google Scholar]
- Lim, J. E-Government for Sustainable Development in SIDS; UNPOG: Yeonsu-gu, Korea, 2014. [Google Scholar]
- Lee, Y.B. Exploring the Relationship between E-Government Development and Environmental Sustainability: A Study of Small Island Developing States. Sustainability 2017, 9, 732. [Google Scholar] [CrossRef] [Green Version]
- Durkiewicz, J.; Janowski, T. Towards Synthetic and Balanced Digital Government Benchmarking. In Proceedings of the 53rd Hawaii International Conference on System Sciences, Wailea, HI, USA, 7–10 January 2020; pp. 2123–2132. [Google Scholar]
- Abu-Shanab, E.; Al-Quraan, H. Factors Influencing Electronic Government Social Sustainability. Int. J. Inf. Commun. Technol. Hum. Dev. 2015, 7, 42–56. [Google Scholar] [CrossRef]
- Kroll, C. Sustainable Development Goals: Are the Rich Countries Ready? United Nations: New York, NY, USA, 2017. [Google Scholar]
- Fukuyama, F. Governance: What Do We Know, and How Do We Know It? Annu. Rev. Politi-Sci. 2016, 19, 89–105. [Google Scholar] [CrossRef]
- Welch, D. What is “governance”, anyway? Can. Foreign Policy J. 2013, 19, 253–267. [Google Scholar] [CrossRef]
- Kaufmann, D.; Kraay, A.; Mastruzzi, M. The Worldwide Governance Indicators: Methodology and Analytical Issues; The World Bank: Washington, DC, USA, 2010. [Google Scholar] [CrossRef]
- UNESCAP. What Is Good Governance? UNESCAP: Bangkok, Thailand, 2009. [Google Scholar]
- Gisselquist, R.M. What Does Good Governance Mean? Available online: https://www.wider.unu.edu/publication/what-does-good-governance-mean (accessed on 10 May 2018).
- Iftimoaei, C. Good Governance: Normative vs. Descriptive Dimension. SEA Pract. Appl. Sci. 2015, 3, 309–316. [Google Scholar]
- Sharma, A.K. Governance: The Concept and Its Dimensions. Indian J. Public Adm. 2018, 64, 1–14. [Google Scholar] [CrossRef] [Green Version]
- World Bank. Worldwide Governance Indicators. Available online: https://info.worldbank.org/governance/wgi/ (accessed on 23 October 2021).
- United Nations. Sustainable Development Goals. Available online: https://www.undp.org/sustainable-development-goals?utm_source=EN&utm_medium=GSR&utm_content=US_UNDP_PaidSearch_Brand_English&utm_campaign=CENTRAL&c_src=CENTRAL&c_src2=GSR&gclid=EAIaIQobChMI25vy74zk8wIVlaiyCh0Q0Q8YEAAYAiAAEgJxp_D_BwE (accessed on 25 October 2021).
- OECD. Sustainable Development Goals and Public Governance. Available online: https://www.oecd.org/fr/gov/sustainable-development-goals-and-public-governance.htm (accessed on 27 September 2021).
- Bosselmann, K.; Engel, R.; Taylor, P. Governance for Sustainability: Issues, Challenges, Successes; IUCN: Gland, Switzerland, 2008; ISBN 9782831711058. [Google Scholar]
- Stojanovic, I.; Ateljević, J.; Stević, R.S. Good Governance as a Tool of Sustainable Development. Eur. J. Sustain. Dev. 2016, 5, 558–573. [Google Scholar] [CrossRef]
- Kardos, M. The Reflection of Good Governance in Sustainable Development Strategies. Procedia Soc. Behav. Sci. 2012, 58, 1166–1173. [Google Scholar] [CrossRef] [Green Version]
- Bertelsmann Stiftung. SGI 2020 Sustainable Governance Indicators. Available online: https://www.sgi-network.org/2020/ (accessed on 14 October 2021).
- Janowski, T. Digital government evolution: From transformation to contextualization. Gov. Inf. Q. 2015, 32, 221–236. [Google Scholar] [CrossRef]
- United Nations. E-Government Knowledgebase. Available online: https://publicadministration.un.org/egovkb/en-us/ (accessed on 14 October 2021).
- Schraad-Tischler, D.; Seelkopf, L. Concept and Methodology—Sustainable Governance Indicators; Bertelsmann Stiftung: Gütersloh, Germany, 2015. [Google Scholar]
- Bertelsmann Stiftung. SGI Codebook: Sustainable Governance Indicators 2020; Bertelsmann Stiftung: Gütersloh, Germany, 2020. [Google Scholar]
- Durkiewicz, J.; Janowski, T. Chain Action—How Do Countries Add Value Through Digital Government ? In Proceedings of the 54th Hawaii International Conference on System Sciences, Maui, HI, USA, 5–8 January 2021; pp. 2327–2336. [Google Scholar]
- Dutta, S.; Lanvin, B. The Network Readiness Index 2020: Accelerating Digital Transformation in a Post-COVID Global Economy; Portulans Institute: Washington, DC, USA, 2020. [Google Scholar]
- Cooper, W.W.; Seiford, L.M.; Zhu, J. Data envelopment analysis: History, models, and interpretations. In International Series in Operations Research and Management Science; Springer: Berlin/Heidelberg, Germany, 2011; Volume 164, pp. 1–39. ISBN 9781441961518. [Google Scholar]
- Charnes, A.; Cooper, W.W.; Rhodes, E. Measuring the efficiency of decision making untis. Eur. J. Oper. Res. 1978, 2, 429–444. [Google Scholar] [CrossRef]
- Joint Research Center-European Comission. Handbook on Constructing Composite Indicators: Methodology and User Guide; Organisation for Economic Co-operation and Development: Paris, France, 2008; ISBN 978-92-64-04345-9. [Google Scholar]
- Jablonsky, J. Re-Calculation of Happy Planet Index Using DEA Models. Mult. Criteria Decis. Mak. 2013, 8, 56–66. [Google Scholar]
- Osman, I.H.; Zablith, F. Re-evaluating electronic government development index to monitor the transformation toward achieving sustainable development goals. J. Bus. Res. 2020, 131, 426–440. [Google Scholar] [CrossRef]
- Huguenin, J.-M. Data Envelopment Analysis (DEA): A Pedagogical Guide for Decision Makers in the Public Sector; Institut de Hautes Études en Administration Publique: Lausanne, Switzerland, 2012; Volume 41. [Google Scholar]
- Virtos, H. Open Source DEA. Available online: https://opensourcedea.org/ (accessed on 7 October 2021).
- Bertelsmann Stiftung. SGI|Japan|Quality of Democracy. Available online: https://www.sgi-network.org/2020/Japan/Quality_of_Democracy (accessed on 26 October 2021).
- Kasuya, Y.; Kobayashi, G.; Shimizu, J. Is Japan’s Democracy in Retreat? Democr. Br. 2021. Available online: https://v-dem-eastasia.net/news/democracy-brief-2021_2-in-english/ (accessed on 1 October 2021).
- Bertelsmann Stiftung. SGI 2020|United States. Available online: https://www.sgi-network.org/2020/United_States (accessed on 26 October 2021).
- Freedom House. New Report: The Global Decline in Democracy Has Accelerated. Available online: https://freedomhouse.org/article/new-report-global-decline-democracy-has-accelerated (accessed on 27 October 2021).
- Simon, J.; Bass, T.; Boelman, V.; Mulgan, G. NESTA Digital Democracy: The Tools Transforming Political Engagement; NESTA: London, UK, 2017. [Google Scholar]
- Furtak, F.T. Democracy Under Pressure: The Case of Poland, Hungary and Turkey. J. Civ. Leg. Sci. 2017, 6, e119. [Google Scholar] [CrossRef] [Green Version]
- Jadi, Y.; Jie, L. An Efficiency Measurement of E-Government for United Nation Ranking Index. Int. J. Humanit. Soc. Sci. 2017, 11, 279–282. [Google Scholar]
- Morozov, E.; Bria, F. Rethinking the Smart City—Democratizing Urban Technology; Rosa Luxemburg Foundation: Berlin, Germany, 2018. [Google Scholar]
- Zuboff, S. The Age of Surveillance Capitalism: The Fight for a Human Future at the New Frontier of Power; Profile Books: London, UK, 2019; ISBN 9781781256855. [Google Scholar]
- Fumagalli, A.; Lucarelli, S.; Musolino, E.; Rocchi, G. Digital Labour in the Platform Economy: The Case of Facebook. Sustainability 2018, 10, 1757. [Google Scholar] [CrossRef] [Green Version]
- Åström, J.; Karlsson, M.; Linde, J.; Pirannejad, A. Understanding the rise of e-participation in non-democracies: Domestic and international factors. Gov. Inf. Q. 2012, 29, 142–150. [Google Scholar] [CrossRef]
- Grönlund, Å. Connecting eGovernment to Real Government—The Failure of the UN eParticipation Index. In International Conference on Electronic Government; Springer: Berlin/Heidelberg, Germany, 2011; pp. 26–37. [Google Scholar] [CrossRef] [Green Version]
- Pirannejad, A.; Janssen, M.; Rezaei, J. Towards a balanced E-Participation Index: Integrating government and society perspectives. Gov. Inf. Q. 2019, 36, 101404. [Google Scholar] [CrossRef]
Publisher’s Note: MDPI stays neutral with regard to jurisdictional claims in published maps and institutional affiliations. |
© 2021 by the authors. Licensee MDPI, Basel, Switzerland. This article is an open access article distributed under the terms and conditions of the Creative Commons Attribution (CC BY) license (https://creativecommons.org/licenses/by/4.0/).