
Application of a Novel Hybrid f-SC Risk Analysis Method in the Paint Industry


Abstract
:1. Introduction
- ➢
- There are a few studies in the literature using AHP for the weighting of the P, E, and S criteria for Fine–Kinney risk analysis in OHS, as opposed to other analysis methods such as FTA, FMEA, and HAZOP. We suggest the SWARA method for the criteria weighting process because of some of its advantages. SWARA requires considerably lower pairwise comparisons compared to AHP for the same number of criteria. Thus, SWARA is simpler than AHP [7,8].
- ➢
- As the number of criteria used in the AHP method increases, the number of comparisons significantly increases. This has a negative impact on comparisons. SWARA is not similar in this regard.
- ➢
- ➢
- ➢
- ➢
- The COPRAS method shows the degree of the benefit of the alternatives. By comparing the alternatives with each other, we can reveal how good or how bad it is compared to the other alternatives, and this helps to rank all of the alternatives [12].
- ➢
- The COPRAS method provides an opportunity to evaluate both the qualitative and quantitative criteria [12].
2. Research Methodologies
2.1. Classical Fine–Kinney Risk Analysis Method
2.2. Fuzzy Set Theory
2.3. SWARA Method
2.4. COPRAS Method
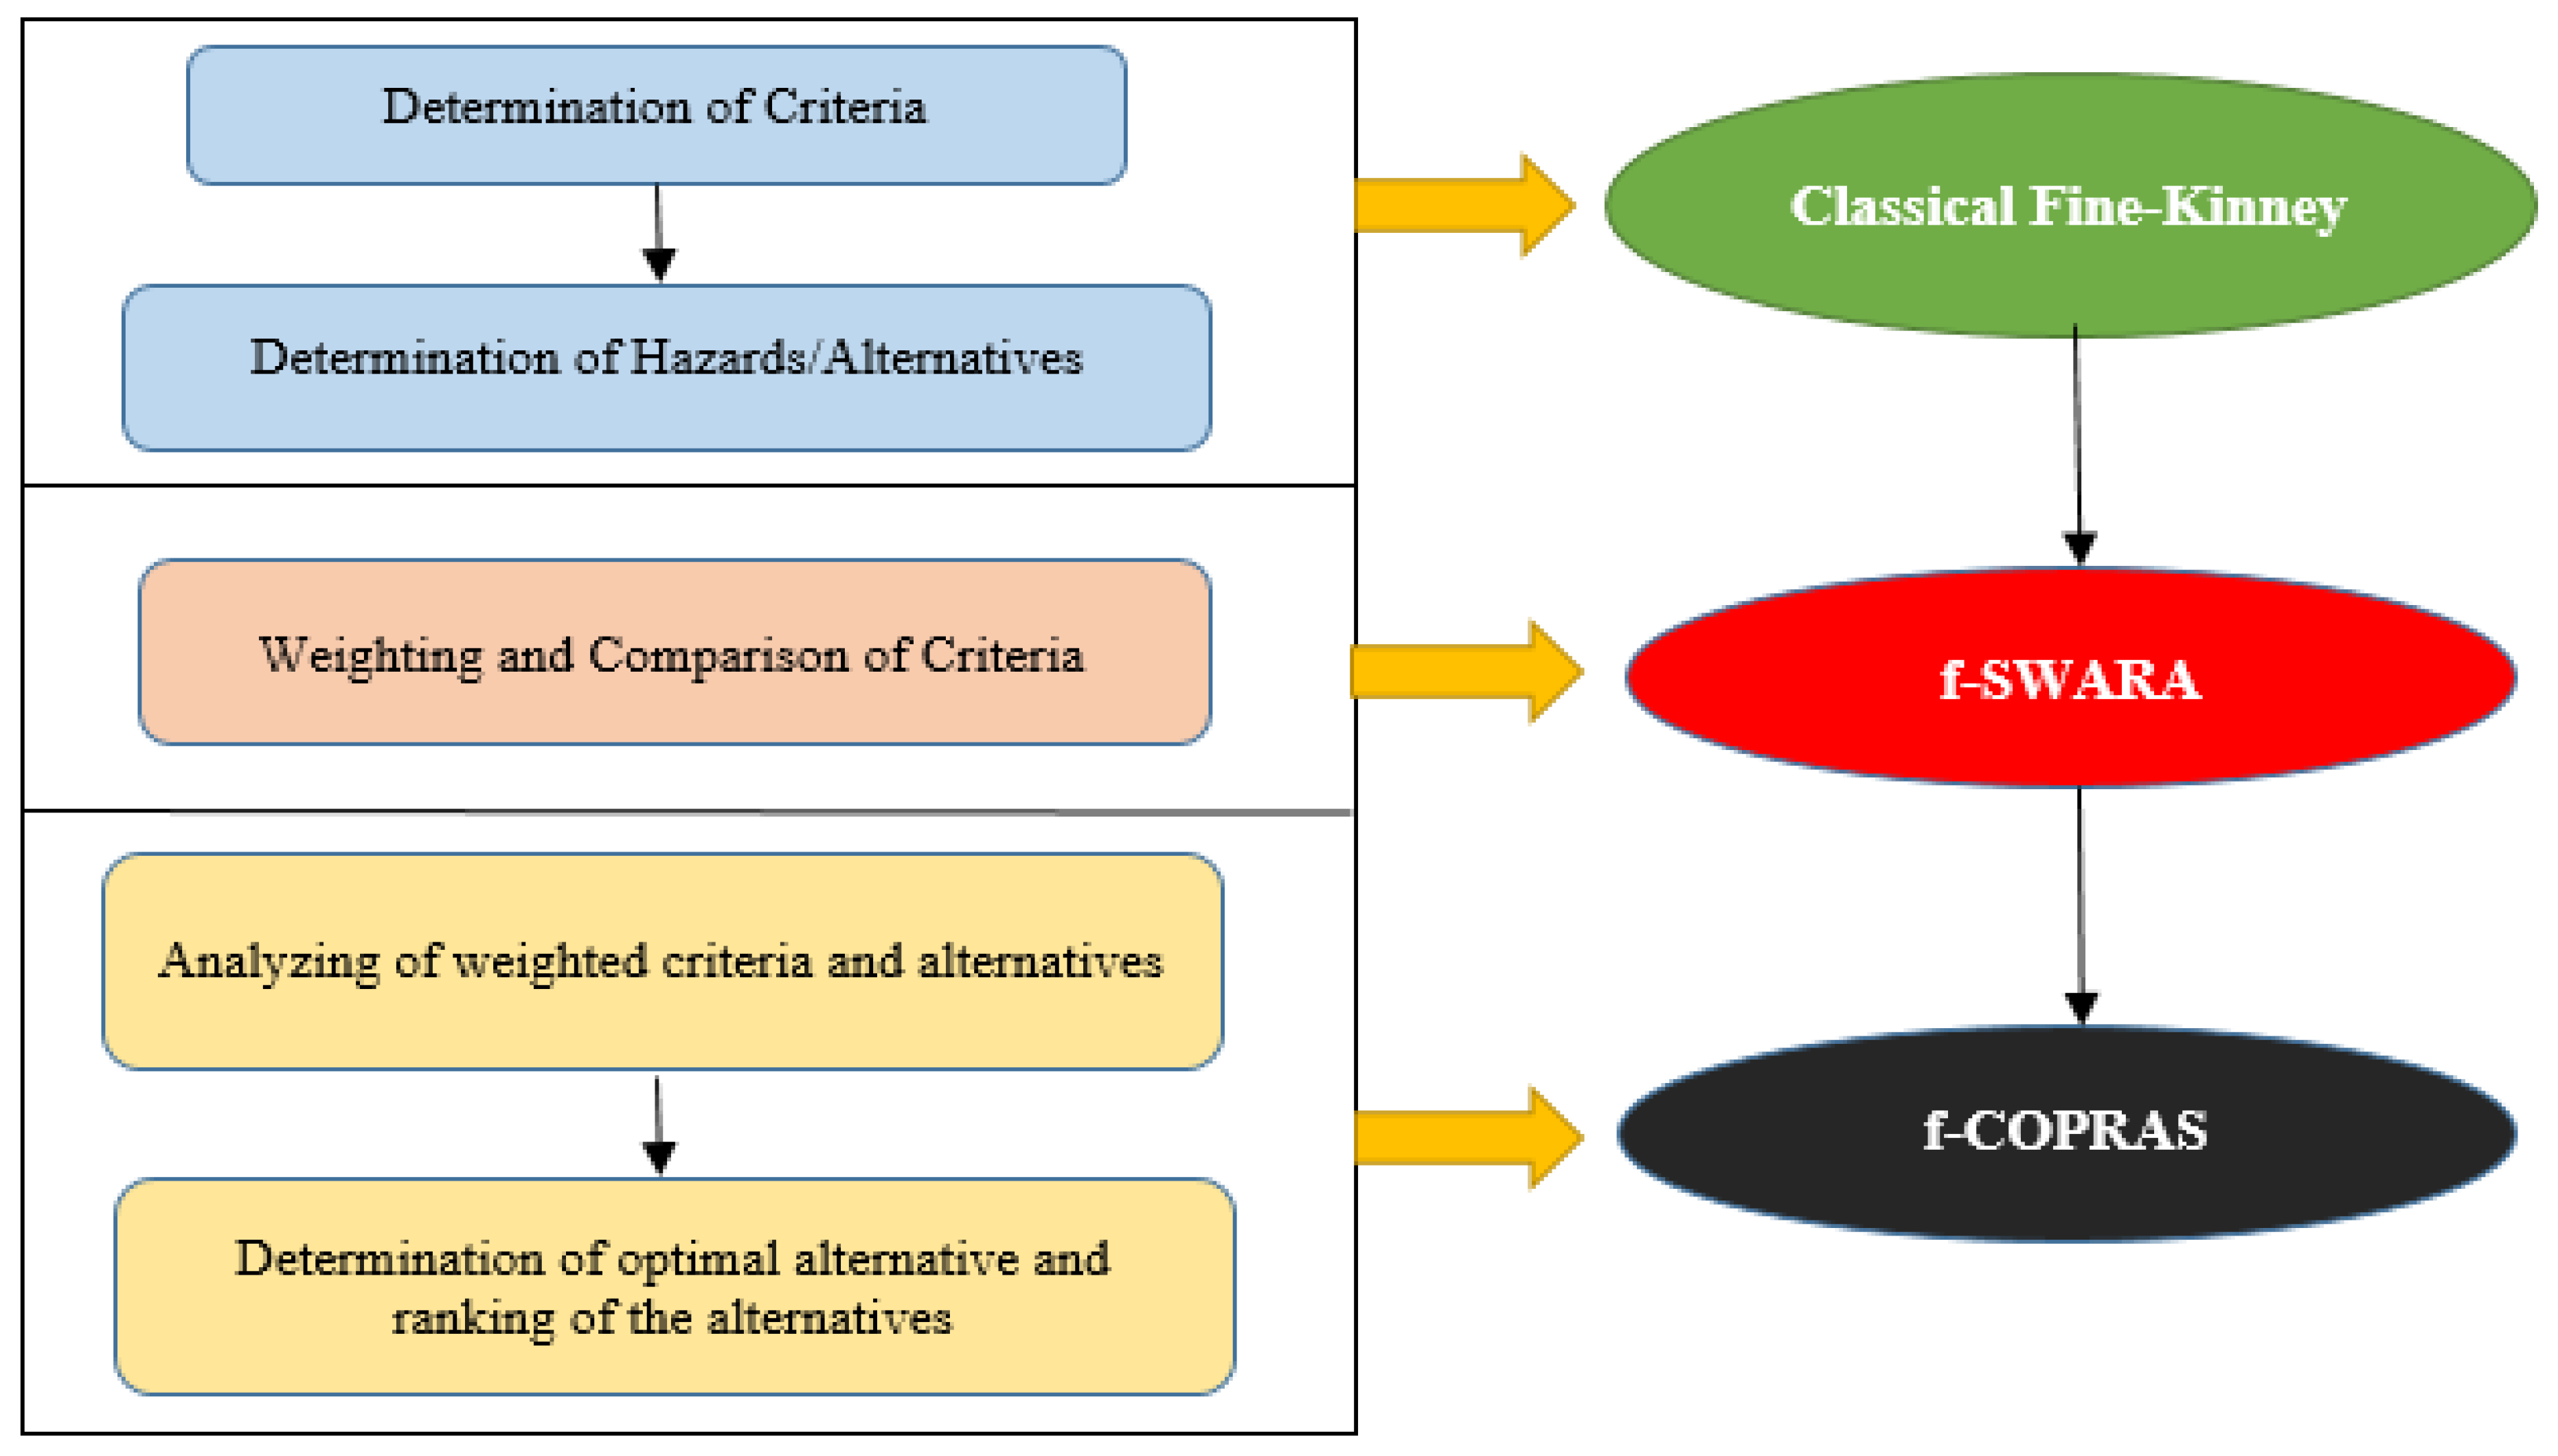
2.5. A Novel Hybrid f-SC Risk Analysis Method
3. A Case Study for the f-SC Method in the Paint Industry
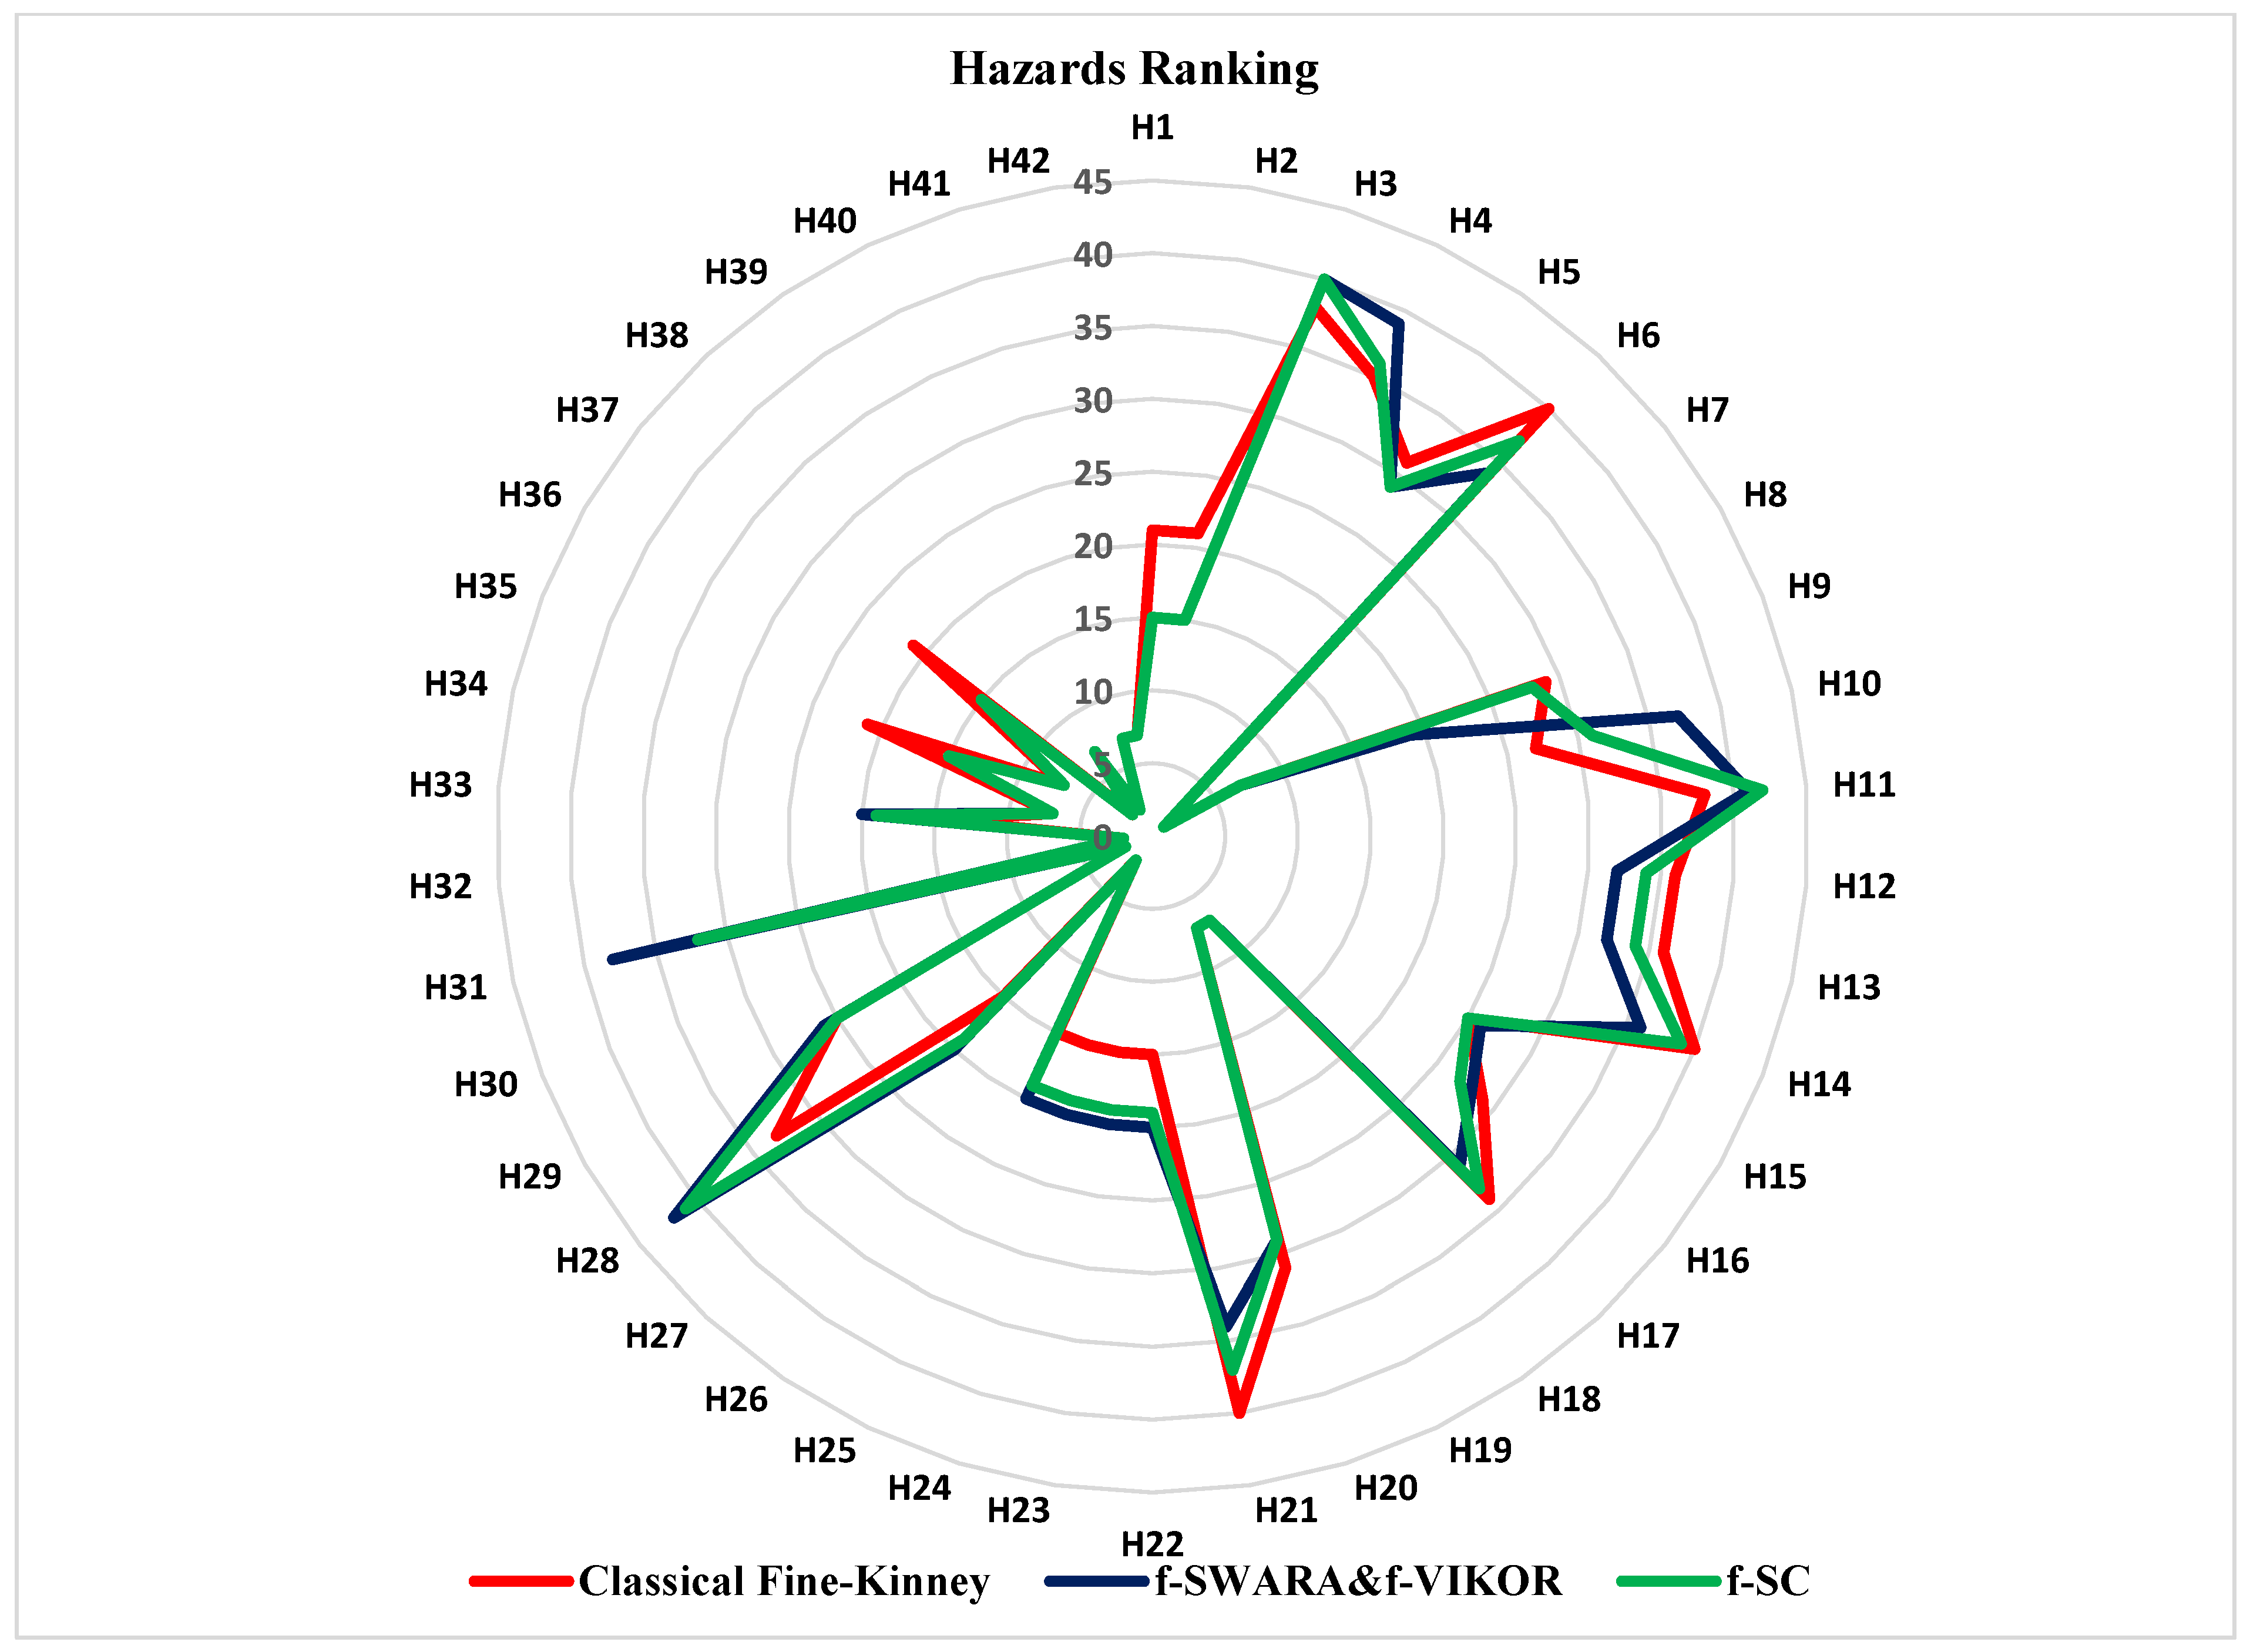
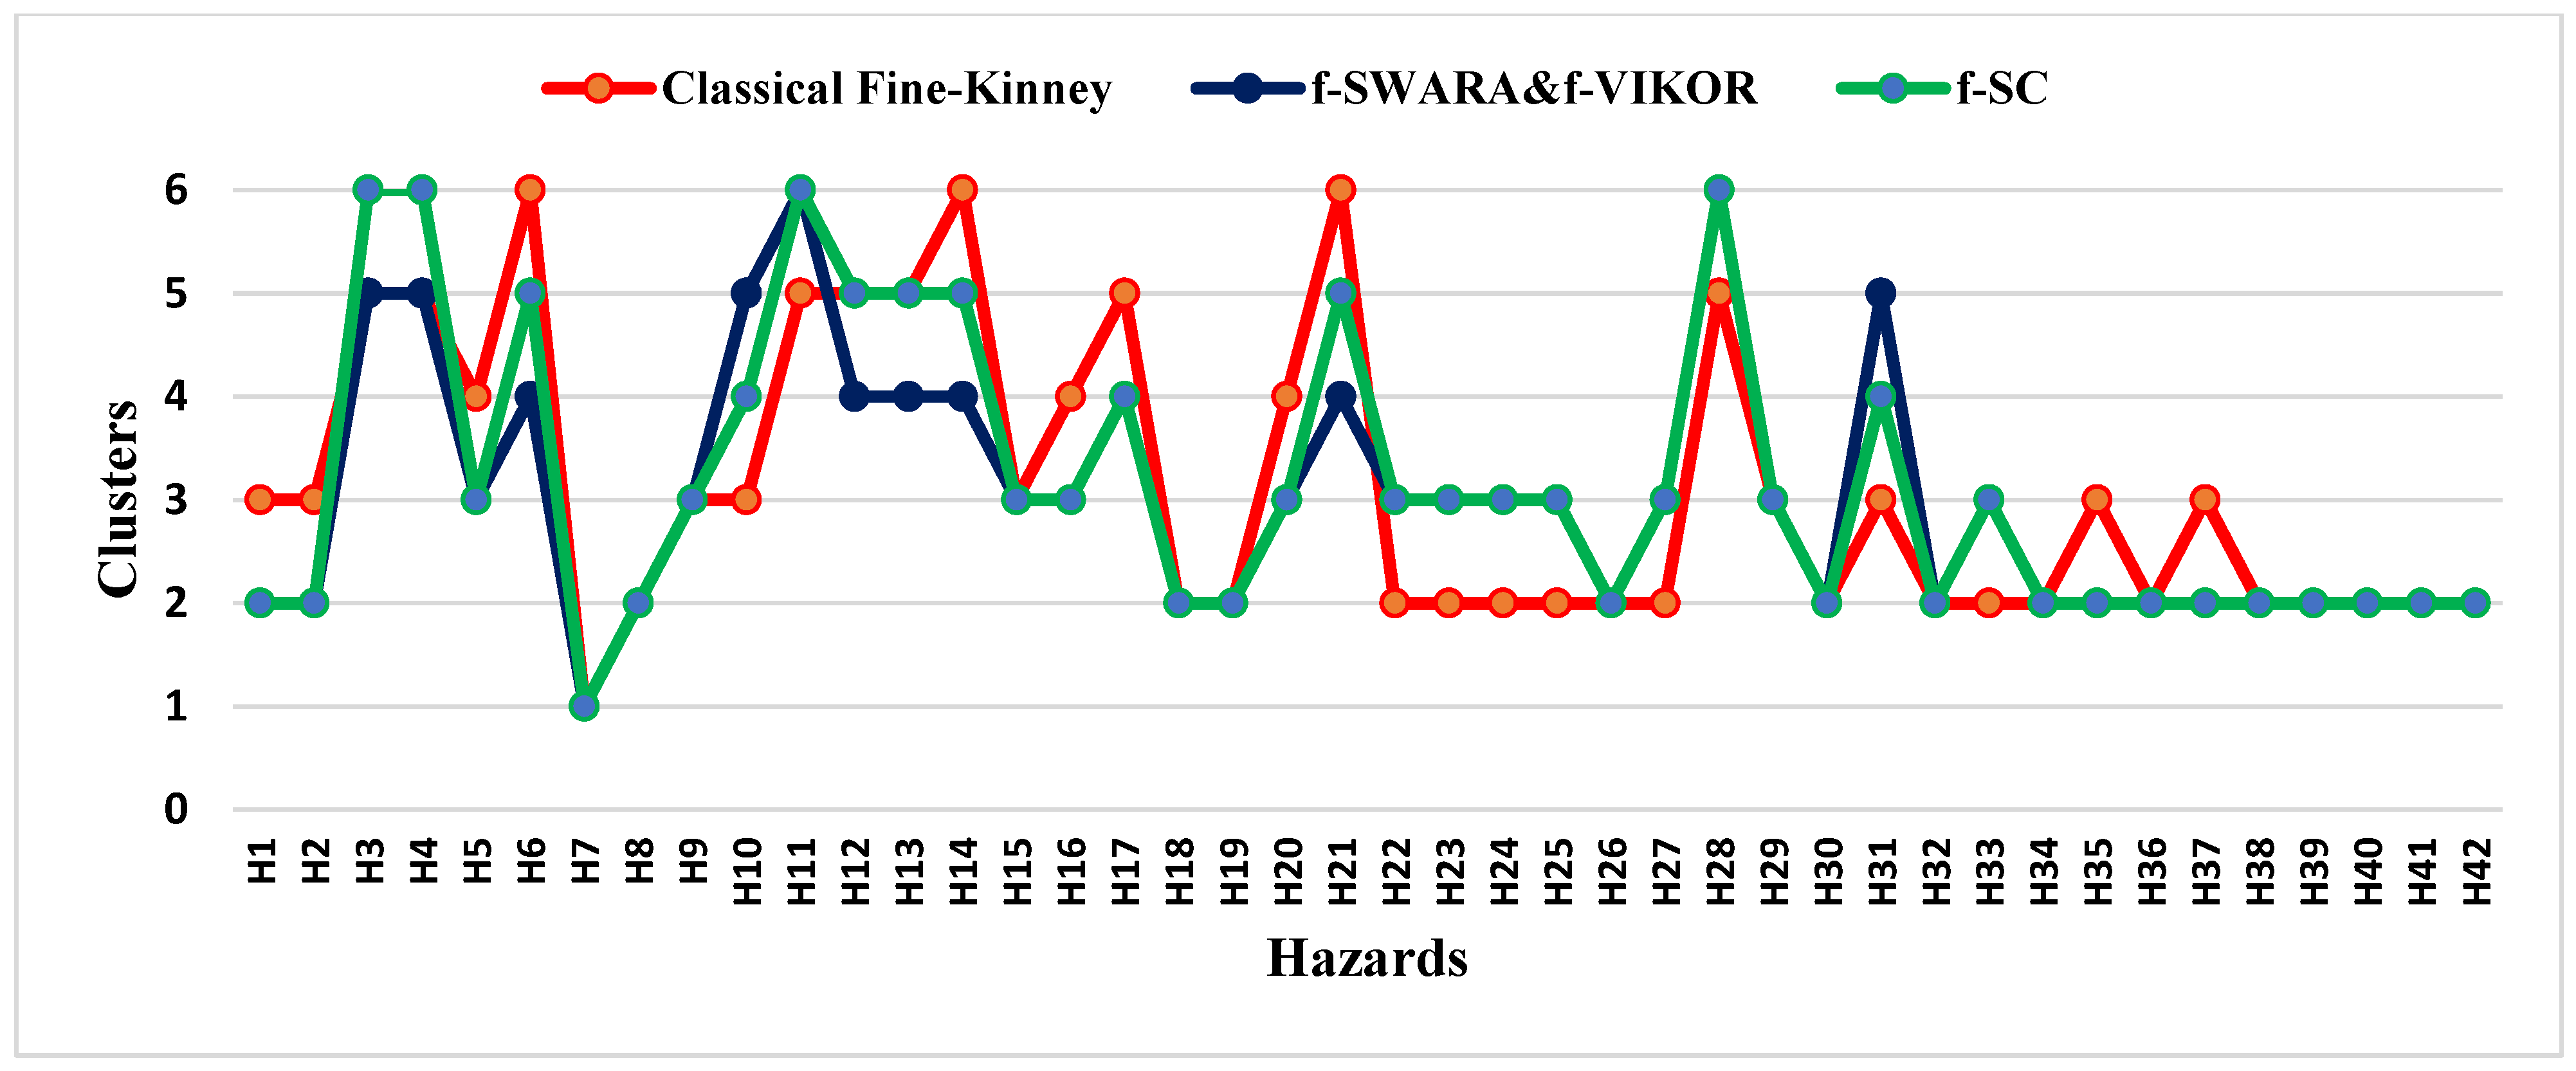
4. Discussion
5. Conclusions
Author Contributions
Funding
Institutional Review Board Statement
Informed Consent Statement
Data Availability Statement
Conflicts of Interest
References
- Moatari-Kazerouni, A.; Chinniah, Y.; Agard, B. A proposed occupational health and safety risk estimation tool for manufacturing systems. Int. J. Prod. Res. 2014, 53, 4459–4475. [Google Scholar] [CrossRef]
- Health and Safety Executive. U.K. Risk Assessment: A Brief Guide to Controlling Risks in the Workplace. 2014. Available online: https://www.hse.gov.uk/pUbns/indg163.pdf (accessed on 7 October 2021).
- Gul, M.; Guven, B.; Guneri, A.F. A new Fine-Kinney-based risk assessment framework using FAHP-FVIKOR incorporation. J. Loss Prev. Process Ind. 2018, 53, 3–16. [Google Scholar] [CrossRef]
- Kutlu, A.C.; Ekmekçioğlu, M. Fuzzy failure modes and effects analysis by using fuzzy TOPSIS-based fuzzy AHP. Expert Syst. Appl. 2012, 39, 61–67. [Google Scholar] [CrossRef]
- Wang, W.; Liu, X.; Qin, Y. A fuzzy Fine-Kinney-based risk evaluation approach with extended MULTIMOORA method based on Choquet integral. Comput. Ind. Eng. 2018, 125, 111–123. [Google Scholar] [CrossRef]
- Mangeli, M.; Shahraki, A.; Saljooghi, F.H. Improvement of risk assessment in the FMEA using nonlinear model, revised fuzzy TOPSIS, and support vector machine. Int. J. Ind. Ergon. 2019, 69, 209–216. [Google Scholar] [CrossRef]
- Stanujkic, D.; Karabasevic, E.; Zavadskas, K. A Framework for the Selection of a Packaging Design Based on the SWARA Method. Inz. Ekon. Eng. Econ. 2015, 26, 181–187. [Google Scholar]
- Zolfani, S.H.; Yazdani, M.; Zavadskas, E.K. An extended stepwise weight assessment ratio analysis (SWARA) method for improving criteria prioritization process. Soft Comput. 2018, 22, 7399–7405. [Google Scholar] [CrossRef]
- Ruzgys, A.; Volvaciovas, R.; Ignatavicius, C.; Turkskis, Z. Integrated evaluation of external wall insulation in residential buildings using SWARA-TODIM MCDM method. J. Civ. Eng. Manag. 2014, 20, 103–110. [Google Scholar] [CrossRef] [Green Version]
- Yucenur, G.N.; Caylak, S.; Gönül, G.; Postalcioglu, M. An integrated solution with SWARA&COPRAS methods in renewable energy production: City selection for biogas facility. Renew. Energy 2020, 145, 2587–2597. [Google Scholar] [CrossRef]
- Yazdani, M.; Alidoosti, A.; Zavadskas, E.K. Risk Analysis of Critical Infrastructures Using Fuzzy Copras. Econ. Res. Ekon. Istraž. 2011, 24, 27–40. [Google Scholar] [CrossRef]
- Mulliner, E.; Smallbone, K.; Maliene, V. An assessment of sustainable housing affordability using a multiple criteria decision making method. Omega 2013, 41, 270–279. [Google Scholar] [CrossRef] [Green Version]
- Wang, Y.; Xie, M. Approach to Integrate Fuzzy Fault Tree with Bayesian Network. Procedia Eng. 2012, 45, 131–138. [Google Scholar] [CrossRef] [Green Version]
- Wang, D.; Zhang, P.; Chen, L. Fuzzy fault tree analysis for fire and explosion of crude oil tanks. J. Loss Prev. Process Ind. 2013, 26, 1390–1398. [Google Scholar] [CrossRef]
- Kou, G.; Peng, Y.; Wang, G. Evaluation of clustering algorithms for financial risk analysis using MCDM methods. Inf. Sci. 2014, 275, 1–12. [Google Scholar] [CrossRef]
- Liu, Y.; Yuan, Y.; Fan, Z.-P. A FTA-Based Method for Risk Decision Making in Emergency Response. Comput. Oper. Res. 2014, 42, 49–57. [Google Scholar] [CrossRef]
- Lavasani, S.M.; Ramzali, N.; Sabzalipour, F.; Akyuz, E. Utilisation of Fuzzy Fault Tree Analysis (FFTA) for quantified risk analysis of leakage in abandoned oil and natural-gas wells. Ocean Eng. 2015, 108, 729–737. [Google Scholar] [CrossRef]
- Rajakarunakaran, S.; Kumar, A.M.; Prabhu, V.A. Applications of fuzzy faulty tree analysis and expert elicitation for evaluation of risks in LPG refuelling station. J. Loss Prev. Process Ind. 2015, 33, 109–123. [Google Scholar] [CrossRef]
- Guneri, A.F.; Gul, M.; Senim, O. A fuzzy AHP methodology for selection of risk assessment methods in occupational safety. Int. J. Risk Assess. Manag. 2015, 18, 319–335. [Google Scholar] [CrossRef]
- Othman, M.R.; Idris, R.; Hassim, M.H.; Ibrahim, W.H.W. Prioritizing HAZOP analysis using analytic hierarchy process (AHP). Clean Technol. Environ. Policy 2016, 18, 1345–1360. [Google Scholar] [CrossRef] [Green Version]
- Dağsuyu, C.; Göçmen, E.; Narlı, M.; Kokangül, A. Classical and fuzzy FMEA risk analysis in a sterilization unit. Comput. Ind. Eng. 2016, 101, 286–294. [Google Scholar] [CrossRef]
- Gul, M.; Celik, E. Fuzzy rule-based Fine–Kinney risk assessment approach for rail transportation systems. Hum. Ecol. Risk Assess. Int. J. 2018, 24, 1786–1812. [Google Scholar] [CrossRef]
- Kokangül, A.; Polat, U.; Dağsuyu, C. A new approximation for risk assessment using the AHP and Fine Kinney methodologies. Saf. Sci. 2017, 91, 24–32. [Google Scholar] [CrossRef]
- Yazdi, M.; Kabir, S. A fuzzy Bayesian network approach for risk analysis in process industries. Process Saf. Environ. Prot. 2017, 111, 507–519. [Google Scholar] [CrossRef]
- Gul, M.; Ak, M.F. A comparative outline for quantifying risk ratings in occupational health and safety risk assessment. J. Clean. Prod. 2018, 196, 653–664. [Google Scholar] [CrossRef]
- Fattahi, R.; Khalilzadeh, M. Risk evaluation using a novel hybrid method based on FMEA, extended MULTIMOORA, and AHP methods under fuzzy environment. Saf. Sci. 2018, 102, 290–300. [Google Scholar] [CrossRef]
- Gul, M. A review of occupational health and safety risk assessment approaches based on multi-criteria decision-making methods and their fuzzy versions. Hum. Ecol. Risk Assess. Int. J. 2018, 24, 1723–1760. [Google Scholar] [CrossRef]
- Markowski, A.S.; Siuta, D. Fuzzy logic approach for identifying representative accident scenarios. J. Loss Prev. Process Ind. 2018, 56, 414–423. [Google Scholar] [CrossRef]
- Chen, K.; Liu, D.; Fan, Z.; Chen, X.; Khan, F. Risk Analysis of Oilfield Gathering Station. Process Saf. Prog. 2019, 38, 71–77. [Google Scholar] [CrossRef] [Green Version]
- Simić, V.; Soušek, R.; Jovčić, S. Picture Fuzzy MCDM Approach for Risk Assessment of Railway Infrastructure. Mathematics 2020, 8, 2259. [Google Scholar] [CrossRef]
- Marhavilas, P.K.; Tegas, M.G.; Koulinas, G.K.; Koulouriotis, D.E. A Joint Stochastic/Deterministic Process with Multi-Objective Decision Making Risk-Assessment Framework for Sustainable Constructions Engineering Projects—A Case Study. Sustainability 2020, 12, 4280. [Google Scholar] [CrossRef]
- Marhavilas, P.K.; Filippidis, M.; Koulinas, G.K.; Koulouriotis, D.E. An expanded HAZOP-study with fuzzy-AHP (XPA-HAZOP technique): Application in a sour crude-oil processing plant. Saf. Sci. 2020, 124, 104590. [Google Scholar] [CrossRef]
- Marhavilas, P.K.; Filippidis, M.; Koulinas, G.K.; Koulouriotis, D.E. A HAZOP with MCDM Based Risk-Assessment Approach: Focusing on the Deviations with Economic/Health/Environmental Impacts in a Process Industry. Sustainability 2020, 12, 993. [Google Scholar] [CrossRef] [Green Version]
- Shahri, M.M.; Jahromi, A.E.; Houshmand, M. Failure Mode and Effect Analysis using an integrated approach of clustering and MCDM under pythagorean fuzzy environment. J. Loss Prev. Process Ind. 2021, 72, 104591. [Google Scholar] [CrossRef]
- Boral, S.; Chakraborty, S. Failure analysis of CNC machines due to human errors: An integrated IT2F-MCDM-based FMEA approach. Eng. Fail. Anal. 2021, 130, 105768. [Google Scholar] [CrossRef]
- Tabatabaee, S.; Mahdiyar, A.; Ismail, S. Towards the success of Building Information Modelling implementation: A fuzzy-based MCDM risk assessment tool. J. Build. Eng. 2021, 43, 103117. [Google Scholar] [CrossRef]
- Wang, Z.-C.; Ran, Y.; Chen, Y.; Yang, X.; Zhang, G. Group risk assessment in failure mode and effects analysis using a hybrid probabilistic hesitant fuzzy linguistic MCDM method. Expert Syst. Appl. 2022, 188, 116013. [Google Scholar] [CrossRef]
- Kinney, G.F.; Wiruth, A.D. Practical Risk Analysis for Safety Management; Final Report; Naval Weapons Center: Kern County, CA, USA, 1976. [Google Scholar]
- Zadeh, L.A. Fuzzy Sets. Inf. Control 1965, 8, 338–353. [Google Scholar] [CrossRef] [Green Version]
- Yong, D. Plant location selection based on fuzzy TOPSIS. Int. J. Adv. Manuf. Technol. 2006, 28, 839–844. [Google Scholar] [CrossRef]


| Addition | |
| Subtraction | |
| Multiplication | |
| Division |
| Likelihood | Value | Exposure Factor | Value |
| Might well be expected | 10 | Continuous | 10 |
| Quite possible | 6 | Frequent (daily) | 6 |
| Unusual but possible | 3 | Occasional (weekly) | 3 |
| Only remotely possible | 1 | Unusual (monthly) | 2 |
| Conceivable but very unlikely | 0.5 | Rare (a few per year) | 1 |
| Practically impossible | 0.2 | Very rare (yearly) | 0.5 |
| Virtually impossible | 0.1 | ||
| Possible Severity | Value | ||
| Catastrophe (many fatalities, or >$107 damage) | 100 | Risk Score | Risk Situation |
| Disaster (few fatalities, or >$106 damage) | 40 | >400 | Very high risk; consider discontinuing operation |
| Very serious (fatality, or >$105 damage) | 15 | 200 to 400 | High risk; immediate correction required |
| Serious (serious injury, or $104 damage) | 7 | 70 to 200 | Substantial risk; correction needed |
| Important (disability, or $103 damage) | 3 | 20 to 70 | Possible risk; attention indicated |
| Noticeable (minor first aid accident, or >$100 damage) | 1 | <20 | Risk; perhaps acceptable |
| Linguistic Terms | Fuzzy Numbers |
|---|---|
| None (N) | (1, 1, 2) |
| Very Low (VL) | (1, 2, 3) |
| Low (L) | (2, 3, 4) |
| Fairly Low (FL) | (3, 4, 5) |
| Medium (M) | (4, 5, 6) |
| Fairly High (FH) | (5, 6, 7) |
| High (H) | (6, 7, 8) |
| Very High (VH) | (7, 8, 9) |
| Linguistic Terms | Fuzzy Numbers |
|---|---|
| Very poor (VP) | (0, 0, 1) |
| Poor (P) | (0, 1, 3) |
| Medium poor (MP) | (1, 3, 5) |
| Fair (F) | (3, 5, 7) |
| Medium good (MG) | (5, 7, 9) |
| Good (G) | (7, 9, 10) |
| Very good (VG) | (9, 10, 10) |
| Criteria | Decision Makers | |||||||||
|---|---|---|---|---|---|---|---|---|---|---|
| DM1 | DM2 | DM3 | DM4 | DM5 | DM6 | DM7 | DM8 | DM9 | DM10 | |
| Severity | - | - | - | - | - | - | - | - | - | - |
| Exposure | H | H | H | FH | FH | H | FH | VH | H | M |
| Probability | FH | M | FH | H | N | FL | VL | L | N | L |
| Criteria | Order of Importance | Ordered Criteria | sj | kj | qj | wj | Wj | ||
|---|---|---|---|---|---|---|---|---|---|
| Probability | 3 | S | 1 | - | - | (1.000, 1.000, 1.000) | (1.000, 1.000, 1.000) | (0.520, 0.544, 0.566) | 0.544 |
| Severity | 1 | E | 2 | H | (6, 7, 8) | (1.750, 1.875, 2.000) | (0.500, 0.533, 0.571) | (0.260, 0.290, 0.323) | 0.291 |
| Exposure | 2 | P | 3 | FH | (5, 6, 7) | (1.625, 1.750, 1.875) | (0.267, 0.305, 0.352) | (0.139, 0.166, 0.199) | 0.167 |
| Decision Makers | Weighted Criteria | ||
|---|---|---|---|
| Probability | Exposure | Severity | |
| DM1 | 0.167 | 0.291 | 0.544 |
| DM2 | 0.177 | 0.287 | 0.537 |
| DM3 | 0.167 | 0.291 | 0.544 |
| DM4 | 0.163 | 0.305 | 0.533 |
| DM5 | 0.242 | 0.277 | 0.483 |
| DM6 | 0.190 | 0.283 | 0.529 |
| DM7 | 0.228 | 0.282 | 0.492 |
| DM8 | 0.197 | 0.269 | 0.536 |
| DM9 | 0.234 | 0.267 | 0.500 |
| DM10 | 0.219 | 0.299 | 0.484 |
| Geometric Mean | 0.196 | 0.285 | 0.518 |
| Hazard Number | Hazards | Potential Impact of the Hazard | Classical Fine–Kinney Risk Analysis | Risk Score | Ranking Number | ||
|---|---|---|---|---|---|---|---|
| Probability | Exposure | Severity | |||||
| H1 | Loading vehicle crashing into pedestrians or equipment | Death, trauma, injury | 3 | 3 | 40 | 360 | 21 |
| H2 | Hitting the employee as a result of the broken connections between the silo and the vehicle | Broken bones, crushed limbs, injury | 3 | 3 | 40 | 360 | 21 |
| H3 | Load lifting, carrying | Backache, musculoskeletal disorder | 1 | 3 | 7 | 21 | 38 |
| H4 | Chemical powder exposure | Eye, skin, or respiratory system irritation | 1 | 6 | 7 | 42 | 35 |
| H5 | Connection failure due to pressurized equipment pressure | Injury | 1 | 6 | 15 | 90 | 31 |
| H6 | Using pressure equipment with malfunctioning pressure gauges | Injury, burns | 0.5 | 1 | 40 | 20 | 40 |
| H7 | Unsuitable employee working at a height and their falling from a height | Death, broken bones, injury | 6 | 6 | 40 | 1440 | 1 |
| H8 | Falling from a height during sampling in silos | Death, broken bones, injury | 3 | 6 | 40 | 720 | 7 |
| H9 | The noise of the raw material silo motor and pneumatic pumps | Hearing loss, occupational disease | 1 | 3 | 40 | 120 | 29 |
| H10 | Liquid chemical exposure | Eye irritation, defects of vision | 6 | 6 | 7 | 252 | 27 |
| H11 | Dust emission and chemical contact as a result of puncture and damage to the filters on the upper points of the silos | Eye, skin, or respiratory system irritation | 3 | 1 | 7 | 21 | 38 |
| H12 | Vehicle rollover | Limb loss, broken bones, death | 1 | 1 | 40 | 40 | 36 |
| H13 | Separating of the silobas monoblock body | Death, injury | 1 | 1 | 40 | 40 | 36 |
| H14 | Failure or explosion of diesel or the electric motor’s compressor in the silo | Death, injury | 1 | 0.5 | 40 | 20 | 40 |
| H15 | Crashing vehicles and heavy traffic | Injury, broken bones | 3 | 6 | 15 | 270 | 25 |
| H16 | Statical electricity | Injury, burns | 0.5 | 6 | 40 | 120 | 29 |
| H17 | Exposure to exhaust gas | Respiratory illness | 1 | 3 | 15 | 45 | 34 |
| H18 | Not using personal protective equipment | Occupational disease, injury | 3 | 6 | 40 | 720 | 7 |
| H19 | Working with chemicals | Occupational disease, injury | 3 | 6 | 40 | 720 | 7 |
| H20 | Unfavorable thermal conditions | Skin irritation, respiratory system illness | 1 | 6 | 15 | 90 | 31 |
| H21 | Material falling from the roof or top of the silos | Injury, death | 0.5 | 1 | 40 | 20 | 40 |
| H22 | Bringing chemical materials to a defined area | Backache, musculoskeletal disorder | 3 | 10 | 15 | 450 | 15 |
| H23 | Bringing the empty boiler from the boiler room to the defined area (10 m distance) | Backache, musculoskeletal disorder | 3 | 10 | 15 | 450 | 15 |
| H24 | Transferring chemical materials into empty boiler | Eye, skin, or respiratory system irritation, occupational disease | 3 | 10 | 15 | 450 | 15 |
| H25 | Exposure to liquid and gaseous raw materials | Eye, skin, or respiratory system irritation, occupational disease | 3 | 10 | 15 | 450 | 15 |
| H26 | Exposure to powdered raw materials | Eye, skin, or respiratory system irritation, occupational disease | 3 | 10 | 40 | 1200 | 2 |
| H27 | Weighing chemicals with a balance | Backache, musculoskeletal disorder | 3 | 10 | 15 | 450 | 15 |
| H28 | Head hitting raw material discharge line or valve | Trauma, broken bones, cut | 3 | 6 | 3 | 54 | 33 |
| H29 | Using utility knife | Cut in the skin, limb loss | 3 | 6 | 15 | 270 | 25 |
| H30 | Ergonomically inconvenience (repetitive movement, lifting load, pushing–pulling) | Musculoskeletal disorder, occupational disease | 3 | 10 | 40 | 1200 | 2 |
| H31 | Using a mixer for mixing chemicals | Injury, limb, or tissue loss | 3 | 10 | 7 | 210 | 28 |
| H32 | Ambient noise as a result of the operation of machinery and equipment | Occupational disease due to hearing loss | 3 | 10 | 40 | 1200 | 2 |
| H33 | Sampling operation | Injury, limb or tissue loss | 3 | 10 | 15 | 450 | 15 |
| H34 | Process of valve opening and closing and connection | Backache, disablement | 3 | 6 | 40 | 720 | 7 |
| H35 | Ungrounded boilers | Death, injury | 3 | 3 | 40 | 360 | 21 |
| H36 | Wet and slippery ground | Slip and fall, broken bones, injury | 3 | 6 | 40 | 720 | 7 |
| H37 | Chemical spills | Skin irritation, burns | 3 | 3 | 40 | 360 | 21 |
| H38 | Space constraints | Injury, limb or tissue loss | 3 | 10 | 40 | 1200 | 2 |
| H39 | The process of cleaning the mixer | Injury, limb or tissue loss | 3 | 6 | 40 | 720 | 7 |
| H40 | Stretching the boiler | Injury, balance loss | 3 | 10 | 40 | 1200 | 2 |
| H41 | Overturning or spilling raw material | Injury, disablement | 3 | 6 | 40 | 720 | 7 |
| H42 | Electrical leakage | Death, disablement | 3 | 6 | 40 | 720 | 7 |
| H1 | H2 | H3 | H4 | H5 | H6 | H7 | H8 | H9 | H10 | H11 | H12 | H13 | H14 | |
| P | MG | MG | F | F | F | MP | G | MG | F | G | MG | F | F | F |
| E | MG | MG | MG | G | G | MP | G | G | MG | G | MP | MP | MP | P |
| S | G | G | F | F | MG | G | G | G | G | F | F | G | G | G |
| H15 | H16 | H17 | H18 | H19 | H20 | H21 | H22 | H23 | H24 | H25 | H26 | H27 | H28 | |
| P | MG | MP | F | MG | MG | F | MP | MG | MG | MG | MG | MG | MG | MG |
| E | G | G | MG | G | G | G | MP | VG | VG | VG | VG | VG | VG | G |
| S | MG | G | MG | G | G | MG | G | MG | MG | MG | MG | G | MG | MP |
| H29 | H30 | H31 | H32 | H33 | H34 | H35 | H36 | H37 | H38 | H39 | H40 | H41 | H42 | |
| P | MG | MG | MG | MG | MG | MG | MG | MG | MG | MG | MG | MG | MG | MG |
| E | G | VG | VG | VG | VG | G | MG | G | MG | VG | G | VG | G | G |
| S | MG | G | F | G | MG | G | G | G | G | G | G | G | G | G |
| H1 | H2 | H3 | H4 | H5 | H6 | H7 | H8 | H9 | H10 | H11 | H12 | H13 | H14 | |
| P | 7.000 | 7.000 | 5.000 | 5.000 | 5.000 | 3.000 | 8.833 | 7.000 | 5.000 | 8.833 | 7.000 | 5.000 | 5.000 | 5.000 |
| E | 7.000 | 7.000 | 7.000 | 8.833 | 8.833 | 3.000 | 8.833 | 8.833 | 7.000 | 8.833 | 3.000 | 3.000 | 3.000 | 1.167 |
| S | 8.833 | 8.833 | 5.000 | 5.000 | 7.000 | 8.833 | 8.833 | 8.833 | 8.833 | 5.000 | 5.000 | 8.833 | 8.833 | 8.833 |
| H15 | H16 | H17 | H18 | H19 | H20 | H21 | H22 | H23 | H24 | H25 | H26 | H27 | H28 | |
| P | 7.000 | 3.000 | 5.000 | 7.000 | 7.000 | 5.000 | 3.000 | 7.000 | 7.000 | 7.000 | 7.000 | 7.000 | 7.000 | 7.000 |
| E | 8.833 | 8.833 | 7.000 | 8.833 | 8.833 | 8.833 | 3.000 | 9.833 | 9.833 | 9.833 | 9.833 | 9.833 | 9.833 | 8.833 |
| S | 7.000 | 8.833 | 7.000 | 8.833 | 8.833 | 7.000 | 8.833 | 7.000 | 7.000 | 7.000 | 7.000 | 8.833 | 7.000 | 3.000 |
| H29 | H30 | H31 | H32 | H33 | H34 | H35 | H36 | H37 | H38 | H39 | H40 | H41 | H42 | |
| P | 7.000 | 7.000 | 7.000 | 7.000 | 7.000 | 7.000 | 7.000 | 7.000 | 7.000 | 7.000 | 7.000 | 7.000 | 7.000 | 7.000 |
| E | 8.833 | 9.833 | 9.833 | 9.833 | 9.833 | 8.833 | 7.000 | 8.833 | 7.000 | 9.833 | 8.833 | 9.833 | 8.833 | 8.833 |
| S | 7.000 | 8.833 | 5.000 | 8.833 | 7.000 | 8.833 | 8.833 | 8.833 | 8.833 | 8.833 | 8.833 | 8.833 | 8.833 | 8.833 |
| H1 | H2 | H3 | H4 | H5 | H6 | H7 | H8 | H9 | H10 | H11 | H12 | H13 | H14 | |
| P | 0.005 | 0.005 | 0.004 | 0.004 | 0.004 | 0.002 | 0.006 | 0.005 | 0.004 | 0.006 | 0.005 | 0.004 | 0.004 | 0.004 |
| E | 0.006 | 0.006 | 0.006 | 0.008 | 0.008 | 0.003 | 0.008 | 0.008 | 0.006 | 0.008 | 0.003 | 0.003 | 0.003 | 0.001 |
| S | 0.014 | 0.014 | 0.008 | 0.008 | 0.011 | 0.014 | 0.014 | 0.014 | 0.014 | 0.008 | 0.008 | 0.014 | 0.014 | 0.014 |
| H15 | H16 | H17 | H18 | H19 | H20 | H21 | H22 | H23 | H24 | H25 | H26 | H27 | H28 | |
| P | 0.005 | 0.002 | 0.004 | 0.005 | 0.005 | 0.004 | 0.002 | 0.005 | 0.005 | 0.005 | 0.005 | 0.005 | 0.005 | 0.005 |
| E | 0.008 | 0.008 | 0.006 | 0.008 | 0.008 | 0.008 | 0.003 | 0.008 | 0.008 | 0.008 | 0.008 | 0.008 | 0.008 | 0.008 |
| S | 0.011 | 0.014 | 0.011 | 0.014 | 0.014 | 0.011 | 0.014 | 0.011 | 0.011 | 0.011 | 0.011 | 0.014 | 0.011 | 0.005 |
| H29 | H30 | H31 | H32 | H33 | H34 | H35 | H36 | H37 | H38 | H39 | H40 | H41 | H42 | |
| P | 0.005 | 0.005 | 0.005 | 0.005 | 0.005 | 0.005 | 0.005 | 0.005 | 0.005 | 0.005 | 0.005 | 0.005 | 0.005 | 0.005 |
| E | 0.008 | 0.008 | 0.008 | 0.008 | 0.008 | 0.008 | 0.006 | 0.008 | 0.006 | 0.008 | 0.008 | 0.008 | 0.008 | 0.008 |
| S | 0.011 | 0.014 | 0.008 | 0.014 | 0.011 | 0.014 | 0.014 | 0.014 | 0.014 | 0.014 | 0.014 | 0.014 | 0.014 | 0.014 |
| H1 | H2 | H3 | H4 | H5 | H6 | H7 | H8 | H9 | H10 | H11 | H12 | H13 | H14 | |
| Pi | - | - | - | - | - | - | - | - | - | - | - | - | - | - |
| Ri | 0.025 | 0.025 | 0.018 | 0.019 | 0.022 | 0.019 | 0.028 | 0.027 | 0.024 | 0.022 | 0.016 | 0.020 | 0.020 | 0.019 |
| Qi | 0.022 | 0.022 | 0.031 | 0.029 | 0.025 | 0.029 | 0.020 | 0.021 | 0.023 | 0.025 | 0.035 | 0.027 | 0.027 | 0.030 |
| Ni | 0.622 | 0.622 | 0.889 | 0.816 | 0.700 | 0.832 | 0.557 | 0.585 | 0.660 | 0.712 | 1.000 | 0.772 | 0.772 | 0.836 |
| Ranking | 15 | 15 | 40 | 36 | 29 | 37 | 1 | 7 | 28 | 31 | 42 | 34 | 34 | 39 |
| H15 | H16 | H17 | H18 | H19 | H20 | H21 | H22 | H23 | H24 | H25 | H26 | H27 | H28 | |
| Pi | - | - | - | - | - | - | - | - | - | - | - | - | - | - |
| Ri | 0.024 | 0.024 | 0.021 | 0.027 | 0.027 | 0.022 | 0.019 | 0.025 | 0.025 | 0.025 | 0.025 | 0.028 | 0.025 | 0.017 |
| Qi | 0.023 | 0.023 | 0.027 | 0.021 | 0.021 | 0.025 | 0.029 | 0.022 | 0.022 | 0.022 | 0.022 | 0.020 | 0.022 | 0.032 |
| Ni | 0.657 | 0.657 | 0.753 | 0.585 | 0.585 | 0.700 | 0.832 | 0.634 | 0.634 | 0.634 | 0.634 | 0.567 | 0.634 | 0.896 |
| Ranking | 25 | 27 | 33 | 7 | 7 | 29 | 37 | 19 | 19 | 19 | 19 | 2 | 19 | 41 |
| H29 | H30 | H31 | H32 | H33 | H34 | H35 | H36 | H37 | H38 | H39 | H40 | H41 | H42 | |
| Pi | - | - | - | - | - | - | - | - | - | - | - | - | - | - |
| Ri | 0.024 | 0.028 | 0.021 | 0.028 | 0.025 | 0.027 | 0.025 | 0.027 | 0.025 | 0.028 | 0.027 | 0.028 | 0.027 | 0.027 |
| Qi | 0.023 | 0.020 | 0.026 | 0.020 | 0.022 | 0.021 | 0.022 | 0.021 | 0.022 | 0.020 | 0.021 | 0.020 | 0.021 | 0.021 |
| Ni | 0.657 | 0.567 | 0.728 | 0.567 | 0.634 | 0.585 | 0.622 | 0.585 | 0.622 | 0.567 | 0.585 | 0.567 | 0.585 | 0.585 |
| Ranking | 25 | 2 | 32 | 2 | 19 | 7 | 15 | 7 | 15 | 2 | 7 | 2 | 7 | 7 |
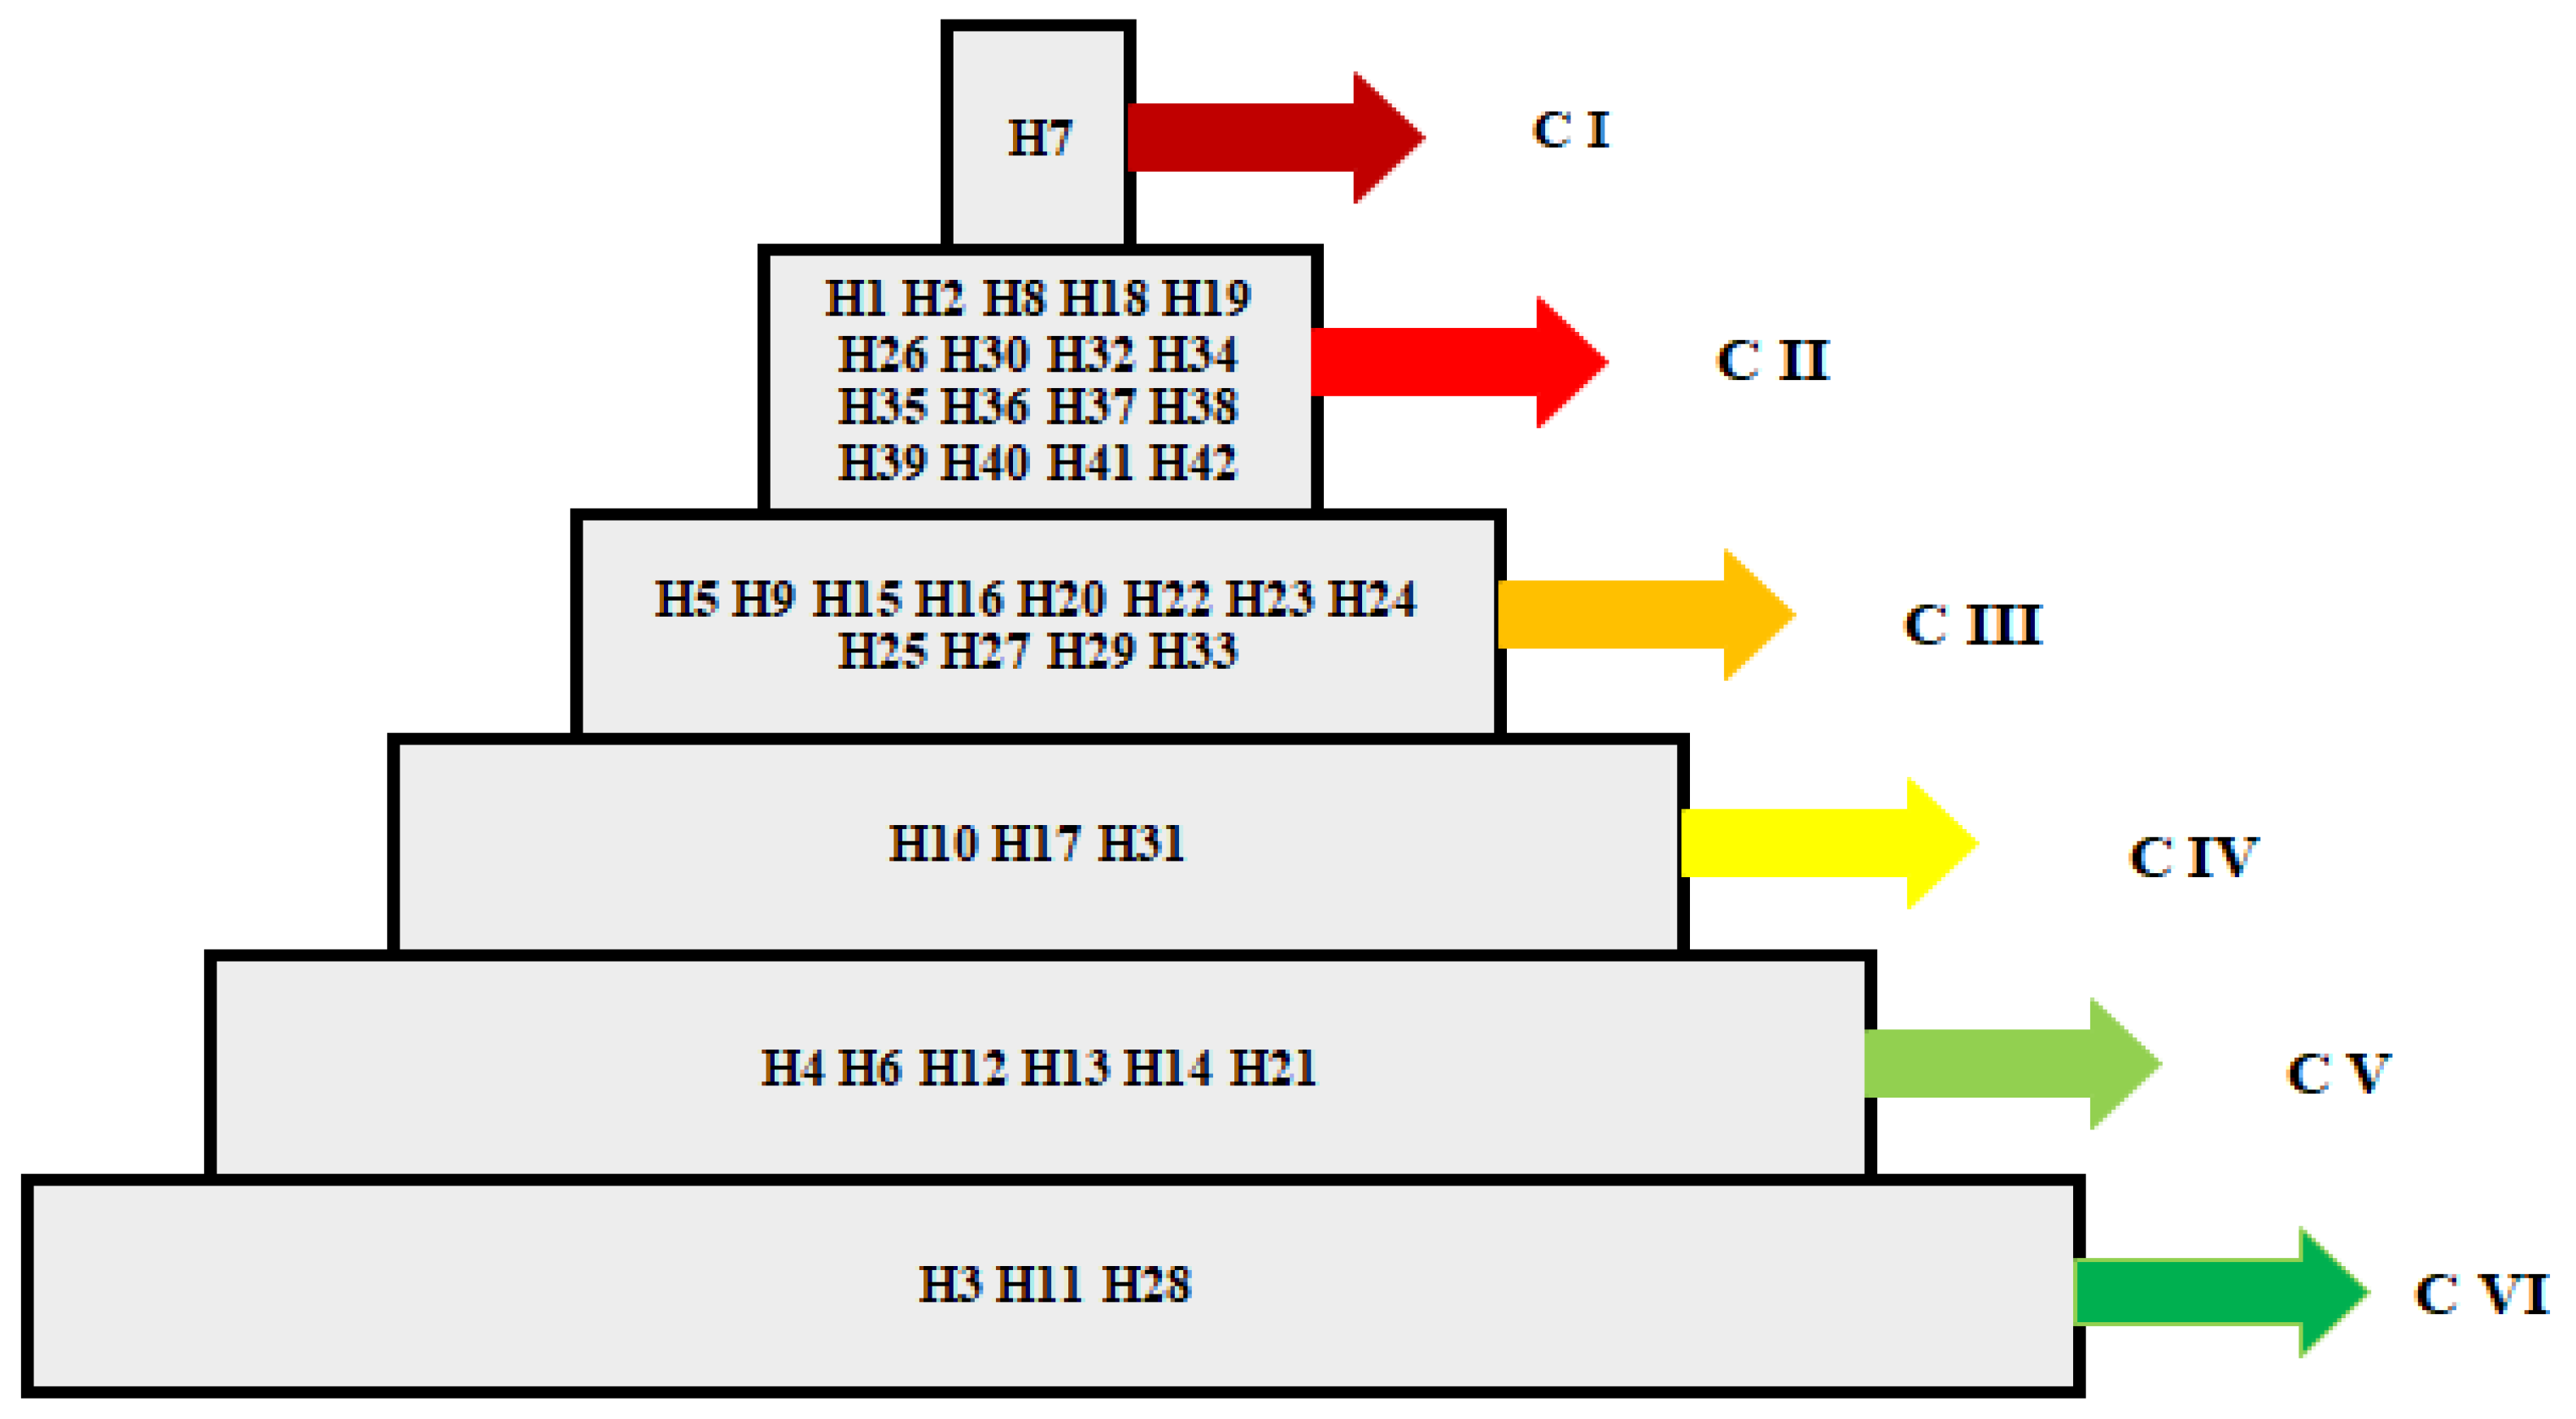
| Cluster No | Ni Range | Risk Level |
|---|---|---|
| I | 0.557 | Very High Risk. Measures must be taken immediately. |
| II | 0.561–0.630 | |
| III | 0.631–0.700 | High Risk Measures should be taken within 3 months. |
| IV | 0.701–0.770 | Important Risk Measures should be taken within 6 months. |
| V | 0.771–0.840 | Possible Risk Measures should be taken within 12 months. |
| VI | 0.841–1.000 | Acceptable Risk No immediate measures necessary. |
| Hazard Number | Cluster Number | Precautions |
|---|---|---|
| H7 | I |
|
| H1, H2, H8, H18, H19 H26, H30, H32, H34, H35, H36, H37, H38, H39, H40, H41, H42 | II |
|
| H5, H9, H15, H16, H20, H22, H23, H24, H25, H27, H29, H33 | III |
|
| H10, H17, H31 | IV |
|
| H4, H6, H12, H13, H14, H21 | V |
|
| H3, H11, H28 | VI |
|
Publisher’s Note: MDPI stays neutral with regard to jurisdictional claims in published maps and institutional affiliations. |
© 2021 by the authors. Licensee MDPI, Basel, Switzerland. This article is an open access article distributed under the terms and conditions of the Creative Commons Attribution (CC BY) license (https://creativecommons.org/licenses/by/4.0/).
Share and Cite
Hacibektasoglu, S.E.; Mertoglu, B.; Tozan, H. Application of a Novel Hybrid f-SC Risk Analysis Method in the Paint Industry. Sustainability 2021, 13, 13605. https://doi.org/10.3390/su132413605
Hacibektasoglu SE, Mertoglu B, Tozan H. Application of a Novel Hybrid f-SC Risk Analysis Method in the Paint Industry. Sustainability. 2021; 13(24):13605. https://doi.org/10.3390/su132413605
Chicago/Turabian StyleHacibektasoglu, Suleyman Enes, Bulent Mertoglu, and Hakan Tozan. 2021. "Application of a Novel Hybrid f-SC Risk Analysis Method in the Paint Industry" Sustainability 13, no. 24: 13605. https://doi.org/10.3390/su132413605