1. Introduction
The methodology for calculating carbon footprints and understanding how carbon footprint affects portfolio construction and valuation is challenging on several levels. The tasks include data classification, reporting, sources, timing and attribution. Understanding the intricacies of carbon footprint data is critical because carbon data is not reported in financial statements, nor is it required by financial regulators. When carbon data is provided, it is provided by the companies directly or is estimated by third parties, while in some instances it is not provided at all. In addition, carbon data is non-standardized, unlike financial data under GAAP, and thus the quality of data is mixed. This research aims to address some of these carbon data issues.
The challenge presented by data classification is a result of multiple factors. Some data is classified by emissions and reserves. Within emissions, there are three classifications by scope, and within each classification a carbon footprint comes from different sources such as coal, oil, or gas. Another problem with data reporting is that a portion of data is actual, while the rest is estimated by third parties, even though most analysis treats data as actual. An additional challenge with data sources stems from the fact that some data is reported directly by the company, while the rest is aggregated by third parties. Further, data timing proves challenging because for the same reporting year by a vendor, the actual data is anywhere from one to three years old. However, all analysis treats data as current. A further issue with data attribution is that the carbon footprint for some companies is double or triple-counted because the same company may be listed in different jurisdictions or through different security listings, and most studies attribute a full carbon footprint to a company for each listing, resulting in a larger than appropriate carbon footprint. Yet another challenge with data attribution is that the full carbon footprint is allocated to a company, whereas the company’s market capitalization weight is not fully represented in an index, even though most studies attribute the full carbon footprint to the company in question without regard to market weight of the company in the index.
Carbon emissions and reserve data have a relatively short history, and it is highly structured [
1]. The carbon data is self-reported by companies or estimated through proprietary methodologies by a handful of data aggregators (MSCI, CDP, South Pole (S&P), Trucost, etc.), who publish it on their proprietary platforms. These providers aggregate raw company data, structure the available information, and estimate missing data [
2]. Because there is no uniform or consistent way of comparing carbon data between data providers, such data is poorly correlated between these various sources [
3].
Although carbon data reporting is improving, and every month adds another data point to the carbon data time series, most investors and researchers are still focused on using derivative carbon scores from proprietary data providers instead of raw carbon data (carbon footprint). In cases where raw carbon data is used, it is received directly from data providers in an “as is” format, with no scrutiny for data accuracy or integrity.
This paper analyzes carbon data and introduces several carbon data adjustment steps that (a) attribute a direct carbon footprint to a company’s operations, (b) reduce overallocation of carbon footprints by adjusting for multiple listings and (c) reduce overallocation of carbon footprints by adjustment based on market capitalization within the index at the individual company level. This paper also (a) addresses issues with actual and estimated carbon footprint data and (b) discusses the time lag in carbon data reporting.
2. Literature Review
Usage of Environmental and Carbon data can be divided into the following three broad categories: Corporate Sustainability (CS) (or Socially Responsible (SR)); Environmental, Social and Governance (ESG) and Carbon (C). Each of these categories is presented to researchers as scores or rankings (MSCI—CarbonMetrics Methodology and Definitions, 2014). These scores are provided for each company and are based on the data provider’s proprietary data aggregation methodologies, with typical rankings ranging from 1 for the worst ranked company to 10 for the best ranked. Several research papers still use derivative carbon scores [
4,
5], while more recent research papers use raw carbon data [
6,
7,
8,
9,
10,
11,
12,
13] as provided directly by data providers. Only Gaspar et al. [
14] and Gurvich [
15] demonstrate how to remove data flaws and correct for data integrity.
Carbon Data
Looking at the usage of raw carbon data, Derwal et al. [
16], Görgen et al. [
4], Tan et al. [
5] and Konar et al. [
17] used carbon scores to show that companies with lower carbon scores have either better returns or lower risk, while Hao et al. [
8], Heaps et al. [
18], Andersson et al. [
6], Jacob [
11], Matsumura et al. [
12], Yongqing et al. [
5] and Cheema-Fox et al. [
7] used raw carbon data to show higher performance or lower risk. Harris [
9,
10], Gaspar et al. [
14] and Gurvich [
15] also used raw carbon data but dived deeper into the carbon data structure and separated carbon data analysis based on three carbon emissions Scopes.
Derwal et al. [
16] used eco-efficiency scores, which were a precursor to the carbon scores, to show that companies with higher scores also had higher average returns than companies with lower scores. Görgen et al. [
4] used carbon-related indicators, such as value chain, public perception, and adaptability, to create a Brown Minus Green risk factor. Tan et al. [
5] used carbon scores to show that carbon and climate risks are not fully priced by investors and that carbon intensive industries do not provide adequate risk-adjusted returns. Konar et al. [
17] used environmental finance variables, such as toxic releases and environmental lawsuits, to show a relationship with a firm’s intangible value.
Hao et al. [
8] showed that a carbon efficient portfolio outperforms on an absolute return basis while it underperforms on a risk-adjusted basis. Heaps et al. [
18] observed that companies with a low-carbon footprint and/or low-carbon intensity can outperform their respective benchmarks and provide better risk-adjusted returns. Andersson et al. [
6] used raw carbon data to create a lower carbon footprint portfolio without reducing portfolio returns. Jacob [
11] proposed low-carbon portfolios that can provide lower portfolio risk relative to the benchmark. Matsumura et al. [
12], showed a negative association, based on raw carbon data, between carbon emissions and firm value. Yongqing et al. [
13] demonstrated that Australian regulations on carbon emissions negatively affect companies’ asset values and cash flows.
Harris [
9] stratified raw carbon into different emissions Scopes to show how a low-carbon intensity portfolio produces significant outperformance relative to high carbon intensity portfolios. Harris [
10] also built an Efficient Minus Intensive factor to show a positive risk premium that is uncorrelated from other risk factors. Gaspar et al. [
14] used raw carbon data, stratified into different emissions Scopes, to build low-carbon multi-asset portfolios that exhibit similar returns and risk-adjusted returns as the benchmark. Cheema-Fox et al. [
7] proposed decarbonization factors.
In general, previous papers use secondary sources or proprietary data to evaluate carbon footprints. Some studies use carbon scores, while others use raw carbon data and stratify data for more granular analysis. In addition, some providers utilize word ratings instead of scores, although the meaning is the same. Other studies use carbon scores developed by data providers through proprietary and non-transparent methodologies to link raw carbon data with financial performance. Several studies use raw carbon data as measured in tons of CO2 and referred to as carbon volume, while others use a carbon intensity indicator which is defined as carbon volume divided by the company’s sales. However, none of these papers use raw carbon data to correct carbon allocation errors generated by multiple listings and index allocation.
This paper explicitly uses raw, primary data carbon instead of derivative carbon scores, and proposes a method to adjust the data to reduce carbon allocation errors. This research reallocates the corporations’ carbon footprints, correcting the following two types of distortions: multiple listings and index allocation. Multiple listings distortion refers to the number of times the same company is listed as unique in the MSCI ACWI Index. Index allocation distortion refers to the over/under-allocation of carbon footprints based on different companies’ market capitalization values in the MSCI ACWI index relative to the company’s total market capitalization in the MSCI IMI Index. As a result, the reallocated carbon emissions are separated within Scope 1, Scope 2 and Scope 3, as well as within carbon reserves.
The correction of carbon allocation errors proposed in this paper can be used to develop new or more accurate carbon risk factors that can lead to new portfolio optimization strategies that optimize risk-adjusted return as well as carbon financial and operational efficiency as in Gurvich and Creamer [
19].
3. Carbon Data Structure and Usage
3.1. Data Classification–Emissions and Reserves
This research uses raw carbon emissions for data analysis and avoids proprietary Corporate Sustainability (or Socially Responsible) scores, Environmental, Social and Governance scores or Carbon scores/rankings.
Carbon data classification is relevant in terms of how it is calculated and presented. Carbon footprints are generally classified in terms of carbon (CO
2) emissions and carbon (CO
2) reserves. Both are measured in millions of tons of carbon dioxide equivalent. Carbon emissions refer to the carbon dioxide gas emitted during an industrial process, transportation activities or production of heat. The reason emissions are calculated in “equivalents” such as tons of carbon dioxide equivalents (“tCO
2e”) is because there are many more gases (e.g., CH
4) produced during industrial processes that also contribute to greenhouse gases, although for the purpose of universality all gases are converted to a carbon dioxide equivalent as presented in
Table 1.
Carbon emissions are subdivided into three Scopes. Scope 1 refers to direct emissions, such as a company’s office heating or emissions released during manufacturing or production processes. Scope 2 refers to indirect emissions due to a company’s purchased electricity. For example, during an industrial process, the company in question buys electricity from a utility company, and emissions produced by the electricity provider are attributed to the emissions of the company that uses that electricity. Scope 3 refers to indirect emissions (primarily) downstream of the value chain and emissions produced by the company’s sold products. For example, when individuals who own and drive cars produce carbon emissions, these emissions are counted as Scope 3 emissions for the car manufacturer. All three Scopes are attributed to one company, raising the issue of double or triple counting, as Scope 2 or Scope 3 emissions of one company are Scope 1 emissions of another company. Clearly, an investor needs to decide what Scopes are considered when evaluating a company’s emission.
Carbon reserves are fossil fuels that are still in the ground and have not been extracted yet. The most relevant fossil fuels, in order of decreasing magnitude of carbon dioxide emissions, are coal, oil and gas. It is important to note that if these fossil fuels are still in the ground or extracted but not yet used (i.e., burned), they emit no carbon emissions. Since reserves are potential emissions, an investor needs to assess the likelihood of reserves being extractable from the ground and the likelihood that they will be extracted. In addition, reserves are aggregated in millions of tons of carbon dioxide equivalents, or MtCO
2e, which equates to the carbon effect from coal, oil and gas. However, coal, oil and gas have different CO
2 equivalents according to their potential carbon footprint (
Table 2).
3.2. Data Reporting—Actual vs. Estimated
Carbon footprint data is typically aggregated by data providers, such as MSCI, CDP, South Pole (S&P) and Trucost. Data is classified as actual, reported, or estimated. Actual data is directly calculated for a specific activity, reported data is reported by the company, while estimated data is compiled by a data provider. Unlike financial data, which typically follows Generally Accepted Accounting Principles (GAAP), carbon data does not follow universal reporting schemes and is not required to be reported. In addition, companies may report only one out of three Scopes of emissions data (
Table 3).
Typically, carbon data providers cover around three thousand companies for carbon footprint data; however, the amount of estimated data is significant as
Table 4 shows for MSCI ACWI.
Each data provider has its proprietary estimation models, which are continually updated. Thus, changes in the models lead to the re-evaluation of previously estimated carbon data. In addition, each provider has several estimation models, depending on the sector or any other attribute. Carbon data from different providers varies significantly, as shown by Abele (2016), where the highest correlation between four vendors was 0.37 and the lowest was −0.14. Clearly, if carbon data is to be used for assessing value, the use of estimated data will pose a challenge for accuracy.
3.3. Data Timing Lag
Carbon data is reported with a significant lag. Data providers need to collect and input various data sources, but there is a natural delay in obtaining carbon data. In addition to the actual data, data providers must calculate estimated data, which also adds to the data reporting lag. Typical lag within a data set is between one and three years as can be observed for MSCI ACWI in
Table 5.
Table 5 represents an example of data lags at one point in time in June 2016; however, the entire research analyses data from January 2010 to March 2017.
4. Methodology
4.1. Data Attribution for Multiple Listings
This paper proposes that a corporation’s carbon footprint should be assessed based on combining total market capitalization from various geographical listings and/or share classes in the MSCI ACWI index and allocating carbon footprint proportionally. This methodology eliminates double or triple counting and overallocation of a company’s carbon footprint, reallocating carbon emissions and reserves as presented in Equations (1) and (2) according to total market capitalization (Equation (3)).
ACEi allocated carbon emissions for one company in jurisdiction i (or share class i)
δi market capitalization in ACWI index for one company in jurisdiction i (or share class i) divided by market capitalization in ACWI IMI index in one company in jurisdiction i (or share class i)
TCE total carbon emissions for the company
ACRi allocated carbon reserves for one company in jurisdiction i (or share class i)
TCR the total carbon reserves for the company
TMC total market capitalization for one company
MCi market capitalization for one company in jurisdiction i (or share class i)
4.2. Data Attribution for Index Allocation
Another attribute of the MSCI carbon data is that it allocates a company’s total reported carbon footprint (emissions and reserves) to the company within the MSCI ACWI index, even though the company’s total market capitalization is not fully included in the MSCI ACWI index. Since investors invest in the MSCI ACWI index and not the MSCI ACWI IMI index, their holdings do not represent the full market capitalization of each company in their portfolio. This distorts and typically overestimates the carbon footprint for each company.
This distortion in carbon footprint allocation arises due to MSCI’s index construction methodology (MSCI 2020). MSCI developed an MSCI ACWI IMI (Investable Market Index) index [
20], based on the MSCI Global Investable Market Indices (GIMI) Methodology. This methodology aims to provide exhaustive coverage of the relevant investment opportunity set with an emphasis on index liquidity, replicability and investment potential. This index covers all investable large-, mid- and small-cap securities across the developed and emerging markets, targeting approximately 99% of each market’s free-float adjusted market capitalization.
However, the MSCI ACWI IMI index is used primarily as a reference index rather than as an investable index. The MSCI ACWI IMI index is not practical for investing due to many reasons, some of which include a very large number of securities, variable liquidity, number of shares available for trading, country regulations etc., to name a few. For institutional investors, it is the MSCI ACWI Index (as opposed to MSCI ACWI IMI index) that is the most used and referenced global index for investing and benchmarking purposes.
In the construction of the MSCI ACWI index, MSCI starts with the reference MSCI ACWI IMI index and makes several transformations, as part of which companies are included with their respective market capitalization. The first transformation is to apply an 85% free float-adjusted market capitalization. This first transformation is used across the board for all large- and mid-capitalization stocks that are included in the MSCI ACWI index (small-capitalization stocks are not included in the MSCI ACWI index). The second transformation applies a proprietary variable adjustment to free float market capitalization. This second transformation is determined by defining a size reference for the MSCI ACWI IMI index and specifying a range of 0.5 times to 1.15 times (MSCI 2020).
The result of these transformations indicates that when a company is included in the MSCI ACWI index, its market capitalization can vary from 42.50% to 97.75% of its full market capitalization listed in the MSCI ACWI IMI index.
This MSCI index construction technique leads to the distortion of actual carbon volume allocated to a company, and carbon volume must therefore be adjusted accordingly. Hence, in this paper, carbon emissions and reserves are allocated based on the proportion of the company’s market capitalization in the MSCI ACWI index (Equations (4) and (5)). This methodology reduces the overestimation of the company’s carbon footprint.
ACE allocated carbon emissions for one company
γ proportion of a company’s market capitalization in the ACWI index to market capitalization in the ACWI IMI index
TCE total carbon emissions for the company
ACR allocated carbon emissions for one company
TCR total carbon reserves for the company
5. Results
Carbon data aggregators go through the process of collecting, cleaning and attributing carbon to companies. As data is reported, each provider allocates carbon in a different way for each company. The data is thus dependent on the data provider’s process. In the case of MSCI ’s data, several data attributes affect data integrity.
5.1. Multiple Listings
The correction of carbon allocation due to multiple listing according to equations 1 and 2 is reported in
Table 6. For the period from January 2010 to March 2017, the number of double- or triple-listed companies ranged from 67 to 171 listings. Over the analyzed period, on average 1.6% of companies were double or triple listed; however, the Emissions Scope 1, 2 and 3 and Reserves were overestimated by 4.6%, 5.5%, 10.6% and 6% respectively.
Descriptive statistics for emission and reserves are in
Table 7 and
Table 8 below.
Table 7 and
Table 8 highlight the differences between the original carbon footprint and corrected carbon footprint due to correction for multiple listings. It is not a surprise that the mean for corrected data is lower than in the original index, as we remove and reduce the total amount of emissions and reserves. What is surprising is that data variation, as measured by standard deviation, maximum and minimum, has not changed significantly. We may attribute this to initially high data dispersion, especially for Scopes 2 and 3, as well as Reserves.
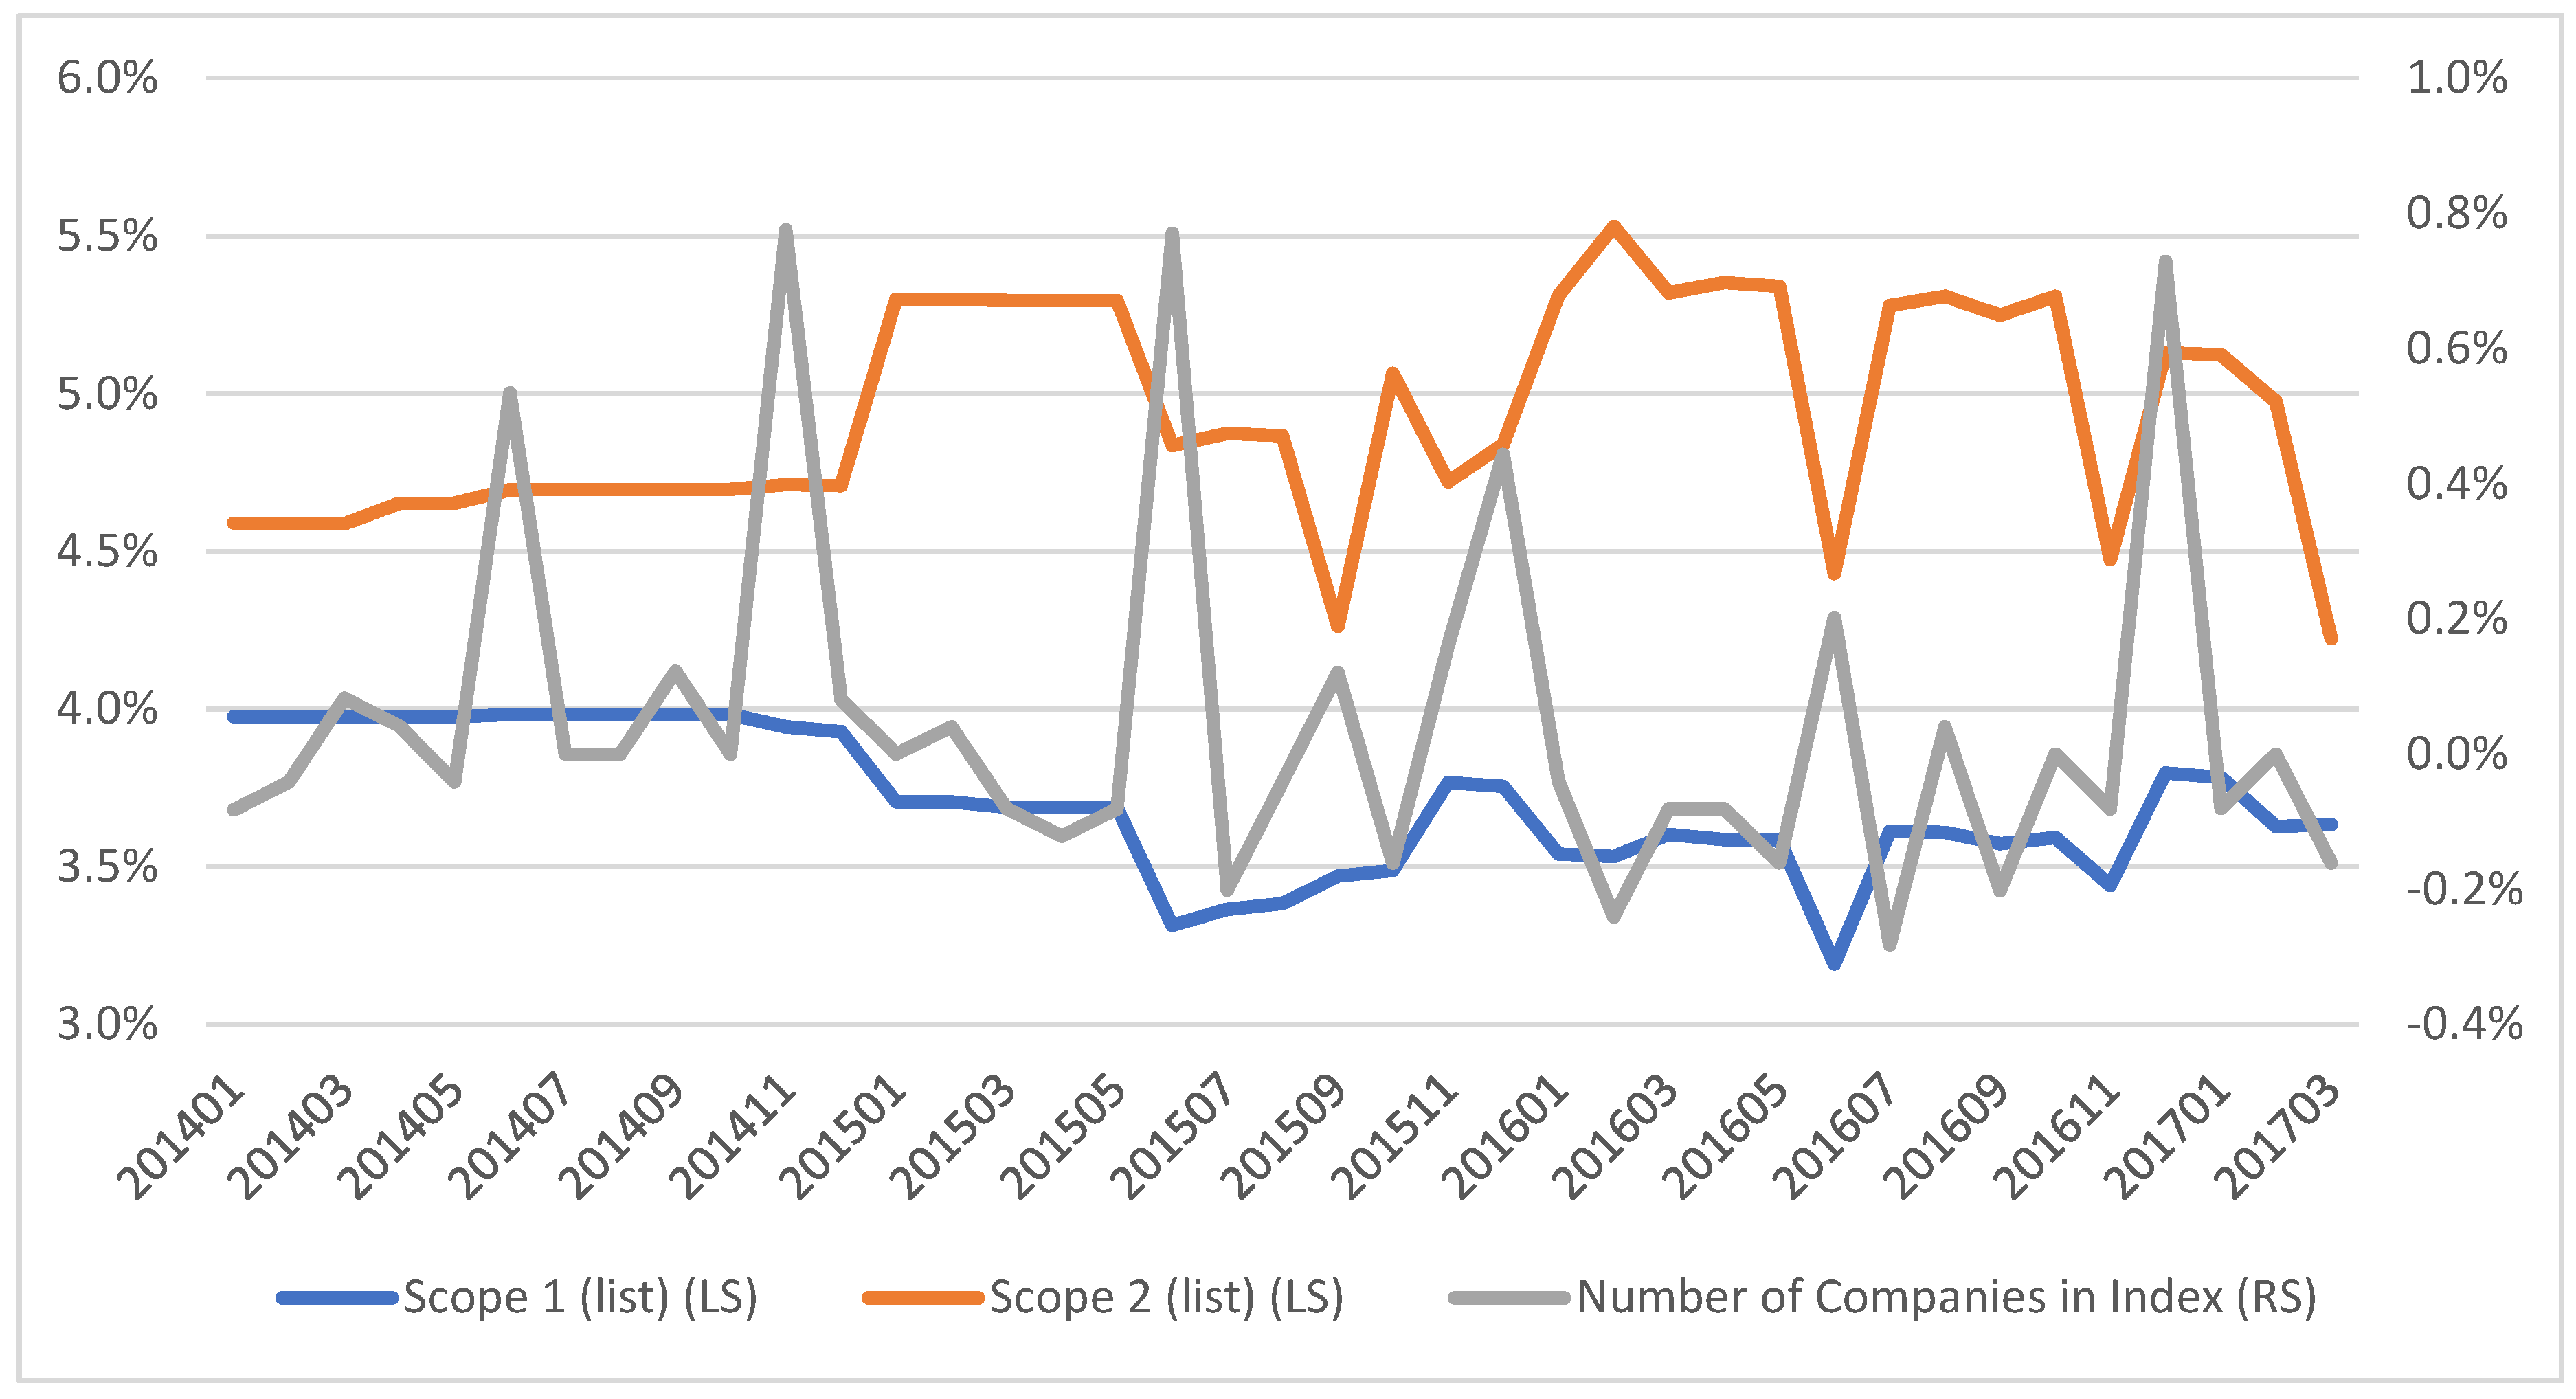
With certain variations, the overestimations of Emissions Scope 1 and 2 converged to a central value in the period 2014–2017 (
Figure 1). Similarly, the number of names in the index does not vary extensively.
The relative stability of Scope 1 and Scope 2 overstatements may be due to the stability of the ACWI index. The number of names added or removed in any given month varies between –0.3% and 0.8%
As an example, MSCI provides identical carbon data for the same company, within an equity index, which is listed in different jurisdictions and/or through different share classes. This causes double and triple counting of carbon data for multiple listed companies as observed in the carbon emissions and carbon reserve columns for BHP Billiton in
Table 9. Using its market capitalization for UK and Australia index listings in Equations (1) and (2), the carbon emissions and carbon reserve weighted columns show an important adjustment.
Table 10 shows that in June 2016, 40 companies had multiple listings, of which 3 companies were triple-listed and 37 companies were double-listed. These 40 companies with multiple listings represent 1.6% of the 2481 companies listed in the MSCI ACWI Index in June 2016. However, the overstatement of carbon footprint is significantly larger: Emissions Scope 1, 2 and 3 as well as Reserves were overstated by 3.2%, 4.4%, 14.3% and 4.6%, respectively (
Table 11). A complete list of 40 double- and triple-listed companies for June 2016 is listed in
Appendix A.
5.2. Index Allocation
Adjusting a corporation’s carbon footprint based on the proportion of each company’s market capitalization in the index according to Equations (4) and (5) reduces the overallocation of the carbon footprint as reported in
Table 12. The MSCI ACWI Investable Market Index is larger than the MSCI ACWI Index by 24.8% during the period January 2010 to March 2017; however, the overstatement of carbon footprint is larger: Emissions Scope 1, 2 and 3 as well as Reserves were overstated by 33.9%, 27.6%, 21.3% and 57.2%, respectively, in the same period.
Descriptive statistics for MSCI ACWI IMI and MSCI ACWI indices are in
Table 13 and
Table 14 below.
Table 13 and
Table 14 highlight the differences between original carbon footprints and corrected carbon footprints due to reassessment for overestimation. The means and variation data have been significantly reduced in the MSCI ACWI Index, after correction, relative to the MSCI ACWI IMI index. This makes sense, as the difference in market capitalization between the two indices is high (24.8%) and the corrections for overestimation were significant (33.9%, 27.6%, 21.3%, 57.2%) for all three Scopes and Reserves.
As an example, Adaro Energy shows a reduction of 45% of its stated carbon allocation when it is adjusted by its participation in the index (
Table 15) for June 2016.
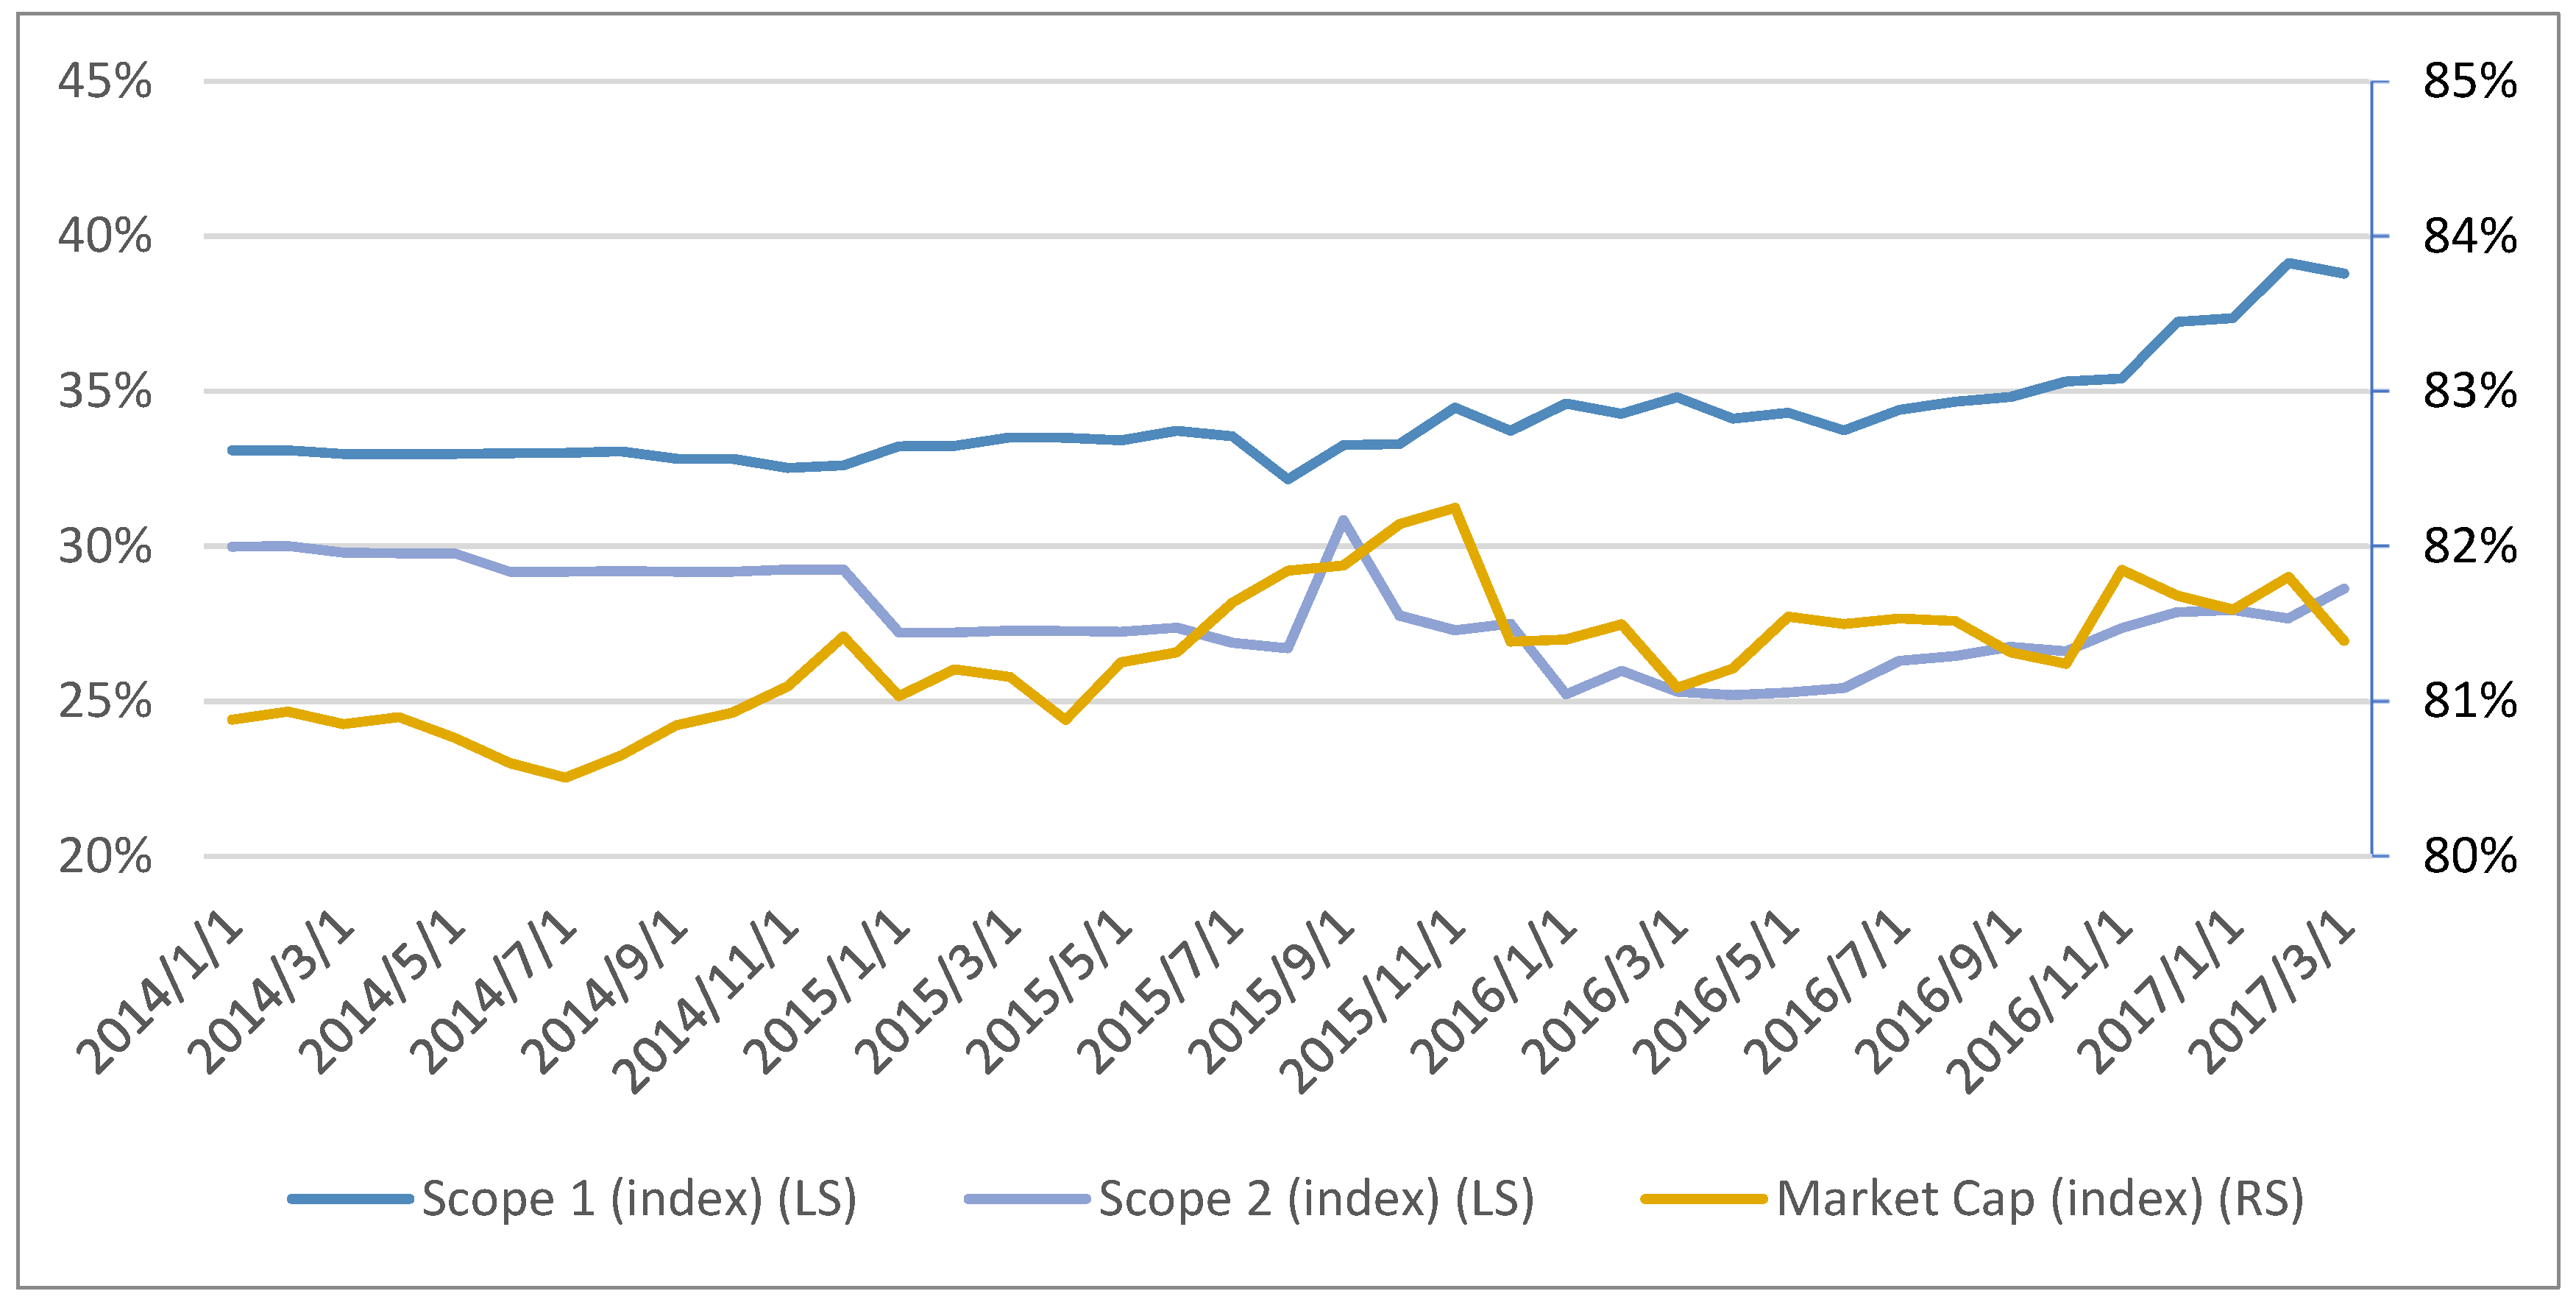
Figure 2 shows that in the last 4 years of analysis (2014–2017), the overestimation in MSCI ACWI of Emissions Scope 2 converged to central values, while the overestimation of Emissions Scope 1 increased from 33% to about 39%. Conversely, the ACWI index stayed relatively constant relative to the ACWI IMI at around 81%.
The more recent upward change in overestimation of Scope 1 may be attributable to both the higher number of companies reporting their carbon volume and to a better quality of reporting. As there is increased pressure on companies to disclose their carbon footprint, more are compelled to report their Scope 1 emissions. Similarly, as carbon data becomes more standardized, companies have a better ability to provide a more accurate carbon footprint. However, for Scope 2, carbon footprint data is more stable. This may be because Scope 2 carbon footprint is an indirect measure of carbon footprints derived from the company’s usage of electricity by an external energy provider. Therefore, this data is never direct and always estimated, and the estimation techniques may not change in their accuracy.
5.3. Correlations
The original, as well as the adjusted series of Emissions Scope 1 and 2 are highly correlated (0.89–0.9), while both series with Emissions Scope 3 and Reserves are smaller (
Table 16). The lowest correlation of all the series with Emissions Scope 3 can be explained because of the difficulty in calculating this indicator, as it includes indirect emissions downstream of the value chain and those produced by the company’s sold products.
MSCI’s index construction poses a challenging issue to investors who need to assess a company’s carbon volume output and link it to the company’s valuation, as carbon volume is overallocated to companies and distorts data analysis. This paper recognizes this issue and appropriately allocates carbon volume to each company.
6. Discussion
Actual data reporting is an important consideration in understanding carbon data structure. Companies either report their carbon footprint or they do not, and there is no requirement for reporting. For example, for Scope 1, in a typical reporting month, only 50% of data is reported by companies, whereas estimated data is at 46% and the rest is neither reported nor estimated. The unreported data is estimated by the provider. This is significant because estimation techniques are specific to each data provider and the estimation methodologies are opaque.
Timing of data reporting is important, as there is a significant lag between a company’s data report and distribution by the provider. This is because the provider requires data from the individual company or else scrape data from an external data source. It then needs to aggregate available data and estimate the data from the non-reporting companies. In a typical reporting month, the carbon data is three years old for 0.4% of the companies in the index, two years old for 94.1% of companies and one year old for 4.4% of the companies, with no data for the remaining 1.1% of companies. This creates another distortion in analyzing and attributing carbon footprints since the information is stale. The one redeeming feature is that such data is stale for most of the companies in the index.
A significant issue with carbon data attribution is a mismatch of a company’s actual market capitalization relative to the capitalization included in the MSCI ACWI Index. The full market capitalization is included in the MSCI ACWI IMI Index, whereas only partial market capitalization is included in the MSCI ACWI Index. The MSCI ACWI Index is the most common investor benchmark; however, it includes only partial free float market capitalization of companies. This MSCI index construction technique overestimates carbon allocation at the company level and carbon volume must be adjusted accordingly as presented in the previous section. Since many investors hold or benchmark themselves to the MSCI ACWI Index, they overallocate the amount of carbon their investment portfolio holds.
7. Conclusions and Policy Implications
This research points to several carbon data distortions that may significantly overallocate carbon footprints to individual companies and proposes a methodology for corporate carbon allocation. These distortions and discrepancies may skew carbon analysis for either portfolio decarbonization or portfolio valuation purposes. Data distortion that stems from having the same company listed in multiple geographical jurisdictions or through different share classes overstates Emissions Scope 1, 2 and 3 and Reserves by 4.6%, 5.5%, 10.6% and 6.0%, respectively. While data distortion due to index construction by having different market capitalization in representative indices excessively allocates Emissions Scope 1, 2 and 3 and Reserves by 33.9%, 27.6%, 21.3% and 57.2%, respectively.
Portfolio managers who use quantitative screens to evaluate companies based on their carbon footprints to reduce carbon exposure in their portfolios should use screens based on raw carbon data, as opposed to carbon scores. Carbon scores are opaque, proprietary, and subject to estimation. In addition, using scores from different providers will produce different portfolio results, as scores are poorly correlated among different score providers.
Raw carbon data presents its challenges due to its structure. This paper illustrates several important issues with raw carbon data that distort and overallocate carbon footprints. Usage of carbon data in its present format may incorrectly remove some companies from portfolios (negative screen, complete removal) or incorrectly reduce some companies’ weight in a portfolio (partial screen, fractional removal).
In conclusion, this research introduces novel methods of carbon allocation and a straightforward method to correct carbon footprint overallocation that can help researchers, regulators, and investors to identify the proper level of corporate carbon footprints.


