Abstract
The sustainability to ensure grain security is an important issue that China’s government faces. It has become more important to ensure grain security by improving the efficiency of grain production under the constraints of limited resources. At present, industrial integration has become an important trend of economic development in China. This study explores the impact of industrial integration on the sustainability of grain security from the perspective of grain production efficiency. In this paper, the grain production efficiency was measured by stochastic frontier analysis method. The degree of industrial integration is measured by the coupling coordination method. Additionally, the effect of industrial integration on grain production efficiency is empirically studied by the panel tobit model. Empirical results show that industrial integration can promote the improvement of grain production efficiency, which reveals that accelerating industrial integration can also be conducive to grain security.
1. Introduction
Grain production is a key link to ensure grain security. The sustainable guarantee of grain security is of great significance to stabilize economic and social development [1]. However, at the present stage, a large number of rural, young labor force go to work in cities in China. In addition, industrialization and urbanization require a large amount of land as well. The grain production faces multiple constraints such as water, land, labor, and environment in China [2]. It is a key way to improve grain production efficiency to ensure grain security [3]. How to improve grain production efficiency has become a hot topic when scholars are confronted with this practical problem about grain security.
The current academic research on grain production efficiency can be divided into two categories: one is the research on the optimization and improvement of grain production process. Due to the existence of many part-time farmers, some scholars believe that the outsourcing and substitution of some grain production links can realize the professional division [4,5]. Thus the professional division is beneficial to improve the efficiency of grain production [6]. The representative studies are that Liu, Yang and Wen [6] adopt the dual selection model (DSM) to study the contribution factors of the labor division on the grain production efficiency based on data from 396 farms in 15 provinces in 2013 in China. It is found that participation in agricultural cooperation means the transformation of grain production into specialization and intensification, which will help improve the production efficiency. In addition to cooperation and outsourcing which can replace the traditional production, agricultural mechanization also can optimize traditional grain production links. For example, some scholars found planting machinery and irrigation facilities could alleviate the constraints of the agricultural production environment, and believed that the higher the level of agricultural mechanization, the more helpful it is to improve the technical efficiency of grain production [7,8]. In addition, Piesse, et al. [9] revealed that South Africa’s implementation of discriminatory policies on grain and agriculture can encourage grain cooperatives to focus on optimizing production links, thereby reducing costs and improving grain production efficiency.
Second is the study on the optimization of grain production factors. Starting from the fact of grain production in China, some scholars found that the insufficient utilization rate of grain production factors and the lack of scientific input led to unnecessary waste [10]. Those scholars also believe that optimizing grain production factors and improving the input efficiency of production factors are conducive to the overall improvement of grain production efficiency [11]. Most of these scholars conduct research from factors such as chemical fertilizers, labor, and land. For example, Huang and Jiang [12] believe that the input of chemical fertilizers is the key to improving the grain production efficiency. In particular, the use of some new chemical fertilizers will improve the grain production efficiency [13]. In addition, Bezu and Holden [14] assess the impact of the food-for-work (FFW) program which can increase the investment on grain production to alleviate grain insecurity. According to the evaluation result, they adopt the Heckman selection model, finding that chemical fertilizer input can actively increase grain production and alleviate food security problems. Some scholars believe that the input of labor and land resources is also the key to improving grain production efficiency [15]. Yang, et al. [16] emphasize that the loss of rural labor forces restricts the improvement of grain production efficiency based on the micro-survey data of more than 2000 rural households in the last five years in China’s five provinces. Therefore, the large-scale migration of labor forces may have an impact on grain security. Some scholars also believe that grain production efficiency can be improved by introducing high-quality production factors such as capital and trade [17].
The improvement of grain production efficiency is essentially the result of a re-optimized combination of various production factors such as talents, capital and technology which is changing continuously between industries or within an industry. As stated by Hauknes and Knell [18], the production factors interaction between industries or within an industry is conducive to optimal configuration. As a result, factor flow will accelerate the mutual factor penetration of different industries, making the industrial boundary blurred and gradually integrated [19]. This process of the mutual factor penetration is named as the industrial integration. Industrial integration has become an important trend of economic development. Additionally, industrial integration accelerated at the present stage in China [19]. The old industrial integration mode continues to be broken. The new industrial integration mode simultaneously continues to be formed. The continuous evolution of industrial integration makes the degree of coordination between industries closer and closer [20].
The current scholars’ research on industrial integration is mainly carried out from three aspects: industrial integration preconditions, industrial integration mode, and the impact of industrial integration. In terms of research on the prerequisites of industrial integration, scholars generally believe that the technical commonness, the relationship of business cooperation, and relaxation of industrial policy control, which are important prerequisites for the development of industrial integration [21], have overstepped the boundary between industries accordingly. In terms of research on industrial integration models, scholars believe that industrial integration models mainly include industrial expansion, industrial restructuring, and industrial crossover, etc. Additionally, they pointed out that more and more industrial integration modes with market, technology, and functions as the carrier have been emerging. Nevertheless, scholars have not reached an agreement on the influence effect of industrial integration. Some scholars believe that industrial integration can promote industry innovation efficiency and achieve scale effect through advantage business extension and key technology diffusion [22]. However, other scholars express the opposite view and think that the effect of industrial integration includes both a diffusion effect and a polarization effect [23,24]. That is to say, industrial integration will promote all kinds of quality production factors to accelerate agglomeration in high profit industry but restrain the development of some weak industry consequentially.
So, does industrial integration promote or inhibit grain production efficiency? The current research cannot clearly give the answer. There are some shortcomings about the existing research by reviewing the existing literature. Due to industrial integration involving a large number of industries, the effect mechanism of industrial integration on different types of industries are not the same. The academic community has not yet verified the impact of industrial integration on grain production efficiency. In addition, although a few scholars have tried to explain the internal impact mechanism of grain production efficiency improvement from the perspective of rural industry development [25], these studies tend to be qualitative theoretical analysis and lack empirical test. In order to solve the current efficiency problems faced by China’s grain production and maintain grain security more sustainably and steadily, this article is based on the perspective of industrial integration, using provincial panel data for the period 2008 to 2018. We use the stochastic frontier analysis method to measure the efficiency of grain production as a dependent variable and regard the degree of industrial integration measured by the coupling coordination method as an independent variable. Finally, a series of empirical tests are carried out on the impact of industrial integration on grain production efficiency. The contribution of this paper is mainly reflected in two aspects: first, facing the issue of sustainable grain security, we explore grain production efficiency from a new perspective of industrial integration and test for heterogeneity in time and region; second, the latest Chinese macro data are used to empirically test the impact of industrial integration on the efficiency of grain production and make a comparative analysis of the impact between agricultural industrialization and agricultural service on grain production efficiency; third, we have incorporated the urban–rural gap into our research framework to explain the impact mechanism of industrial integration on grain production efficiency.
2. Materials and Methods
2.1. Empirical Model
A variety of empirical models can be used to study the relationship between industrial integration and grain production efficiency, such as the ols method, panel fixed effects, etc. As the dependent variables are measured by SFA, the dependent variables, grain production efficiency, vary between 0 and 1. The tobit model is different from the discrete choice model and the general continuous variable model. Its characteristic is that the dependent variable is a restricted variable [26]. The tobit model is a censored regression model and deals with censored data [27]. We estimated the panel tobit regression by means of the software packages STATA. We set the basic model as follows:
where represents the grain production efficiency. represents industrial integration. is the core coefficient in this article, which represents the impact of industrial integration on the efficiency of grain production. is a vector of the various control variables. represents the province and represents the year. is a vector of parameters to be estimated for various control variables on the grain production efficiency. represents the constant term. represents the fixed effect of a province. represents the time fixed effect. represents the random error term.
2.2. Variable Selection
2.2.1. Dependent Variable
Grain production efficiency: There are many methods to measure grain production efficiency, but the most common are DEA (i.e., Data Envelopment Analysis) and SFA (i.e., Stochastic Frontier Analysis). However, as a non-parametric method, DEA is incomparable for studying the efficiency of different regions in most cases, as the situation in different regions such as China’s developing regions (such as Xinjiang, Shanghai) and developed regions (such as Shanghai, Beijing) is different [28]. Moreover, DEA is quite sensitive to outliers [29]. Due to frequent natural disasters, grain production in various regions fluctuates greatly every year. Therefore, we think it is inappropriate to use DEA to measure the grain production efficiency. On the contrary, SFA can solve the above problems. This method is that the frontier which is the most efficient is constructed to decompose the error term into statistical error and inefficiency error [30]. The method can be fully considered the time-varying nature of comprehensive technical efficiency. We adopt SFA method to measure grain production efficiency. However, the Stochastic Frontier Analysis Method needs to give a specific function form. Some scholars use the transcendental logarithmic function form [31], but that function form involves too many variables and is prone to problems such as multicollinearity which reduces the credibility of parameter estimation. Therefore, we draw on the classic multiple regression function, where the right side of the equation is the input variables such as the number of employees in grain planting, the sown area of grain, the total power of grain machinery, and the amount of chemical fertilizer applied, and where the left side of the equation is the output variable which is the total grain output.
According to previous research [32], we set the specific regression function as follows:
where represents the total grain output. represents the number of employees in grain planting. represents the sown area of grain. represents the total power of grain machinery. represents the amount of chemical fertilizer used in the grain. , , , and are the parameters to be estimated. represents the random disturbance term which obeys the normal distribution, namely, (0, ). is more than 0, representing the management error term, which is the distance between the output and the maximum output. In addition, and are independent of each other. According to Battese and Coelli [33], this paper set and , where represents the total time. When is not equal to 0, the panel random effect model of the time-varying attenuation should be selected for parameter estimation. Therefore, we test whether the comprehensive technical efficiency will change with time. The null hypothesis is that the comprehensive technical efficiency will not change with time. The alternative hypothesis is that the comprehensive technical efficiency will change with time. According to the test, the value of is equal to 0.23, the z statistic is 2.95, and p-value is 0.003. Based on empirical results, we reject the null hypothesis, using the time-varying attenuation panel random efficiency to estimate the parameters. Then, we conduct the comprehensive technical efficiency measurement. The calculation formula is , where is the grain production efficiency.
The statistical analysis of indicator variables is shown in Table 1.

Table 1.
Input and output variables for measuring grain production efficiency.
2.2.2. Independent Variable
Industrial integration: As the links between industries become closer and closer, the degree of industrial integration measured from the perspective of the overall industry will become more accurate and comprehensive. Therefore, we take the integration degree of Primary, secondary, and tertiary industries as a proxy variable for industrial integration. The specific measurement process is as follows:
- (a)
- The first step is index selection. We mainly select six indicators, namely the proportion of added value, employees, fixed asset investment growth rate, employment growth rate, investment effect coefficient, and labor productivity of primary, secondary, and tertiary industries;
- (b)
- The second step is setting indicator weight. First, we eliminate the impact caused by the difference in indicator dimensions. The calculation formula is as follows: , representing each province, representing time, representing the indicator, representing the value of each indicator at different times and in different provinces, and representing the value after dimensionless processing. Second, we adopt the formula, namely , to make the indicator unit same. Third, the formula for calculating the entropy value is , where . The calculation formula of the difference coefficient is . In the end, the formula to determine weight is ;
- (c)
- The third step is to determine the comprehensive evaluation index. The calculation formula of the comprehensive evaluation index is where . Additionally, , , and , respectively, represent the comprehensive evaluation function of the primary industry, the secondary industry, and the tertiary industry;
- (d)
- The fourth step is the measurement of coupling degree. The calculation formula is as follows:According to the formula, the value of the coupling degree ranges from 0 to 1, but the coupling degree model can only reflect the extent of the interaction between the different systems. The closer the value of the coupling degree is to 1, the greater the coupling degree between the different systems; the closer the value of the coupling degree is to 0, the smaller the degree of coupling between the different systems;
- (e)
- The fifth step is the measurement of the degree of coupling coordination. The calculation formula is as follows: and . According to the system theory, the subsystems influence and promote each other. Their contribution to the industrial integration system is equally important, so we set the value of , , and as 1/3.
2.2.3. Control Variables
The grain production efficiency is mainly studied as the relationship between input and output. The input and output variables have been set in the SFA model. Therefore, we mainly select variables that affect the input–output relationship from the exogenous perspective as the control variables. According to previous studies [34,35,36], we choose grain price, grain processing industry, economic development, and urbanization level for control. The explanation is as follows:
Grain price (price): The grain purchase activities are more obviously affected by policies in China. The grain price intervention of China’s government in the purchase process is particularly prominent in order to ensure grain security. Additionally, the grain price is also a key factor affecting farmers’ grain planting.
Grain processing industry (grainpro): Grain processing industry is a downstream industry of grain production. As the raw grains need to be processed before they can enter the consumption, the grain processing industry is an intermediate link connecting grain production and grain consumption. China’s government encourages on-site processing of grain production, so the grain processing industry can affect the efficiency of grain production.
Economic development (agdp): The economic development of a region can affect the input and output of various industries in the region, thereby affecting the efficiency of grain production.
Urbanization level (city): The level of urbanization can intuitively reflect the distribution of urban and rural populations and the difference and flow between urban and rural factors market, thereby affecting urban–rural integration and industrial integration.
2.3. Data Source
Data on grain production efficiency was obtained from China grain Yearbook and China Rural Statistical Yearbook for the period 2008 to 2018. Data on industrial integration was obtained from China Statistical Yearbook, China Rural Statistical Yearbook, and Fixed Asset Investment Statistical Yearbook for the period 2008 to 2018. Data on Grain retail price index was obtained from China grain Yearbook for the period 2008 to 2018. Data on total output value of grain processing industry was obtained from China grain Yearbook and Grain and Oil Processing Statistics for the period 2008 to 2018. Data on GDP per capital and urbanization rate was obtained from China grain Yearbook for the period 2008 to 2018. Some data derived from statistical yearbooks of various provinces and cities (excluding Hong Kong, Macao, Taiwan, and Tibet). These data are available only annually. Some missing values are estimated by difference method. The statistical analysis of the main variables is shown in Table 2.
Table 2.
Descriptive statistics of main variables.
3. Analysis of Empirical Results
3.1. Benchmark Regression
Table 3 shows the impact of industrial integration on grain production efficiency. The first column shows that the influence of industrial integration on grain production efficiency is still positive ( = 0.780, p < 0.01). The significance test is also passed. At the same time, it can be seen from Figure 1 that there is a significant positive correlation between industrial integration and grain production efficiency. However, the pooled regression model has many statistical problems.
Table 3.
Benchmark regression.
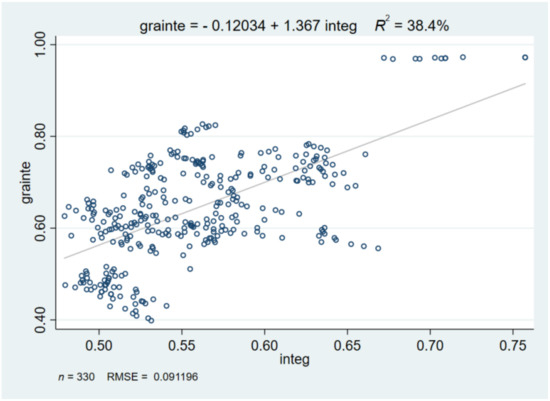
Figure 1.
Relationship between industrial integration and grain production efficiency.
First, the individual-time effect test is performed. According to the Chow test result, the F statistic value is 11,412.489, which is greater than the critical value of 1.442 with p-value equal to 0.05. The null hypothesis of the pooled regression model is rejected. We also performed the LR test (LR = 2426.878), the result of which is greater than the critical value of 54.572 with p-value equal to 0.05, which also indicates that the pooled regression model should not be used. Then, we perform the time effect test. The Chow test statistic is 0.946, which is less than the critical value of 1.861 with p-value equal to 0.05. The LR test statistic is 9.804, which is less than the critical value of 18.307 with p-value equal to 0.05. The results exclude the alternative hypothesis time effect. In addition, the individual effect test is performed. The Chow test statistic is 7500.385, which is greater than the critical value of 1.506 with p-value equal to 0.05. Additionally, the LR test statistic is 2181.637, which is greater than the critical value of 42.557 with p-value equal to 0.05. The results indicate that an individual effect model should be established. So, we can choose to establish an individual fixed effects model or an individual random effects model. We pass the Hausman test (chi2(5) = 12.76, p = 0.026) to reject the null hypothesis that the random effects model should be established. We performed a fixed-effect (FE) panel regression. As shown in Column 2 of Table 3, the R-square value is 0.931, indicating that we can fit the data well by choosing the panel model.
Regarding the adequacy of the model, we have carried out a RESET test (F(3, 321) = 1.97, p = 0.1191 > 0.100) on the model. As the value of the significance is close to 0.1, there may be some model setting problems. After adding the quadratic term of the industrial integration variable to the regression, Ramsey RESET test using powers of the fitted values of dependent variable (i.e., grainte) is well (F(3, 320) = 1.09, Prob > F = 0.3548). However, we found that the coefficient of the quadratic term was not significant, as shown in Column 3 of Table 3. After discussion, we believe that adding a quadratic and higher order terms will make the problem more complicated, with economic significance missing to a certain extent.
The multicollinearity problem makes it difficult to accurately estimate the model, especially in cross-sectional data. Multicollinearity is a very serious problem, especially when the sample size is insufficient, the traditional ols regression will cause the variance of the estimated parameters to change, making the parameter estimation unstable. However, this article mainly uses panel data which can reduce the impact of multicollinearity. In addition, if the multicollinearity problem is slight, we can ignore them. We test the variance inflation factor (VIF) of each explanatory variable. As shown in Appendix A, all the VIF value of the variables are less than 10, indicating that we do not need to consider the problem of multicollinearity. The VIF value of the core explanatory variable (i.e., Integ) is 3.01, which is less than 5. It can be seen that the multicollinearity of our article is not a problem.
Heteroskedasticity will cause the parameter estimator to be invalid. Generally speaking, heteroscedasticity is common, which does not affect the parameter estimate, but can affect the standard error term [37]. We make a modified wald test for groupwise heteroskedasticity in fixed effect regression model (chi2 (30) = 422.15, p < 0.01). The results show that there is heteroskedasticity. We use the robust method of the panel model to estimate the variance-covariance consistency, which results are robust, so as to reduce the influence of heteroscedasticity on model estimation bias. The results of the Wooldridge test for autocorrelation in panel data (F = 113.387, p < 0.01) show that there is autocorrelation. The value of the Pesaran’s test of cross-sectional independence is equal to 26.310 (p < 0.01) shows that residuals are correlated.
Therefore, we use the feasible generalized least squares method (FGLS) and Panel Corrected Standard Errors (PCSE) which can modify the influence of autocorrelation, heteroscedasticity and cross-sectional correlation [38]. The results are shown in Column 4 and 5 of Table 3. As there may be non-normality problems of the residuals so that it cannot be estimated by the maximum likelihood method, we used the CLAD (Censored Least Absolute Deviations) method to verify again [39]. The results are shown in Column 6 of Table 3. In summary, we have added fixed effects, FGLS, PCSE, and CLAD, to estimate the impact of industrial integration on grain production efficiency. It can be seen from the results that, except for some standard errors, the signs and significance of the core explanatory variable (i.e., industrial integration) have not been changed, which shows that the conclusions of the benchmark regression are robust.
However, considering that the numerical value of the explanatory variable, grain production efficiency, which is measured by the stochastic frontier analysis method, is limited to the interval of 0 and 1. Therefore, we finally select the panel tobit model for parameter estimation. The seventh column is the regression results using the panel tobit model, showing that the impact of industrial integration on grain production efficiency is still positive with the significance test passed ( = 0.300, p < 0.01). The results reveal that for every one percentage point increase in industrial integration, the grain production efficiency will increase by 0.3 percentage points.
From the point of view of the control variables, the retail price of grain is negative to the efficiency of grain production. The main reason is that the grain retail price is a barometer of the relationship between supply and demand in the grain market. The high retail price of the grain indicates the insufficient supply of the grain retail market. The high retail price of the grain will also stimulate farmers’ enthusiasm for production and let them ignore production efficiency. Thereby the grain retail price has a negative impact on grain production efficiency. The development of the grain processing industry has a positive role in promoting the efficiency of grain production. This is as the grain production link is an important part of the grain industry chain. The grain processing industry will generate more external effects on grain production link through knowledge or technology spillovers. Regional economic development will have a positive impact on the efficiency of grain production, as economic development is propitious for the inflow of various productive factors, which will promote the improvement of grain production efficiency. The level of urbanization facilitates the efficiency of grain production. The higher the level of urbanization, the lower the proportion of rural population. The high level of urbanization will accelerate the efficiency and scale of rural land transfer, thereby achieving the economic scale of grain production. Land-scale economies will help improve the scale and overall efficiency of grain production.
3.2. Endogenous Test
Although the panel tobit model can avoid the estimation bias caused by multicollinearity to a certain extent, there may still be some missing variables in the model. In addition, policies may have an impact on industrial integration and grain production efficiency at the same time, leading to causality between industrial integration and grain production efficiency. These will cause endogenous problems in the model. In order to reduce the estimation error of the endogenous problem in the model, according to the selection principle of instrumental variables, which are related to explanatory variables and not related to the explained variables, this paper chooses the integration degree of the secondary and tertiary industries as the instrumental variable. The reason is that the integration of secondary and tertiary industries can definitely affect industrial integration, and the integration of secondary and tertiary industries has nothing to do with agriculture, but the integration of secondary and tertiary industries can only affect grain production through reintegration with the primary industry. The regression result is shown in Column 1 of Table 4. The regression coefficient of the two stage least square method test using instrumental variables shows that the impact of industrial integration on the grain production efficiency is still significantly positive when considering the endogeneity problem. The RKF test statistic in the first stage is significantly larger than the critical value, which is equal to 16.38, the F value approved by Stock & Yogo under the 10% error level, indicating that there is no problem of weak instrumental variables. In the unidentifiable test, the estimated coefficients all passed the significance test. At the same time, according to the method [40], this paper also uses the lagging period of the industrial integration variable as an instrumental variable to carry out the two stage least square method test. The regression results in Column 2 of Table 4 can still reach the same conclusion. This shows that the regression results of the benchmark model are robust.
Table 4.
Endogenous test.
3.3. Heterogeneity Test
The benchmark regression results initially indicate that industrial integration can significantly improve the grain production efficiency. However, it can be seen from Figure 1 that there may be a certain heterogeneity. For this reason, we further discuss the impact of industrial integration on grain production efficiency from the perspectives of different periods and different regions.
3.3.1. Time Heterogeneity
In 2015, China’s government proposed that rural industrial integration could be used to promote rural revitalization for the first time in an official document. For this reason, the central government requires provincial governments to continue to promote industrial integration in rural areas, focusing on developing local characteristic industries and innovating industrial integration models. Facts have shown that these measures have effectively promoted the integration and development of rural industries, improved the modernization of agricultural production, and been gradually changing the traditional agricultural production mode in rural areas. Obviously, it can be seen that the supporting policies for rural industrial integration may lead to differences on the impact of industrial integration on grain production efficiency around 2015. Therefore, we make the year 2015 the boundary to divide the above time into two time periods, 2008–2014 and 2015–2018, and discuss the impact of industrial integration on the grain production efficiency in different periods. The specific regression results are shown in Table 5. Before 2015, the influence coefficient of industrial integration on grain production is 0.099, which is significantly smaller than the influence coefficient, which is 0.158 after 2015. This shows that high-quality factors in various industries are flowing to agricultural fields with the introduction of industrial integration policies in China so that the positive impact of industrial integration on grain production efficiency is gradually increasing. At the same time, the results of discussion about different periods again verified the conclusion that industrial integration can promote the efficiency of grain production.
Table 5.
Heterogeneity test.
3.3.2. Regional Heterogeneity
Due to the uneven industrial development in eastern, central, and western in China and the large differences in natural resource endowments, the impact of industrial integration on grain production efficiency will produce a certain degree of heterogeneity in various regions. According to the define information of the National Bureau of Statistics, we set fourteen provinces, Jiangsu, Shanghai, Zhejiang, Fujian, Guangdong, Shandong, Anhui, Hainan, Heilongjiang, Liaoning, Jilin, Hebei, Tianjin, and Beijing, as the eastern region, set six provinces, Henan, Hubei, Hunan, Jiangxi, Shanxi, and Inner Mongolia, as central provinces, and set ten provinces, Shaanxi, Ningxia, Gansu, Sichuan, Chongqing, Guizhou, Guangxi, Yunnan, Qinghai, and Xinjiang, as western provinces. The regression results of the regional heterogeneity are shown in Columns 3, 4, and 5 of Table 5 which, respectively, represent the impact of industrial integration on grain production efficiency in the eastern, central, and western regions. The regression of regional samples shows that the industrial integration in the central region has the greatest positive effect on grain production efficiency, while the eastern region has the least positive effect. This is mainly as the economic development in the eastern region is the best, industrial structure is relatively complete, and modern agricultural development is already in a leading position. Therefore, the spillover effect of other industries on agricultural development will slow down, thus weakening the promotion effect of industrial integration on grain production efficiency. Although the spillover effect of industrial integration in the western region may be the largest, the degree of industrial integration development is relatively low. As a result, the spillover effects of other industries on the agriculture are insufficient, resulting in a smaller promotion effect than the central region. In summary, the regression results about region show that there is obvious regional heterogeneity about the impact of industrial integration on grain production efficiency, which can indirectly verify that the regression results of the benchmark regression model are relatively robust.
3.4. Further Research
Now is a critical period when industry and service industry are feeding back agriculture industry in China. China’s government has been guiding high-energy factors such as information, capital, logistics, and brands into the grain production link through tax cuts and fee reductions, trying to promote grain production, purchase, storage, and processing to form the integrated development of the entire chain industry. We want to understand which has a greater impact on grain production efficiency between industry and service industry integrated with agriculture industry. The study on these issues will help the government to formulate industrial policies in a targeted manner. The further research will be more conducive to sustaining China’s grain security. Therefore, we adopt the aforementioned measurement method, using the degree of coupling coordination between agriculture and industry as a substitute variable for agricultural industrialization and the degree of coupling coordination between agriculture and service industry as a substitute variable for agricultural servicing. The results in Table 6 show the impact of agricultural industrialization and agricultural servicing on grain production efficiency. The results show that agricultural servicing has a more obvious effect on improving the efficiency of grain production. Therefore, the government should guide more factors in the service industry to flow into agriculture and strengthen the development of agricultural services, which will more effectively guarantee grain security.
Table 6.
Differences of industrial integration to grain production efficiency.
In order to verify that the improvement of grain production efficiency by industrial integration is achieved through the flow of factors, we conducted an empirical test of the mechanism from the perspective of the urban–rural gap. Due to the long-term dual structure of urban and rural areas in China, factor marginal return in cities is significantly higher than in rural areas. Various high-energy production factors are more likely to accumulate in urban areas. The grain production activities that rely on natural resources such as water and land are widely distributed in rural areas. Therefore, the impact of industrial integration on grain production efficiency is inseparable from the flow of urban and rural factors.
The gap in economic and social development between urban and rural areas can be measured from many aspects, among which income and consumption are more representative. As China’ government only counted the net income of farmers before 2014, but only the disposable income of farmers after 2014, the net income and the disposable income are not the same concept, which includes the part that will be used to purchase production materials in the future. The research from the income perspective will produce statistical bias, so we explore the impact of the urban–rural gap only from the perspective of consumption. Specifically, the ratio of urban and rural consumption levels is used as the mechanism variable. The regression results are shown in Table 7. Column 1 in Table 7 reports the impact of the urban–rural consumption gap on grain production efficiency. The regression coefficient of the urban–rural consumption gap is negative with the significance test passing, indicating that the regional urban–rural consumption gap can indeed restrain the grain production efficiency. As shown in Column 2, we continue to add the industrial integration variable, finding the coefficient sign and the significance of the urban–rural consumption gap variable on grain production efficiency have not changed. Subsequently, we added the cross-variables of urban–rural consumption gap and industrial integration on the basis of the benchmark model. As can be seen from Column 3, the cross-variable coefficient is negative with the significance test passing, showing that the urban–rural consumption gap can suppress industrial integration to improve the grain production efficiency. This shows that the urban–rural gap will hinder the factors interaction of urban and rural elements and thus have a negative impact on the improvement of grain production efficiency.
Table 7.
Mechanism analysis.
4. Discussion
According to the results of empirical research, industrial integration has a positive impact on grain production efficiency. This is as industrial integration is a process where different industrial entities undertake other industrial activities with each other, which is manifested in the grafting and reorganization of factors such as information, capital, and labor in different industries. The grain production is also composed of a series of processes which industrial integration can directly and indirectly change and promote. The direct impact is manifested in the infiltration of various factors in other industries. Additionally, it is foreign high-energy factors as a substitute for the low-energy factors in the original grain production links. As a consequence, continuous optimization of factors in the grain production link will realize the improvement of grain production efficiency [41]. The indirect impact is manifested in the synergy effect of the industrial chain through industrial integration. The interactive cooperation of different links in the industrial chain such as grain production, purchase, processing, and sales has continuously improved the social capital structure [42], information communication channels [43], and process interaction mode of the original industry chain [44], thereby indirectly increasing the efficiency of grain production.
According to further research conclusions, the integrated development of rural industries should be comprehensively promoted, especially the development of agricultural service industries. It is necessary to comprehensively deepen the integration of cultural industry, The tourism industry, information industry, and other industries break down barriers which impede the flow of factors among industries, weakening the boundaries of industrial development and reconstructing new models and new business forms of rural industrial development. In particular, agricultural logistics and information services should be actively developed in order to improve agricultural product logistics service capabilities and strengthen the application of information technology in the agricultural product industry chain. Of course, in order to ensure grain security sustainably, inward integration of rural industries is an excellent economic activity which helps broaden the development path of the transformation of grain production.
However, the existence of the urban–rural gap will make it difficult for high-quality factors to flow into the grain production link. Furthermore, this gap is not only due to geographical isolation, but also a difference in economic and social development. Therefore, how to alleviate the inhibitory effect of the urban–rural gap is very important. The urban–rural gap will hinder the effective flow of urban and rural factors [45]. The rural living environment should be improved. Education, medical, and health services, and urban and rural public services can be equalized. Moreover, the establishment of the agricultural production subsidy policy should be implemented to help farmers expand sales channels, enrich rural industrial formats, promote the integrated development of rural primary, secondary, and tertiary industries, and expand farmers’ income space through multiple channels. In this way, the urban–rural income gap will be further narrowed.
According to the theory of marginal productivity, the price of a factor is determined by its marginal production benefit. Therefore, the precondition that high-energy factors flow to the grain production link is to obtain higher factor returns than other industries. The endogenous capability of grain production should be strengthened accordingly. It is not only necessary to speed up land transfer and promote the land to flow to farmers with knowledge and technology, actively developing specialized services for grain production, but also a need to further implement the strategy of “hiding grain in technology”, using scientific and technological innovation to promote the improvement of grain production efficiency. At the same time, technology research should be carried out in the fields of breeding technology, water conservancy facilities, and agricultural machinery. Let advanced technology, such as artificial intelligence, blockchain, and cloud computing with grain production activities, make up for the shortcomings in the grain production process and continuously improving the overall grain production capacity.
All in all, industrial integration can affect the grain production process through the continuous penetration of various factors and the embedding of intermediate process. However, the impact of industrial integration on grain production efficiency will also be subject to other resistance. What affects all kinds of high-quality production factors to flow to the grain production link? How to let all kinds of high-quality production factors flow to the grain production link? In recent years, the COVID-19 pandemic has caused a global economic slowdown and even recession, which has also led to a deterioration in the grain security and nutritional status in many developing countries [46], exposing many problems in the grain security system. This shows that economic development has a great relationship with grain security. Improving the sustainability of grain security lies in transforming the existing grain security system and continuously improving grain security from the economic field to resist all kinds of factors that cause grain insecurity. In the future, we will carry out our research plan in these areas so as to reduce the risk of agricultural disasters to grain security and improve the grain production efficiency and stability.
5. Conclusions
Focusing on grain production efficiency, the study explored whether industrial integration could ensure the sustainability of grain security. The research results showed that industrial integration had a positive impact on improving the efficiency of grain production and helped ensure the sustainability of grain security. As China’s grain security faces some problems such as scarcity of water resources and soil resources, even labor shortages, improving the efficiency of grain production is the key to sustaining grain security.
First of all, we sorted out the relevant literature on grain production efficiency and found that it was to improve grain production efficiency, whether through process optimization or factor input. In essence, other industrial factors are embedded in the grain production links, so we had reason to believe that industrial integration would promote the improvement of grain production efficiency. To this end, we adopted the SFA method to measure the grain production efficiency and the method of coupling coordination degree to measure industrial integration. By establishing a panel tobit model, we verified that industrial integration can significantly promote the improvement of grain production efficiency. Subsequently, we conducted a heterogeneity test, showing that the impact of industrial integration on the grain production efficiency was increasing. We also found that the impact of industrial integration on the grain production efficiency was strongest in the central region, with the eastern region weakest. In addition, we also discussed the difference of agricultural industrialization and agricultural servicing on the grain production efficiency. The results showed that agricultural servicing was more conducive to improving the efficiency of grain production. We selected the integration of the secondary industry and the tertiary industry as instrumental variables, and thus checked the endogeneity of the model, which still shows that the model is robust and the conclusion is correct. Finally, this article discussed the conclusions and believed the reason that industrial integration can promote the efficiency of grain production is due to the penetration of other industrial factors into the grain production links. For this reason, we reversely verified the influence paths from the perspective of the urban–rural gap. The results showed that the urban–rural gap did hinder the role of industrial integration in promoting grain production efficiency.
Author Contributions
Conceptualization, C.C. and X.C.; methodology, C.C.; software, C.C.; validation, C.C. and X.C.; formal analysis, C.C.; investigation, C.C.; resources, C.C.; data curation, C.C.; writing—original draft preparation, C.C.; writing—review and editing, X.C.; visualization, C.C.; supervision, X.C.; project administration, X.C.; funding acquisition, C.C. All authors have read and agreed to the published version of the manuscript.
Funding
This research was funded by Postgraduate Research & Practice Innovation Program of Jiangsu Province, grant number KYCX20_1270, and General Project of Humanities and Social Sciences in Anhui Province, grant number SK2018B21.
Institutional Review Board Statement
Not applicable.
Informed Consent Statement
Not applicable.
Data Availability Statement
The data are available upon the request from the corresponding author.
Acknowledgments
Chen Cao acknowledges the financial support from Postgraduate Research & Practice Innovation Program of Jiangsu Province (KYCX20_1270). Chen Cao and Xueyun Chen acknowledges the financial support from General Project of Humanities and Social Sciences in Anhui Province (SK2018B21).
Conflicts of Interest
The authors declare no conflict of interest.
Appendix A
Table A1.
Multicollinearity test.
Table A1.
Multicollinearity test.
| VIF | |
|---|---|
| Integ | 3.01 |
| Inprice | 2.38 |
| Ingrainpro | 1.29 |
| Inagdp | 9.89 |
| Incity | 7.81 |
References
- Jiao, X.-q.; He, G.; Cui, Z.-l.; Shen, J.-b.; Zhang, F.-s. Agri-environment policy for grain production in China: Toward sustainable intensification. China Agric. Econ. Rev. 2018, 10, 78–92. [Google Scholar] [CrossRef]
- Wang, P.; Deng, X.; Jiang, S. Global warming, grain production and its efficiency: Case study of major grain production region. Ecol. Indic. 2019, 105, 563–570. [Google Scholar] [CrossRef]
- Zhang, Q.; Zhang, F.; Wu, G.; Mai, Q. Spatial spillover effects of grain production efficiency in China: Measurement and scope. J. Clean. Prod. 2021, 278, 121062. [Google Scholar] [CrossRef]
- Ji, C.; Guo, H.; Jin, S.; Yang, J. Outsourcing Agricultural Production: Evidence from Rice Farmers in Zhejiang Province. PLoS ONE 2017, 12, e0170861. [Google Scholar] [CrossRef]
- Chen, Y. Land outsourcing and labour contracting: Labour management in China’s capitalist farms. J. Agrar. Chang. 2019, 20, 238–254. [Google Scholar] [CrossRef]
- Liu, Z.; Yang, D.; Wen, T. Agricultural production mode transformation and production efficiency. China Agric. Econ. Rev. 2018, 11, 160–179. [Google Scholar] [CrossRef]
- Gold, A.; Gold, S. Drivers of Farm Efficiency and Their Potential for Development in a Changing Agricultural Setting in Kerala, India. Eur. J. Dev. Res. 2019, 31, 855–880. [Google Scholar] [CrossRef]
- Boshrabadi, H.M.; Villano, R.; Fleming, E. Technical efficiency and environmental-technological gaps in wheat production in Kerman province of Iran. Agric. Econ. 2010, 38, 67–76. [Google Scholar] [CrossRef]
- Piesse, J.; Doyer, T.; Thirtle, C.; Vink, N. The changing role of grain cooperatives in the transition to competitive markets in South Africa. J. Comp. Econ. 2005, 33, 197–218. [Google Scholar] [CrossRef]
- Zhu, S.; Xu, X.; Ren, X.; Sun, T.; Oxley, L.; Rae, A.; Ma, H. Modeling technological bias and factor input behavior in China’s wheat production sector. Econ. Model. 2016, 53, 245–253. [Google Scholar] [CrossRef]
- Jiang, W.; Liu, X.; Wang, X.; Yang, L.; Yin, Y. Improving Phosphorus Use Efficiency and Optimizing Phosphorus Application Rates for Maize in the Northeast Plain of China for Sustainable Agriculture. Sustainability 2019, 11, 4799. [Google Scholar] [CrossRef]
- Huang, W.; Jiang, L. Efficiency performance of fertilizer use in arable agricultural production in China. China Agric. Econ. Rev. 2018, 11, 52–69. [Google Scholar] [CrossRef]
- Christianson, C.B.; Vlek, P.L.G. Alleviating soil fertility constraints to food production in West Africa: Efficiency of nitrogen fertilizers applied to food crops. Fertil. Res. 1991, 29, 21–33. [Google Scholar] [CrossRef]
- Bezu, S.; Holden, S. Can food-for-work encourage agricultural production? Food Policy 2008, 33, 541–549. [Google Scholar] [CrossRef]
- Udry, C.; Hoddinott, J.; Alderman, H.; Haddad, L. Gender differentials in farm productivity: Implications for household efficiency and agricultural policy. Food Policy 2003, 20, 407–423. [Google Scholar] [CrossRef]
- Yang, J.; Wang, H.; Jin, S.; Chen, K.; Riedinger, J.; Peng, C. Migration, local off-farm employment, and agricultural production efficiency: Evidence from China. J. Product. Anal. 2016, 45, 247–259. [Google Scholar] [CrossRef]
- Ito, J.; Ni, J. Capital deepening, land use policy, and self-sufficiency in China’s grain sector. China Econ. Rev. 2013, 24, 95–107. [Google Scholar] [CrossRef]
- Hauknes, J.; Knell, M. Embodied knowledge and sectoral linkages: An input–output approach to the interaction of high- and low-tech industries. Res. Policy 2009, 38, 459–469. [Google Scholar] [CrossRef]
- Tang, Y.; Motohashi, K.; Hu, X.; Montoro-Sanchez, A. University-industry interaction and product innovation performance of Guangdong manufacturing firms: The roles of regional proximity and research quality of universities. J. Technol. Transf. 2019, 45, 578–618. [Google Scholar] [CrossRef]
- Neuwirth, R.J. Global Market Integration and the Creative Economy: The Paradox of Industry Convergence and Regulatory Divergence. J. Int. Econ. Law 2015, 18, 21–50. [Google Scholar] [CrossRef]
- Aaldering, L.J.; Song, C.H. Of leaders and laggards—Towards digitalization of the process industries. Technovation 2021, 105, 102211. [Google Scholar] [CrossRef]
- Sick, N.; Preschitschek, N.; Leker, J.; Bröring, S. A new framework to assess industry convergence in high technology environments. Technovation 2019, 84–85, 48–58. [Google Scholar] [CrossRef]
- Amir, R.; Halmenschlager, C.; Jin, J. R&D-induced industry polarization and shake-outs. Int. J. Ind. Organ. 2011, 29, 386–398. [Google Scholar] [CrossRef]
- Kwak, K.; Kim, W. Effect of service integration strategy on industrial firm performance. J. Serv. Manag. 2016, 27, 391–430. [Google Scholar] [CrossRef]
- Yang, Q.; Zhang, D. The influence of agricultural industrial policy on non-grain production of cultivated land: A case study of the “one village, one product” strategy implemented in Guanzhong Plain of China. Land Use Policy 2021, 108, 105579. [Google Scholar] [CrossRef]
- Olsen, R.J. Note on the Uniqueness of the Maximum Likelihood Estimator for the Tobit Model. Econom. J. Econom. Soc. 1978, 46, 1211–1215. [Google Scholar] [CrossRef]
- Greene, W. The behaviour of the maximum likelihood estimator of limited dependent variable models in the presence of fixed effects. Econom. J. 2004, 7, 98–119. [Google Scholar] [CrossRef]
- Banker, R.D. Maximum Likelihood, Consistency and Data Envelopment Analysis: A Statistical Foundation. Manag. Sci. 1993, 39, 1265–1273. [Google Scholar] [CrossRef]
- Clermont, M.; Schaefer, J. Identification of Outliers in Data Envelopment Analysis. Schmalenbach Bus. Rev. 2019, 71, 475–496. [Google Scholar] [CrossRef]
- Cullinane, K.; Song, D.-W. Estimating the Relative Efficiency of European Container Ports: A Stochastic Frontier Analysis. Res. Transp. Econ. 2006, 16, 85–115. [Google Scholar] [CrossRef]
- Cheng, Z.; Li, L.; Liu, J.; Zhang, H. Research on energy directed technical change in China’s industry and its optimization of energy consumption pattern. J. Environ. Manag. 2019, 250, 109471. [Google Scholar] [CrossRef] [PubMed]
- Zhou, L.; Turvey, C.G. Climate change, adaptation and China’s grain production. China Econ. Rev. 2014, 28, 72–89. [Google Scholar] [CrossRef]
- Battese, G.E.; Coelli, T.J. Prediction of firm-level technical efficiencies with a generalized frontier production function and panel data. J. Econom. 1988, 38, 387–399. [Google Scholar] [CrossRef]
- Wang, J.; Zhang, Z.; Liu, Y. Spatial shifts in grain production increases in China and implications for food security. Land Use Policy 2018, 74, 204–213. [Google Scholar] [CrossRef]
- Zhan, J.T.; Wu, Y.R.; Zhang, X.H.; Zhou, Z.Y. Why do farmers quit from grain production in China? Causes and implications. China Agric. Econ. Rev. 2012, 4, 342–362. [Google Scholar] [CrossRef]
- Park, A.; Jin, H.; Rozelle, S.; Huang, J. Market Emergence and Transition: Arbitrage, Transaction Costs, and Autarky in China’s Grain Markets. Am. J. Agric. Econ. 2002, 84, 67–82. [Google Scholar] [CrossRef]
- Flachaire, E. More Efficient Tests Robust to Heteroskedasticity of Unknown Form. Econom. Rev. 2005, 24, 219–241. [Google Scholar] [CrossRef]
- Cheng, L.; Zhang, S.; Lou, X.; Yang, Y.; Jia, W. The Penetration of New Generation Information Technology and Sustainable Development of Regional Economy in China—Moderation Effect of Institutional Environment. Sustainability 2021, 13, 1163. [Google Scholar] [CrossRef]
- Furtan, W.H.; Sauer, J. Determinants of Food Industry Performance: Survey Data and Regressions for Denmark. J. Agric. Econ. 2008, 59, 555–573. [Google Scholar] [CrossRef]
- Su, C.-W.; Khan, K.; Hao, L.-N.; Tao, R.; Peculea, A.D. Do house prices squeeze marriages in China? Econ. Res.-Ekon. Istraživanja 2020, 33, 1419–1440. [Google Scholar] [CrossRef]
- Chen, Y.; Li, X.; Wang, J. Changes and Effecting Factors of Grain Production in China. Chin. Geogr. Sci. 2011, 21, 676–684. [Google Scholar] [CrossRef]
- Silva, M.F. Cooperation, social capital and economic performance. Braz. J. Political Econ. 2006, 26, 345–363. [Google Scholar] [CrossRef]
- Crawford, V.P. New Directions for Modelling Strategic Behavior: Game-Theoretic Models of Communication, Coordination, and Cooperation in Economic Relationships. J. Econ. Perspect. 2016, 30, 131–150. [Google Scholar] [CrossRef][Green Version]
- Delgado, M.; Mills, K.G. The supply chain economy: A new industry categorization for understanding innovation in services. Res. Policy 2020, 49, 104039. [Google Scholar] [CrossRef]
- Young, A. Inequality, the Urban-Rural Gap, and Migration*. Q. J. Econ. 2013, 128, 1727–1785. [Google Scholar] [CrossRef]
- Kansiime, M.K.; Tambo, J.A.; Mugambi, I.; Bundi, M.; Kara, A.; Owuor, C. COVID-19 implications on household income and food security in Kenya and Uganda: Findings from a rapid assessment. World Dev. 2021, 137, 105199. [Google Scholar] [CrossRef] [PubMed]

Publisher’s Note: MDPI stays neutral with regard to jurisdictional claims in published maps and institutional affiliations. |
© 2021 by the authors. Licensee MDPI, Basel, Switzerland. This article is an open access article distributed under the terms and conditions of the Creative Commons Attribution (CC BY) license (https://creativecommons.org/licenses/by/4.0/).