
The Applicability of Remote Sensing Models of Soil Salinization Based on Feature Space


 , ,
, ,
Abstract
:1. Introduction
2. Related Work
3. Materials and Methods
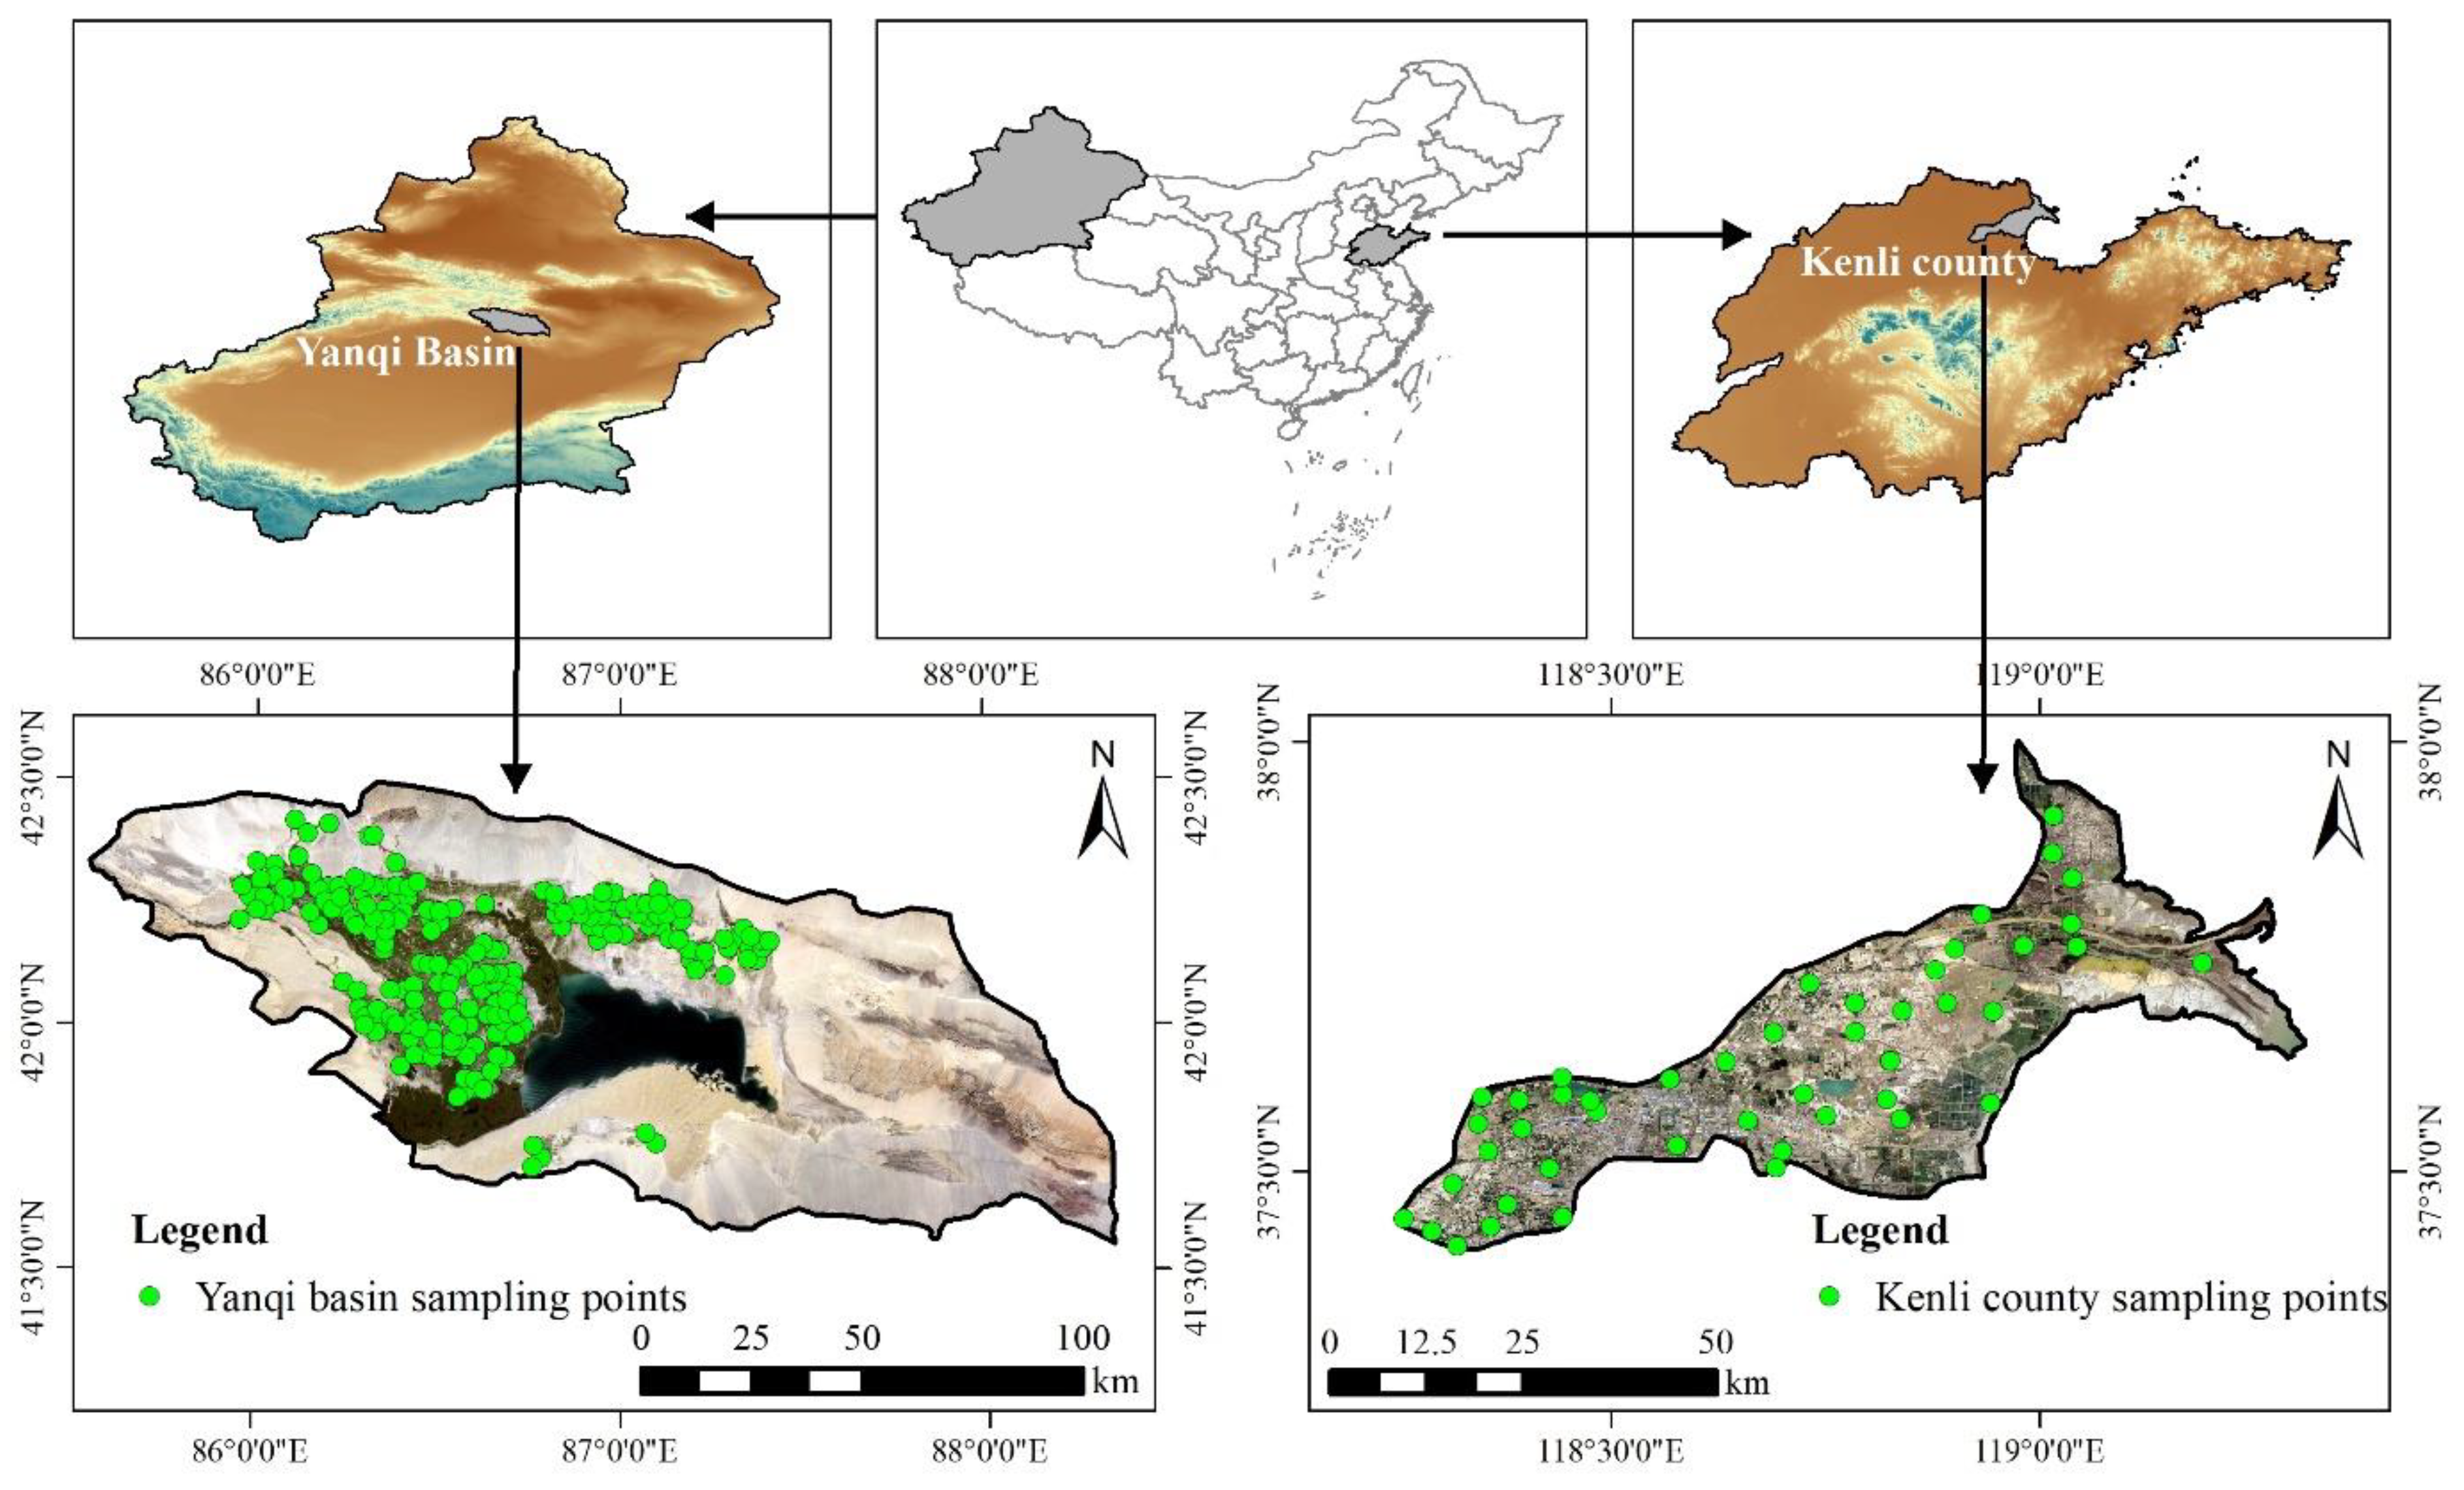
3.1. Overview of the Study Area
3.2. Data Sources
3.2.1. Remote Sensing Image Data
3.2.2. Field Sampling Data
3.3. Methods
3.3.1. Feature Parameter Extraction
Modified Soil-Adjusted Vegetation Index (MSAVI)
Albedo
Normalized Difference Vegetation Index (NDVI)
Salinity Index (SI)
3.3.2. Data Normalization Processing
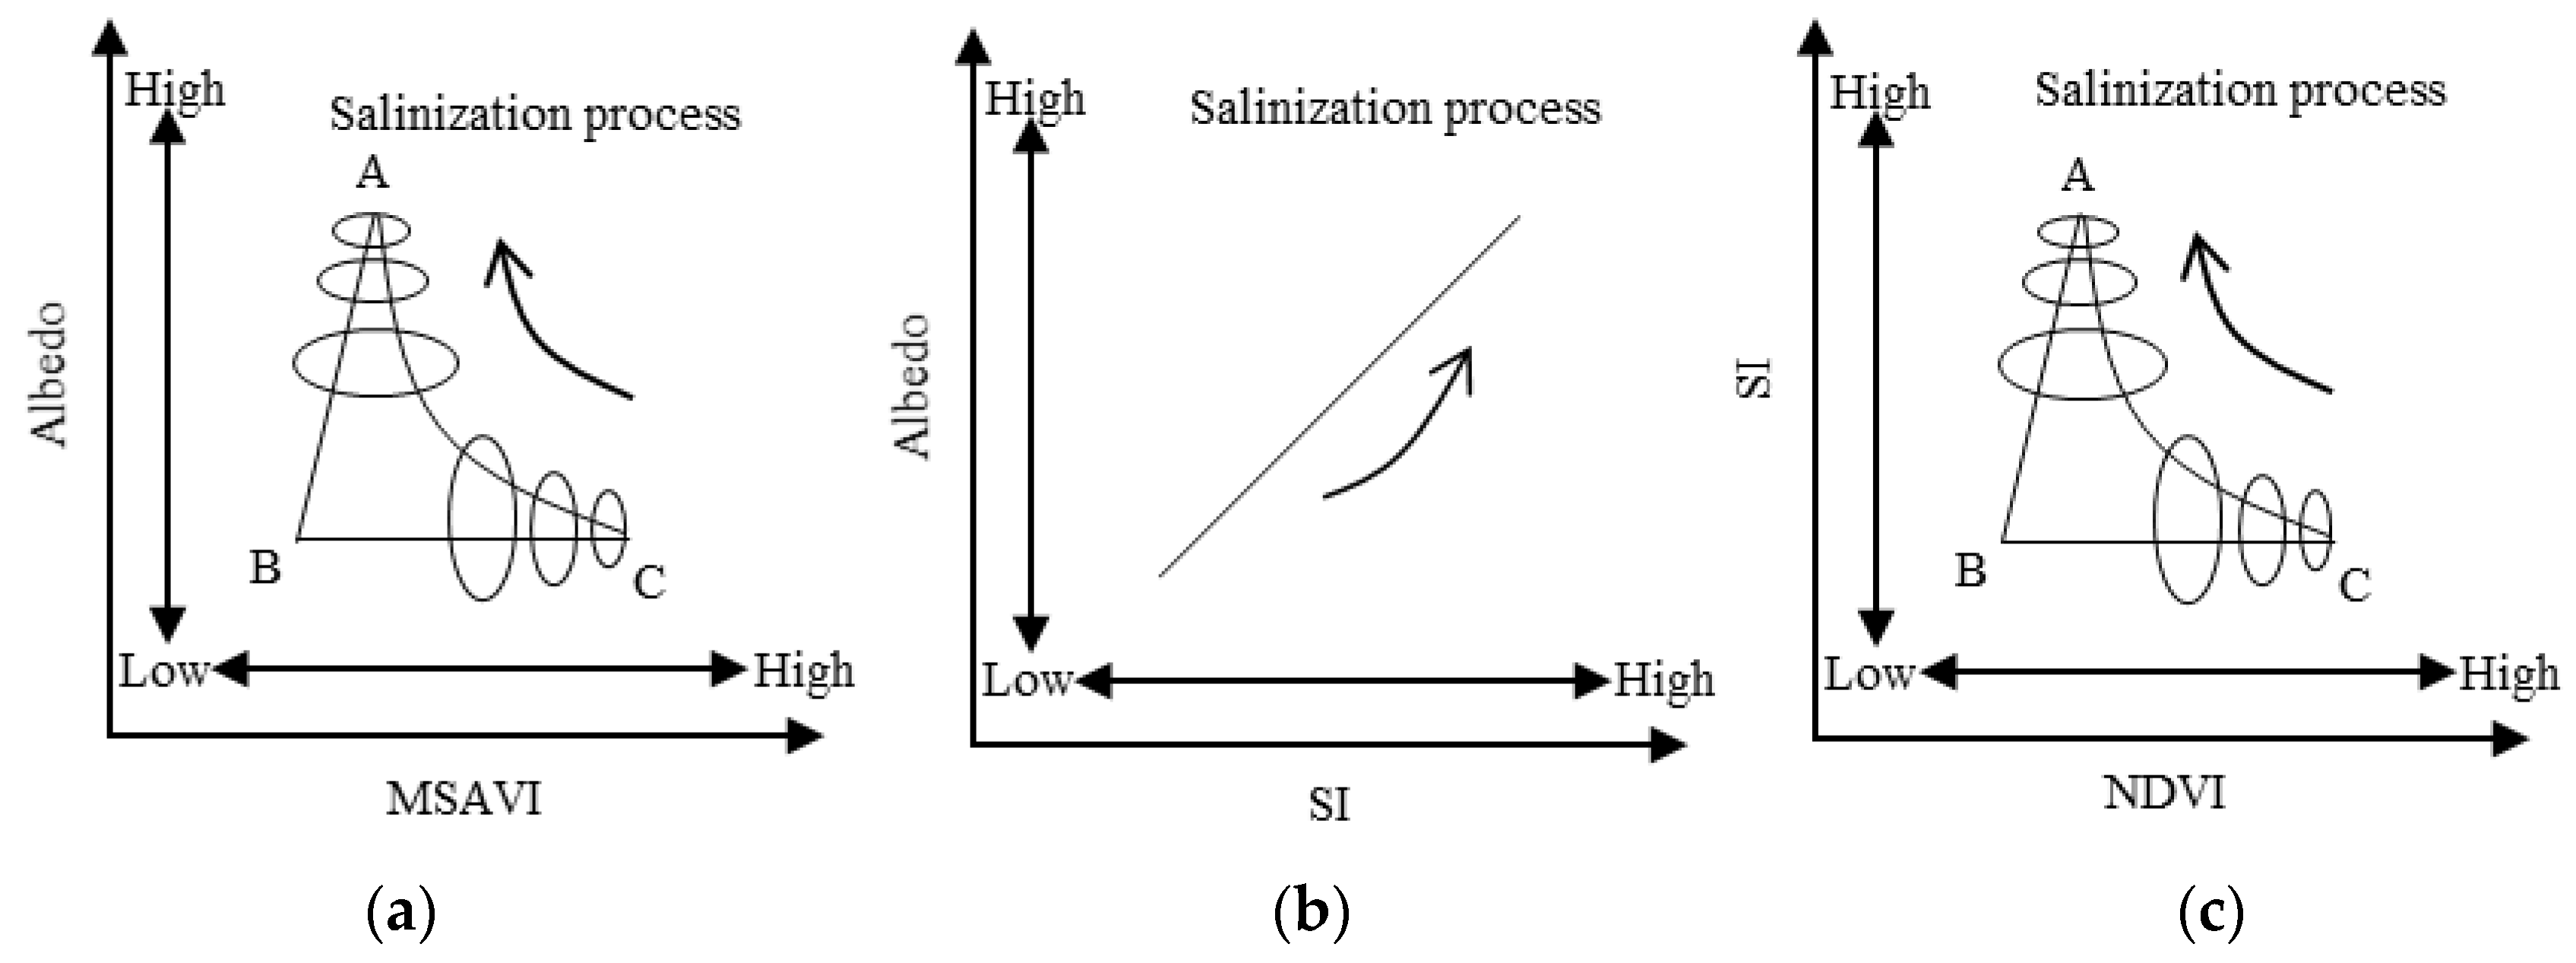
3.3.3. Feature–Space Principle
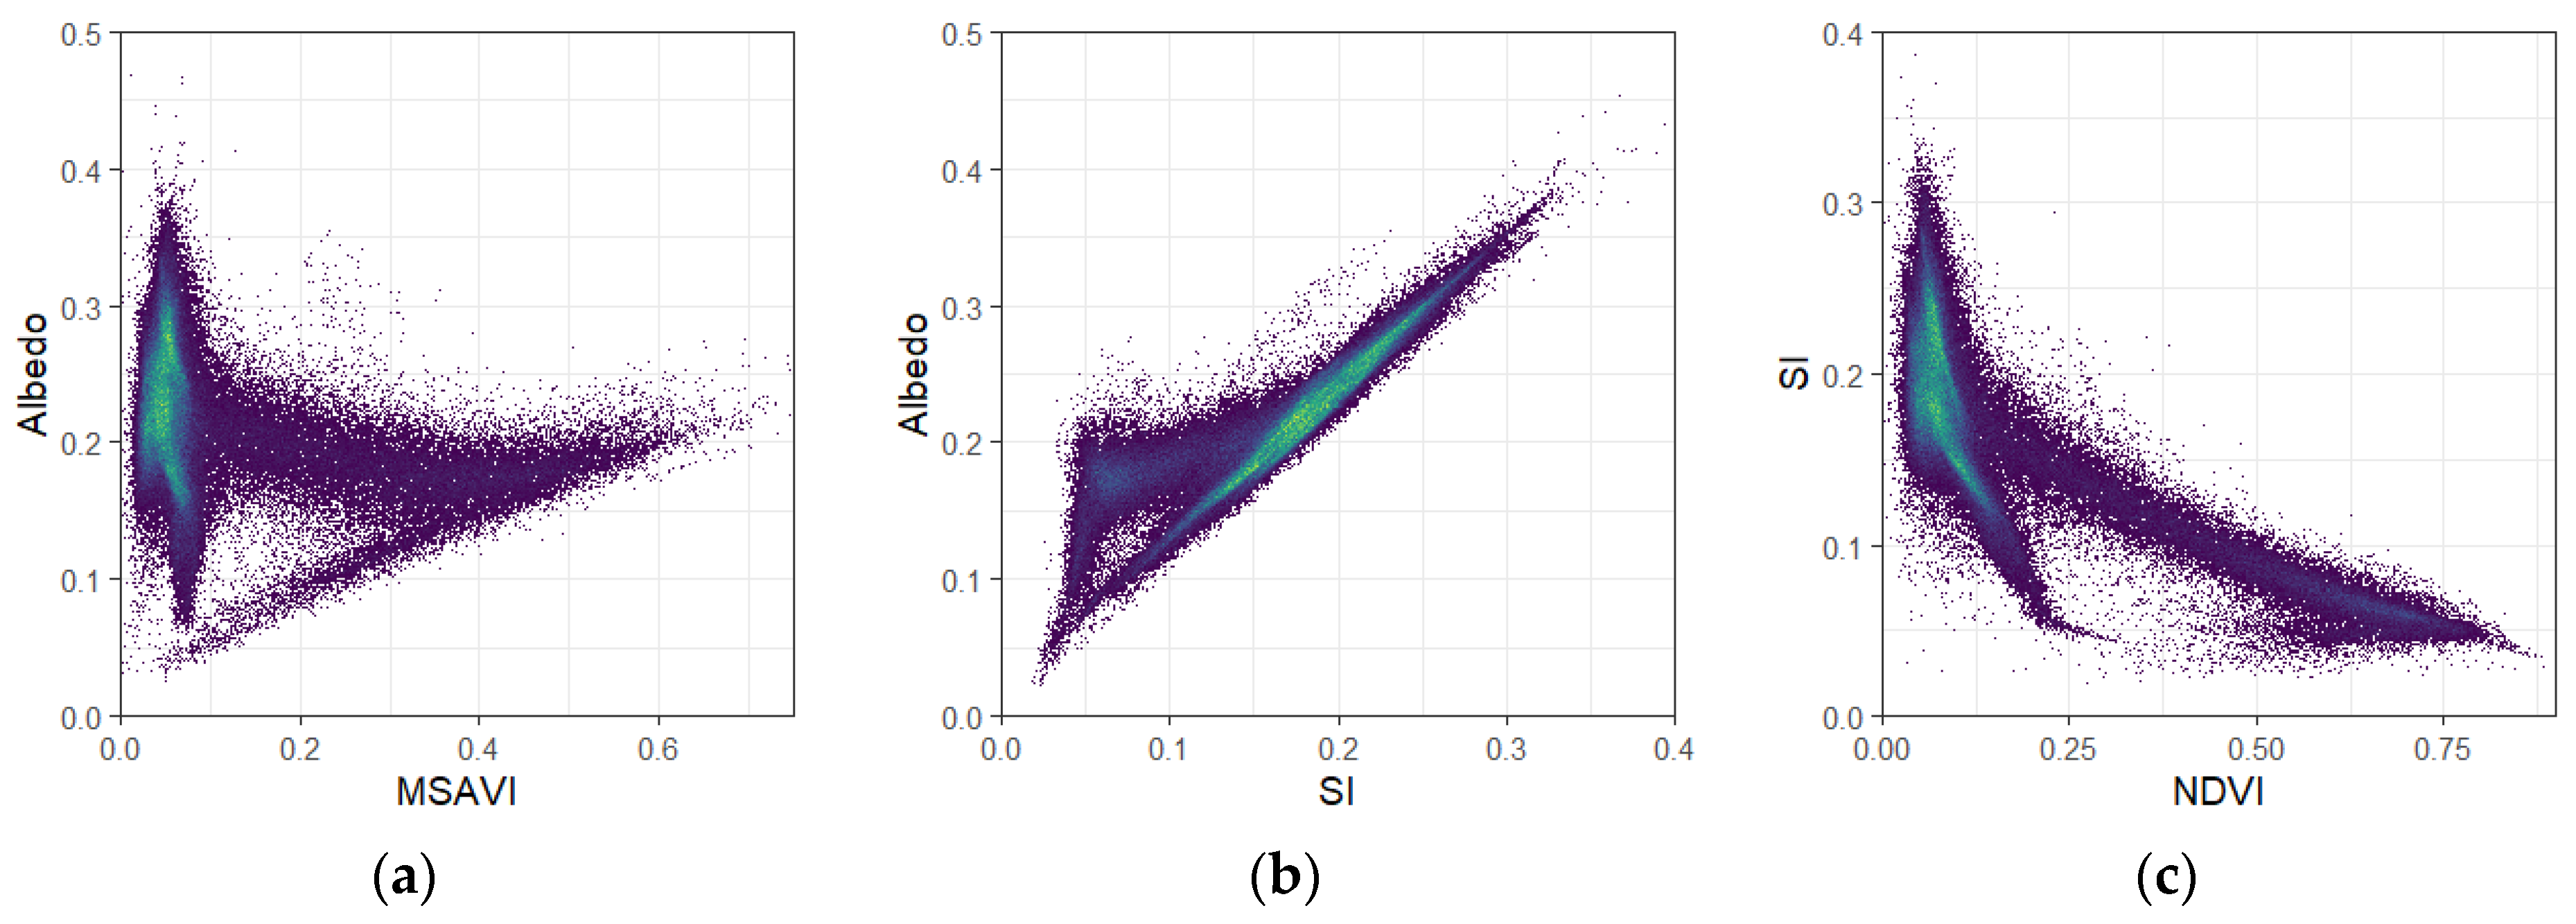
Albedo-MSAVI Feature Space
SI-Surface Albedo (SI-Albedo) Feature Space
SI-NDVI Feature Space
3.3.4. Construction of the Feature Space Inversion Models
Albedo-MSAVI Feature Space Inversion Model
SI-Albedo Feature Space Inversion Model
SI-NDVI Feature Space Inversion Model
4. Results
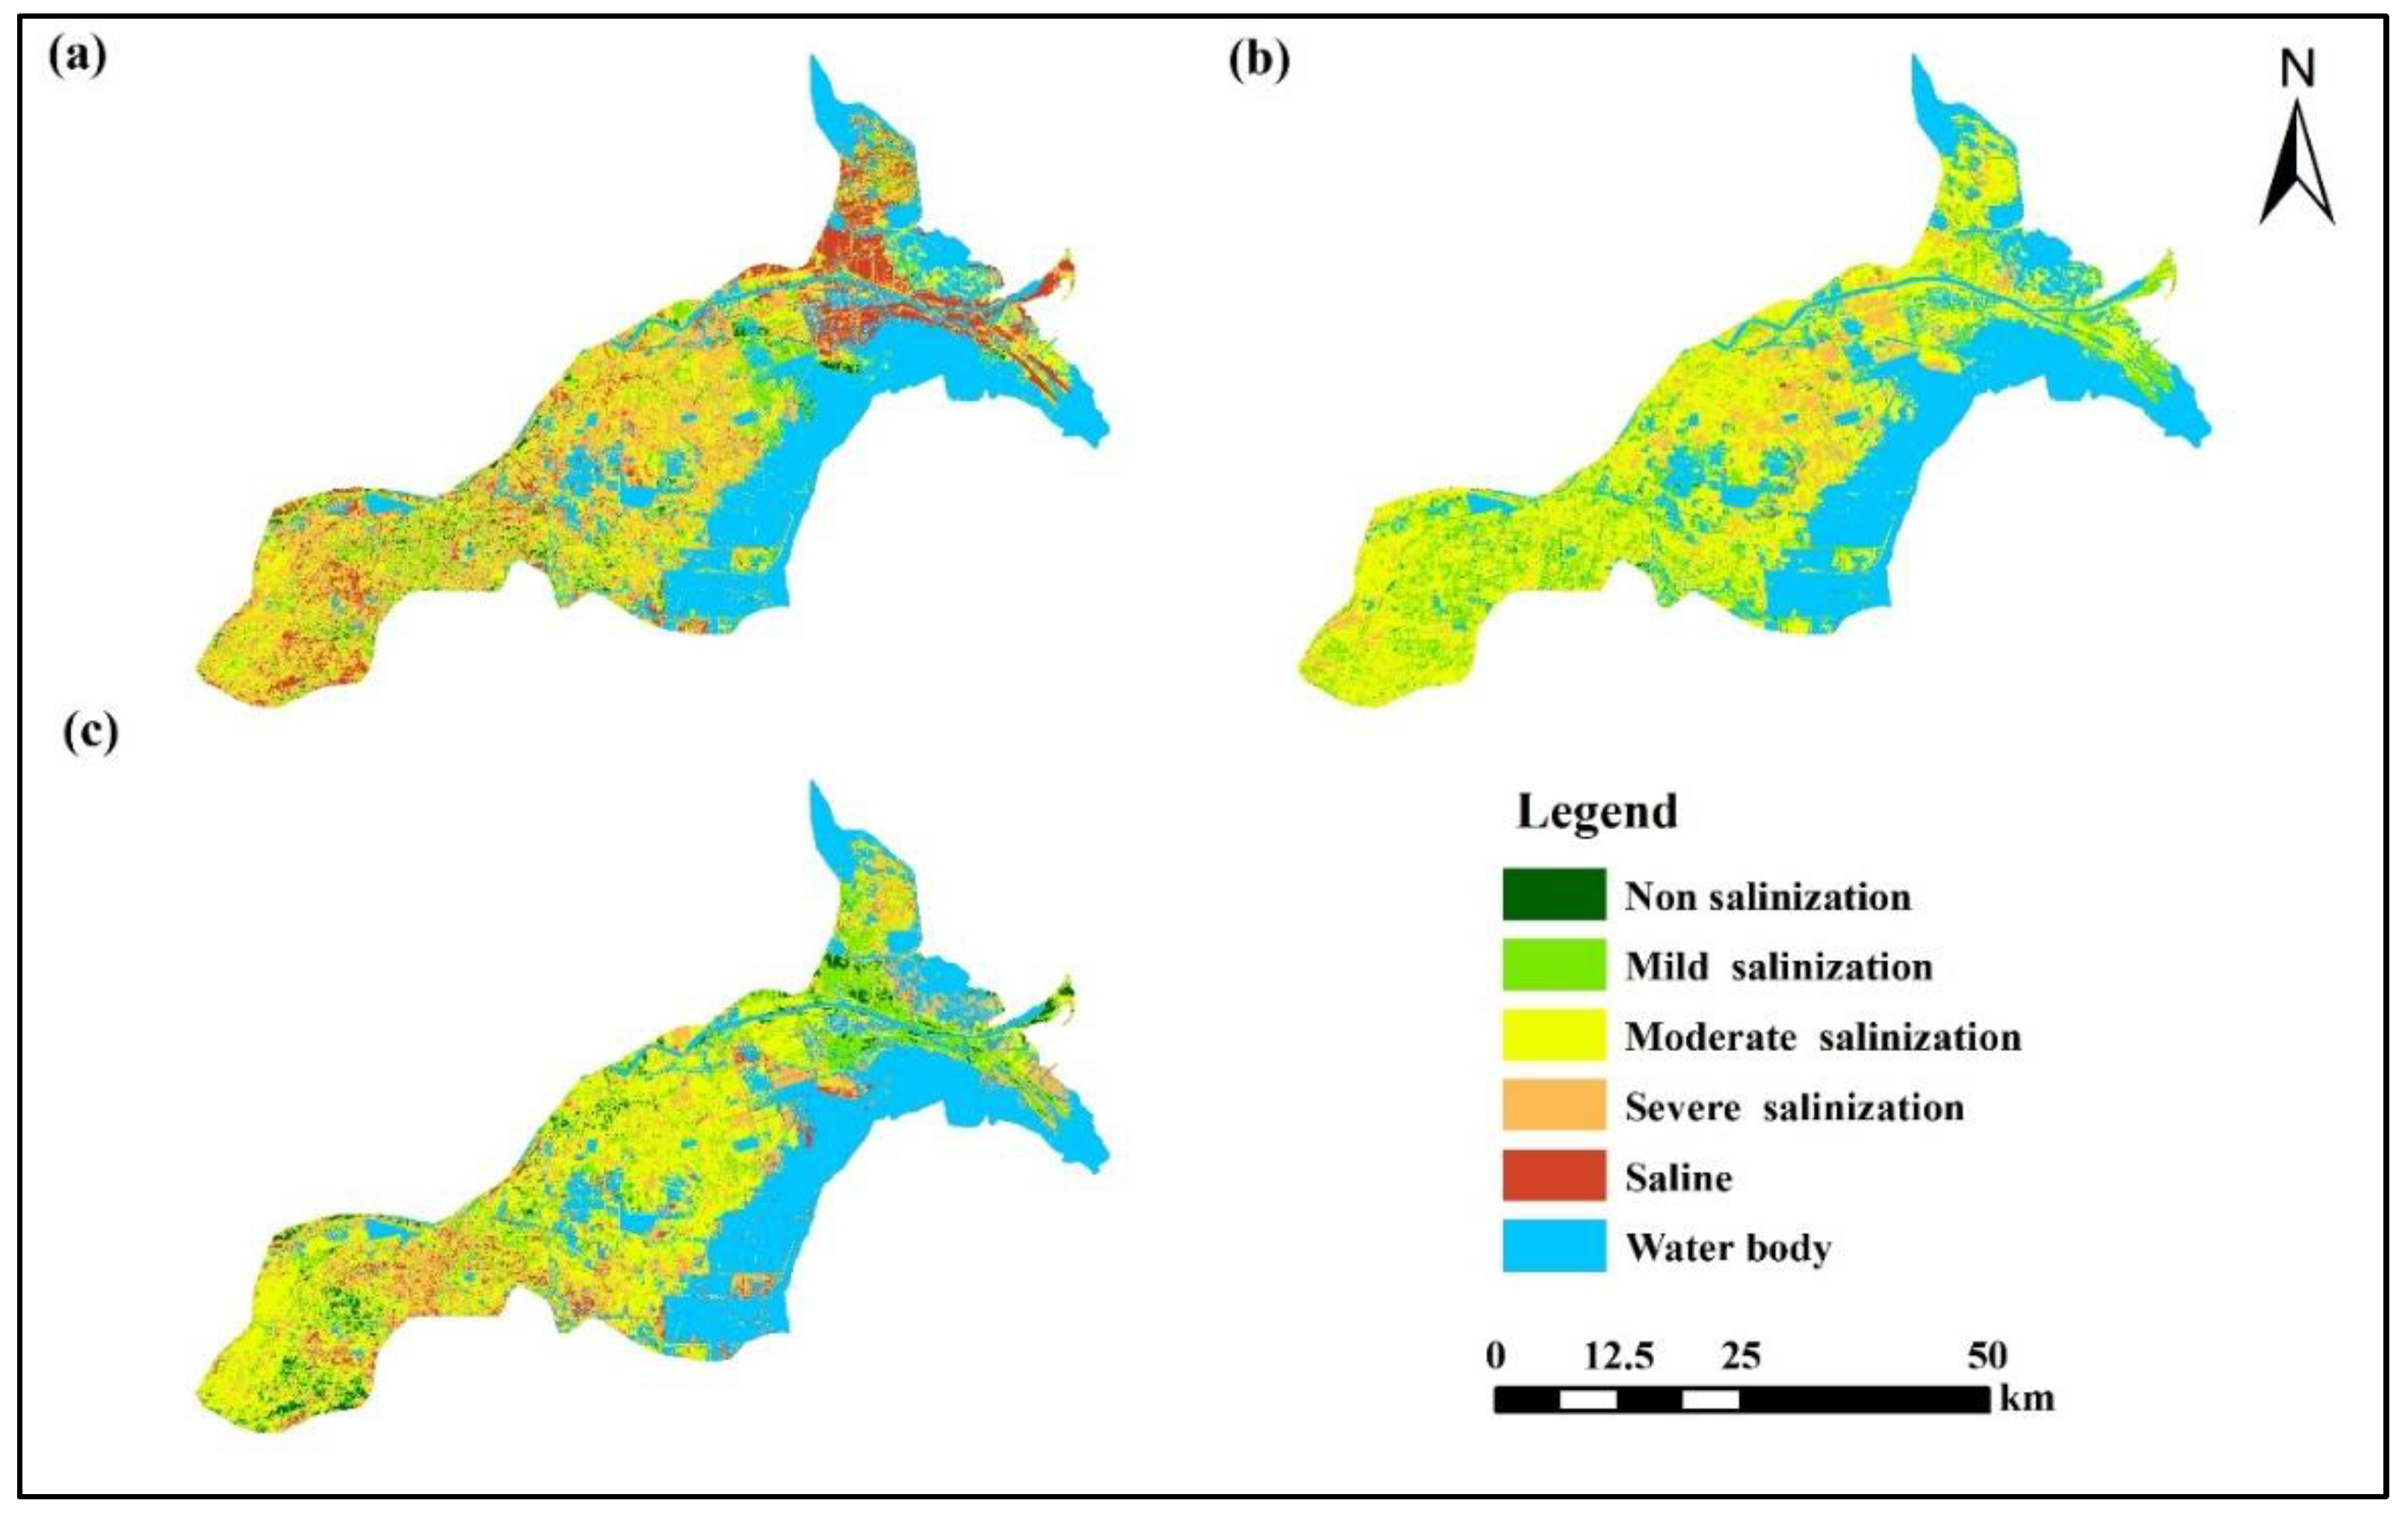
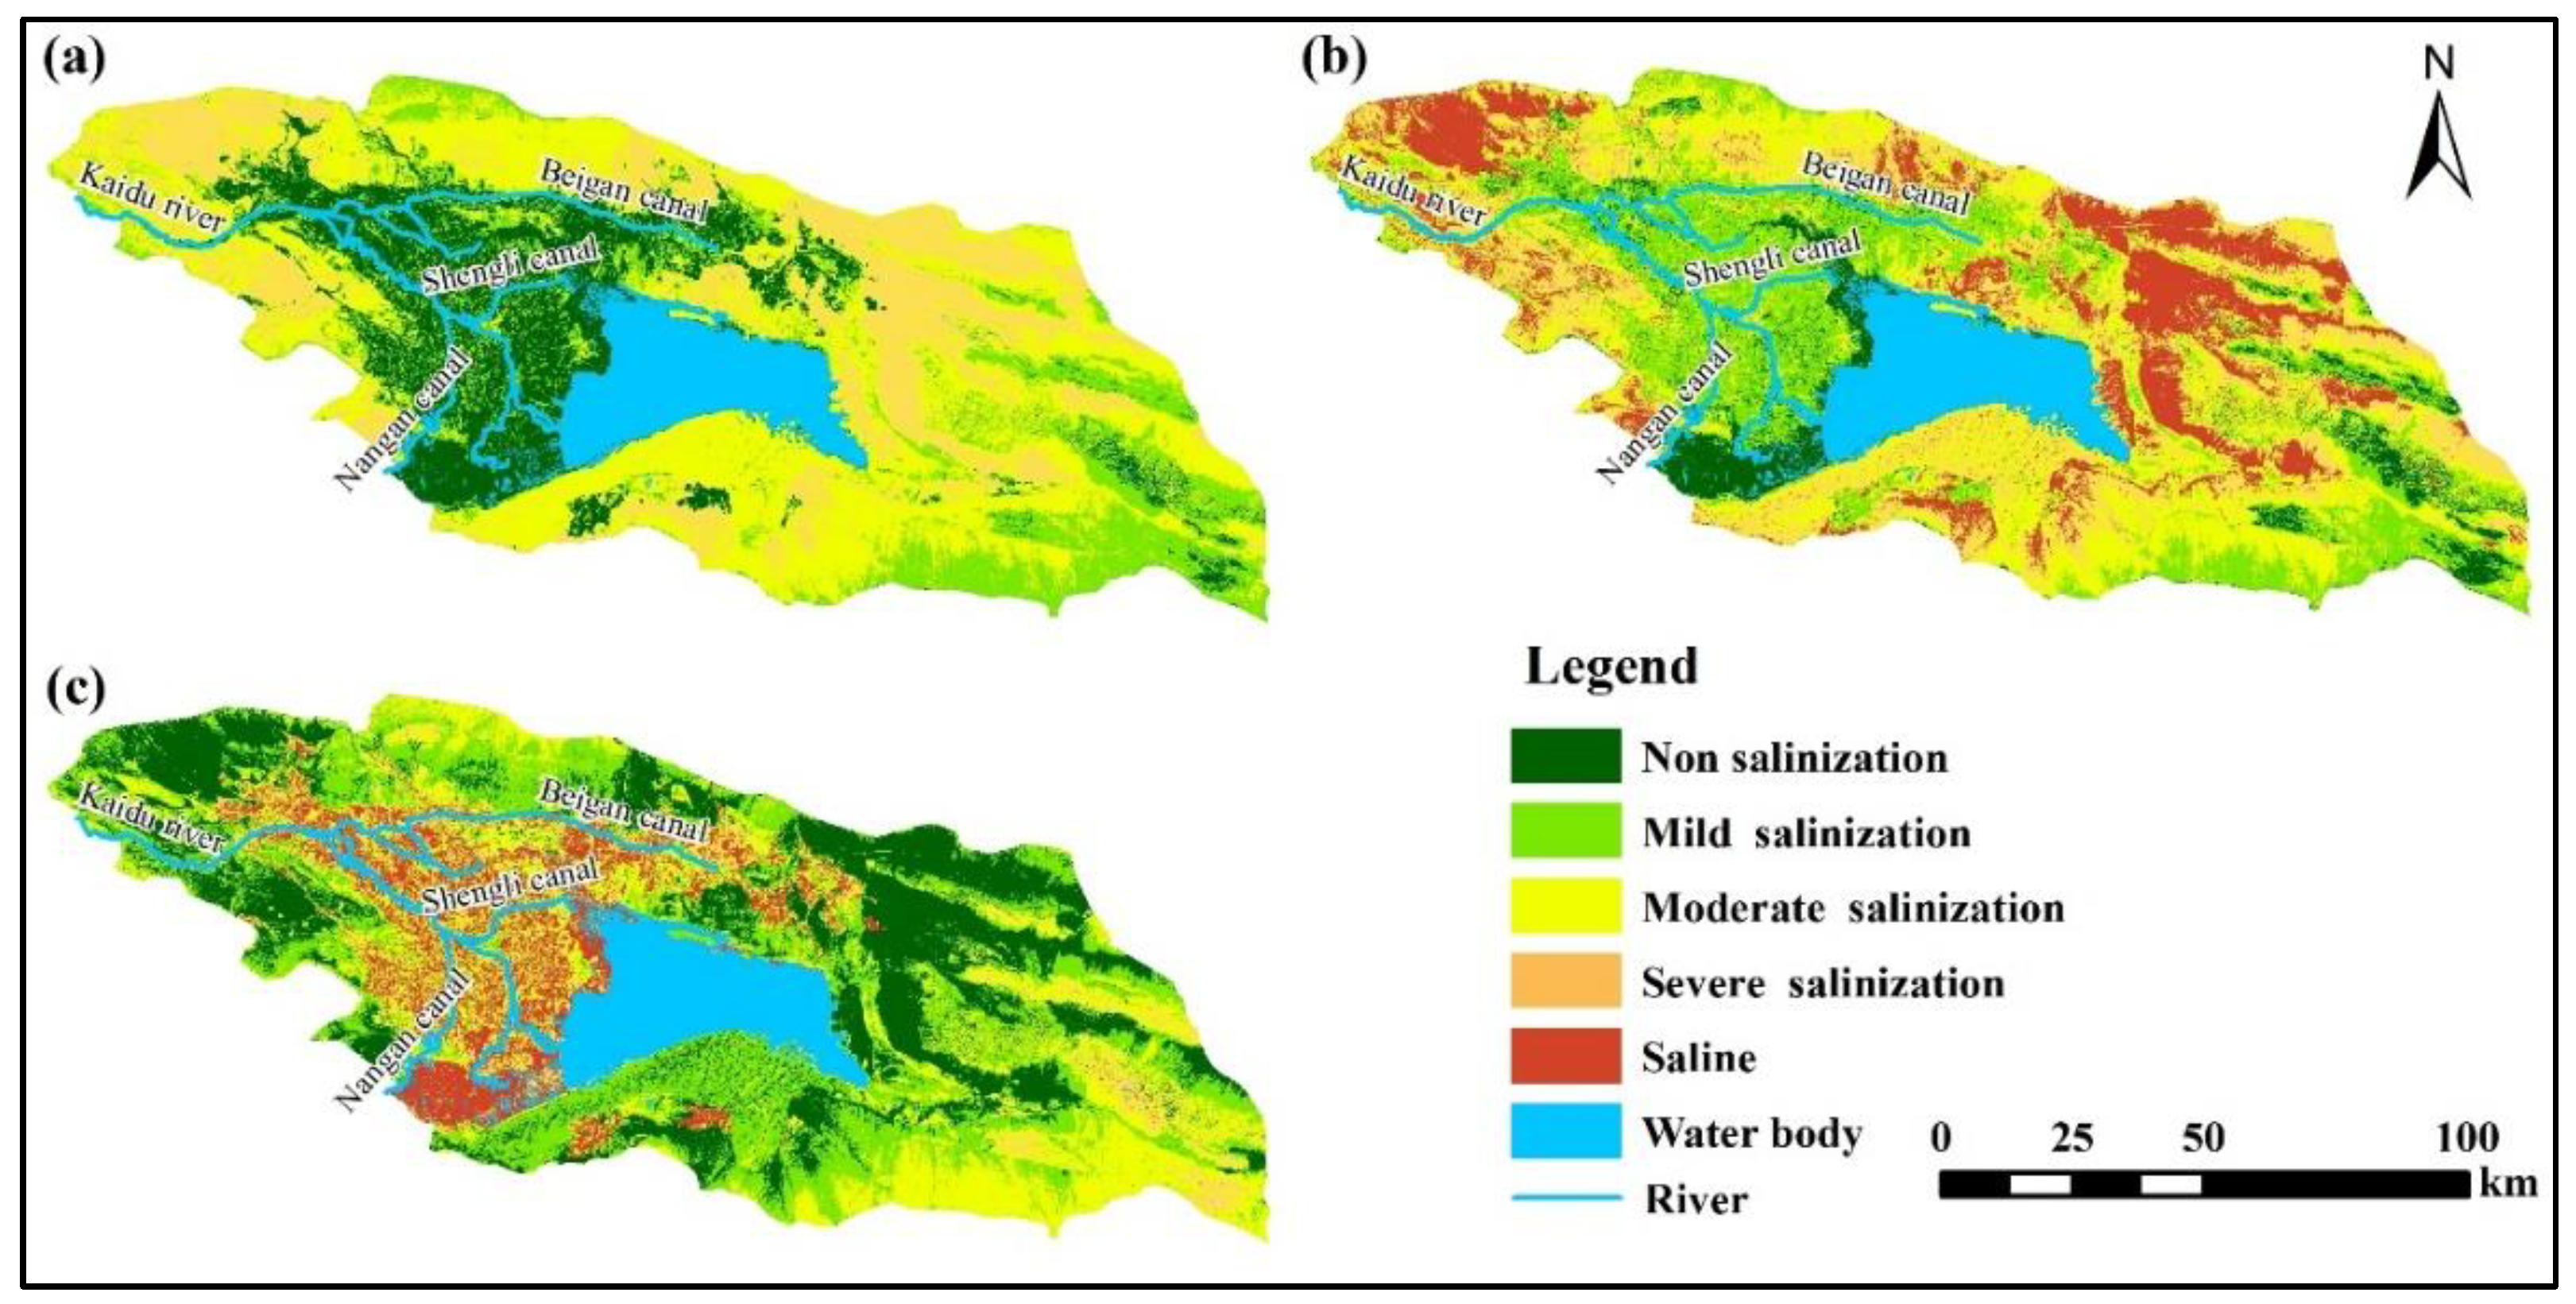
4.1. Inversion Results and Classifications
4.2. Model Accuracy Analysis
5. Discussion
5.1. Feature Space Model Construction and Analysis of Regional Applicability of Remote Sensing Models
5.2. Analysis of Salinization Distribution and Driving Factors and Suggestions for the Governance of Key Areas
6. Conclusions
Author Contributions
Funding
Institutional Review Board Statement
Informed Consent Statement
Data Availability Statement
Conflicts of Interest
References
- Periasamy, S.; Ravi, K.P. A novel approach to quantify soil salinity by simulating the dielectric loss of SAR in three-dimensional density space. Remote Sens. Environ. 2020, 251. [Google Scholar] [CrossRef]
- Perri, S.; Suweis, S.; Holmes, A.; Marpu, P.R.; Entekhabi, D.; Molini, A. River basin salinization as a form of aridity. Proc. Natl. Acad. Sci. USA 2020, 117, 17635–17642. [Google Scholar] [CrossRef]
- Jiang, C.; Zhang, H.; Zhao, L.; Yang, Z.; Wang, X.; Yang, L.; Wen, M.; Geng, S.; Zeng, Q.; Wang, J. Unfolding the effectiveness of ecological restoration programs in combating land degradation: Achievements, causes, and implications. Sci. Total Environ. 2020, 748. [Google Scholar] [CrossRef] [PubMed]
- Wang, H.; Jia, G. Satellite–based monitoring of decadal soil salinization and climate effects inasemi–arid region of China. Adv. Atmos. Sci. 2012, 29, 1089–1099. [Google Scholar] [CrossRef]
- Allbed, A.; Kumar, L. Soil salinity mapping and monitoring in arid and semi-arid regions using remote sensing technology: A review. Adv. Remote Sens. 2013, 2, 13. [Google Scholar] [CrossRef] [Green Version]
- Yang, C.; Lv, D.; Jiang, S.; Lin, H.; Sun, J.; Li, K.; Sun, J. Soil salinity regulation of soil microbial carbon metabolic function in the Yellow River Delta, China. Sci. Total. Environ. 2021, 790. [Google Scholar] [CrossRef] [PubMed]
- Zhang, H.; Li, Y.; Deng, H.W.; Li, H.; Zhang, X.X.; Zhao, L.; Xie, J. Soil salinization classification in Manas river basin of Xinjiang based on remote sensing images. J. Northwest A F Univ. Nat. Sci. Ed. 2013, 41, 153–158. [Google Scholar]
- Sahab, S.; Suhani, I.; Srivastava, V.; Chauhan, P.S.; Singh, R.P.; Prasad, V. Potential risk assessment of soil salinity to agroecosystem sustainability: Current status and management strategies. Sci. Total Environ. 2021, 764. [Google Scholar] [CrossRef]
- Ivushkin, K.; Bartholomeus, H.; Bregt, A.K.; Pulatov, A.; Kempen, B.; de Sousa, L. Global mapping of soil salinity change. Remote Sens. Environ. 2019, 231. [Google Scholar] [CrossRef]
- Rao, B.R.M.; Sharma, R.C.; Ravi Sankar, T.; Das, S.N.; Dwivedi, R.S.; Thammappa, S.S.; Venkataratnam, L. Spectral behaviour of salt-affected soils. Int. J. Remote Sens. 1995, 16, 2125–2136. [Google Scholar] [CrossRef]
- Wang, P.; Wang, L.; Leung, H.; Zhang, G. Super-Resolution Mapping Based on Spatial–Spectral Correlation for Spectral Imagery. IEEE Trans. Geosci. Remote Sens. 2020, 59, 2256–2268. [Google Scholar] [CrossRef]
- Brunner, P.; Li, H.; Kinzelbach, W.; Li, W. Generating soil electrical conductivity maps at regional level by integrating measurements on the ground and remote sensing data. Int. J. Remote Sens. 2007, 28, 3341–3361. [Google Scholar] [CrossRef]
- Madani, A.A. Soil Salinity Detection and Monitoring Using Landsat Data: A Case Study from Siwa Oasis, Egypt. GIScience Remote Sens. 2005, 42, 171–181. [Google Scholar] [CrossRef]
- Azabdaftari, A.; Sunar, F. Soil salinity mapping using multitemporal landsat data. The international archives of the photogrammetry. Int. Arch. Photogramm. Remote Sens. Spat. Inf. Sci. 2016, 41, B7. [Google Scholar] [CrossRef] [Green Version]
- Hoa, P.V.; Giang, N.V.; Binh, N.A.; Hai, L.V.H.; Pham, T.D.; Hasanlou, M.; Bui, D.T. Soil salinity mapping using SAR sentinel-1 data and advanced machine learning algorithms: A case study at ben tre province of the Mekong river delta (Vietnam). Remote Sens. 2019, 11, 128. [Google Scholar] [CrossRef] [Green Version]
- Farifteh, J.; Van der Meer, F.; Atzberger, C.; Carranza, E.J.M. Quantitative analysis of salt-affected soil reflectance spectra: A comparison of two adaptive methods (PLSR and ANN). Remote Sens. Environ. 2007, 110, 59–78. [Google Scholar] [CrossRef]
- Morgan, R.S.; El-Hady, M.A.; Rahim, I.S. Soil salinity mapping utilizing sentinel-2 and neural networks. Indian J. Agric. Res. 2018, 52, 524–529. [Google Scholar] [CrossRef]
- Wang, F.; Ding, J.L.; Wu, M.C. Remote sensing monitoring models of soil salinization based on NDVI-SI feature space. Trans. China Soc. Agric. Eng. 2010, 26, 168–173. [Google Scholar] [CrossRef]
- Ha, X.P.; Ding, J.L.; Tiyip, T.; Luo, J.Y.; Zhang, F. SI-Albedo space-based extraction of salinization information in Arid area. Acta Pedol. Sin. 2009, 46, 381–390. [Google Scholar]
- Ding, J.L.; Qu, J.; Sun, Y.M.; Zhang, Y.F. The retrieval model of soil salinization information in arid region based on MSAVI-WI feature space:A case study of the delta oasis in Weigan-Kuqa watershed. Geogr. Res. 2013, 32, 223–232. [Google Scholar] [CrossRef]
- Liu, Y.; Qian, J.; Yue, H. Comparison and evaluation of different dryness indices based on vegetation indices-land surface temperature/albedo feature space. Adv. Space Res. 2021, 68, 2791–2803. [Google Scholar] [CrossRef]
- Guo, B.; Yang, F.; Fan, Y.W.; Han, B.M.; Chen, S.T.; Yang, W.N. Dynamic monitoring of soil salinization in yellow river delta utilizing MSAVI–SI feature space models with Landsat images. Environ. Earth Sci. 2019, 78, 1–10. [Google Scholar] [CrossRef]
- Zhang, T.Y.; Wang, L.; Zeng, P.; Wang, T.; Geng, Y.; Wang, H. Soil Salinization in the Irrigated Area of the Manas River Basin Based on MSAVI-SI Feature Space. Arid Zone Res. 2016, 33, 499–505. [Google Scholar] [CrossRef]
- Li, P.; Chen, S.; Xu, C.; Du, J.; Wu, D. Sedimentary characteristics and spatial differentiations of the sedimentary facies in the Yellow River sub-delta lobes during the different historical periods. Reg. Stud. Mar. Sci. 2021, 47. [Google Scholar] [CrossRef]
- Li, Q.; Yang, P.N.; Peng, L.; Zhou, L.; Yusufujiang, R.; Wang, H.P.; Zhang, W.T. Study of the variation trend of evapotranspiration in the Yanqi Basin based on MOD16 data. Arid Zone Res. 2021, 38, 351–358. [Google Scholar]
- Zhang, W.T.; Wu, H.Q.; Gu, H.B.; Feng, G.-L.; Wang, Z.; Sheng, J.D. Variability of Soil Salinity at Multiple Spatio-Temporal Scales and the Related Driving Factors in the Oasis Areas of Xinjiang, China. Pedosphere 2014, 24, 753–762. [Google Scholar] [CrossRef]
- Peng, J.; Biswas, A.; Jiang, Q.; Zhao, R.; Hu, J.; Hu, B.; Shi, Z. Estimating soil salinity from remote sensing and terrain data in southern Xinjiang Province, China. Geoderma 2019, 337, 1309–1319. [Google Scholar] [CrossRef]
- Yang, X.; Wu, J.J.; Yan, F.; Zhang, J. Assessment of regional soil moisture status based on characteristics of surface temperature/vegetation index space. Acta Ecol. Sin. 2009, 29, 1205–1216. [Google Scholar] [CrossRef]
- Feng, J.; Ding, J.L.; Wei, W.Y. The study of Soil Salinization in Weigan and Kuqa Rivers oasis based on Albedo-MSAVI feature space. China Rural. Water Hydropower 2018, 2, 147–152. [Google Scholar]
- Wu, Z.P.; Wang, M.X.; Zhao, X. A study on desertification based on desertification difference index in Jinghe watershed. Bull. Soil Water Conserv. 2014, 34, 188–192. [Google Scholar] [CrossRef]
- Zhang, S.M.; Zhao, G.X.; Wang, Z.R.; Xiao, Y.; Lang, K. Remote sensing inversion and dynamic monitoring of soil salt in coastal saline area. J. Agric. Resour. Environ. 2018, 35, 349–358. [Google Scholar]
- Liu, G.; Li, J.; Zhang, X.; Wang, X.; Lv, Z.; Yang, J.; Shao, H.; Yu, S. GIS-mapping spatial distribution of soil salinity for Eco-restoring the Yellow River Delta in combination with Electromagnetic Induction. Ecol. Eng. 2016, 94, 306–314. [Google Scholar] [CrossRef]
- Lu, R.K. Analytical Methods of Soil Agricultural Chemistry; China Agricultural Science Press: Beijing, China, 2000; ISBN 7-80119-925-1. [Google Scholar]
- Department of Agriculture and Rural Affairs of Xinjiang. Soil of Xinjiang; Science Press: Beijing, China, 1996; ISBN 7030051998.
- Bian, L.; Wang, J.; Liu, J.; Han, B. Spatiotemporal Changes of Soil Salinization in the Yellow River Delta of China from 2015 to 2019. Sustainability 2021, 13, 822. [Google Scholar] [CrossRef]
- Khan, N.; Sato, Y. Monitoring hydro-salinity status and its impact in irrigated semi-arid areas using IRS-1B LISS-II data. Asian J. Geoinform. 2001, 1, 63–73. [Google Scholar]
- Wang, N.N.; Qi, W.; Wang, D.; Qin, T.T.; Lu, C. Spatial variability of soil nutrients and salinity in coastal saline-alkali land based on belt transect method. J. Appl. Ecol. 2012, 23, 1527–1532. [Google Scholar]
- Wang, Z.R.; Zhao, G.X.; Gao, M.X.; Jiang, S.Q.; Chang, C.Y.; Jia, J.C. Characteristics of soil water and salt spatial variations in the spring season in typical yellow river delta areas of Kenli county. China J. Agric. Resour. Env. 2015, 32, 154–161. [Google Scholar] [CrossRef]
- Wang, S.X.; Wu, B.; Yang, P.N.; Li, X.; Dong, X.G. Determination of the Ecological Groundwater Depth Considering Ecological Integrity over Oasis Irrigation Areas in the Yanqi Basin. Resour. Sci. 2011, 33, 422–430. [Google Scholar]
- Wang, W.W.; Mamattursun, E.; Atiyagul, R.; Anwar, M. Spatial variability and distribution pattern of soil salinity factors in topsoil of farmland in Yanqi Basin, Xinjiang. Agric. Res. Arid Areas 2019, 37, 195–201. [Google Scholar] [CrossRef]
- Jiang, H.; Yusufujiang, R.; Reyilai, K.; Adilai, W. Evaluation and Analysis of Soil Salinization in the Arid Zones based on Neural Network Model. J. Geo-Inf. Sci. 2017, 19, 983–993. [Google Scholar] [CrossRef]
- Wang, B.; Ma, X.W.; Shan, N.N.; Yang, T.; Liu, H.; Niu, X. The selection and application of saline alkali soil amendment in Xinjiang. J. Arid Land Resour. Environ. 2014, 28, 111–115. [Google Scholar]
- Wang, H.J.; Shi, J.C.; Zhang, H.L.; Sheng, J.D.; Ma, X.W.; Wu, H.Q.; Ren, S.T.; Zuo, Q.; Li, B.G. Soil salinity dynamic change and desalting effect under different improvement measures in severe salinity soil in Xinjiang. Trans. Chin. Soc. Agric. Eng. 2014, 30, 102–111. [Google Scholar] [CrossRef]


| Feature Space Inversion Model | Non-Salinization | Mild Salinization | Moderate Salinization | Severe Salinization | Saline Soil |
|---|---|---|---|---|---|
| Albedo-MSAVI | ≤0.85 | >0.85, ≤0.88 | >0.88, ≤0.89 | >0.89, ≤0.90 | >0.90, ≤0.98 |
| SI-Albedo | ≤0.17 | >0.17, ≤0.23 | >0.23, ≤0.29 | >0.29, ≤0.35 | >0.35, ≤0.60 |
| SI-NDVI | ≤0.56 | >0.56, ≤0.61 | >0.61, ≤0.66 | >0.66, ≤0.69 | >0.69, ≤0.90 |
| Feature Space Inversion Model | Non-Salinization | Mild Salinization | Moderate Salinization | Severe Salinization | Saline Soil |
|---|---|---|---|---|---|
| Albedo-MSAVI | ≤0.29 | >0.29, ≤0.44 | >0.44, ≤0.64 | >0.64, ≤0.87 | >0.87, ≤1.40 |
| SI-Albedo | ≤0.50 | >0.50, ≤0.72 | >0.72, ≤0.93 | >0.93, ≤1.15 | >1.15, ≤1.41 |
| SI-NDVI | ≤0.32 | >0.32, ≤0.57 | >0.57, ≤0.76 | >0.76, ≤0.93 | >0.93, ≤1.19 |
| Study Areas | Model | Correct Classification | Wrong Classification | Overall Accuracy |
|---|---|---|---|---|
| Kenli County | Albedo-MSAVI | 39 | 8 | 82.9% |
| SI-Albedo | 41 | 6 | 87.2% | |
| SI-NDVI | 38 | 9 | 80.9% | |
| Yanqi Basin | Albedo-MSAVI | 185 | 26 | 87.6% |
| SI-Albedo | 197 | 14 | 93.3% | |
| SI-NDVI | 169 | 42 | 80.1% |
Publisher’s Note: MDPI stays neutral with regard to jurisdictional claims in published maps and institutional affiliations. |
© 2021 by the authors. Licensee MDPI, Basel, Switzerland. This article is an open access article distributed under the terms and conditions of the Creative Commons Attribution (CC BY) license (https://creativecommons.org/licenses/by/4.0/).
Share and Cite
Liu, J.; Zhang, L.; Dong, T.; Wang, J.; Fan, Y.; Wu, H.; Geng, Q.; Yang, Q.; Zhang, Z. The Applicability of Remote Sensing Models of Soil Salinization Based on Feature Space. Sustainability 2021, 13, 13711. https://doi.org/10.3390/su132413711
Liu J, Zhang L, Dong T, Wang J, Fan Y, Wu H, Geng Q, Yang Q, Zhang Z. The Applicability of Remote Sensing Models of Soil Salinization Based on Feature Space. Sustainability. 2021; 13(24):13711. https://doi.org/10.3390/su132413711
Chicago/Turabian StyleLiu, Jing, Li Zhang, Tong Dong, Juanle Wang, Yanmin Fan, Hongqi Wu, Qinglong Geng, Qiangjun Yang, and Zhibin Zhang. 2021. "The Applicability of Remote Sensing Models of Soil Salinization Based on Feature Space" Sustainability 13, no. 24: 13711. https://doi.org/10.3390/su132413711
APA StyleLiu, J., Zhang, L., Dong, T., Wang, J., Fan, Y., Wu, H., Geng, Q., Yang, Q., & Zhang, Z. (2021). The Applicability of Remote Sensing Models of Soil Salinization Based on Feature Space. Sustainability, 13(24), 13711. https://doi.org/10.3390/su132413711