Article

Thermodynamic and Kinetic Description of the Main Effects Related to the Memory Effect during Carbon Dioxide Hydrates Formation in a Confined Environment

1
Engineering Department, University of Perugia, 93, 06125 Perugia, Italy
2
CAS Key Laboratory of Experimental Study under Deep-Sea Extreme Conditions, Institute of Deep-Sea Science and Engineering, Chinese Academy of Sciences, Sanya 572000, China
3
Institute of Deep-Sea Science and Engineering, University of Chinese Academy of Sciences, Beijing 100049, China
*
Author to whom correspondence should be addressed.
Sustainability 2021, 13(24), 13797; https://doi.org/10.3390/su132413797
Submission received: 14 November 2021 / Revised: 6 December 2021 / Accepted: 9 December 2021 / Published: 14 December 2021

Abstract

:
This article consists of an experimental description about how the memory effect intervenes on hydrates formation. In particular, carbon dioxide hydrates were formed in a lab–scale apparatus and in presence of demineralized water and a pure quartz porous medium. The same gas-water mixture was used. Half of experiments was carried out in order to ensure that the system retained memory of previous processes, while in the other half, such effect was completely avoided. Experiments were characterized thermodynamically and kinetically. The local conditions, required for hydrates formation, were compared with those of equilibrium. Moreover, the time needed for the process completion and the rate constant trend over time, were defined. The study of these parameters, together with the observation that hydrates formation was quantitatively similar in both types of experiments, allowed to conclude that the memory effect mainly acted as kinetic promoter for carbon dioxide hydrates formation.

1. Introduction

Gas hydrates are ice-like solid crystalline compounds. In nature, the structures are formed with water molecules, which are commonly referred as “hosts”. These structures are filled with gaseous molecules, named “guests” [1]. Seven different typologies of structure were proved possible to exist; however only three of them were found in nature [2]: the cubic Structure I (sI), the cubic Structure II (sII) and the hexagonal Structure H (sH). The first structure contains two small pentagonal dodecahedrons (512) and six tetrakaidecahedrons (14-hedra, 51262). It is the most studied and experimental replied structure, because involves as guest compound both methane and carbon dioxide. More in general, it forms in presence of gaseous molecules having diameters ranging from 4.2 to 6 Å. The second crystalline reticulate is made with sixteen cavities 512 and eight tetrakaidecahedrons (16-hedra, 51264). It can host gaseous molecules having diameter lower than those included in sI and also higher, in the range about 6–7 Å. Typical example of guest molecules are oxygen, nitrogen, argon (small size molecules) and propane, butane and hydrocarbon gas mixtures (large size molecules). Finally, the third option is based on three 512 cages, two irregular dodecahedrons (435663) and one tetrakaidecahedron (51268). This latter structure can contain molecules with diameter larger than 9 Å, for instance, it may encage adamantane and neohexane. To do this, it also needs to involve small-size molecules, required to reach a stable configuration for the crystal, such as methane, xenon and hydrogen sulfide.
Probably the most interesting option, for natural gas hydrate exploitation, consists of the possibility of replacing methane with carbon dioxide molecules, thus allowing, at the same time, three crucial goals: recover methane, store carbon dioxide in a permanent form and preserve natural deposits by avoiding the dissociation of water cages [3]. Theoretically, the exchange ratio, between methane and carbon dioxide molecules, is equal to one. However, this value cannot be concretely reached in nature. In the cubic sI, methane molecules can fill both the small 512 and the large 51262 cages [4,5]; differently, carbon dioxide molecules can enter only in the second type of cage. It means that, in replacement processes, the maximum efficiency is approximately equal to 75%. Higher efficiencies can be reached by using flue–gas mixtures instead of pure carbon dioxide, thanks to the ability of nitrogen to replace methane molecules in the small cages.
Natural gas hydrates reservoirs were found worldwide, where the conditions were suitable for their formation and stability. Up to 97% of known reservoirs is sited in deep marine sediments, due to the contemporary presence of relatively high pressures and low temperatures [6]. The remaining 3% exists in permafrost regions. It is considered as an alternative energy source, which may counterbalance the continuously growing of the energy demand and the contemporary depletion of fossil fuel sources. Moreover, the possibility of performing and even improving the recovery of methane with carbon dioxide utilization and permanent storage, makes this source a potential leading parameter for the transition towards RES. However, the current technologies are still far from becoming commercially attractive and competitive. The main issues stay in the geography and morphology of sediments, the problems of heat and mass transfer into deposits, the environmental concerning and, clearly, the costs currently required for hydrates exploitation.
All these reasons explain the relevancy of further scientific efforts in better understanding the hydrate formation and dissociation mechanism, the influence of external elements on the process (sediments, water composition, and so on) and the intrinsic properties of the process, such as its stochastic nature (mainly during the initial nucleation phase), the memory effect and the anomalous self-preservation.
This article aims to experimentally describe two of these key elements, in particular, hydrates were formed within a small-size porous medium and tests were carried out alternatively with and without the contribution of the memory effect.
About the porous medium, the effect of confinement on the thermodynamic properties of hydrates formation and dissociation, has been widely explored in the past decades. In 1992, Handa and Stupin observed and quantified the inhibiting effect, associated to a mesoporous silica sediment, on hydrates dissociation [7]. The same inhibiting action was found and documented in several following studies [8,9,10,11,12,13,14,15,16,17]. Also theoretical studies were carried out to explained the inhibition due to porous media [18,19,20]. In particular, a modified version of the van der Waals-Platteeuw-based thermodynamic model was used [21,22,23]. Such modification consisted of considering the reduction of the water activity due to the presence of the porous medium [24,25,26,27].
Conversely, several researchers asserted that porous media can be able to preserve hydrates structure, thus hindering their dissociation. Ullerich and colleagues proved that, in presence of a porous medium, water molecules produce a thin layer on the surface of the sediment, which drastically lowers the hydrates dissociation rate [28,29]. Katsuki and colleagues studied methane hydrates dissociation in a glass micro model [30]. They concluded that the release methane molecules do not compose a vapour phase over the remaining water cages, they diffuse in water and quickly moved to the gas phase. The hydrate structures close to the gaseous phase dissociate first; conversely, if structures are in contact with the liquid phase, their dissociation may be temporarily stopped [31].
The hydrates growth in correspondence of the water-guest interface has been widely studied in the recent years [32,33,34]. These studies helped in producing a physical picture of phenomena which commonly occur upon hydrates formation and growth on the water surface [32]. For instance, it was deinitively established that, when gas hydrates are formed in unstirred systems, hydrates preferentially form at the water-guest interface and form a thin film which covers such interface.
Filarski and colleagues tested the effect of differently modified particle beds on methane hydrate formation [35]. They concluded that these fixed bed systems are able to compete with an optimized stirred reactor, but it’s necessary that the fixed bed is slightly hydrophobic to achieve a high conversion of water into hydrates.
Em and co-workers verified that the improvement in the process kinetics, associated to the presence of a porous medium, allows to reach similar results in terms of water and gas conversion into hydrate, even at lower supercooling degrees [36].
When gas hydrates are formed two times consecutively with the same gas and water mixture, the formation process will occur faster during the second attempt. This phenomenon is referred as “memory effect”. Numerous researches confirmed that hydrate dissociated solutions allow to faster and more massive formation of hydrates than fresh solutions [37,38]. Two different theories were elaborated to explain the memory effect. The first hypothesis is based on the permanence of residual structures in water, while the second of them considers the permanence of hydrate crystallites diffused in the hydrate dissociated solution [39]. The first description of such phenomenon dates back to approximately 130 years ago [40,41]; since its discovery, the memory effect was found to be a crucial parameter for the feasibility of hydrates exploitation in natural reservoirs [42]. The type of guest compound present into water cages may affect the properties associated to the memory effect. Takeya and co-workers described it during carbon dioxide hydrates formation and concluded that it persists only at melting temperatures lower than 298 K [43]. Similar conclusions were possible also for methane hydrates [44]. Also time was proved to be crucial in the permanence of such effect: the system retain memory of previous formation of hydrates only if hydrates are decomposed at superheating temperatures, about 2–4 °C above the equilibrium, for less than two hours [45]. The time factor is probably the reason why several researchers asserted that memory effect might remain in the system, even when dissociation temperatures equal or slightly above 298 K are fixed [46,47]. In addition to the type of guest compound, time and melting temperature, also the porous medium can make changes in the memory of the system. According to this, several researchers wrote about the so-called “impurity Imprinting Theory” [48].
In this research, a comparison between carbon dioxide hydrates formation and dissociation, carried out respectively in presence and in absence of memory effect, was made. As previously explained, experiments were performed in presence of a pure silica porous medium. Both thermodynamic and kinetic elements were considered. In particular, according to previous studies [49,50] and to the current literature [51,52], hydrate formation was considered a first-order chemical kinetic equation for the time dependence.
The two typologies of tests were compared thermodynamically and kinetically and the main observed differences have been widely discussed. Experiments allowed to confirm the kinetic promotion associated to the presence of memory in the gas-water mixture.

2. Materials and Methods

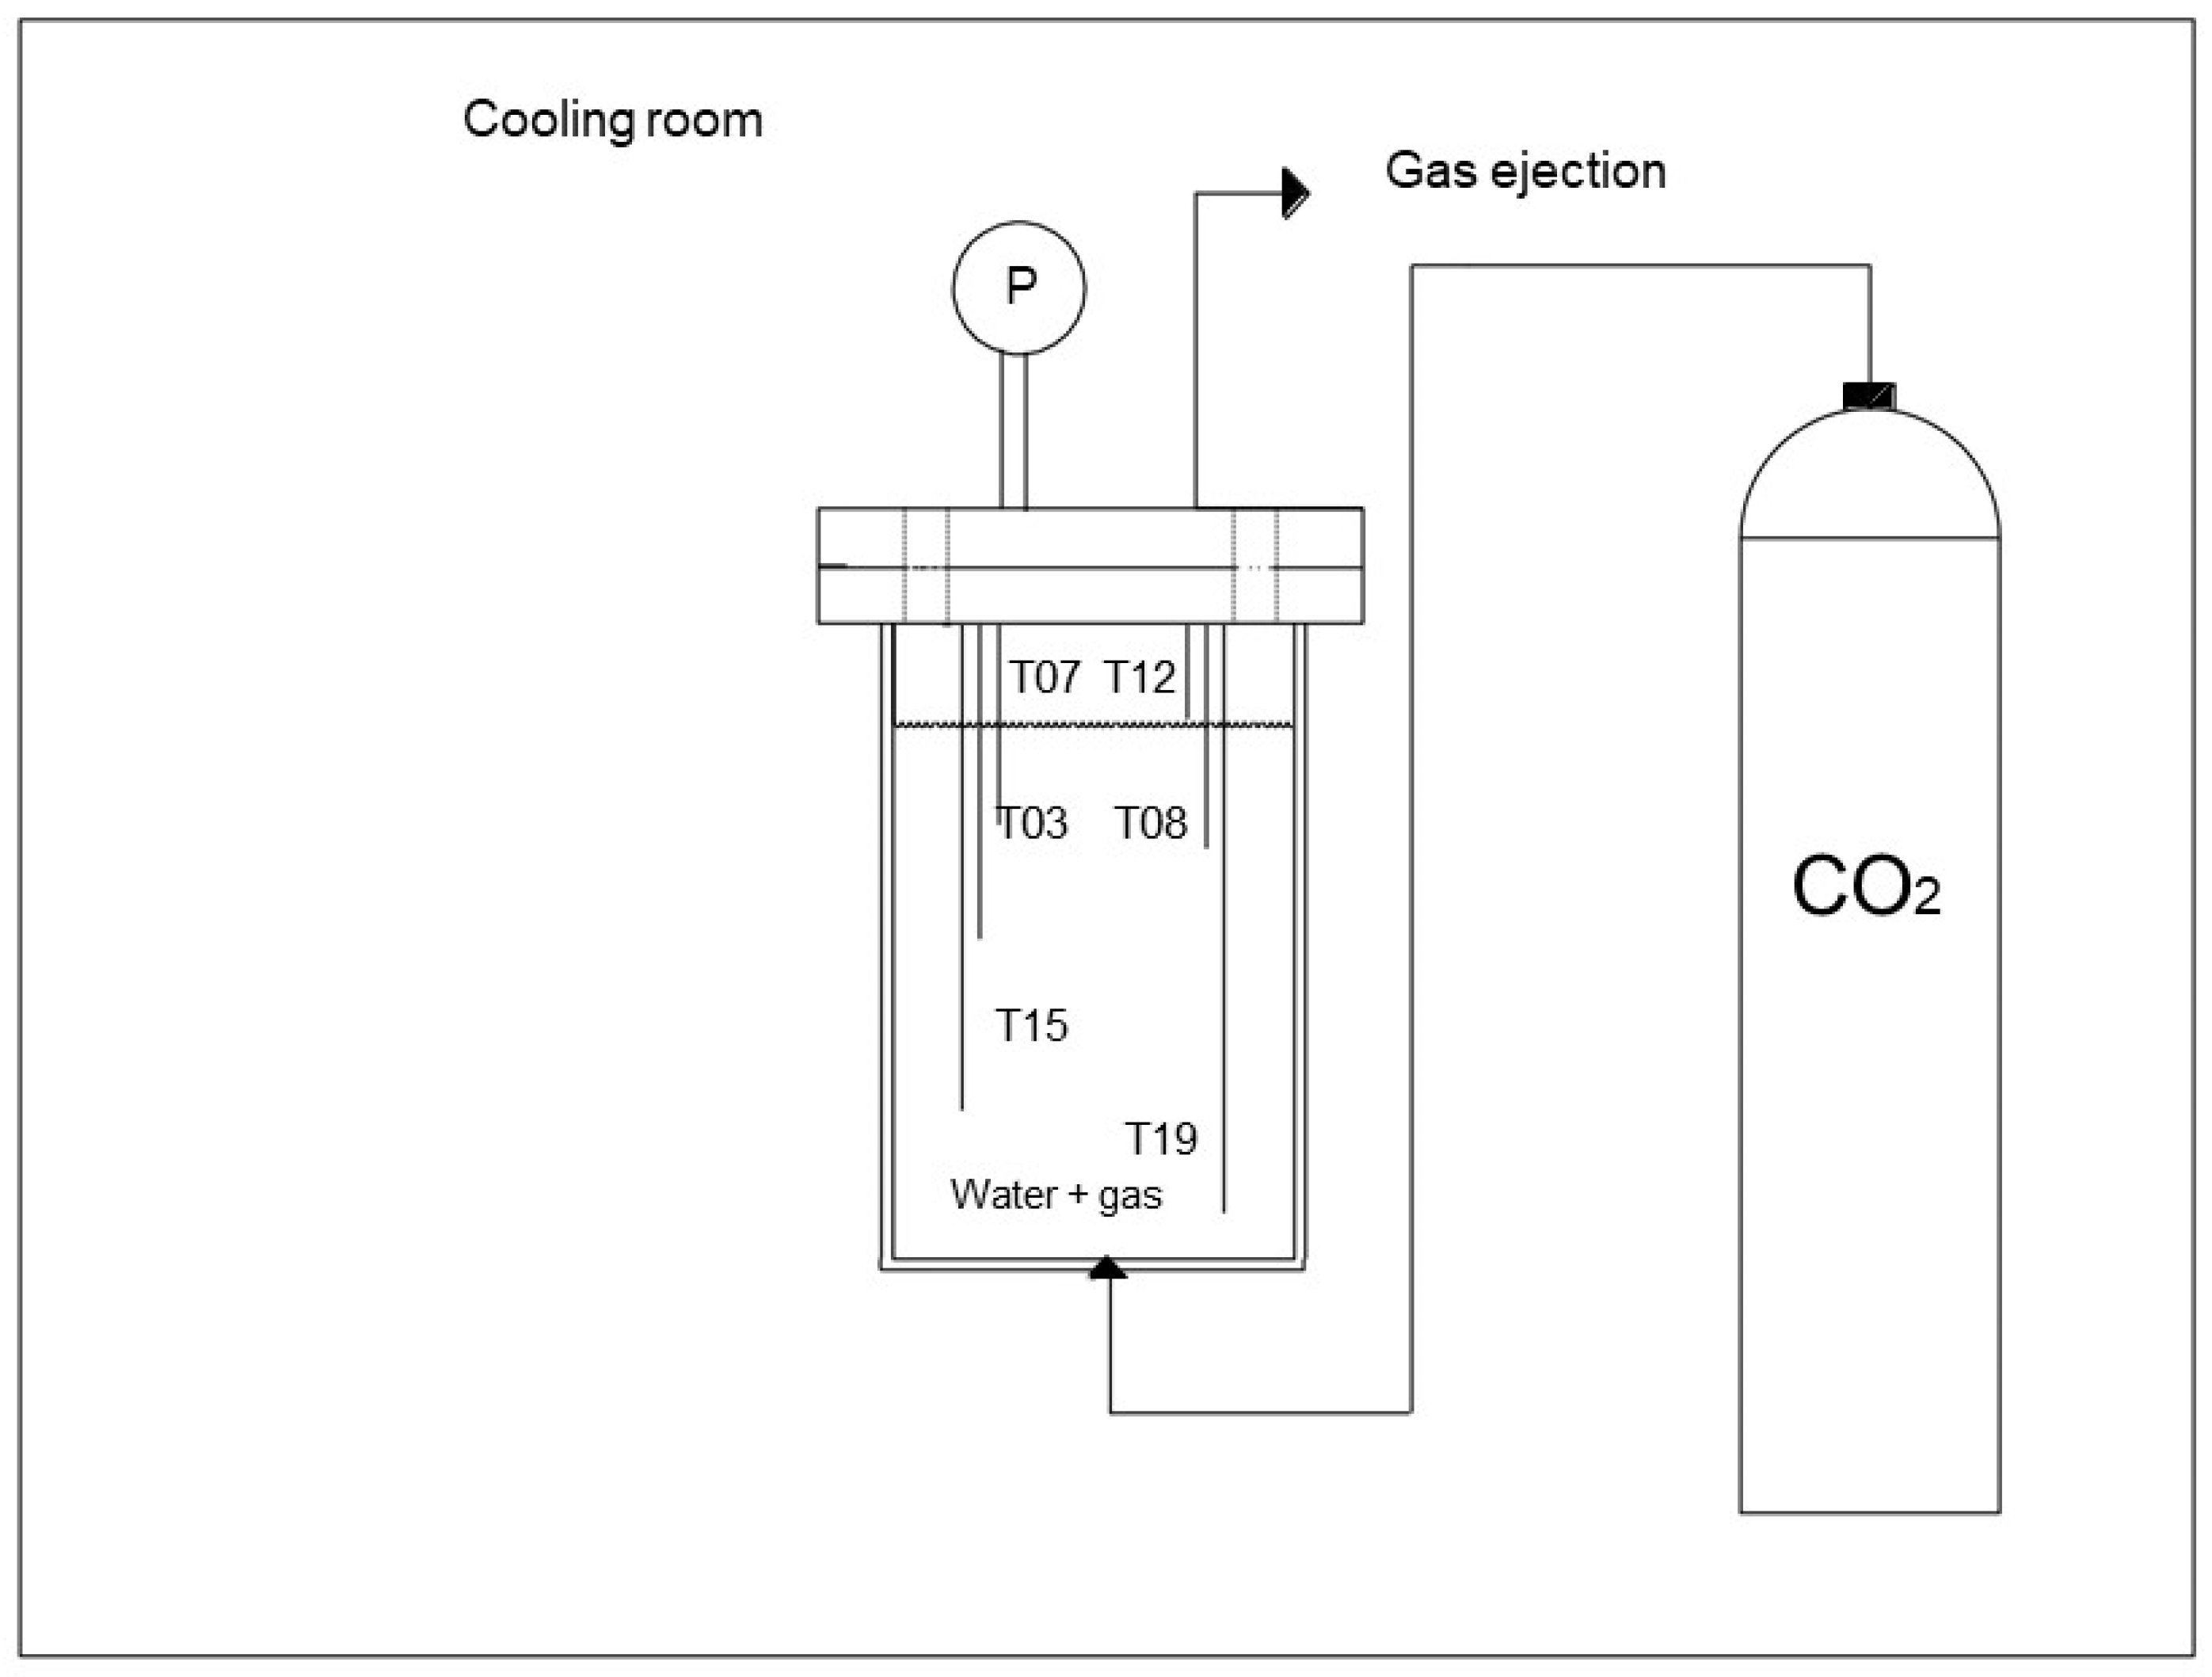
2.1. Experimental Apparatus

Experiments were carried out in a small-scale apparatus, containing a 316 stainless steel unstirred reactor, a cooling room and a series of devices required for monitoring the process and for gas injection/ejection. The reactor was built with the aim of obtaining the same characteristics of the apparatus used in previous researches, whose description is available elsewhere in literature [53,54]. The internal volume is equal to 1000 cm3 and has cylindrical shape. The geometry of the reactor and its main measures are shown in Figure 1.
The bottom is closed with a 316SS plate having 3 cm thickness, which is directly sealed to the perimetral wall. Differently, the opposite section is closed with a flange, which allows to inspect the internal volume, when required. The tightness is ensured with a spiro-metallic gasket (model DN80 PN 10/40 316-FG C8 OR). Considering that heat is provided or removed from the external, the cylindrical shape has been chosen to ensure the thermal uniformity of the internal volume. The perimetral wall has been also equipped with an integrated coil, which can be used when fast temperature variations are required. For instance, it is suitable for circulating liquid nitrogen, thus drastically lowering the internal temperature in few minutes. The internal diameter is equal to 7.79 cm, while the height is about 21 cm.
Gas is injected from the bottom, where two channels were directly connected to gas cylinders. Despite the reactor, also these tanks are positioned inside the cooling room, in order to bring the guest compound to the same temperature of the sediment-water mixture, before its injection inside the reactor. The choice of injecting the gaseous compound from the bottom was taken to ensure a better diffusion of guest molecules within sand pores.
On the opposite side, the flange contains five channels. Two of them were used for the insertion of temperature sensors, another for the pressure transducer. The fourth channel hosts a safety valve (model E10 LS/150). Finally, the fifth channel is used for gas ejection. It consists of two different sub-channels: the first allows to quickly eject the gaseous phase, while the second is equipped with a pressure reducer and a porous septum and can be used to take gaseous samplings.
The experimental apparatus is schematized in Figure 2.
The cooling room can lower the internal temperature up to −10 °C, with an accuracy of ±0.1 °C. Such room can be controlled manually or directly programmed. With this second option, temperature can be controlled with high accuracy and its decrease inside the reactor can be easily defined and ensured to be similar between experiments. Temperature was measured with Type K thermocouples, having class accuracy 1, while pressure with a digital manometer, model MAN-SD, with accuracy equal to ±0.5 of full scale. Figure 2 shows the positioning of both elements. About thermocouples, six devices were used. Based on what found in literature, several devices were used and positioned at different depths and in opposite regions of the reactor, in order to control the whole volume and detect any possible formation of temperature gradients inside the reactor [55,56,57].
All sensors were connected to a data acquisition system and managed with LabView. More detailed information about the data acquisition system can be found in [58].

2.2. Materials

Before experiments, the reactor was filled with pure demineralized water and sand. In particular, 270 cm3 of water and 800 cm3 of sand were inserted. This latter compound consists of pure silica sand: its grains have spherical shape and diameter in the range of 150–250 µm. The porosity of sand was measured with a porosimeter, model Thermo Scientific Pascal 140 and is equal to 34–35%.
Finally, Ultra-High-Purity (UHP) carbon dioxide was used as guest compound. Its purity degree is approximately equal to 99.99%.

2.3. Methods

After water and sand insertion, the flange was closed. Carbon dioxide was injected at relatively high temperature, in order to completely avoid hydrates formation during the injection phase. Immediately after, the reactor was closed. During experiments, none mass exchange with the external was possible; only heat transfers occurred. The same gas-water mixture was used for all experiments, which were equally divided in two groups. The two kinds of test were carried out with the same method, the only difference stayed in the dissociation temperature: in the first group, it was maintained below 25 °C, in order to make the system able to retain memory of previous processes (according to [43]), while in the second group, it was brought above this value.
The formation process started as soon as the cooling room was activated. The cooling rate was the same in all experiments: the target temperature of the room was fixed at 0 °C and the internal temperature gradually decrease until stabilize at values slightly above the fixed value (the system is programmed to approach asymptotically the target temperature). The trend which temperature assumed over time, is shown in Figure 3.
The enclathration of carbon dioxide molecules caused a slow and gradual reduction of pressure, which allowed to easily monitor its trend from the external. While temperature was constantly monitored and varied from the external, the local pressure varied autonomously as a function of temperature and due to the evolution of the hydrate formation process inside the reactor. The stabilization of pressure signed the end of hydrates formation. The following dissociation phase was carried out by switching off the cooling room. The reactor slowly tried to establish the thermal balance with the external environment. In this way, hydrates dissociation occurred slowly and gave us the possibility to define the phase equilibrium diagrams for the system. The experiments ended when all hydrates previously formed were completely dissociated. However, in tests belonging to the second group, the temperature was still increased until reaching and overcoming 25 °C.
Experiments were characterized both thermodynamically and kinetically. While thermodynamic parameters were directly measured, the rate constant, used to describe the kinetic of hydrates formation and dissociation, was calculated with the following Equation (1):
k = 1 t l n ( CO 2 g i CO 2 g i 1 ) [ 1 min ] .
The two terms inside brackets described the whole amount of gaseous carbon dioxide present inside the reactor, calculated between two consecutive measures. The sampling time was fixed to 30 s. The uncertainty in the measurement of this parameter depends on the accuracy of the measuring instruments (which was provided in the previous section) and falls on the third decimal place. The unreacted carbon dioxide was calculated as difference between the initial quantity of gas injected inside the reactor and moles already trapped into water cages.
This latter quantity was evaluated with Equation (2):
m o l H Y D = V P O R E ( P i 1 Z i P i Z i 1 ) Z i ( R T P i ρ H Y D )
In the equation, the term VPORE represents the portion of volume available for hydrates formation; it consists of the sum of free space present within sand pores and between grains. Pressure and temperature were indicated with their initial letter, while “R” and “Z” are respectively the gas constant and the compressibility factor. This last parameter was calculated with the Peng-Robinson Equation (more detailed information about the procedure followed at this step can be found in [59]. Finally, the term “ρHYD” describes the ideal molar density of hydrates and was defined according to literature [60,61].

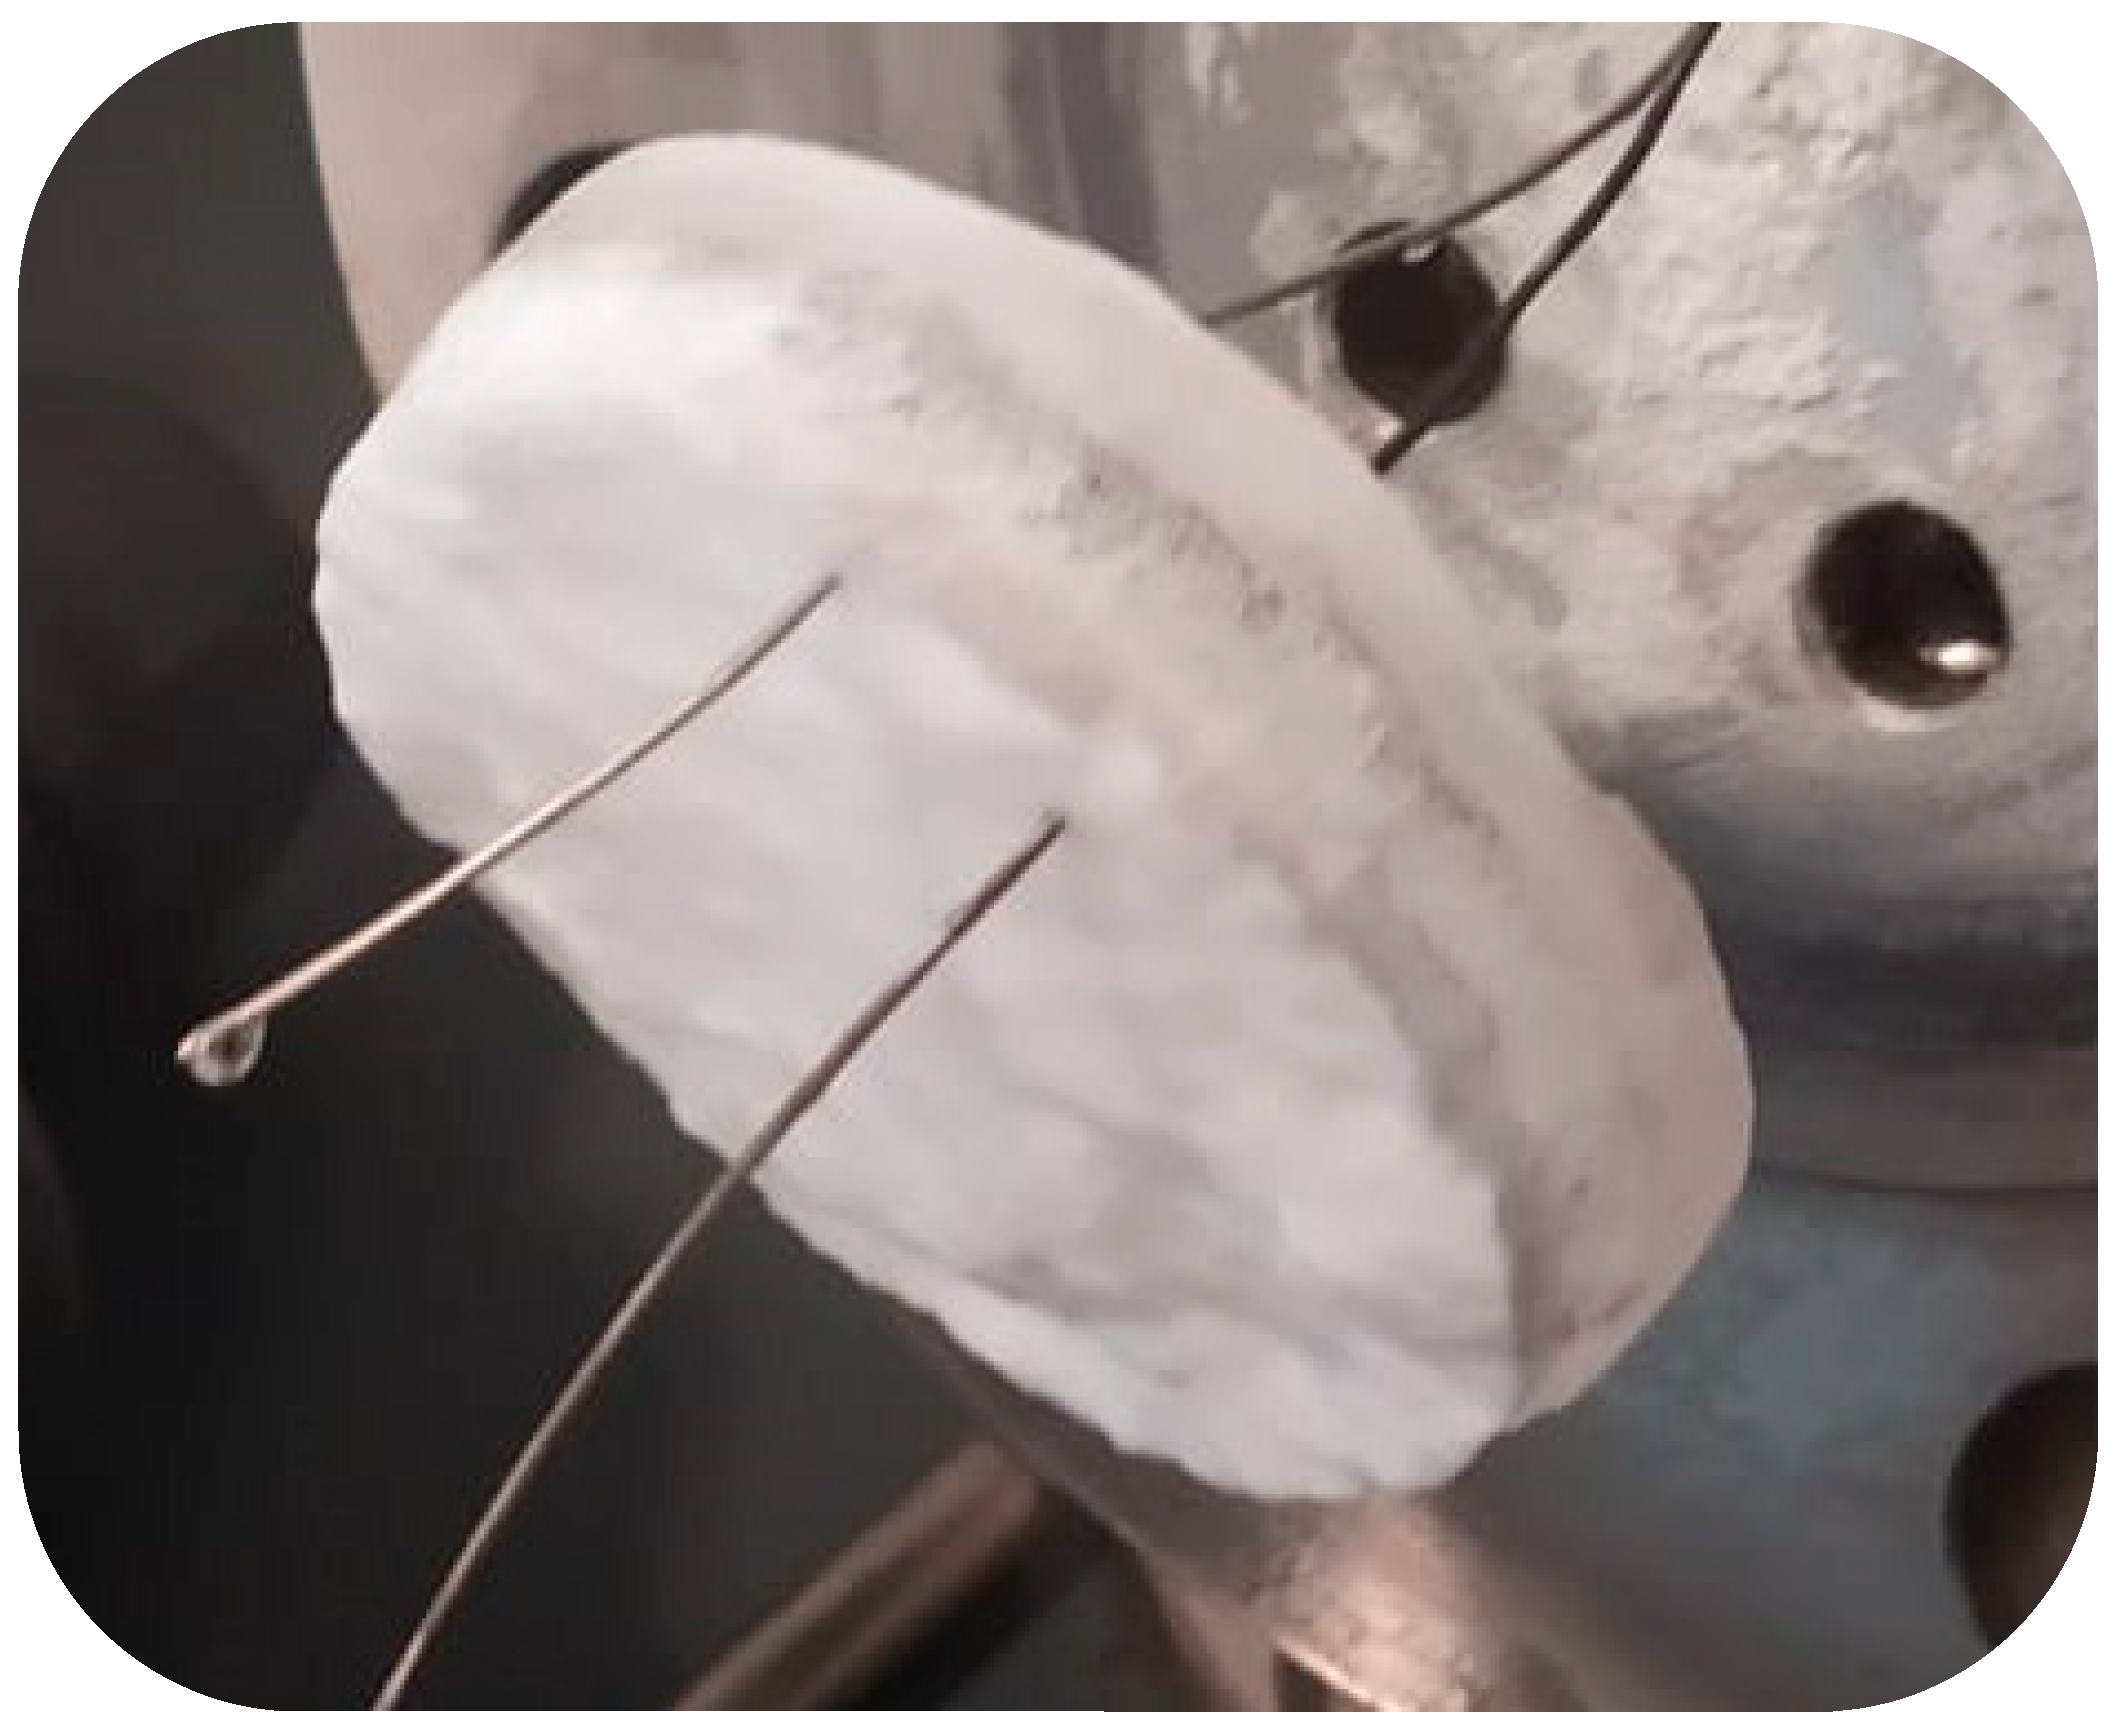
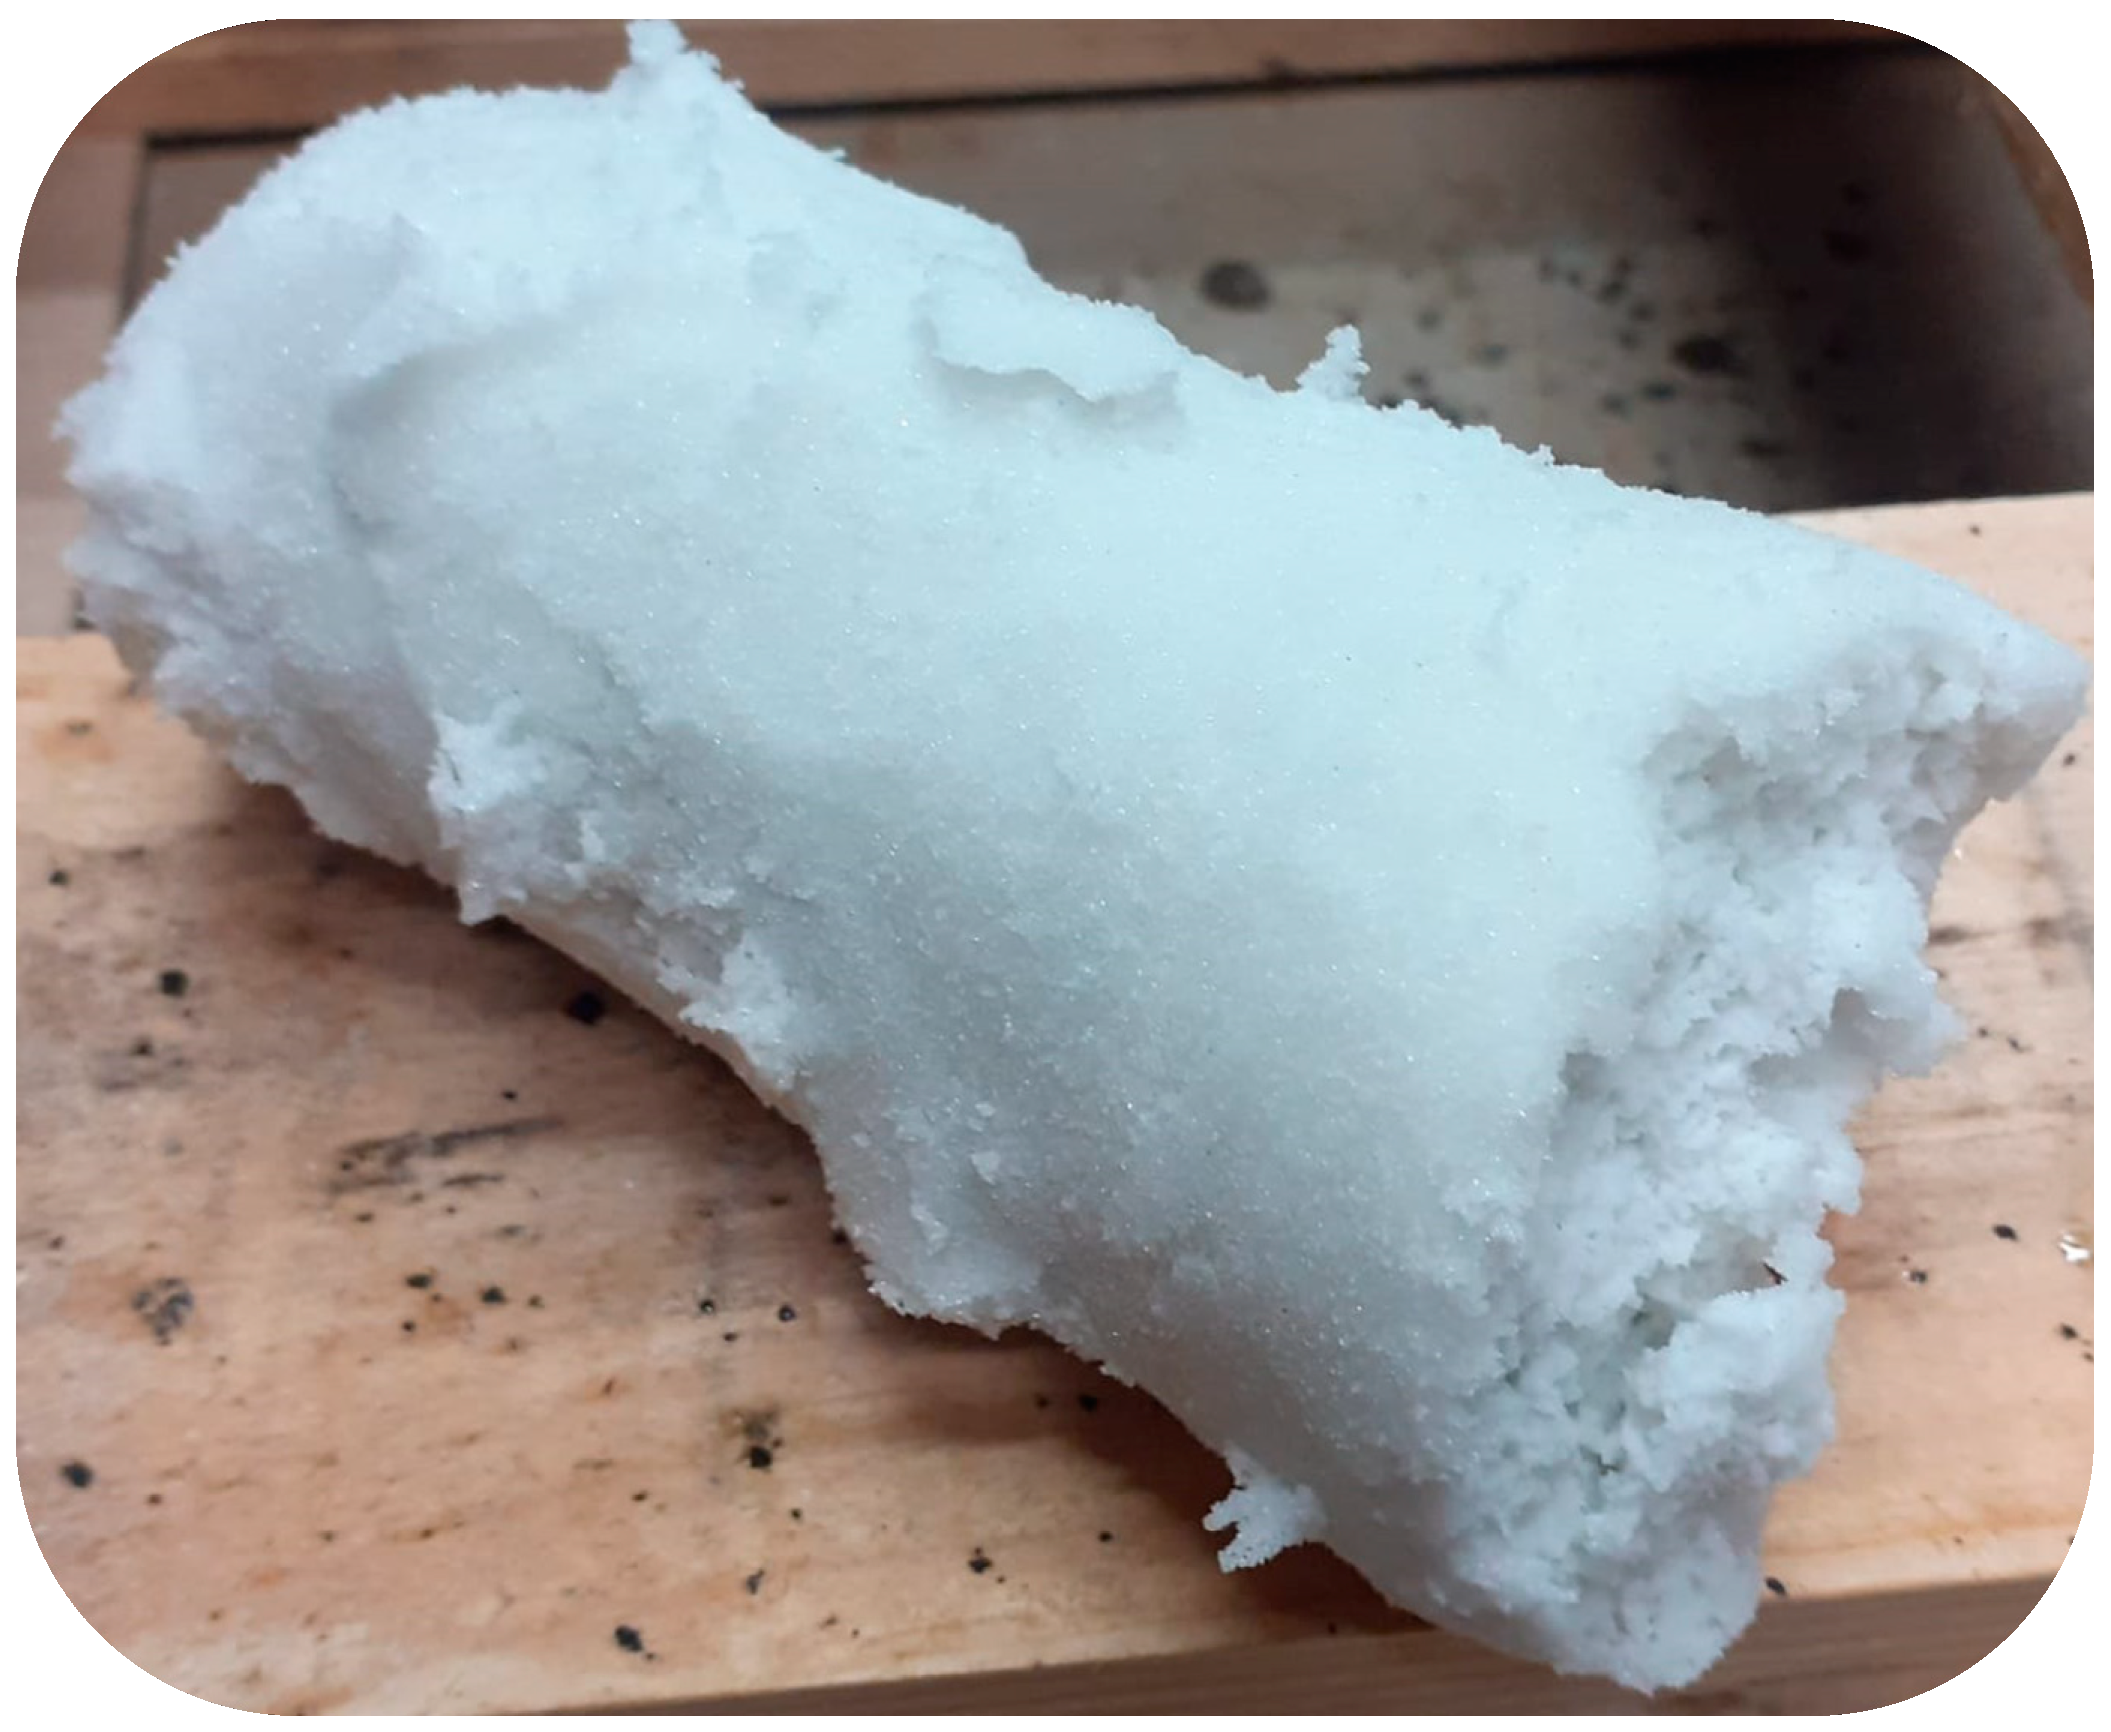
The Role of Porous Sand on the Distribution of Hydrates within the Reactor

The addition of sand allowed to a well distributed formation of hydrates along the whole reactor. The porous medium advantaged the process in two different ways. The gaseous compound was injected from the bottom and consequently passed through the whole reactor, untill filling the free space present immediately below the upper flange. The sand pores, which occupied one third of the whole sand volume, entrapped gaseous molecules during this phase. As a consequence of it, thousands of little gas-liquid interfaces formed in the reactor and interested all its internal volume, with the only exception of the highest portion of the reactor where neither water nor sand were present.
Moreover, the surface of sand grains acted as promoting agent for hydrates nucleation. Due to the amount of sand inserted in the reactor (the precise quantity is given in detail in Section 2.2), the effect of reactor walls on the hydrate formation process can be considered negligible. The following two pictures show carbon dioxide hydrates formed with the present experimental apparatus. In the case shown in Figure 4, hydrates were formed in absence of sand, while Figure 5 is referred to the configuration adopted in the experiments described in this work.
As expected, without sand, hydrates form only in correspondence of the gas-liquid interface. Here, hydrates occupied the whole free spase, thus assuming the same circular shape of the reactor. Conversely, when the reactor was filled with porous sand, carbon dioxide hydrates formed everywhere and clearly entrapped sand grains in their framework. As shown in Figure 5, a single solid compound was found into the reactor and was easily withdrawn. The situation found in our experiments has been already proved and discussed in detail in previous works carried out with the same experimental apparatus [58]. It was observed in literature that, in some studies, the formation of hydrate, carried out in presence of porous media similar to that used in this work, assumed different configurations. For instance, in [32] and related works [62], hydrates seemed to form mainly above the porous medium (also as a function of the high availability of space in this region and due to the different process conditions) while, in the experiments described in this manuscript, it exclusively occurred within the sand sediment. In conclusion, the porous medium favoured high distribution of guest molecules within the reactor and massive formation of hydrates, which completely absorbed sand grains in their framework.

3. Results and Discussion

As explained in the previous section, carbon dioxide hydrates formation/dissociation tests were repeated more times consecutively and with the same gas-water mixture. In the first half of tests, the dissociation temperature was kept below 25 °C, considered the maximum value possible for the system to retain memory of previous formations. Differently, in the second half of experiments, this value was exceeded and the memory effect completely avoided. While temperature was controlled from the external, the pressure exclusively varied as a function of the internal conditions of the reactor and as a consequence of the enclathration of guest molecules within solid water cages.
In the following diagrams (Figure 5, Figure 6, Figure 7, Figure 8, Figure 9 and Figure 10), pressure trend, measured during hydrates formation, was shown as a function of temperature. Figure 6, Figure 7 and Figure 8 describe the first group of experiments, or those carried out with the contribution of the memory effect, while the following Figure 9, Figure 10 and Figure 11 show the second group of experiments, during which the system did not retain memory of the previous processes. In the next pages, the first group will be referred as “WM” (with memory), while the second group as “NM” (no memory).
Each figure shows two diagrams: the first was drawn with a continuous black line and describes the formation process during the test, while the second appears with a dotted line and represents the theoretical equilibrium for carbon dioxide hydrates. It was defined by collecting experimental values produced in literature in the last years [63,64,65,66,67,68,69,70,71,72,73,74,75,76]. The formation process took place in a considerably more linear way in Tests WM than in Tests NM, proving the high impact of memory effect on the process. In particular, in Tests WM, the formation of hydrates started at relatively high temperatures (in Test 1 and in Test 2, the process began at temperatures approximately equal to 6 °C). Differently, in Tests NM, the process occurred only after the system reached lower temperature values (2 °C or less). It means that, in absence of memory effect, the reaction required more severe thermodynamic conditions to start and the pressure started decreasing, due to hydrates formation, only when the system was widely within the hydrate stability zone. The comparison with the phase boundary equilibrium line for carbon dioxide hydrates, well highlighted this latter aspect. In Tests WM, the formation curve approached the equilibrium one. A clear difference existed anyway and deepened of several reasons. Firstly, the presence of a pure quartz porous sediment, which contributed to shift the formation conditions to higher pressures and lower temperatures, as explained in [18,19,20]. In addition, hydrates formation and dissociation always present differences between each other, and the equilibrium is defined with the second type of curve. These differences mainly depend on the stochastic nature of the formation process, especially during the initial formation of the first hydrate nuclei. Conversely, hydrates dissociation is a more deterministic process and is consequently more adherent to the real trend. However, in all Tests WM, the formation trend clearly followed the equilibrium curve. A completely different behavior was noticed in Tests NM, where none similarity, between the experimental and the theoretical lines, was found.
The process required lower temperatures to begun, thus the initial distance from the equilibrium was significantly higher. Then, the process defined a vertical trend, having the temperature already reached its minimum (in all tests, the temperature was kept above 0 °C, to avoid hydrate formation inside the reactor). This concept has been schematized in the following Figure 12, where both trends were shown together.
The phase boundary equilibrium line divides the region of stability for hydrates from the instability zone. However, when the thermodynamic conditions are shifted to the stability zone, the formation rarely occurs immediately and in correspondence of the equilibrium conditions. Before formation, the system must pass through the so-called metastability zone, or a thermodynamic region where conditions are already feasible for hydrates formation but the process is still not enough stimulated and does not occur massively. The size of such region is function of several variables, such us, the type of sediment, the specific guest involved and, more in general, the process conditions. When the local conditions are within the hydrate stability zone, the distance between these conditions and those of equilibrium, can be considered a driving force for the process.
In addition, due to the presence of a porous medium within the formation environments, further details about the thermodynamics of the process are needed. A phase can be defined as a uniform ensemble of molecules at a fixed average density and temperature [77]. Usually, the chemical potential for different components is considered to be the same in all phases; however, it is acceptable only if the phases are in an equilibrium system.
If the number of thermodynamic variables is higher than that of conservation equations, the system results mathematically under determined. In this case, the best solution to determine the distribution of phases and the composition over in phases, consists of the determination of the free energy minimum. In addition, even if the system is over determined, there is no certainty on the uniform chemical potentials of components across phase boundaries [78]. For that reason, pressure and temperature equilibrium curves are almost exclusively defined from system exclusively containing pure guest formers and water. In this latter case, only one thermodynamic variable can be defined if the system is going to approach the thermodynamic equilibrium. In most of experiments, as in those shown in this work, hydrates are formed at thermodynamic conditions within the stability zone and, in particular, temperatures are often lower than those defining the boundary conditions. Heterogeneous hydrate formation can be reached with appropriate stirring, but the degree of subcooling can represent a further variable to consider, because the subcooling degree affects the filling fraction of guest molecules and the stability of hydrates.
The nucleation of hydrates towards mineral surfaces is thermodynamically favourable and also the molecular transport of guest molecules is improved. More in depth, the porous sediment exercises four different actions on hydrate formation [78]. If pores are excessively small (usually less than 10–50 nm), they cause extra strain in the hydrate lattice. The result is the need of higher temperatures and/or lower temperatures to reach the stabilization of hydrates. The size of pores is proportional to the grain size. In addition, the respective positioning of solid particles represents a limitation for local movements of guest molecules, which gain more time for nucleation [79,80].
Non-polar guest compound can be trapped in structured water, but the nucleation phase rarely reaches the completion if such structure does not reach a separate hydrate former phase. In this sense, the porous sediment affects the process in two opposite ways. The surfaces of pores and grains play the role of inhibitors, because hydrate water can never touch mineral surfaces (that condition is associated to the low chemical potential which water has in the first adsorbed layers). Conversely, these surfaces are able to concentrate hydrate formers via direct adsorption and act as potential nucleation sites.
As conclusion of the present reasoning, gas hydrates in sediments are not able to establish the thermodynamic equilibrium, since pressure and temperature are only two of several independent thermodynamic variables that control hydrate stability. In presence of porous sediments, hydrates are thermodynamically over determined. Thus, pressure and temperature stability limits cannot describe the equilibrium of the system by their own and the best solution to address this problem consists of the free energy minimizing approach [78].
Figure 6, Figure 7, Figure 8, Figure 9, Figure 10 and Figure 11 proved that, when the system retained memory of previous formations, the process needed of a lower driving force than that required in Tests NM, thus the metastability zone was inevitably much thinner.
The wide initial distance between experimental and theoretical conditions, clearly affected the linearity of the process. In Tests NM, several secondary peaks in temperature where noticed, in particular in Test 4 (where an intense peak temporarily made the local conditions closer to the equilibrium ones) and in Test 6 (numerous secondary peaks led to the definition of a stepped trend). The presence of these secondary peaks denoted that the formation process was not homogeneous in the whole reactor and, in some portions of it, it occurred with a certain delay. The consequent production of heat, generated the fast variations in pressure visible in Figure 9, Figure 10 and Figure 11.
In Tests WM, the pressure drop associated to hydrates formation ranged from 9.1 to 15.4 bar, proving that hydrates formed massively also in absence of memory.
The analysis of thermodynamic conditions observed during experiments, suggested that the memory effect mainly acted as kinetic promoter for the process. Thanks to this phenomenon, the process occurred earlier and started at higher temperatures; moreover, it immediately interested the whole volume available for the reaction. In conclusion, the presence of memory effect did not affect the final quantity of hydrates produced; however, it made the process more deterministic and predictable.
The difference in time spent for hydrates formation is well visible in Figure 13, Figure 14, Figure 15, Figure 16, Figure 17 and Figure 18, where the rate constant was shown for each experiment. As for the previous diagrams, the first half is related to Tests WM, while the second to Tests NM.
These diagrams immediately show a further relevant difference between the two groups of experiments. Hydrates formation required more time in absence of memory effect. In Tests WM, approximately 36–46 h were needed, while in Tests NM up to 164 h were required. As expected, the process was faster in tests where the memory of previous formations was maintained.
The rate constant was calculated every 30 s, by considering the amount of gas involved in hydrates formation between two consecutive measures. Positive values mean that, in the time lapse considered, hydrates formation exceeded their dissociation, while the opposite happens in periods having negative k values. Diagrams clearly show an alternation between positive and negative values, proving that hydrates formed and dissociated continuously. In ideal processes, the rate constant during the formation phase always assumed positive values. However, the trend observed in these experiments can be explained with the Labile Cluster Theory, which characterizes the first phase of hydrates formation, or the nucleation process [2,51,52]. The theory is based on four different steps. At the beginning, primordial labile clusters, composed by a guest molecule surrounded by 20–24 water molecules, form in the gas–water mixture. Then, free water molecules absorb guest molecules and generate the first unstable 512 cages. These cages can grow or dissociate. The growing process is mainly due to the collision between different cages. When vertices are shared, small sI units are formed; conversely, when faces are shared, small sII cages are produced. Like the previous 512 cages, also these structures can dissociate or continue their growth, via collision and aggregation processes. The process continues in this way until hydrate nuclei reach the so-called critical size and the massive growth begins. More in general, when the labile clusters form during the initial nucleation phase and, then, continue their growth, until reaching the critical size, monotonic growth occurs. This phenomenon has been explained with the excess Gibbs free energy which exists between a little solid particle of solute and the solute in solution. The excess Gibbs free energy consists of the sum of the surface excess free energy and the volume excess free energy. While the first term was proved to increase with the size of clusters, the volume excess free energy decreases. In particular, the surface excess free energy is proportional to r2 (where “r” means the average radius sof the cluster), while the volume excess free energy is proportional to r3. It means that, the overall Gibbs free energy decreases with the growing size of the clusters. Figure 13, Figure 14, Figure 15, Figure 16, Figure 17 and Figure 18 exactly describe the continuous formation and dissociation of hydrates which characterized the whole formation phase. Because the formation process occurred close to the phase equilibrium boundaries for the system and due to the modality of growth of hydrates inside the reactor (the formation process did not start from a single nucleation point; thanks to the presence of porous sand, which ensured high concentration of guest molecules along the whole reactor) numerous nucleation sites formed and the phases described in the Labile Cluster Theory interested the whole reactor and were responsible for the trend observed in Figure 13, Figure 14, Figure 15, Figure 16 and Figure 17. This behavior is also responsible for the stochastic nature of the process: the contemporary occurrence of hydrates formation and dissociation causes differences with the ideal trend and, more in general, lowers the process.
In Tests WM, the rate constant ranged on average between ±0.01 (min−1) in Test 2 and in Test 3, while it assumed slightly higher values, about ±0.015 (min−1) in Test 1. Differently, higher values were measured in Tests NM, where it oscillated within ±0.04 (min−1) in all experiments. To validate results obtained in this work, these values were compared with previous works [1,49,50] and with results reached by other research groups [81]: these results were proved to be consistent with what already present in literature. Such difference confirmed what observed with the pressure–temperature description of experiments: in presence of memory, the process was more linear and better approached the theoretical trend. A less pronounced oscillation of k values means that the formation process was gradual and less dependent on the local thermodynamic conditions. Even if the local pressure and temperature gradually became closer to those of equilibrium, none relevant variation was observed in hydrates formation. In Tests WM, the rate constant remained approximately equal from the beginning to the ending of the formation process: its oscillating range remained the same along each experiment. Conversely, in Tests NM, with the decreasing of distance between experimental and theoretical thermodynamic conditions, the rate constant increased in modulus, until reaching its maximum values, in correspondence of the process ending. Also this phenomenon can be explained with the memory effect. Experiments carried out in absence of it, generally showed higher k values. However, at the beginning of each process, the system was widely within the hydrate stability zone, much more than Tests WM. In that configuration, both groups of experiments generated similar k values. The situation changed with the going on of the process. Thanks to the memory of previous formations, the formation process in Tests WM was less dependent than the local thermodynamic conditions, and parameter k assumed a visibly more stable trend, if compared with what observed in the other group of experiments. Conversely, due to the lowering of pressure inside the reactor, Tests NM registered an increase of this parameter. The highest oscillations were reached in correspondence of the process ending, where the system had already reached the stability and the quantity of hydrates instantaneously formed is completely balanced from the amount of hydrates dissociated. This equilibrium made the pressure and temperature constant and marked the end of the formation process.

4. Conclusions

The present work deals with an experimental description about effects attributable to the presence of memory effect. Two different groups of experiments were carried out. A lab–scale experimental apparatus, expressly designed to reproduce offshore hydrate reservoirs, was used. In both cases, carbon dioxide hydrates were formed in presence of demineralized water and a pure quartz porous medium, which acted as sediment for hydrates. Experiments were made with the same gas–water mixture. The only difference stayed in the maximum temperature reached during the hydrates dissociation phase: in the first group, it was maintained below 25 °C, considered the upper limit for the retainment of memory; differently, in the second group such limit was exceeded.
Experiments were analysed both thermodynamically and kinetically; the following crucial differences were noted and discussed in the text:
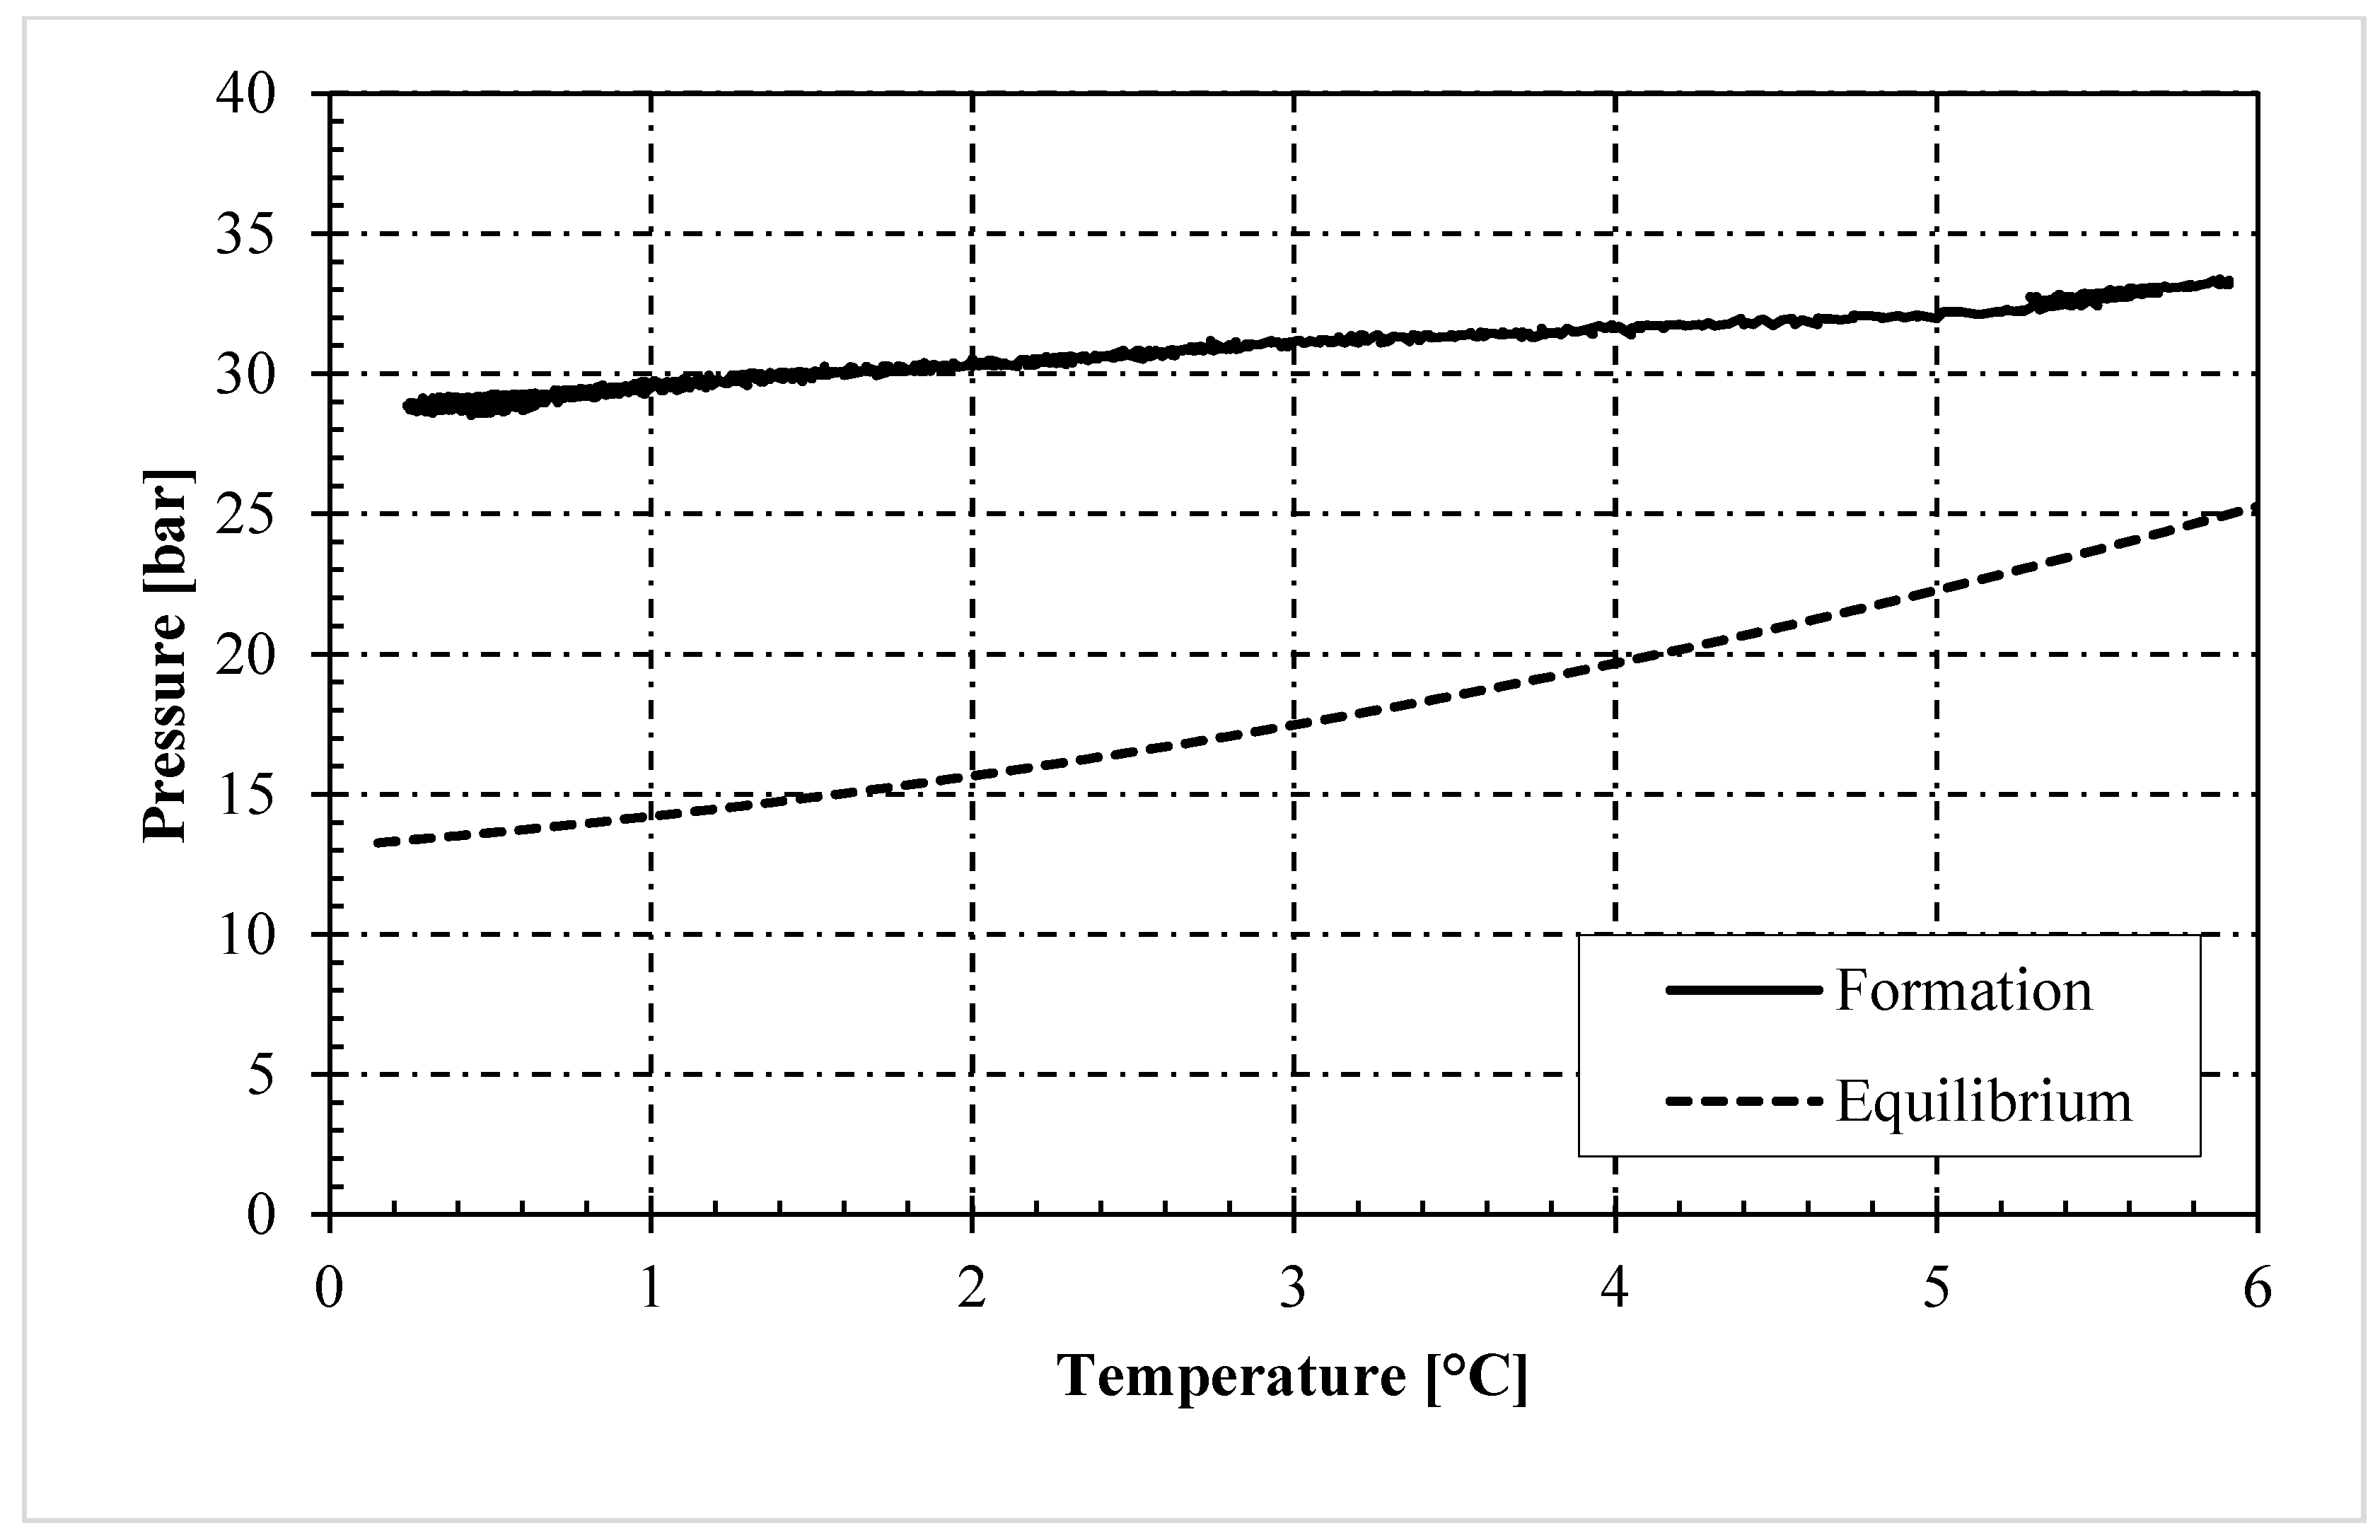
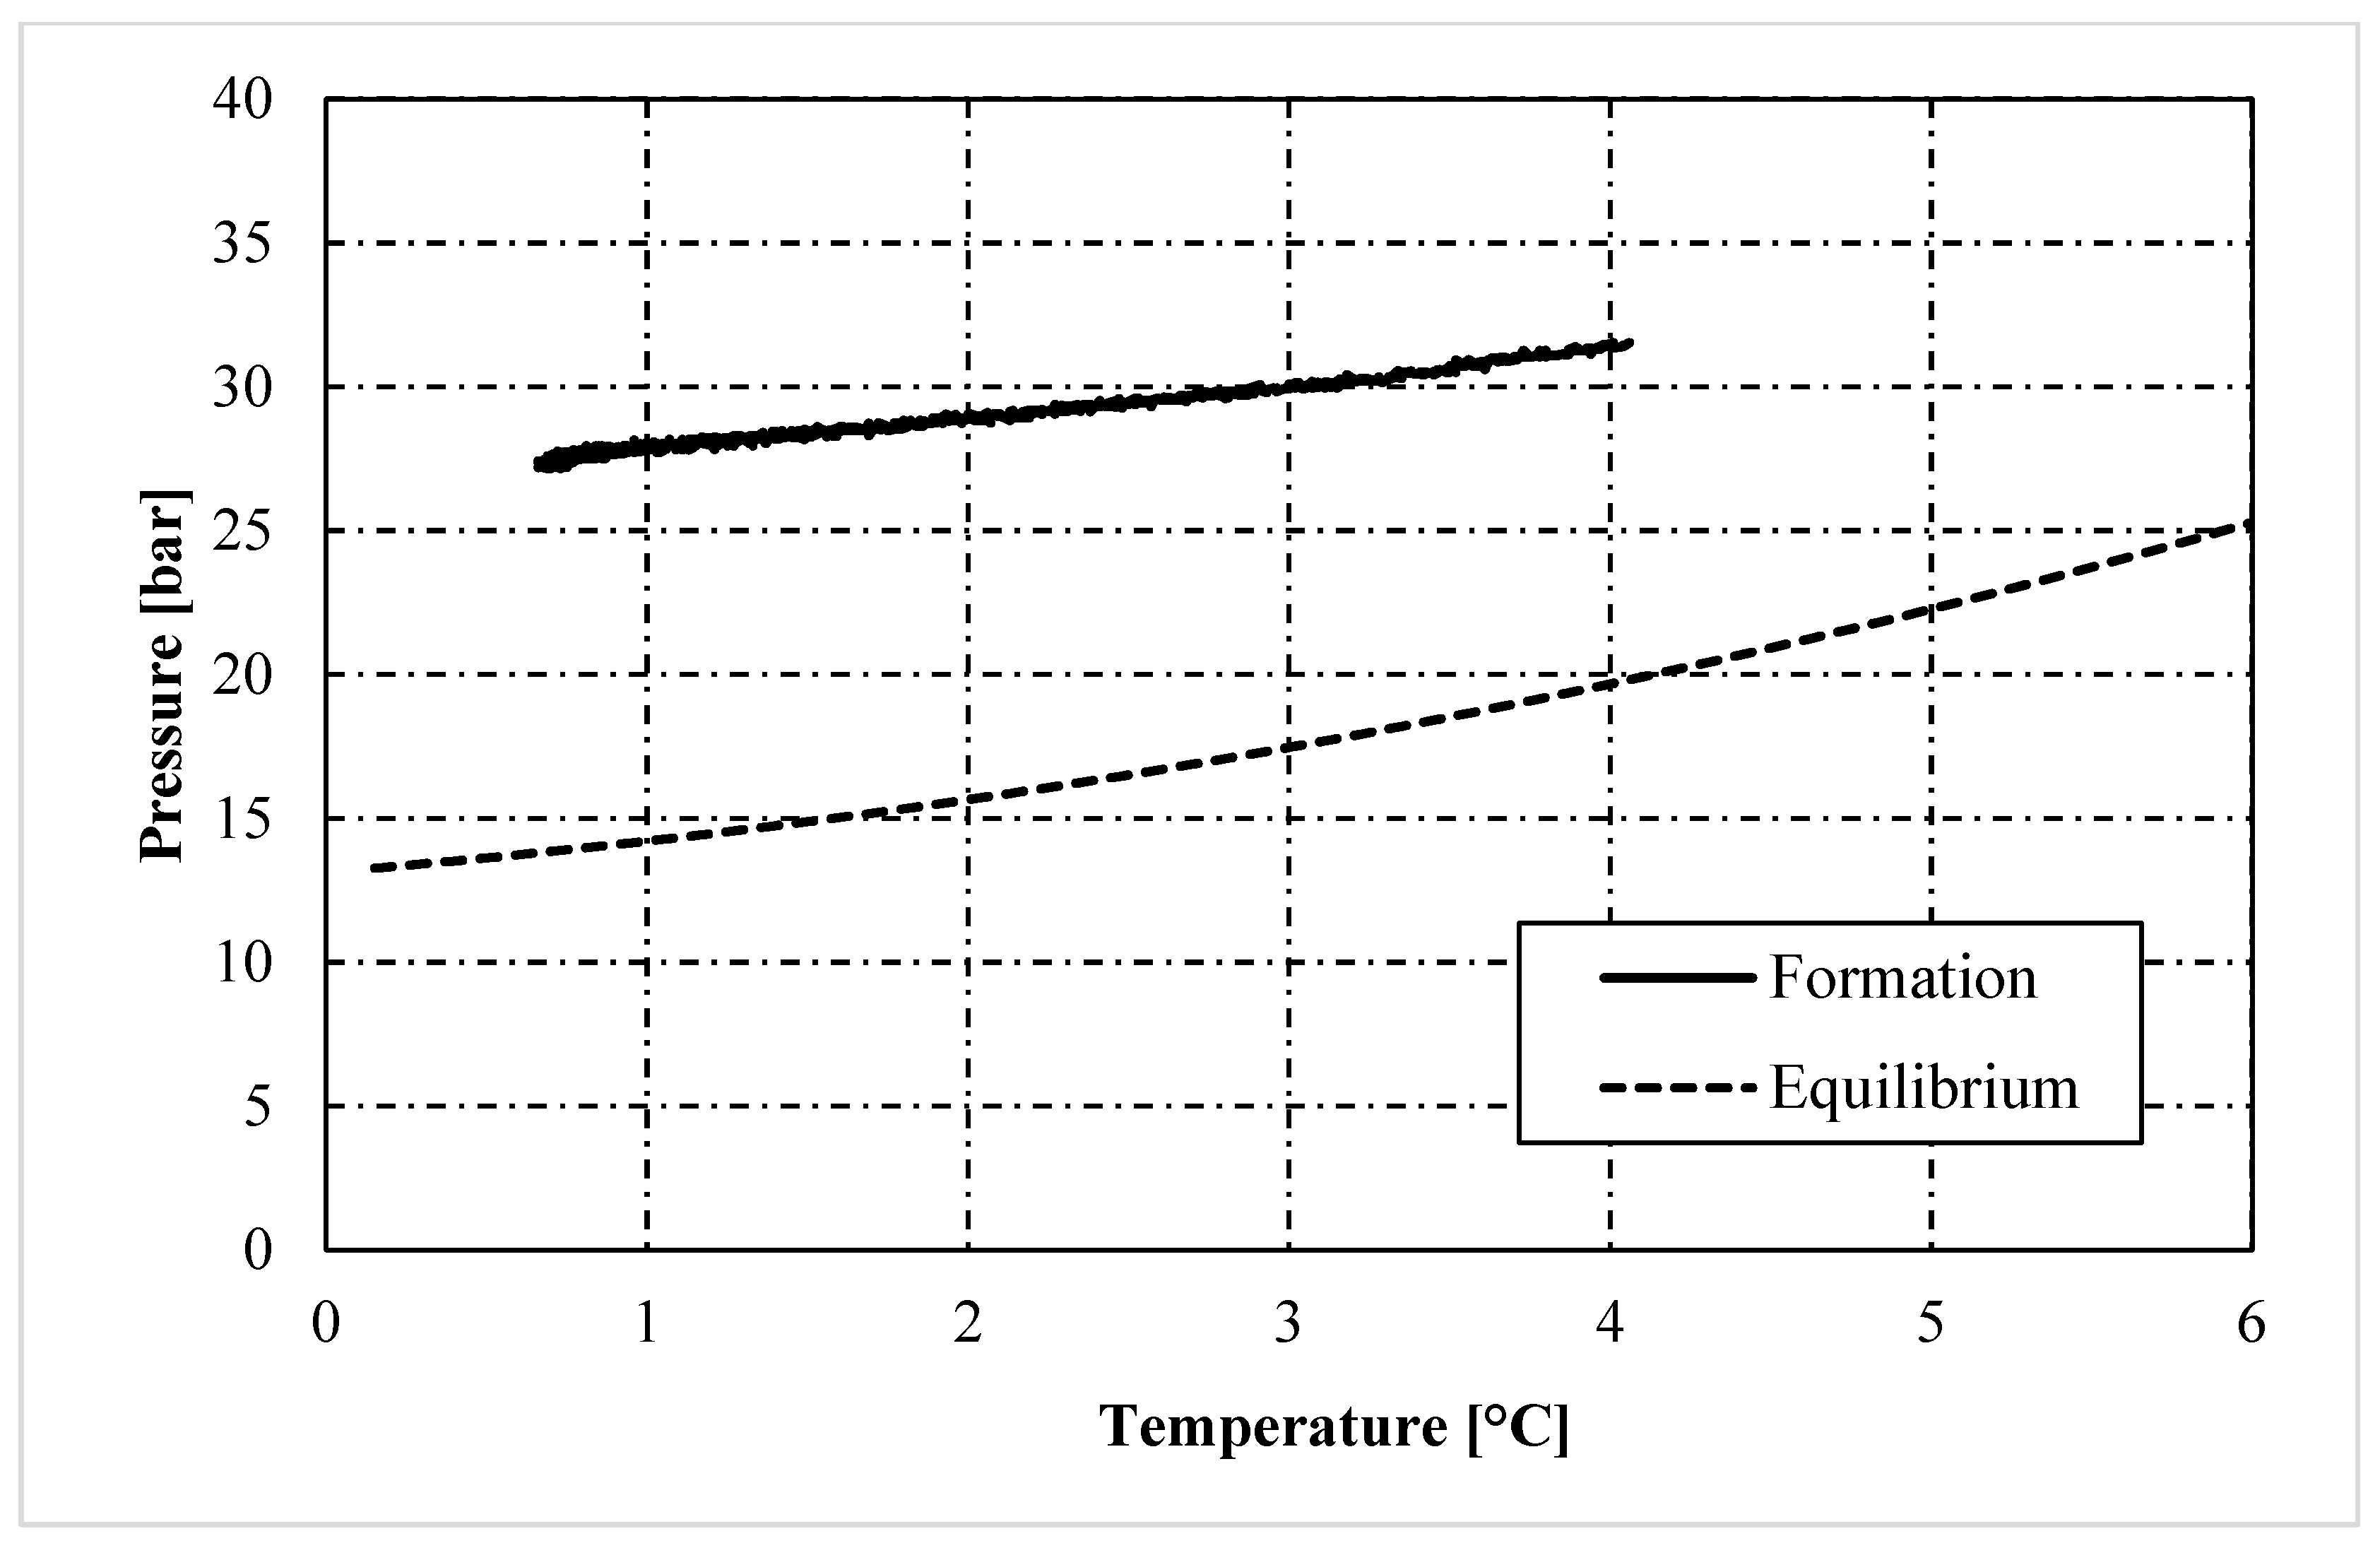
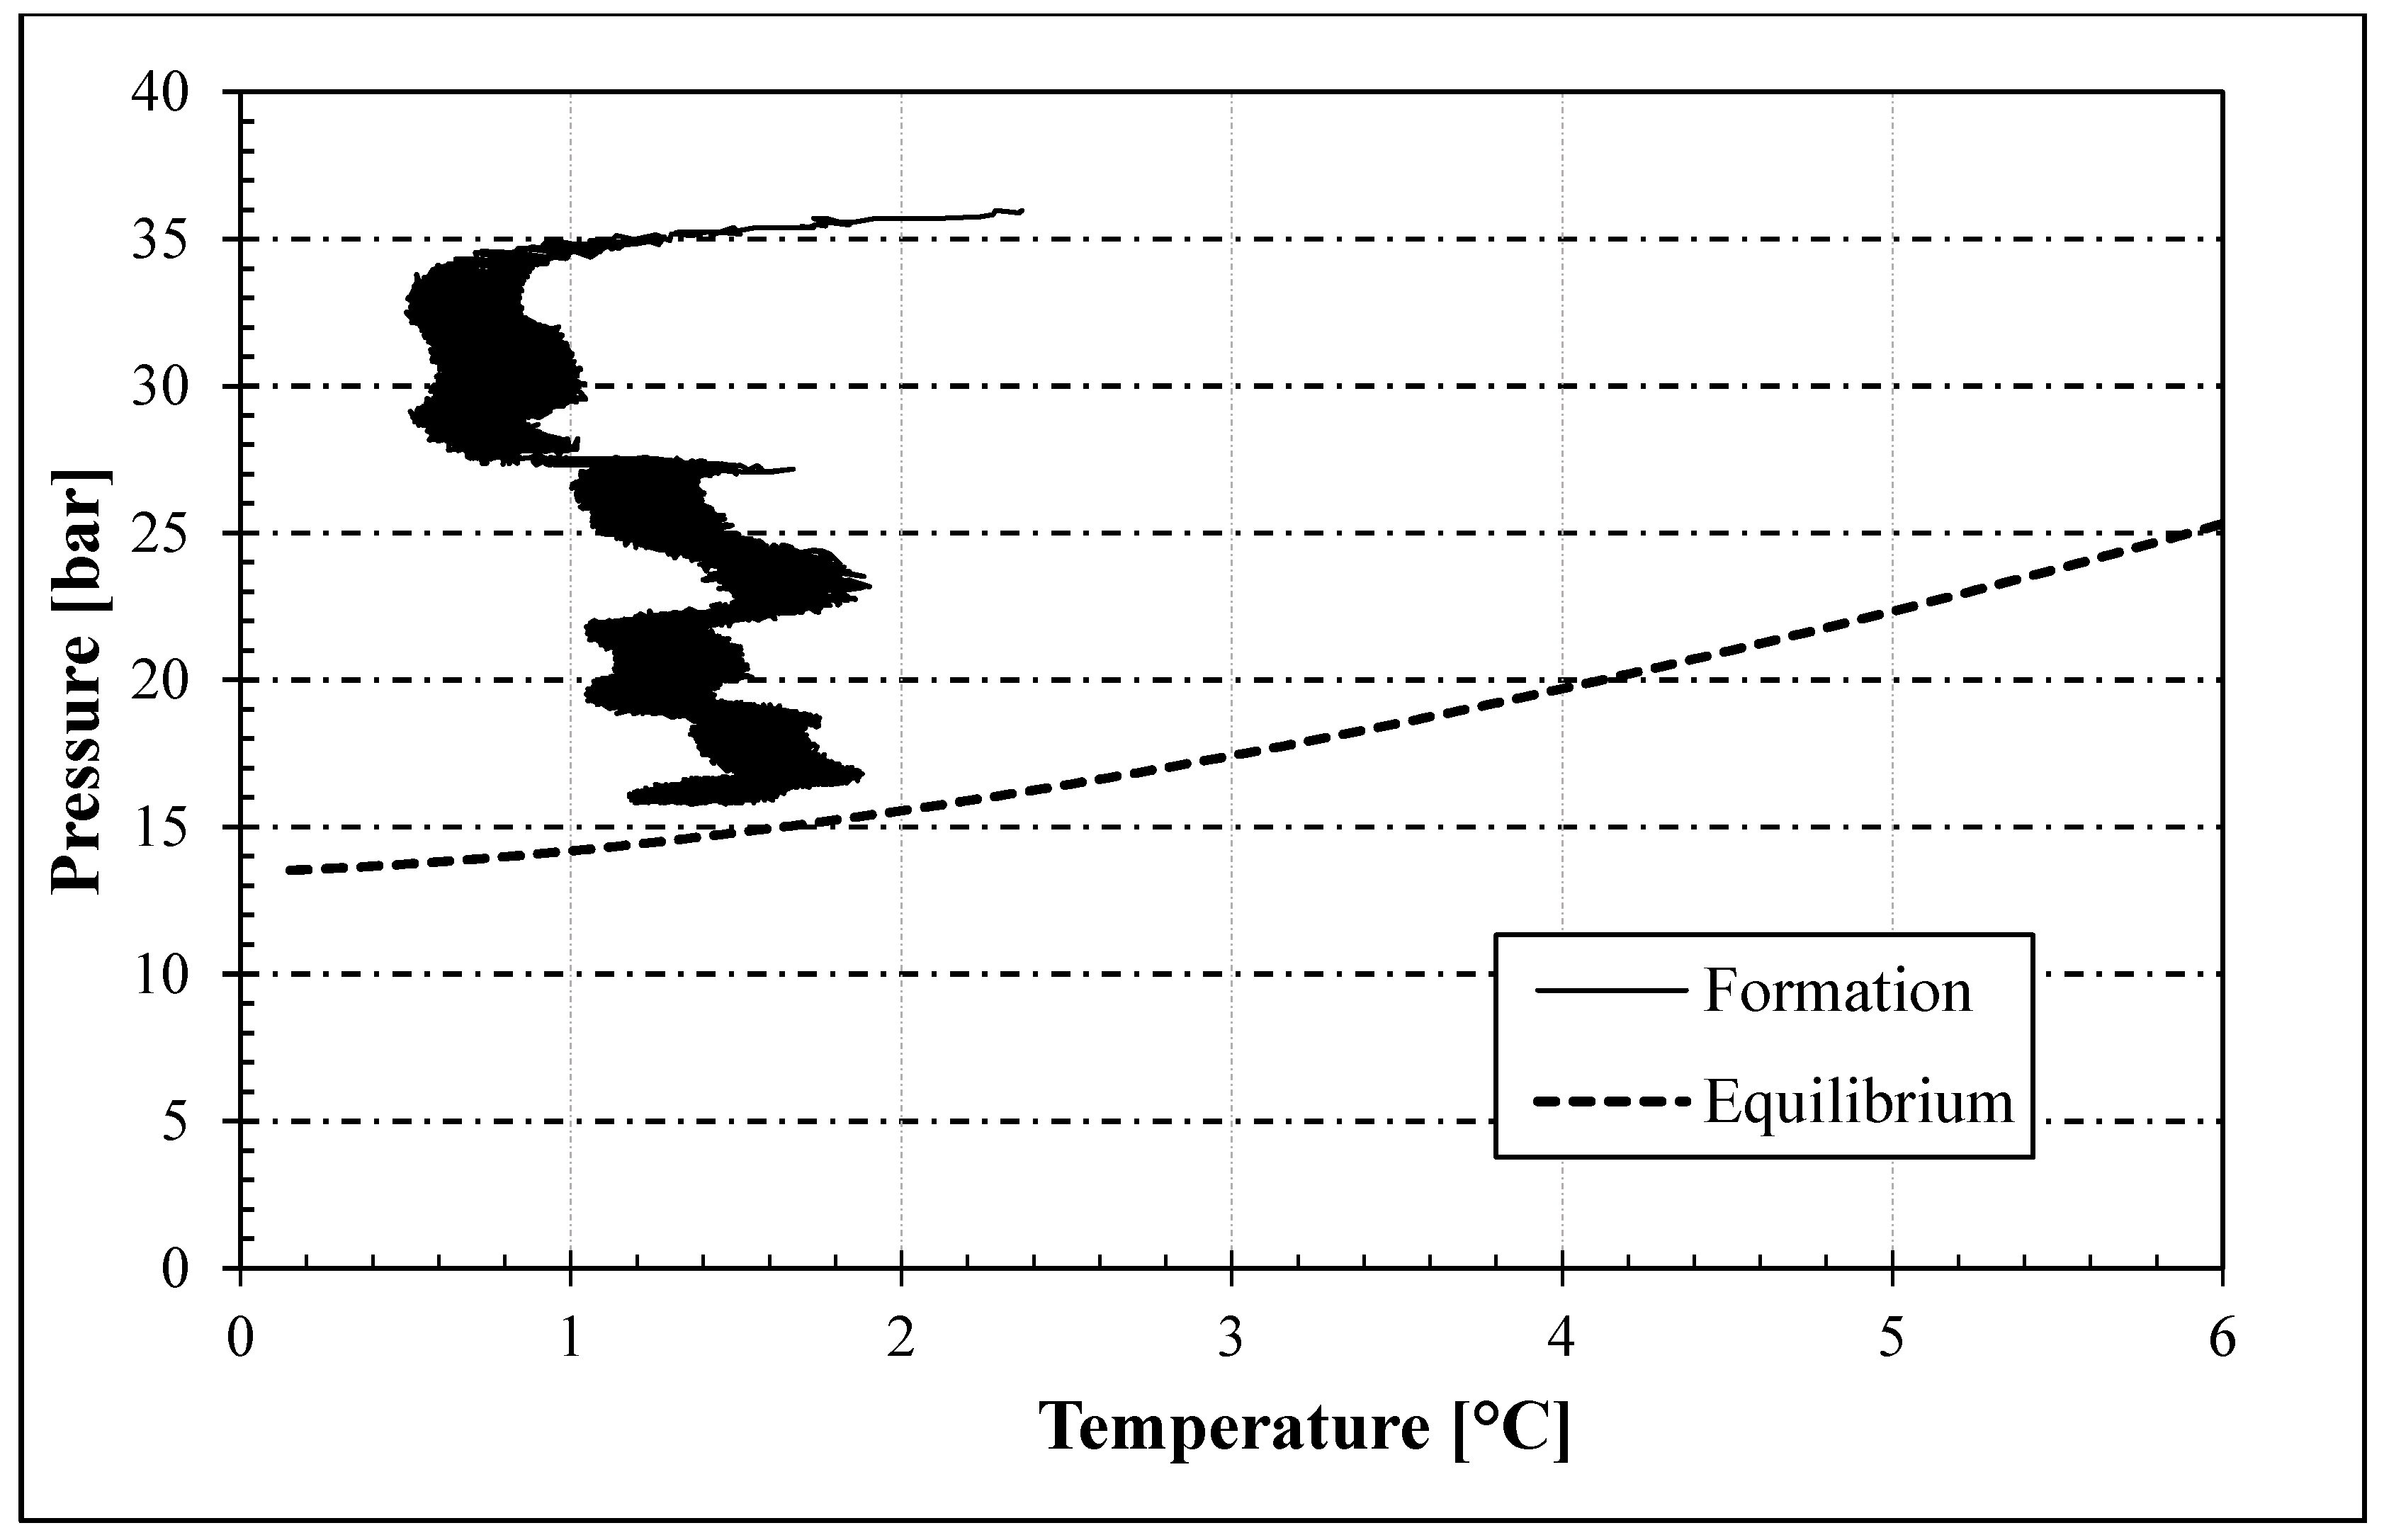
  • In the presence of memory effect, the formation trend was almost linear and well approximated the phase boundary equilibrium. The distance between the two curves mainly depended on the presence of the porous medium, with its specific characteristics, and on the process variables which always characterize the formation phase (equilibrium lines are defined during dissociation). Conversely, in tests without memory, the process started only after the system entered widely within the stability zone; thus, it occurred at lower temperatures and its trend was completely different from the equilibrium curve.
  • Time required for the process completion was drastically higher in tests without memory, up to four times higher.
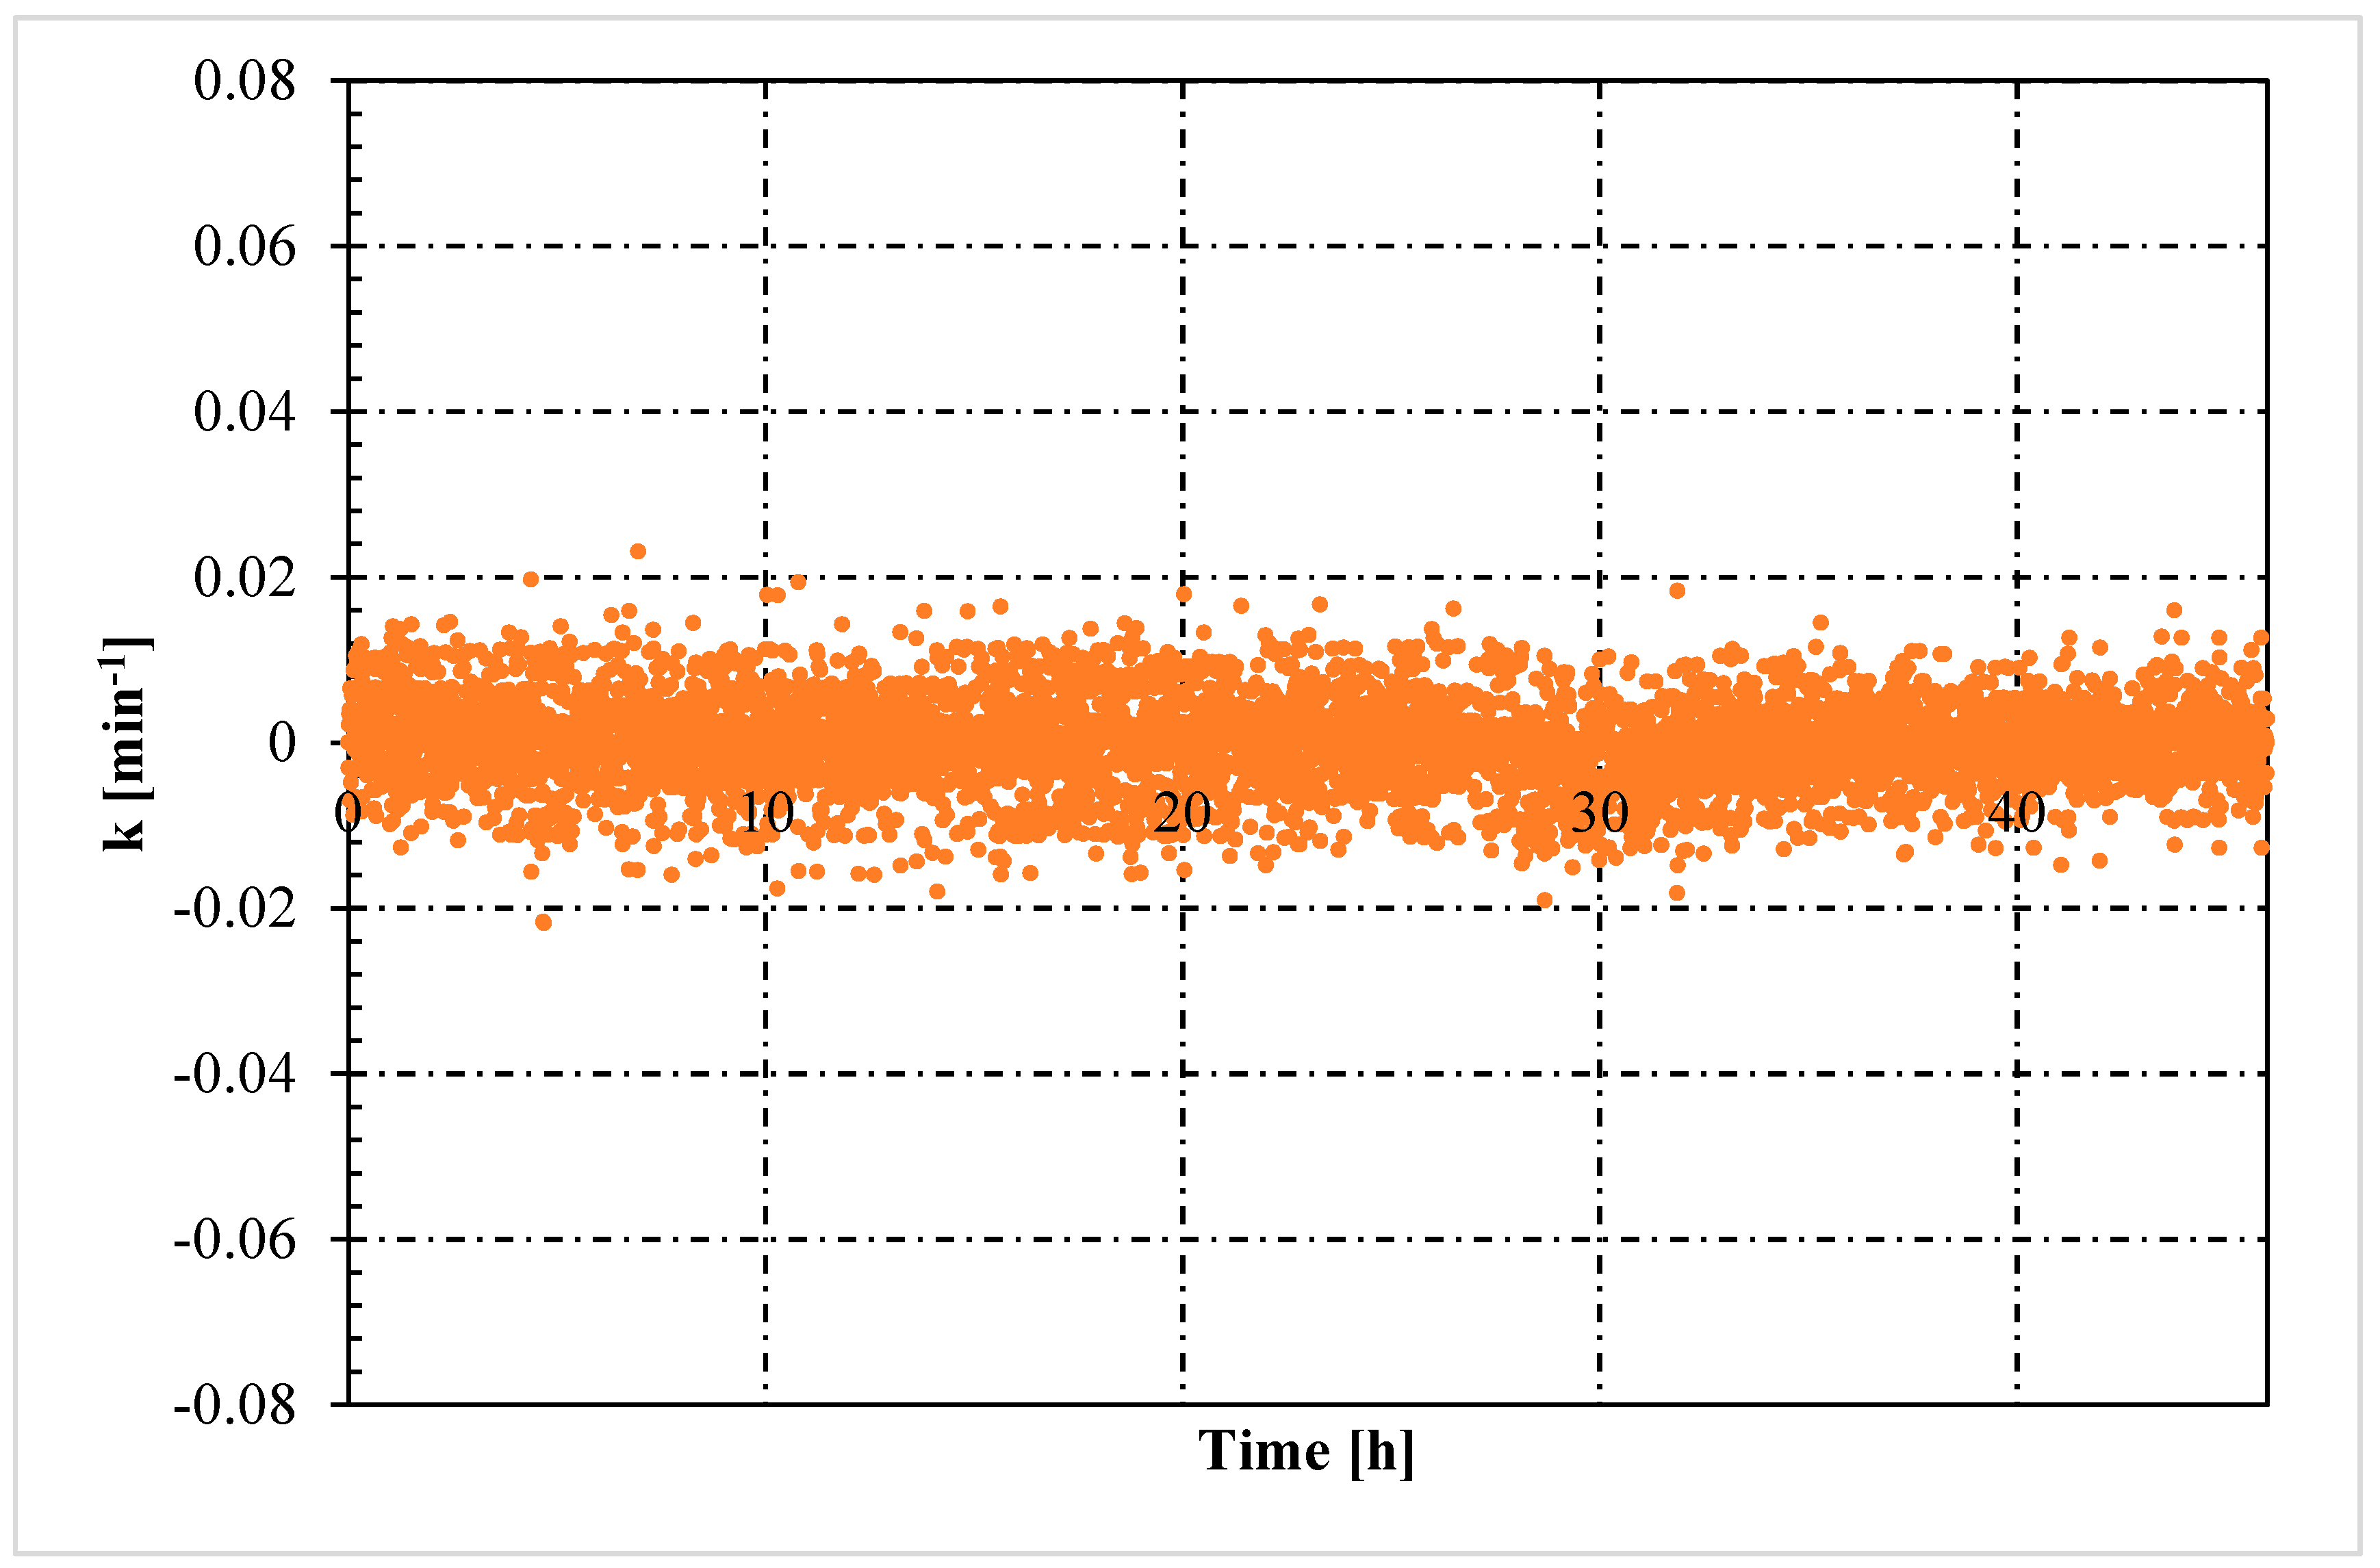
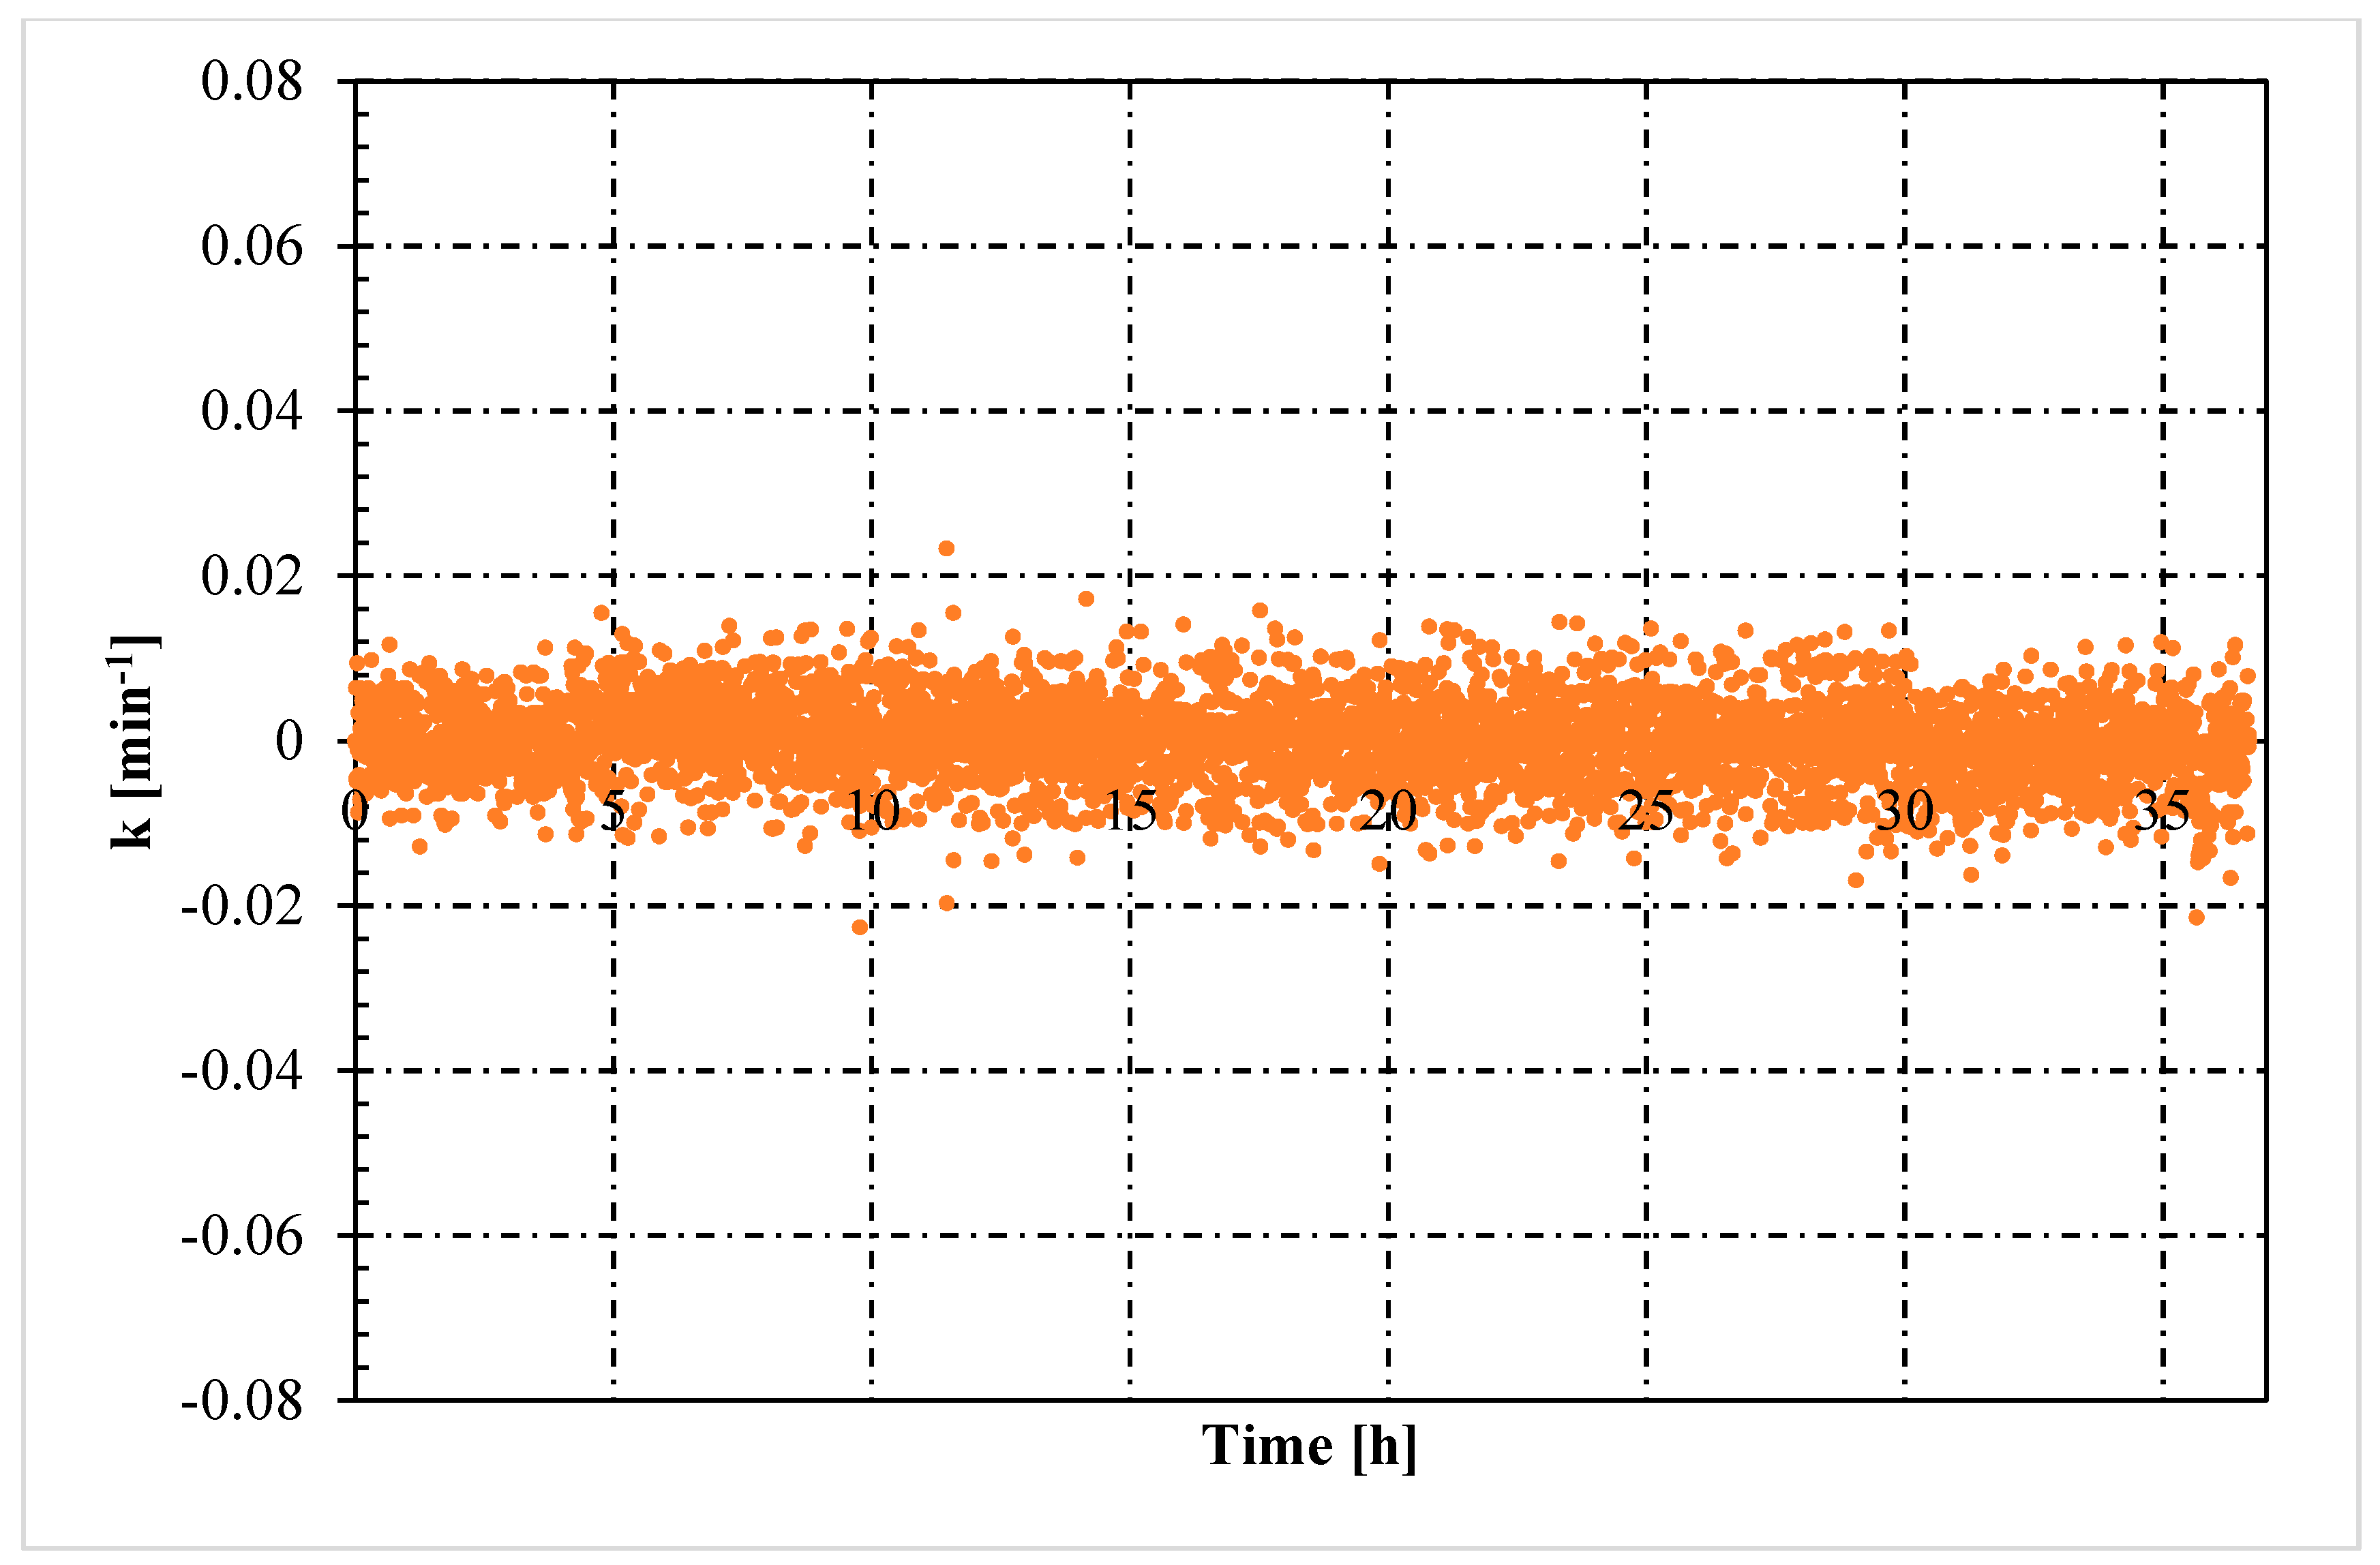
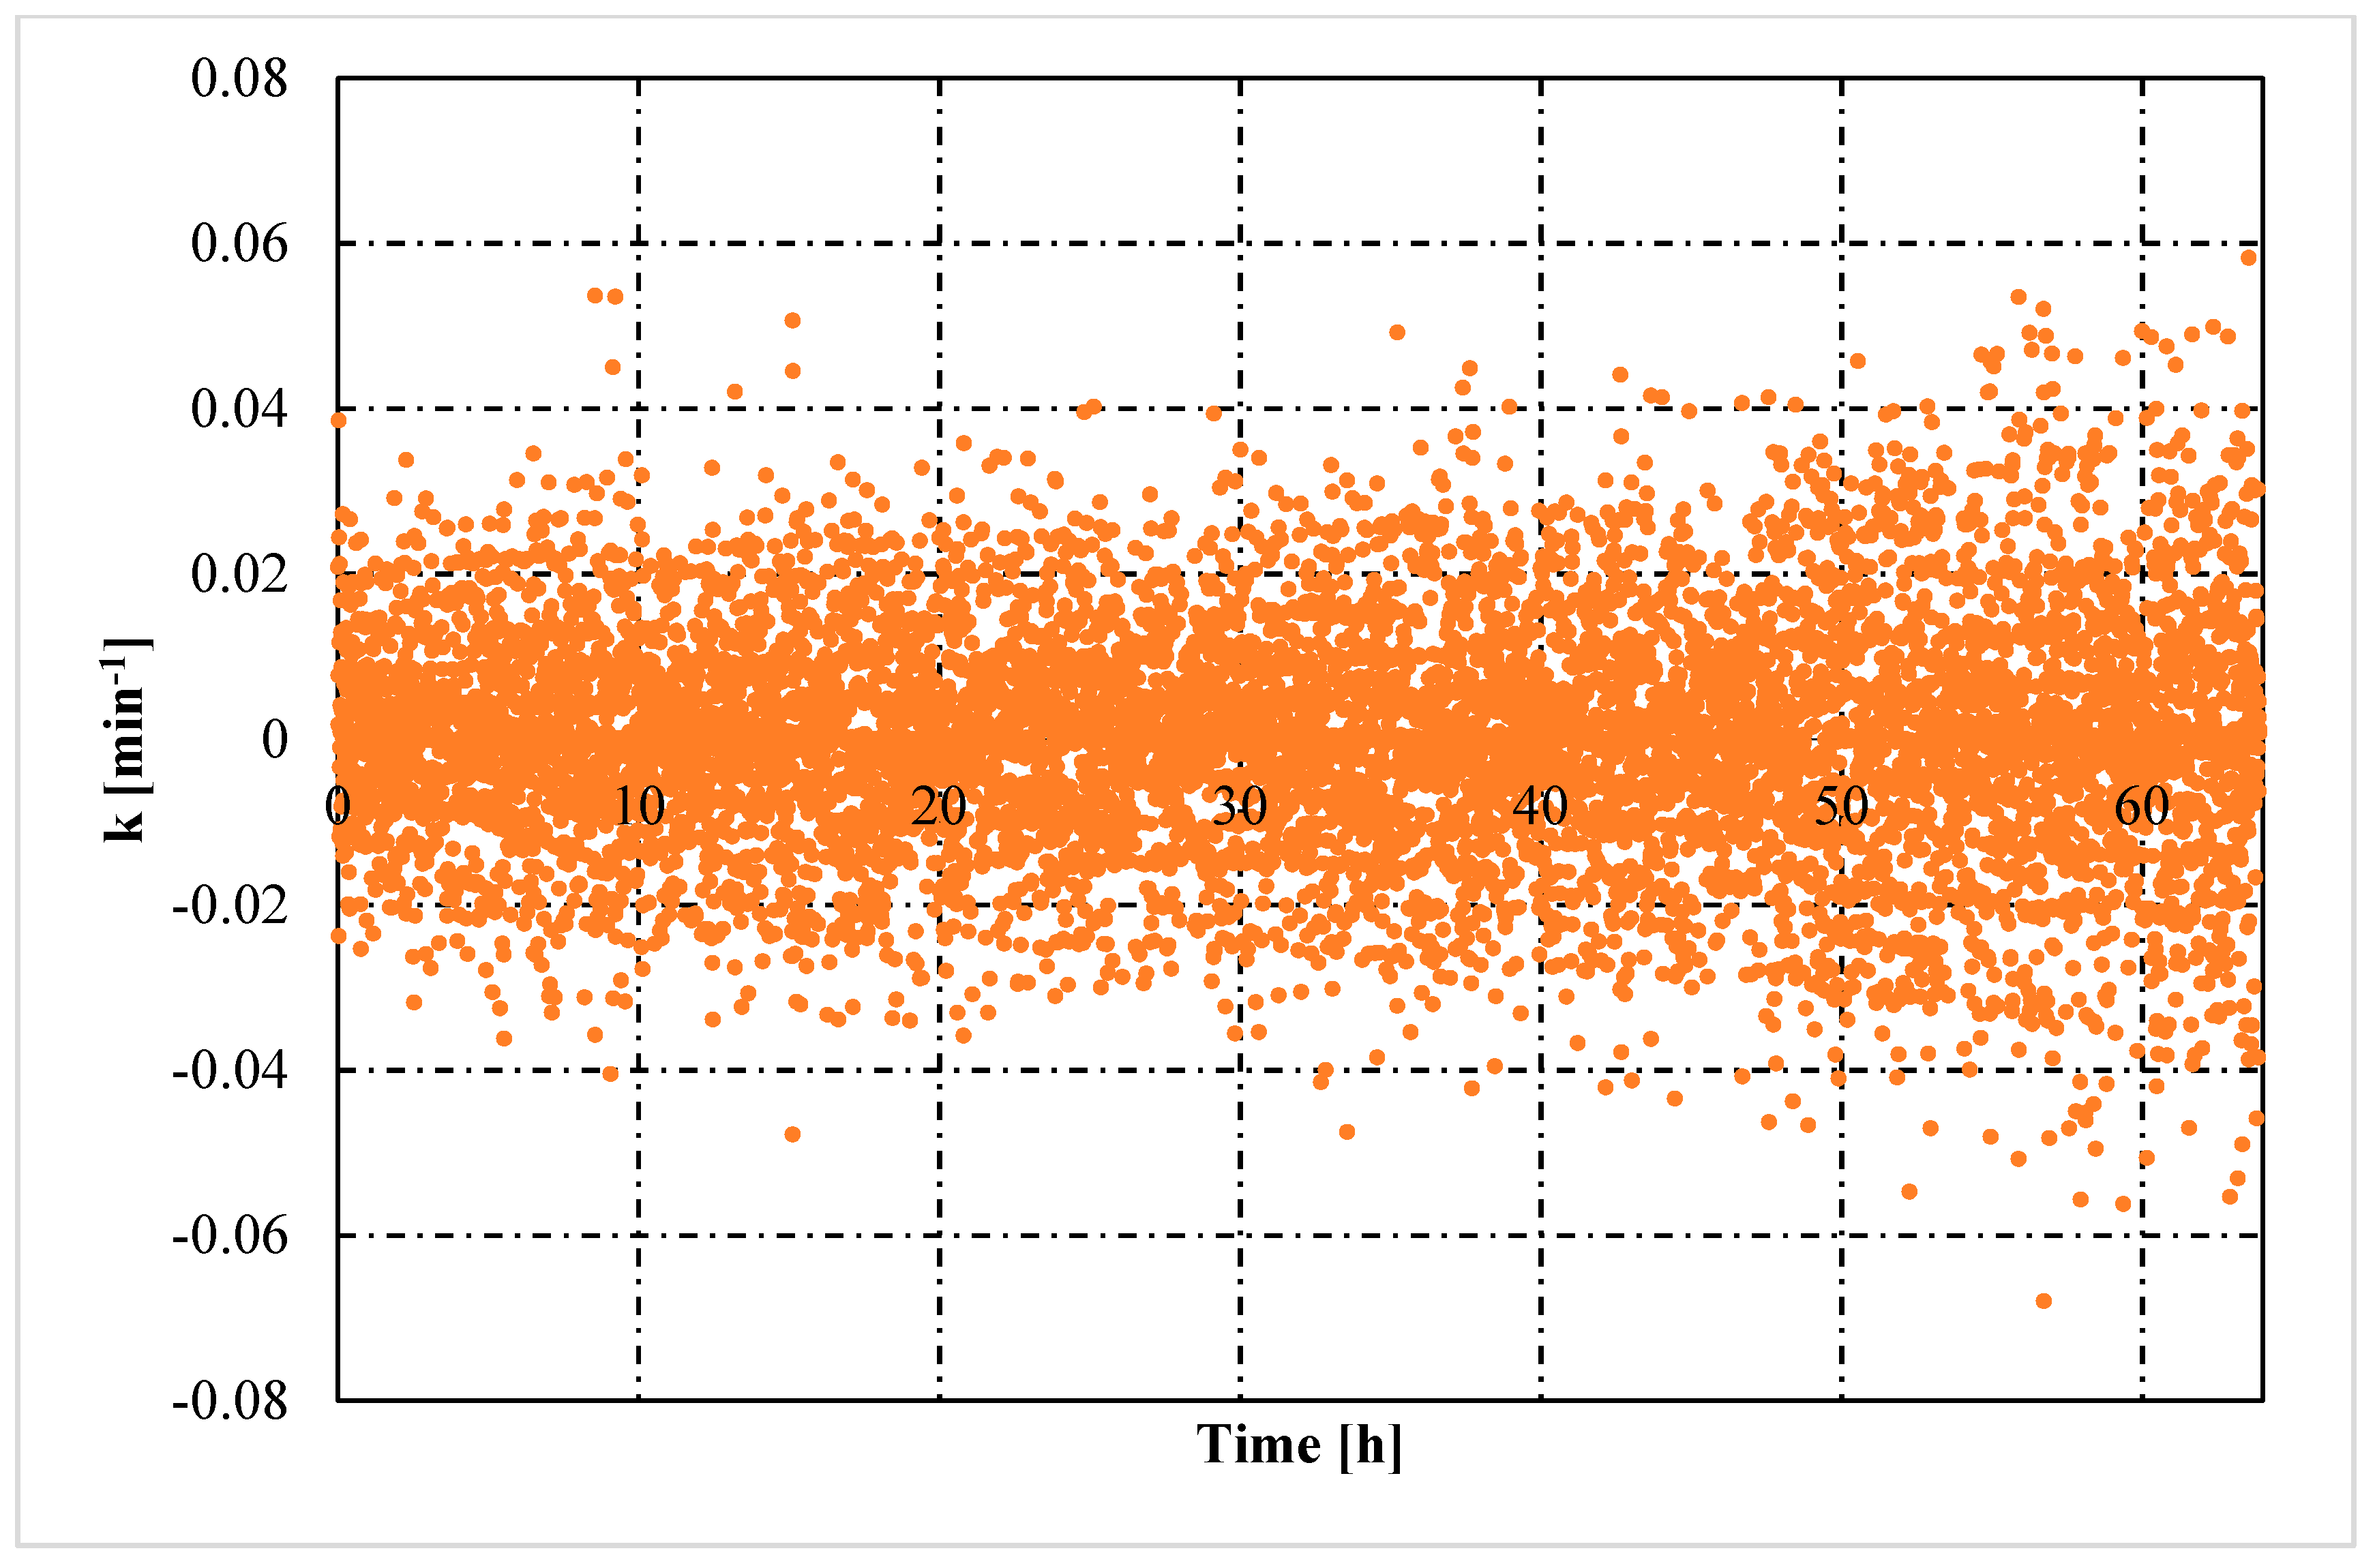
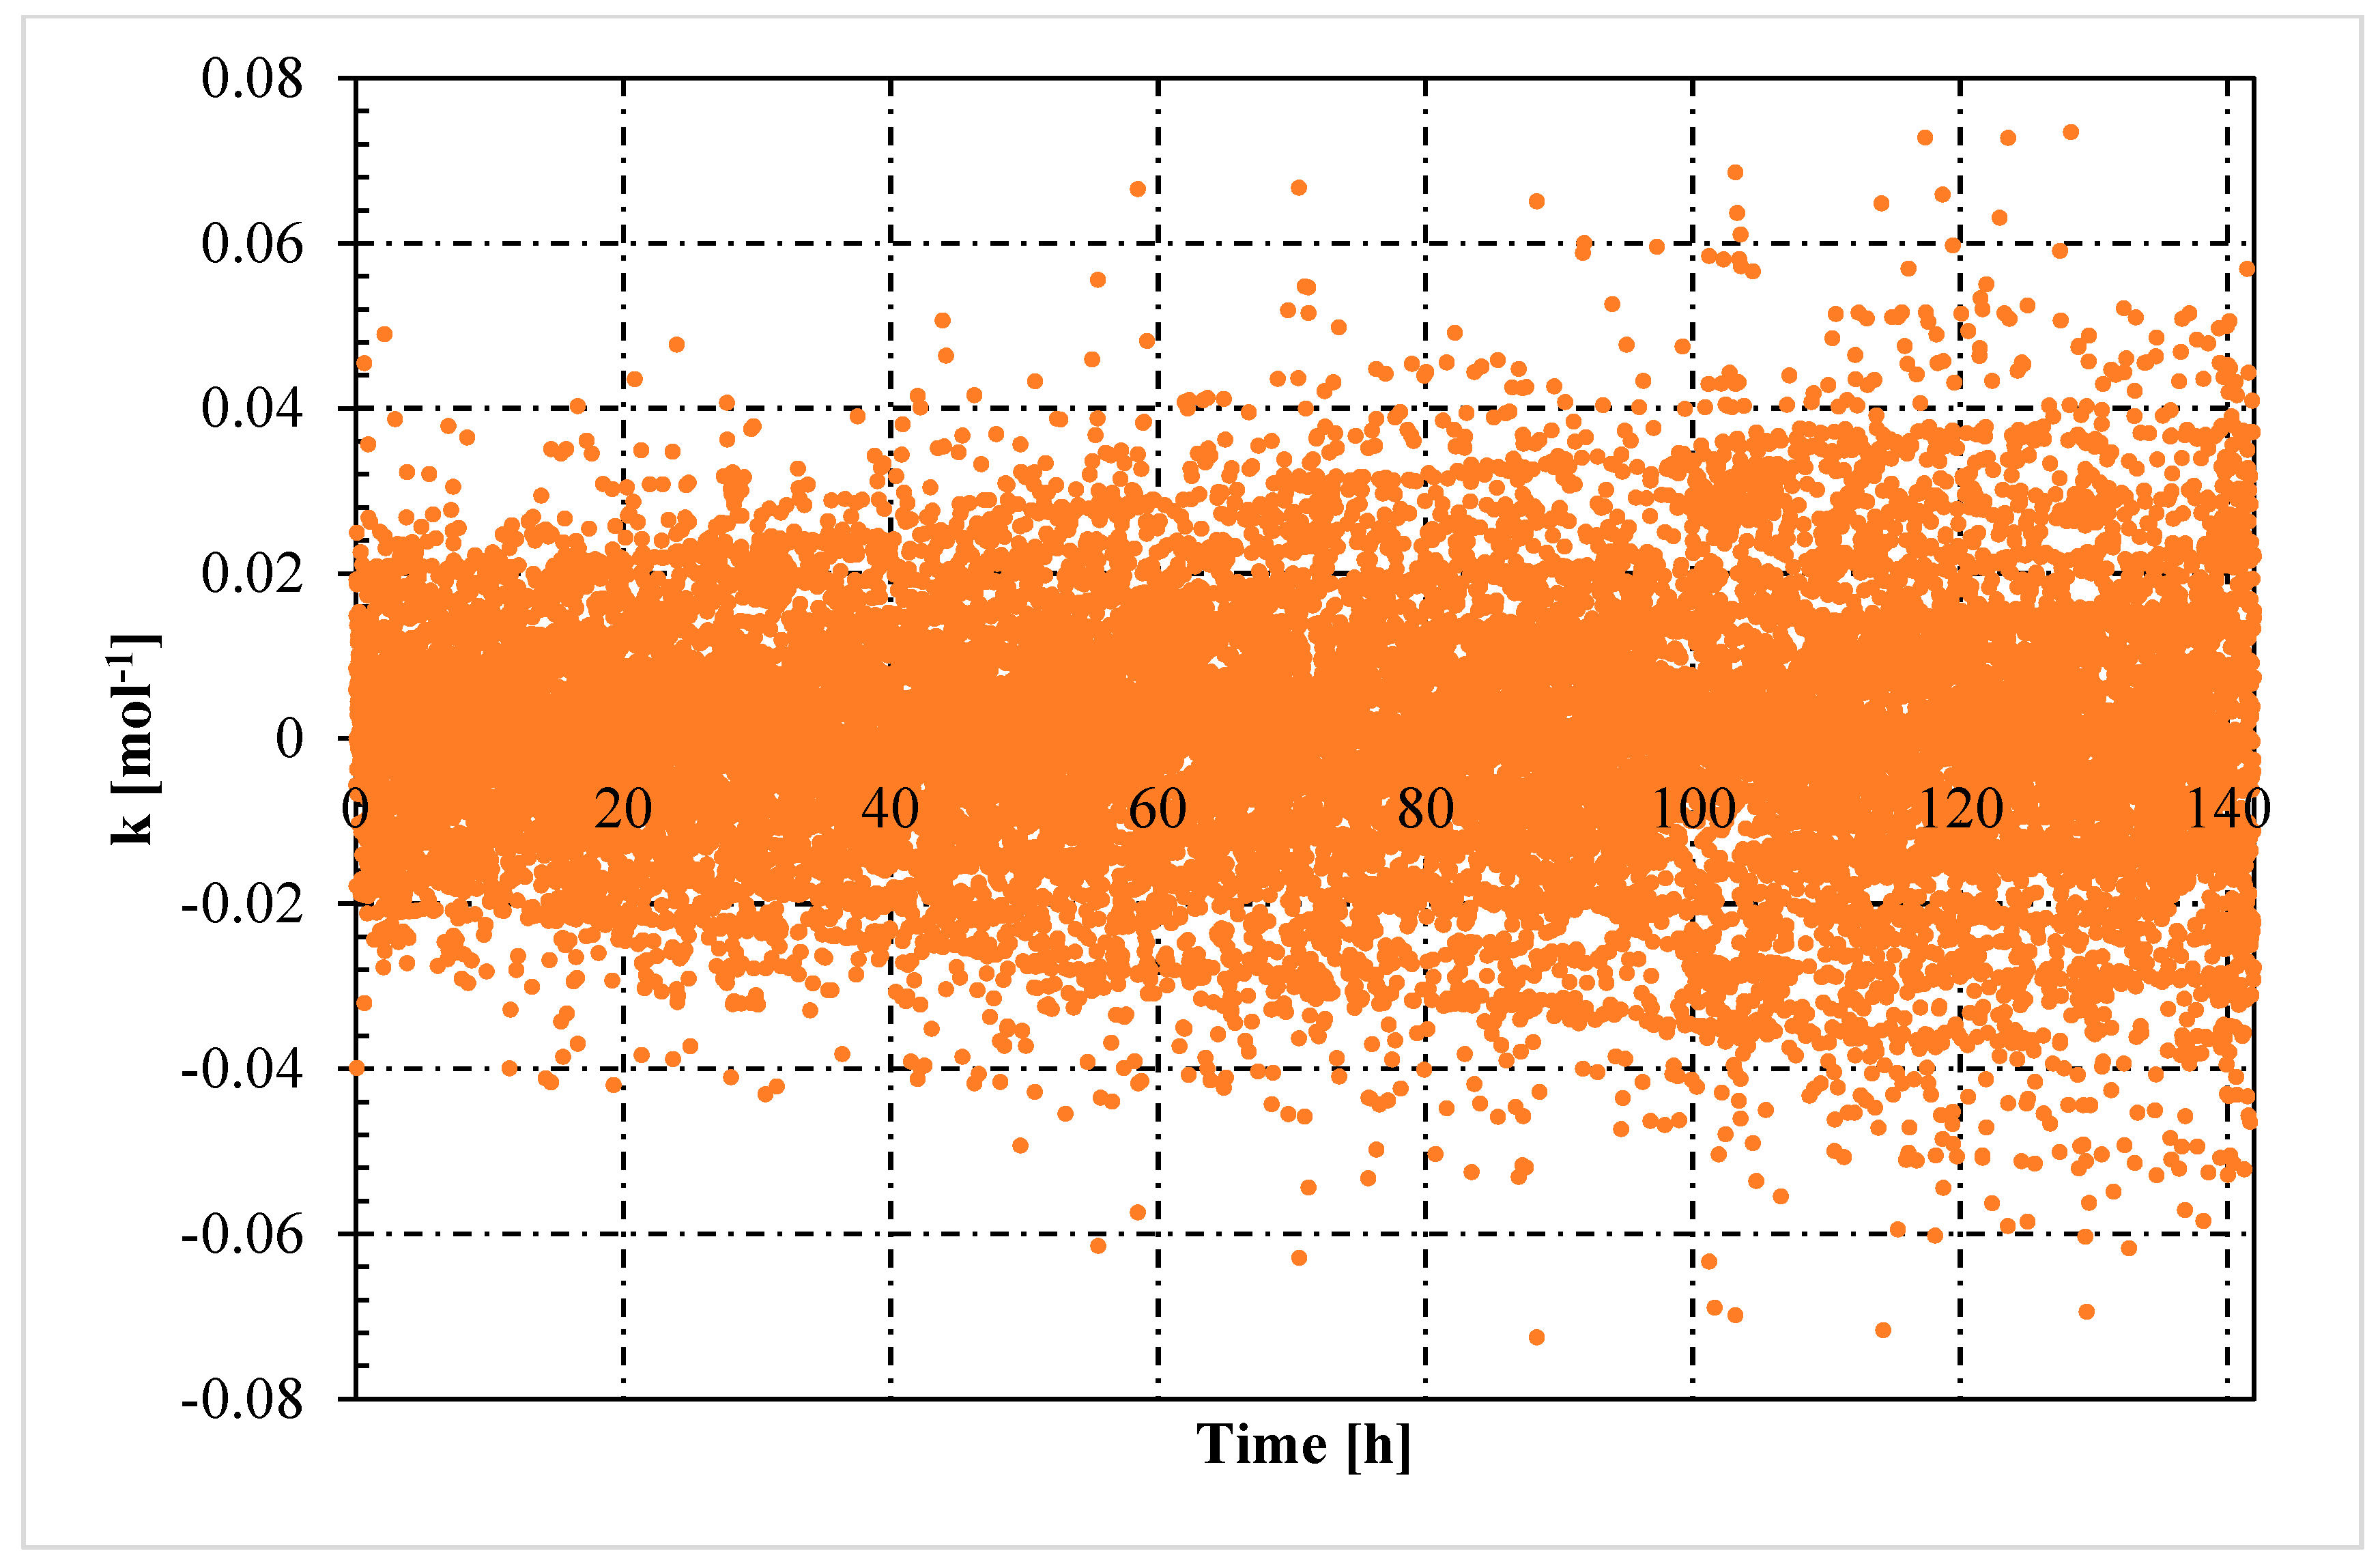
  • The rate constant showed an oscillating trend in both situations, proving that the hydrates formed and dissociated continuously, according to the Labile Cluster Theory. However, in Tests with memory, oscillations were less pronounced.
  • Moreover, in tests with memory, the rate constant remained constant over time, proving that the process was less dependent from the local thermodynamic conditions and. In particular, from their variation (remaining them within the hydrate stability zone). Differently, in tests without memory, the rate constant increased with time. Such phenomenon was explained with the decrease between experimental and equilibrium thermodynamic condition, which gradually reduced in intensity the driving forces of the process.
Finally, the pressure drop observed in the two groups of experiments was completely comparable. It means that, hydrates formed massively in both cases. This latter consideration allowed us to conclude that the memory effect mainly acted as kinetic promoter for the process and, due to the tendency of hydrates to contemporary form and dissociate at conditions close to those of equilibrium and also to the narrow thermodynamic region which is generally available for CO2/CH4 replacement in natural reservoirs, it might represent the key factor to consider for making these processes effectively attractive and suitable for large scale applications.

Author Contributions

Conceptualization, F.R. and A.M.G.; methodology, A.M.G. and Y.L.; software A.M.G.; validation, F.R.; formal analysis, F.R. and Y.L.; investigation, A.M.G. and Y.L.; resources, F.R.; data curation, A.M.G.; writing—original draft preparation, A.M.G. and F.R.; writing—review and editing, A.M.G. and F.R.; supervision, F.R.; project administration, F.R.; funding acquisition, F.R. All authors have read and agreed to the published version of the manuscript.

Funding

This research received no external funding.

Institutional Review Board Statement

Not applicable.

Informed Consent Statement

Not applicable.

Data Availability Statement

Not applicable.

Conflicts of Interest

The authors declare no conflict of interest.

References

  1. Gambelli, A.M.; Filipponi, M.; Rossi, F. How methane release may affect carbon dioxide storage during replacement processes in natural gas hydrate reservoirs. J. Pet. Sci. Eng. 2021, 205, 108895. [Google Scholar] [CrossRef]
  2. Sloan, E.D.; Koh, C.A. Clathrate Hydrates of Natural Gases, 3rd ed.; CRC Press: Boca Raton, FL, USA, 2007. [Google Scholar]
  3. Gambelli, A.M. Analyses on CH4 and CO2 hydrate formation to define the optimal pressure for CO2 injection to maximize the replacement efficiency into natural gas hydrate in presence of silica-based porous medium, via depressurization techniques. Chem. Eng. Process. 2021, 167, 108512. [Google Scholar] [CrossRef]
  4. Englezos, P. Clathrate hydrates. Ind. Eng. Chem. Res. 1993, 32, 1251–1274. [Google Scholar] [CrossRef]
  5. Lee, Y.J.; Kawamura, T.; Yamamoto, Y.; Yoon, J.H. Phase Equilibrium Studies of Tetrahydrofuran (THF) + CH4, THF + CO2, CH4 + CO2, and THF + CO2 + CH4 Hydrates. J. Chem. Eng. 2012, 57, 3543–3548. [Google Scholar] [CrossRef]
  6. Li, X.S.; Xu, C.G.; Zhang, Y.; Ruan, X.K.; Li, G.; Wang, Y. Investigation into gas production from natural gas hydrate: A review. Appl. Energy 2016, 172, 286–322. [Google Scholar] [CrossRef] [Green Version]
  7. Handa, Y.P.; Stupin, D. Thermodynamic Properties and Dissociation Characteristics of Methane and Propane Hydrates in 70 Å—Radius Silica gel Pores. J. Phys. Chem. 1992, 96, 8599–8603. [Google Scholar] [CrossRef]
  8. Uchida, T.; Ebinuma, T.; Ishizaki, T. Dissociation condition measurements of methane hydrate in confined small pores of porous glass. J. Phys. Chem. B 1999, 103, 3659–3662. [Google Scholar] [CrossRef]
  9. Wilder, J.W.; Sheshardi, K.; Smith, D.H. Resolving apparent contradictions in equilibrium measurements for clathrate hydrates in porous media. J. Phys. Chem. B 2001, 105, 9970–9972. [Google Scholar] [CrossRef]
  10. Anderson, R.; Llamendo, M.; Tohidi, B.; Burgass, R.W. Experimental measurement of methane and carbon dioxide clathrate hydrate equilibria in mesoporous silica. J. Phys. Chem. B 2003, 107, 3507–3514. [Google Scholar] [CrossRef]
  11. Smith, D.H.; Wilder, J.W.; Sheshardi, K. Methane hydrate equilibria in silica gels with broad pore-size distribution. AlCHE J. 2002, 48, 393–400. [Google Scholar] [CrossRef]
  12. Liu, H.; Zhan, S.; Guo, P.; Fan, S.; Zhang, S. Understanding the characteristic of methane hydrate equilibrium in materials and its potential application. Chem. Eng. J. 2018, 349, 775–781. [Google Scholar] [CrossRef]
  13. Kang, S.P.; Lee, J.W.; Ryu, H.J. Phase behavior of methane and carbon dioxide hydrates in meso- and micro-sized porous media. Fluid Phase Equilib. 2008, 274, 68–72. [Google Scholar] [CrossRef]
  14. Lee, S.; Seo, Y. Experimental measurement and thermodynamic modelling of the mixed CH4 + C3H8 clathrate hydrate equilibria in silica gel pores: Effects of pore size and salinity. Langmuir 2010, 26, 9742–9748. [Google Scholar] [CrossRef] [PubMed]
  15. Zarifi, M.; Javanmardi, J.; Hashemi, H.; Eslamimanesh, A.; Mohammadi, A.H. Experimental study and thermodynamic modelling of methane mixed C1 + C2 + C3 clathrate hydrates in the presence of mesoporous silica gel. Fluid Phase Equilib. 2016, 423, 17–24. [Google Scholar] [CrossRef]
  16. Zhang, Y.; Li, X.S.; Wang, Y.; Chen, Z.Y.; Yan, K.F. Decomposition conditions of methane hydrate in marine sediments from South China Sea. Fluid Phase Equilib. 2016, 413, 110–115. [Google Scholar] [CrossRef]
  17. Uchida, T.; Ebinuma, T.; Takeya, S.; Nagao, J.; Narita, H. Effects of pore sizes on dissociation temperatures and pressures of methane, carbon dioxide, and propane hydrates in porous media. J. Phys. Chem. B 2002, 106, 820–826. [Google Scholar] [CrossRef]
  18. Anderson, R.; Llamendo, M.; Tohidi, B.; Burgass, R.W. Characteristics of clathrate hydrate equilibria in mesopores and interpretation of experimental data. J. Phys. Chem. B 2003, 107, 3500–3506. [Google Scholar] [CrossRef]
  19. Clennell, M.B.; Henry, P.; Hovland, M.; Booth, J.S.; Winters, W.J. Formation of natural gas hydrates in marine sediments: 1. Conceptual model of gas hydrate growth conditioned by host sediments. J. Geophys. Res. B 1999, 104, 22985–23003. [Google Scholar] [CrossRef]
  20. Henry, P.; Thomas, M.; Clennell, M.B. Formation of natural gas hydrates in marine sediments 2. Thermodynamic calculations of stability conditions in porous sediments. J. Geophys. Res. B 1999, 104, 23005–23022. [Google Scholar] [CrossRef] [Green Version]
  21. Van der Waals, J.H.; Platteeuw, J.C. Clathrate Solutions. Adv. Chem. Phys. 1959, 2, 1–57. [Google Scholar]
  22. Holder, G.D.; Zetts, S.P.; Pradhan, N. Phase behavior in systems containing clathrate hydrates. Rev. Chem. Eng. 1988, 5, 1–70. [Google Scholar] [CrossRef]
  23. Holder, G.D.; Corbin, G.; Papadopoulos, K.D. Thermodynamic and molecular properties of gas hydrates from mixtures containing methane, argon, and krypton. Ind. Eng. Chem. 1980, 19, 282–286. [Google Scholar] [CrossRef]
  24. Zhou, J.; Liang, W.; Wei, C. Phase Equilibrium Condition for Pore Hydrate: Theoretical Formulation and Experimental Validation. J. Geophys. Res. Solid Earth 2019, 124, 12703–12721. [Google Scholar] [CrossRef]
  25. Li, S.L.; Ma, Q.L.; Sun, C.Y.; Chen, L.T.; Liu, B.; Feng, X.J.; Wang, X.Q.; Chen, G.J. A fractal approach on modelling gas hydrate phase equilibria in porous media. Fluid Phase Equilib. 2013, 356, 277–283. [Google Scholar] [CrossRef]
  26. Sun, R.; Duan, Z. An accurate model to predict the thermodynamic stability of methane hydrate and methane solubility in marine environments. Chem. Geol. 2007, 244, 248–262. [Google Scholar] [CrossRef]
  27. Peddireddy, S.; Lee, S.Y.; Lee, J.W. Variable contact angle model for gas hydrate equilibrium in porous media. AlCHE J. 2006, 52, 1228–1234. [Google Scholar] [CrossRef]
  28. Ullerich, J.W.; Selim, M.S.; Sloan, E.D. Theory and measurement of hydrate dissociation. AlCHE J. 1987, 33, 747–752. [Google Scholar] [CrossRef]
  29. Kamath, V.A.; Holder, G.D. Dissociation heat-transfer characteristics of methane hydrates. AlCHE J. 1989, 35, 1049–1052. [Google Scholar] [CrossRef]
  30. Katsuki, D.; Ohmura, R.; Ebinuma, T.; Narita, H. Visual observation of dissociation of methane hydrate crystals in a glass micro model: Production and transfer of methane. J. Appl. Phys. 2008, 104, 083514. [Google Scholar] [CrossRef]
  31. Almenningen, S.; Flatlandsmo, J.; Ferno, M.A.; Ersiand, G. Multiscale laboratory verification of depressurization for production of sedimentary methane hydrates. SPE J. 2017, 22, 138–147. [Google Scholar] [CrossRef]
  32. Beltràn, G.; Servio, P. Morphological investigation of Methane-Hydrate Films Formed on a Glass Surface. Cryst. Growth Des. 2010, 10, 4339–4347. [Google Scholar] [CrossRef]
  33. Em, I.; Stoporev, A.S.; Semenov, A.P.; Glotov, A.; Smirnova, E.; Villevand, G.; Vinokurov, V.A.; Manakov, A.Y.; Lvov, Y.M. Methane Hydrate Formation in Halloyte Clay Nanotubes. ACS Sustain. Chem. Eng. 2020, 8, 7860–7868. [Google Scholar] [CrossRef]
  34. Esmail, S.; Beltràn, J.G. Methane hydrate propagation on surfaces of varying wettability. J. Nat. Gas Sci. Eng. 2016, 35, 1535–1543. [Google Scholar] [CrossRef]
  35. Filarsky, F.; Schmuck, C.; Schultz, H.J. Impact of Modified Silica Beads on Methane Hydrate Formation in a Fixed—Bed Reactor. Ind. Eng. Chem. Res. 2019, 58, 16687–16695. [Google Scholar] [CrossRef]
  36. Em, I.; Zakharenko, A.M.; Kosyanov, D.Y.; Stoporev, A.S.; Gulkov, A.N. Enhancement of gas hydrates synthesis with CNT surfaces. AIP Conf. Proc. 2018, 2051, 020072. [Google Scholar]
  37. Ripmeester, J.A.; Alavi, S. Some current challenges in clathrate hydrate science: Nucleation, decomposition and the memory effect. Curr. Opin. Solid State Mater. Sci. 2016, 20, 344–351. [Google Scholar] [CrossRef] [Green Version]
  38. Gambelli, A.M.; Rossi, F. Thermodynamic and kinetic characterization of methane hydrate nucleation, growth and dissociation processes, according to the Labile Cluster theory. Chem. Eng. J. 2021, 425, 130706. [Google Scholar] [CrossRef]
  39. Li, Y.; Wu, N.; Ning, F.; Gao, D.; Hao, X.; Chen, Q.; Liu, C.; Sun, J. Hydrate-induced clogging of sand-control screen and its implication on hydrate production operation. Energy 2020, 206, 118030. [Google Scholar] [CrossRef]
  40. Roozeboom, H.W.B. Sur l’hydrate de l’acide sulfureux. Recl. Trav. Chim. Pays-Bas 1884, 3, 29–58. [Google Scholar] [CrossRef]
  41. Wilson, P.W.; Haymet, A.D.J. Hydrate formation and re-formation in nucleating THF/water mixtures show no evidence to support a “memory” effect. Chem. Eng. J. 2010, 161, 146–150. [Google Scholar] [CrossRef]
  42. Li, Y.; Wu, N.; He, C.; Sun, Z.; Zhang, Z.; Hao, X.; Chen, Q.; Bu, Q.; Liu, C.; Sun, J. Nucleation probability and memory effect of methane-propane mixed gas hydrate. Fuel 2021, 291, 120103. [Google Scholar] [CrossRef]
  43. Takeya, S.; Hori, A.; Hondoh, T.; Uchida, T. Freezing-Memory Effect of Water on Nucleation of CO2 Hydrate Crystals. J. Phys. Chem. B 2000, 104, 4164–4168. [Google Scholar] [CrossRef]
  44. Wu, Q.; Zhang, B. Memory effect on the Pressure-Temperature Condition and Induction Time of Gas Hydrate nucleation. J. Nat. Gas Chem. 2010, 19, 446–451. [Google Scholar] [CrossRef]
  45. Duchateau, C.; Glénat, P.; Pou, T.-E.; Hidalgo, M.; Dicharry, C. Hydrate Precursor Test Method for the Laboratory Evaluation of Kinetic Hydrate Inhibitors. Energy Fuels 2010, 24, 616–623. [Google Scholar] [CrossRef]
  46. Merkel, S.F.; Schultz, H.J. Methane Extraction from Natural Gas Hydrate Reservoirs with Simultaneous Storage of Carbon Dioxide. Chem. Ing. Tech. 2015, 87, 475–483. [Google Scholar] [CrossRef]
  47. Filarsky, F.; Schmuck, C.; Schultz, H.J. Development of a biogas production and purification process using promoted gas hydrate formation—A feasibility study. Chem. Eng. Res. Des. 2018, 134, 257–267. [Google Scholar] [CrossRef]
  48. Zeng, H.; Wilson, L.D.; Walker, V.K.; Ripmeester, J.A. Effect of Antifreeze Proteins on the Nucleation, Growth, and the Memory Effect during Tetrahydrofuran Clathrate Hydrate Formation. J. Am. Chem. Soc. 2006, 128, 2844–2850. [Google Scholar] [CrossRef]
  49. Gambelli, A.M.; Rossi, F. Formation rate as parameter to distinguish nucleation from hydrate massive growth phase: Experimental investigation in presence of two different porous media. Exp. Therm. Fluid Sci. 2022, 131, 110525. [Google Scholar] [CrossRef]
  50. Gambelli, A.M.; Presciutti, A.; Rossi, F. Kinetic considerations and formation rate for carbon dioxide hydrate, formed in presence of a natural silica-based porous medium: How initial thermodynamic conditions may modify the process kinetic. Thermochim. Acta 2021, 705, 179039. [Google Scholar] [CrossRef]
  51. Sloan, E.D.; Fleyfel, F. A molecular mechanism for gas hydrate nucleation from ice. AIChE J. 1991, 37, 1281–1292. [Google Scholar] [CrossRef]
  52. Muller-Bongartz, B.; Wildeman, T.R.; Sloan, E.D. A hypothesis for hydrate nucleation phenomena. In Proceedings of the Second international Offshore and Polar Engineering Conference, San Francisco, CA, USA, 14–19 June 1992; Available online: https://onepetro.org/ISOPEIOPEC/proceedings-abstract/ISOPE92/All-ISOPE92/ISOPE-I-92-089/22828 (accessed on 10 November 2021).
  53. Gambelli, A.M.; Rossi, F. Experimental investigation on the possibility of defining the feasibility of CO2/CH4 exchange into a natural gas hydrate marine reservoir via fast analysis of sediment properties. Chem. Eng. Res. Des. 2021, 171, 327–339. [Google Scholar] [CrossRef]
  54. Gambelli, A.M. An experimental description of the double positive effect of CO2 injection in methane hydrate deposits in terms of climate change mitigation. Chem. Eng. Sci. 2021, 233, 116430. [Google Scholar] [CrossRef]
  55. Wang, Y.; Feng, J.C.; Li, X.S.; Zhang, Y. Experimental investigation of optimization of well spacing for gas recovery from methane hydrate reservoir in sandy sediment by heat stimulation. Appl. Energy 2017, 207, 562–572. [Google Scholar] [CrossRef]
  56. Yuan, Q.; Sun, C.Y.; Yang, X.; Ma, P.C.; Ma, Z.W.; Liu, B.; Ma, Q.L.; Yang, L.Y.; Chen, G.J. Recovery of methane from hydrate reservoir with gaseous carbon dioxide using a three-dimensional middle-size reactor. Energy 2012, 40, 47–58. [Google Scholar] [CrossRef]
  57. Yin, Z.; Huang, L.; Linga, P. Effect of wellbore design on the production behaviour of methane hydrate-bearing sediments induced by depressurization. Appl. Energy 2019, 254, 113365. [Google Scholar] [CrossRef]
  58. Rossi, F.; Gambelli, A.M.; Sharma, D.K.; Castellani, B.; Nicolini, A.; Castaldi, M.J. Experiments on methane hydrates formation in seabed deposits and gas recovery adopting carbon dioxide replacement strategies. Appl. Therm. Eng. 2019, 148, 371–381. [Google Scholar] [CrossRef]
  59. James, C.; Armstrong, M.; Biaglow, A. Comparison of pure component thermodynamic properties from CHEMCAD with direct calculation using the Peng-Robinson equation of state. Chem. Data Collect. 2020, 30, 100571. [Google Scholar] [CrossRef]
  60. Takeya, S.; Kida, M.; Minami, H.; Sakagami, H.; Hachikubo, A.; Takahashi, N.; Shoji, H.; Soloviev, V.; Wallmann, K.; Biebow, N.; et al. Structure and thermal expansion of natural gas clathrate hydrates. Chem. Eng. Sci. 2006, 61, 2670–2674. [Google Scholar] [CrossRef]
  61. Aregba, A.G. Gas hydrate-Properties, Formation and Benefits. Open J. Yangtze Oil Gas 2017, 2, 27–44. [Google Scholar] [CrossRef] [Green Version]
  62. Stoporev, A.S.; Svarovskaya, L.I.; Strelets, L.A.; Altunina, L.K.; Manakov, A.Y. Effect of reactor wall material on the nucleation of methane hydrate in water-in-oil emulsions. Mendelev Commun. 2018, 28, 343–344. [Google Scholar] [CrossRef]
  63. Nema, Y.; Ohmura, R.; Senaha, I.; Yasuda, K. Quadruple point determination in carbon dioxide hydrate forming system. Fluid Phase Equilib. 2017, 441, 49–53. [Google Scholar] [CrossRef]
  64. Nagashima, H.D.; Fukushima, N.; Ohmura, R. Phase equilibrium condition measurements in carbon dioxide clathrate hydrate forming system from 199.1 K to 247.1 K. Fluid Phase Equilib. 2016, 413, 53–56. [Google Scholar] [CrossRef]
  65. Khan, M.S.; Partoon, B.; Bavoh, C.B.; Lal, B.; Mellon, B.M. Influence of tetramethylammonium hydroxide on methane and carbon dioxide gas hydrate phase equilibrium conditions. Fluid Phase Equilib. 2017, 440, 1–8. [Google Scholar] [CrossRef]
  66. Khan, M.S.; Bavoh, C.; Partoon, B.; Lal, B.; Bustam, M.A.; Shariff, A.M. Thermodynamic effect of ammonium based ionic liquids on CO2 hydrates phase boundary. J. Mol. Liq. 2017, 238, 533–539. [Google Scholar] [CrossRef]
  67. Sadeq, D.; Iglauer, S.; Lebedev, M.; Smith, C.; Barifcani, A. Experimental determination of hydrate phase equilibrium for different gas mixtures containing methane, carbon dioxide and nitrogen with motor current measurements. J. Nat. Gas Sci. Eng. 2017, 38, 59–73. [Google Scholar] [CrossRef] [Green Version]
  68. Chen, L.; Sun, C.; Chen, G.; Nie, Y.; Sun, Z.; Liu, Y. Measurements of Hydrate Equilibrium Conditions for CH4, CO2, and CH4 + C2H6 + C3H8 in Various Systems by Step-heating Method. Chin. J. Chem. Eng. 2009, 17, 635–641. [Google Scholar] [CrossRef]
  69. Jarrahian, A.; Nakhaee, A. Hydrate-liquid-vapor equilibrium condition for N2 + CO2 + H2O system: Measurement and modelling. Fuel 2019, 237, 769–774. [Google Scholar] [CrossRef]
  70. Kyung, D.; Lee, K.; Kim, H.; Lee, W. Effect of marine environmental factors on the phase equilibrium of CO2 hydrate. Int. J. Greenh. Gas Control 2014, 20, 285–292. [Google Scholar] [CrossRef]
  71. Seo, Y.T.; Lee, H. Multiple-phase hydrate equilibria of the ternary carbon dioxide, methane, and water mixtures. J. Phys. Chem. B 2001, 105, 10084–10090. [Google Scholar] [CrossRef]
  72. Rossi, F.; Gambelli, A.M. Thermodynamic phase equilibrium of single-guest hydrate and formation data of hydrate in presence of chemical additives: A review. Fluid Phase Equilib. 2021, 536, 112958. [Google Scholar] [CrossRef]
  73. Shicai, S.; Yong, Z.; Changling, L.; Yufeng, L. Preliminary study on measurement technology for hydrate phase equilibrium. Fluid Phase Equilib. 2015, 403, 60–69. [Google Scholar] [CrossRef]
  74. Yu, Y.S.; Zhou, S.D.; Li, X.S.; Wang, S.L. Effect of graphite nanoparticles on CO2 hydrate phase equilibrium. Fluid Phase Equilib. 2016, 414, 23–28. [Google Scholar] [CrossRef]
  75. Pahlavanzadeh, H.; Farhoudi, A.; Manteghian, M. Experimental measurement of carbon dioxide clathrate hydrate in the presence of adamantane and other water soluble and insoluble additives. J. Chem. Thermodyn. 2019, 135, 352–358. [Google Scholar] [CrossRef]
  76. Herri, J.M.; Bouchemoua, A.; Kwatersky, M.; Fezoua, A.; Ouabbas, Y.; Cameirao, A. Gas hydrate equilibria for CO2-N2 and CO2-CH4 gas mixtures—Experimental studies and thermodynamic modelling. Fluid Phase Equilib. 2011, 301, 171–190. [Google Scholar] [CrossRef] [Green Version]
  77. Kvamme, B. Kinetics of hydrate formation, dissociation and reformation. Chem. Thermodyn. Therm. Anal. 2021, 1–2, 100004. [Google Scholar] [CrossRef]
  78. Kvamme, B.; Zhao, J.Z.; Wei, N.; Sun, W.T.; Saeidi, N.; Pei, J.; Kuznetsova, T. Hydrate production philosophy and thermodynamic calculations. Energies 2020, 13, 672. [Google Scholar] [CrossRef] [Green Version]
  79. Kvamme, B. Kinetics of hydrate formation from nucleation theory. Int. J. Offshore Polar. 2002, 12, 256–263. [Google Scholar]
  80. Kvamme, B. Droplets of dry ice and cold liquid CO2 for self-transport of CO2 to large depths. Int. J. Offshore Polar. 2003, 13, 139–146. [Google Scholar]
  81. Chaturvedi, E.; Maiti, M.; Laik, S.; Mandal, A. Mineralogical and structural characterization of the sediments of Krishna Godavari and Mahanadi Basin and their influences on hydrate formation kinetics. Adv. Powder Technol. 2021, 32, 1247–1263. [Google Scholar] [CrossRef]
Figure 1. Scheme of the reactor and its main measures.
Sustainability 13 13797 g001
Figure 2. Scheme of the experimental apparatus.
Sustainability 13 13797 g002
Figure 3. Typical decrease in temperature programmed with the cooling system used during experiments.
Sustainability 13 13797 g003
Figure 4. Carbon dioxide hydrates formed in absence of porous sand.
Sustainability 13 13797 g004
Figure 5. Carbon dioxide hydrates formed in presence of porous sand.
Sustainability 13 13797 g005
Figure 6. Pressure-temperature trend in Test 1, belonging to group WM (Pi = 36.02 bar; Ti = 5.9 °C).
Sustainability 13 13797 g006
Figure 7. Pressure-temperature trend in Test 2, belonging to group WM (Pi = 33.19 bar; Ti = 5.9 °C).
Sustainability 13 13797 g007
Figure 8. Pressure-temperature trend in Test 3, belonging to group WM (Pi = 31.52 bar; Ti = 4.1 °C).
Sustainability 13 13797 g008
Figure 9. Pressure-temperature trend in Test 4, belonging to group NM (Pi = 36.26 bar; Ti = 1.1 °C).
Sustainability 13 13797 g009
Figure 10. Pressure-temperature trend in Test 5, belonging to group NM (Pi = 34.7 bar; Ti = 4.3 °C).
Sustainability 13 13797 g010
Figure 11. Pressure-temperature trend in Test 6, belonging to group NM (Pi = 35.89 bar; Ti = 2.4 °C).
Sustainability 13 13797 g011
Figure 12. Schematization about how the two different formation processes occurred: in Test WM, the process approached the equilibrium curve while, in Tests NM, hydrates formed at almost constant temperature.
Sustainability 13 13797 g012
Figure 13. Rate constant measured during hydrates formation in Test 1 (with memory).
Sustainability 13 13797 g013
Figure 14. Rate constant measured during hydrates formation in Test 2 (with memory).
Sustainability 13 13797 g014
Figure 15. Rate constant measured during hydrates formation in Test 3 (with memory).
Sustainability 13 13797 g015
Figure 16. Rate constant measured during hydrates formation in Test 4 (no memory).
Sustainability 13 13797 g016
Figure 17. Rate constant measured during hydrates formation in Test 5 (no memory).
Sustainability 13 13797 g017
Figure 18. Rate constant measured during hydrates formation in Test 6 (no memory).
Sustainability 13 13797 g018
Publisher’s Note: MDPI stays neutral with regard to jurisdictional claims in published maps and institutional affiliations.

