Article

Biomass Valorization to Bioenergy: Assessment of Biomass Residues’ Availability and Bioenergy Potential in Nigeria

by
Uchechukwu Stella Ezealigo
1,*,
Blessing Nonye Ezealigo
2,
Francis Kemausuor
3,
Luke Ekem Kweku Achenie
4 and
Azikiwe Peter Onwualu
1
1
Department of Materials Science and Engineering, African University of Science and Technology, Abuja 900107, Nigeria
2
Department of Physics and Astronomy, University of Nigeria, Nsukka 410001, Nigeria
3
Department of Agricultural and Biosystems Engineering, Kwame Nkrumah University of Science and Technology, Kumasi AK 4448-6434, Ghana
4
Department of Chemical Engineering, Virginia Polytechnic Institute and State University, Blacksburg, VA 24061, USA
*
Author to whom correspondence should be addressed.
Sustainability 2021, 13(24), 13806; https://doi.org/10.3390/su132413806
Submission received: 25 September 2021 / Revised: 23 November 2021 / Accepted: 23 November 2021 / Published: 14 December 2021
(This article belongs to the Topic Actions for Bioenergy and Biofuels: A Sustainable Shift)

Abstract

:
The bioenergy sector in Nigeria currently lacks a proper assessment of resource availability. In this study, we investigated the bioenergy potential of agricultural residues and municipal solid and liquid waste using data from 2008 to 2018, and we applied a computational and analytical approach with mild assumptions. The technical potential for the production of cellulosic ethanol and biogas was estimated from the available biomass. It was discovered that higher energy was generated from biogas than cellulosic ethanol for the same type of residue. The available crop residue technical potential of 84 Mt yielded cellulosic ethanol and biogas of 14,766 ML/yr (8 Mtoe) and 15,014 Mm3/yr (13 Mtoe), respectively. Biogas has diverse applications ranging from heat to electric power generation and therefore holds great potential in solving the current electricity crisis in Nigeria. It will also position the nation towards achieving the 7th sustainable development goal (SDG 7) on clean and affordable energy.

1. Introduction

Biomass from agricultural products is abundant, and it has a strong potential for sustainable renewable energy generation [1]. Currently, biomass is responsible for about 14% of the primary energy consumed globally [2]. Agricultural residues from crops and forestry can be converted to energy carriers (solid fuel, biogas, and cellulosic ethanol) through several techniques. They have found applications in transport fuels, electricity, and heat generation [3].
Nigeria depends principally on fossil fuels (about 86%) and hydropower plants for electricity generation [4]. The overdependence on fossil fuels has negative implications for environmental sustainability [5,6]. The lack of diversity and the high power demand are factors leading to inconsistency in the electricity supply in the country. Therefore, there is a need to adopt green energy sources with less environmental impact that will complement the hydro-plants, thereby decreasing pollution arising from the combustion of fossil fuels. Although Nigeria has a high population (over 200 million) and agricultural production, due to economic problems and lack of proper assessment of available biomass [7], there has not been significant progress in transitioning to renewable energy sources.
Jekayinfa and Scholz [8] estimated residues generated from nine crops in Nigeria for 2000–2004. Their findings were restricted to only crop residues and for five years. In the same vein, Simonyan and Fasina [9] estimated the bioenergy potential of residues from crops, perennial plantation, forestry, animal waste, and urban municipal waste in Nigeria using data for 2010 only. However, their study did not relate the estimated energy potential to a specific energy carrier. Alhassan et al. [10] used five crop residues obtained in Kwara State, Nigeria, to estimate the energy potentials for power solutions. In their assessment, they used theoretical potential values rather than the technical potential for these residues. The challenge is the limitation imposed by the use of the latter potential due to its unreliability for energy application [11]. Therefore, there exists a knowledge gap in adequately quantifying the bioenergy potential.
The present work aimed at estimating the total energy obtainable from agricultural residues (crops, forests, and livestock) and municipal waste for biofuel application. We investigated an 11-year (2008–2018) span to arrive at a holistic perspective and meaningful conclusions. Specifically, we adopted a computational/analytical approach to determine the bioenergy potential from cellulosic ethanol and biogas. In conclusion, we highlighted some possible challenges to the generation of bioenergy and implications on the bio-economy of Nigeria, and we made recommendations. Our findings are relevant to stakeholders, investors, and organisations in the sustainable environment and renewable energy sector for the government to adopt best practices towards the diversification of electric power generation in Nigeria.

2. Materials and Methods

2.1. Case Study

In this study, biomass resources in Nigeria were evaluated. These resources include crop residues, forest residues, livestock dung, and municipal waste generated in the country. The residue availability and bioenergy potential were assessed based on a resource-focused computational and analytical approach, using the technical potential generated from residue produced in year the 2008–2018. Data were sourced from the Food and Agriculture organization of the United Nations statistics (FAOSTAT) database [12]. The bioenergy potential of residues was estimated statistically. Although this method is simple, reproducible, low cost, and transparent, it is deficient in accounting for the economic dimensions required for evaluating the availability of land for energy crop production, the impact of bioenergy production on the environment, as well as social constraints for some key factors that elucidate the influence on soil, biodiversity, climate, cost, and other macro-economic factors on bioenergy potential.
The conceptual framework for the research is shown in Figure 1. The biomass residues are classified as agricultural residues and municipal waste. The various agricultural residues considered included crops (soya beans, seed cotton, sugar cane, sorghum, plantain, groundnut, coconut, rice, cocoa, millet, cowpea, cassava, yam, sweet potatoes, cocoyam, maize, and oil palm), forests (round wood processing such as logging, sawing, and timber processing), and livestock (dung from cattle, chicken, goats, pigs, and sheep). Solid and liquid municipal waste generated was evaluated from the estimated population of 16 major cities, which represents the four geographical regions in Nigeria. Suitable conversion technologies were computationally implemented to transform these residues and wastes into energy carriers, which include solid fuel (from crude crop residues), cellulosic ethanol (from forest and crop residues), and biogas (from the forest, crop residues, livestock, and municipal solid and liquid waste). It is worth noting that in this work, primary biomass (wood fuel and staple crops) was not considered because their conversion to energy carriers is detrimental to the environment (soil status, biodiversity, climate change) and food security. Additionally, certain energy crops (such as Jatropha curcas), grasses (e.g., switchgrass and seaweeds), and microfauna (such as algae) were excluded due to the limitation of certified or reliable data. Table 1 shows the categories of residues considered in this assessment.

2.2. Crop Residues

The crop residues investigated were resources from existing farmlands. However, some assumptions (Section 2.2.1) were made to account for the key parameters for sustainability. Table 2 shows the annual crop production in Nigeria; data were obtained from the FAOSTAT database [12]. The total crop production was highest in 2016, as 164.695, 158.807, and 159.947 million tonnes (Mt) were generated in 2016, 2017, and 2018, respectively (Table 2). Fluctuations were observed in the production of these crops across the 11 years. Furthermore, a total of 27 residues (Table 3) from 17 crops were considered.

2.2.1. Sustainability Assumptions

Some assumptions that were considered are:
  • Land availability: The primary energy crop (PEC) was not considered, hence, there was no land competition for animal husbandry or crop cultivation. There are no certified data regarding the annual production of the PEC, yield, and cultivated land. Therefore, the land-use competition was not taken into account. Only cultivable land was used for the estimation, and no expansion on arable land was included. There was no future projection on PEC.
  • Land use: Since crops are given priority (more lands are allocated to food and fibers), the efficient use of land produces biomass that accounts for a large extent of the available residue for bioenergy assessment. In addition to land availability and use, farm management practices such as the use of improved seed, fertilizer, pest, and weed control with better technology (research and development (R&D)) are the norm for farmers. It, therefore, supports residue availability. These agricultural practices ensure sustainable residue supply from existing farmlands.
  • Soil quality: Soil quality is also an important factor. Lands with rich soil quality will yield more harvest (more residues) than those with poor soil nutrients. Hence, double cropping, alternate crop rotation, appropriate mineral fertilizer, and the use of compost on farmland may increase residue production [13,14].
  • Biodiversity: Biodiversity is limited as there is negligible forest encroachment since only farmlands already in use were considered in this assessment. Additionally, the use of technical residue potential preserves biodiversity, because they are utilized for other purposes.
  • Climate change: The right crop management system on farmlands can reduce climate change.
  • Water: The rain-fed condition was assumed as Nigeria has suitable agro-climatic conditions.
  • Farm practice (animal husbandry): Regarding the livestock manure production, improved feeds with large pasture land support livestock production. With the use of the technical residue potential, the pasture for livestock and manure for soil nutrient renewal is guaranteed.

2.2.2. Theoretical and Technical Crop Residue Potentials

The theoretical residue potential, for each crop, was obtained from the product of the total specific crop available for a given year and the residue-to-product ratio (RPR). RPR is an index that indicates the weight of residue a particular crop generates, based on the produced amount [15]. Taking into account the variability of the RPR values due to several factors identified by Simonyan and Fasina [9], the mean RPR was used. The theoretical potential of the crop residues was estimated using Equation (1):
P t h = P c r o p × R P R
where Pth = theoretical residue potential; Pcrop = crop production; and RPR = the residue-to-product ratio.
The use of theoretical residue potential was not realistic because other forms of crop residue utilization may compete with its availability for bioenergy production. Hence, we considered only the recoverable residue fraction for each crop, referred to as the technical residue potential. The latter is defined as the surplus residue after considering the competition among other uses and spatial restrictions. It is estimated using Equation (2). The obtained value gives the quantitative amount of the excess residues available for energy purposes.
P t e c h = P t h × R f
Ptech = technical residue potential; Rf = recoverable fraction
The technical residue potential was used to estimate the energy potential of cellulosic ethanol and biogas.

2.2.3. Solid Fuel Energy Potential

The bioenergy potential in dried crop residues in their crude forms was calculated using Equation (3). The estimated solid fuel made from crop residues was obtained by multiplying the total annual technical crop residue potential and the lower heating values (Table 3).
P S F E = P t e c h × L H V
PSFE = solid fuel energy potential; LHV = lower heating value (MJ/kg).
Table 3. Parameters used in estimating bioenergy potentials from crop residues.
Crop ResiduesRPRRf (%)LHV b (MJ/kg)
Soya beans straw2.50 a10012.38
Soya beans pods1.00 a10012.38
Seed cotton stalk2.888018.61
Sugar cane tops/leaves0.118015.81
Sugar cane bagasse0.1810018.10
Sorghum straw1.998012.38
Plantain trunks and leaves0.508015.48 c
Groundnut straw1.2510017.58
Groundnut shell0.3710015.66
Coconut husk0.4210018.63
Coconut shell0.2510018.09
Rice husk0.2610019.33
Rice straw1.668016.02
Cocoa bean pods0.938015.12
Millet straw1.838012.38
Cowpea shell1.7510019.44
Cassava stalk0.068017.50
Cassava peeling0.252010.61
Yam straw0.508014.24
Sweet potatoes straw0.508014.24
Cocoyam straw0.508014.24
Maize stalk1.598019.66
Maize husk0.2010015.56
Maize cobs0.2910016.28
Oil palm EFB0.171008.16
Oil palm kernel shell0.0710018.83
Oil palm fibre0.1410011.34
The mean values of RPR and Rf were obtained from Kemausuor et al. [16]. Other values with alphabetic superscripts were sourced as indicated a [17]; b [9]; c [8].

2.2.4. Cellulosic Ethanol Potential

To estimate the bioenergy potential and cellulosic ethanol conversion of the crop residues by anaerobic digestion, some pre-treatment processes such as hydrolysis, enzymatic activities, and microbial fermentation were taken into account. The cellulosic ethanol production from crop residues was estimated using Equation (4):
Y C E = P t e c h · C g l u · y h y d · y e t h · η p r e · η e n z
where:
YCE = yield of cellulosic ethanol;
Ptech = technical potential;
Cglu = concentration of glucan;
yhyd = yield of enzymatically hydrolyzed glucan;
yeth = stoichiometric yield from glucose;
ηpre = efficiency of pretreatment;
ηenz = efficiency enzymatic cellulose conversion
In estimating the cellulosic ethanol production, we assumed fermentation and distillation processes to be 100%, as no loss was considered. The assumed values used for the estimation of cellulosic ethanol production are shown in Table 4.
During the hydrolysis of crop residues for cellulosic ethanol production, two scenarios were considered: no pre-treatment and pre-treatment. In the no pre-treatment case, the enzymatic activity was assumed to be minimal (about 30%) with a production of cellulosic ethanol scale-up ( η S c a l e ) of about 50%. In the pre-treatment scheme, the enzymatic efficiency was assumed to be 90%, to yield cellulosic ethanol of 80%. The bioenergy potential of cellulosic ethanol was estimated from the lower heating value (LHV) of 28.9 MJ/kg and an ethanol density of 0.789 kg/L.

2.2.5. Biogas Potential

The estimation of biogas was performed using the technical residue potential generated for the crop residues. To obtain the biomethane potential (BMP), the Buswell BMP equivalent (Equation (5)) was first determined.
Y B M P   B u s w e l l = ( Y B u s w e l l ,   g l u × C g l u ) + ( Y B u s w e l l ,   h e m × C h e m )
BMP is defined as the theoretical estimate based on the experimental evaluation of a given feedstock for the determination of the maximum volume of methane generated. It is the optimal methane volume per gram of volume solid (VS) of a substrate (i.e., the biodegradable fraction).
YBMP Buswell = estimated biodegradable fraction in specific crop residue (feedstock) for biogas production using Buswell formula;
YBuswell.glu = estimated glucan in specific residue using Buswell formula;
YBuswell.hem = estimated hemicellulose using Buswell formula;
Cglu = concentration of glucan;
Chem = concentration of hemicellulose.
The maximum biogas estimate/potential was determined using Equation (6):
Y B i o g a s = P t e c h × Y B M P   B u s w e l l × η S c a l e
where; YBiogas = biogas yield; ηscale = average efficiency for continuous biogas production.
For the energy potential of biogas, calculations were based on the following assumptions: 1 m3 biomethane has a calorific value of 10 kWh STP; the energy potential of CH4 conversion and the conversion factor of TJ to Mtoe is 0.278 GWh/yr and 24, respectively.

2.3. Forest Residues

From the FAOSTAT database [18], we obtained data on the average industrial round wood harvested yearly in Nigeria. The residues generated from the logging, sawing, and timber processing activities of round wood were determined using the assumption proposed by Koopmans and Koppejan [19]. These residues were classified into three: wood slab, wood bark, and sawdust. Wood slabs were taken to be 40% and 38% for logging and sawmilling processes, respectively, while, for sawdust, the values were 12% and 20%, in the same processes. In addition, the sawdust from the particleboard was 10%, while the residue from the wood bark during sawmilling was 12%. These values were adopted following Simonyan and Fasina [9] and Koopmans and Koppejan [19].

2.3.1. Cellulosic Ethanol from Forest Residues

Similar to the ethanol estimation from crop residues, the cellulosic ethanol potential from wood residues was determined using Equation (7).
Y C E   ( f o r e s t   r e s i d u e s ) = P F R × C g l u × Y h y d × Y e t h × η P r e × η e n z
PFR = annual production of forest residue.

2.3.2. Biogas Potential from Forest Residues

The maximum biomethane (biogas) production from forest residues was determined based on Buswell’s formula using an expression similar to Equation (5). However, an industrial-scale efficiency of 40% was assumed for biogas production from forest residues. Hence, the biogas estimated at the industrial scale was obtained from Equation (8).
Y B i o g a s ( F o r e s t ) = P F R × R f × ( Y B u s w e l l ,   g l u × C g l u ) + ( Y B u s w e l l ,   h e m × C h e m ) × η S c a l e

2.4. Livestock Residues

The data for the livestock population from 2008–2018 was obtained from FAOSTAT [20]. The residue considered was excreta (dung) estimated for each livestock following Equations (9) and (10).
Y m a n ( t h e o r e t i c a l   p o t e n t i a l ) = P l i v e s t o c k × E M P
Yman = manure produced; EMP = estimated manure produced per day.
Y m a n ( t e c h n i c a l   p o t e n t i a l ) = Y m a n ( t h e o r e t i c a l   p o t e n t i a l ) × R f

Biogas Potential from Livestock Residue

The biogas potential from manure was estimated from Equation (11), with the biomethane potential (YBMP) = 0.26111 m3 CH4/kg VS.
L M M = Y m a n ( t e c h n i c a l   p o t e n t i a l ) × C T S × V S × Y B M P
  • LMM = livestock manure methane;
  • VS = volume solid;
  • CTS = total solid concentration.

2.5. Municipal Waste

2.5.1. Municipal Solid Waste (MSW)

The quantity of municipal solid waste (MSW) was calculated from the population of major cities like Lagos [21] using Equation (12). Sixteen (16) cities were considered. The organic fraction concentration (COF) of the MSW was obtained from the literature on the various cities.
P M S W = E P × W G × O w c
where PMSW = total waste production; EP = estimated population per city; WG = waste generated (kg/person/day); Owc = organic waste content (%).
The estimate of biogas potential from municipal solid waste was determined using Equation (13).
Y b i o g a s ( M S W ) = P M S W × C O F × C T S × Y B M P

2.5.2. Municipal Liquid Waste (MLW)

The potential biogas from municipal liquid waste (MLW) is a function of the product of the quantity of liquid waste from the estimated population, the concentration of total solids, and the biomethane potential, as shown in Equations (14) and (15):
P M L W = E P × A W E
EP = estimated population per city; AWE = average weight excreta per person per day (250 g) as derived by Feachem et al. [22].
Y b i o g a s   ( M L W ) = P M L W × C T S × V S
PMLW = municipal liquid waste production.
For municipal liquid waste, the concentration of total solids (TS) was assumed to be 8.9275 g TS/100 g [23]. Other factors used for the conversion are shown in Table 5.

2.6. Data Analysis

The data collected were analyzed using Microsoft Office Excel version 2016. Originlab 9 was used to plot the graphs.

3. Results

3.1. Crop Production and Residue Potentials

The residues from the crops considered included the straws, stalks, cobs, pods, shells, peels, and husks from the harvesting (field-based residues) and processing (process-based residues) activities.
The annual theoretical residues from a total of 27 sources (17 crops) showed total values of 126, 116, and 119 Mt for 2016, 2017, and 2018, respectively (Table 6). The technical residues were also found to be 97, 89, and 91 Mt for 2016, 2017, and 2018, respectively (Table 6). However, in 2009, both residue potentials (i.e., theoretical and technical) had the least values.
The average crop production and theoretical and technical residues across the investigated period were 142, 109, and 84 Mt, respectively. These values differ from the lowest and highest obtained data. Therefore, it is inferred that crop production and technical residues can sustain biofuel production.

3.2. Bioenergy Potential from Crop Residues

3.2.1. Solid Biofuel Potential

Wood biomass is still used for energy purposes (in the form of wood fuel) in Nigeria. The production of wood fuel showed an increasing trend from 2008–2018 (Figure 2). This trend can escalate due to high demand with respect to the population. Further increases in the use of wood fuel contribute to climate change. However, maximizing the energy potential in crude crop residues can drastically reduce the direct combustion of wood. The solid fuel energy available in these crop residues was highest in 2016, followed by 2018 and 2017 (Figure 3).

3.2.2. Cellulosic Ethanol and Biogas Production from Crop Residue

The estimated cellulosic ethanol production was highest from 2016 to 2018 (Table 6). Similarly, the energy from cellulosic ethanol followed the same trend. Since the volume of ethanol produced is greatly influenced by the quantity of residues, the particle size and enzymatic digestion are very important.

3.3. Residue and Bioenergy Potential from Forestry

3.3.1. Estimated Residue from Forestry

The estimated residues (sawdust, wood bark, and wood slab in volume) generated during the harvest and processing of round wood for industrial use are given in Table 7. The variation in the generated residues from 2008–2013 and 2014–2018 was mainly due to the significant increase in the volume of industrial round wood harvested and processed in 2014. It is worth noting that the two groups (2008–2013 and 2014–2018) emerged due to a significant increase in wood production in 2014 (Table S2, Supplementary Materials). Hence, we adopted such a classification for better comparison and discussion.

3.3.2. Cellulosic Ethanol Production from Forest Residues

Cellulosic ethanol production from forest residues (wood slabs, wood bark, and sawdust) was also higher in 2014–2018 compared to 2008–2013 (Figure 4). The treatment conditions were selected for estimating and assessing the maximum quantity of cellulosic ethanol, given the recalcitrant nature of the cell walls of forest trees. In both the 2008–2013 and 2014–2018 groups, a higher cellulosic ethanol yield was obtained when compared with the no pre-treatment scenario (Figure 4). The pre-treatment condition is an important factor for maximum cellulosic ethanol yield from forest residues.

3.3.3. Biogas Potential from Forest Residue

The biogas production from forest residue was relatively higher for the 2014–2018 period compared with that estimated for the 2008–2013 period (Figure 5; Table S3, Supplementary Materials).

3.4. Livestock

3.4.1. Livestock Production

The total livestock production varied from 272 million (in 2014) to 308 million livestock (in 2011). Although, in 2011, individual livestock such as chicken and pigs experienced a significant drop in production. However, pig production, unlike chicken production, showed a substantial increase and exceeded that of 2010. Despite these changes, the total annual livestock production showed a rising trend in the later years (i.e., 2014–2018). This can be attributed to the growing population (Figure 6; Table S4, Supplementary Materials).

3.4.2. Biogas Potential from Livestock Manure

The bioenergy potential measured from recoverable livestock dung in the form of biogas was determined (Figure 7). The result recorded the highest and least recoverable dung in 2018 and 2008, respectively (Table 8). Additionally, the biogas produced within the investigated 11-year period showed an increasing trend. A remarkable increase in bioenergy was observed in 2011, which may be due to the high production of cattle, goats, and sheep recorded in that year (Table S4, Supplementary Materials). From Figure 7, a linear relationship was observed in the methane potential and the estimated energy equivalent.

3.5. Municipal Wastes

3.5.1. Municipal Solid Wastes

The waste generated by the population of 16 major cities (representing all four geographical regions in Nigeria) was evaluated for its biogas potential. An increase in population gave a corresponding rise in the waste generated from food and other biodegradable materials (Figure 8; Table S5, Supplementary Materials). These cities were: north (Abuja, Kano, Makurdi, Maiduguri, and Kaduna), south (Benin City, Port Harcourt), east (Onitsha and Enugu), and west (Ife, Ilorin, Akure, Ado-Ekiti, Abeokuta, Lagos, and Ibadan).

3.5.2. Energy Potential from Municipal Liquid Wastes (MLW)

The municipal liquid waste of the 16 major cities was estimated based on the assumption that a person produces an average of 250 g fecal waste daily [22,27]. The estimated liquid waste increases per year with population growth, which subsequently leads to a rise in the biogas potential (Figure 9; Table S6, Supplementary Materials).

4. Discussion

The present study on crop production in the last 11 years does not follow the increasing crop yield as reported by Jekayinfa and Schloz [8]. High quantities of technical potentials were recorded, and different forms of energy carriers with increased energy efficiency were estimated. However, when other potentials (such as environmental, socio-economic, and sustainable potentials) are taken into account, the overall generated residue potential may reduce. On the other hand, both the theoretical and technical residue potentials fluctuated within the investigated period. In the agricultural sector, in particular, farmers need to be enlightened on the importance of residues for energy generation. This will enable better collection and storage practices. Additionally, the awareness can potentially increase the number of agricultural residues. Crop residues can be processed by various techniques, which include gasification, pyrolysis, and combustion (for biogas, bio-oil, and biochar); fermentation (for cellulosic ethanol); and briquettes (as solid fuel) [28]. Solid biofuels (in the form of pellets and briquettes) made from residues of forest and crops are good alternatives to wood fuel and charcoal, as they potentially reduce the felling of trees and deforestation. Residual biomass from the enzymatic or fermentation process for cellulosic ethanol may further be processed into pellets [29] for combustion purposes. There is a market for these in Nigeria because the use of wood fuel is high [30]. The bioenergy produced from solid fuel depends on the generated technical crop residues. Similarly, the potential energy from crop residues follows the crop production trend. Briquettes and pellets made from crop residues can serve as wood fuel, thus reducing the demand for conventional wood fuel and charcoal. Cellulosic ethanol is a liquid fuel obtained from the digestion of lignocellulose components of crop residues, which can be used in place of petrol [16]. On the one hand, the quantity of cellulosic ethanol produced was high from 2016 to 2018. However, the conversion processes of crop residues to biofuel, as well as the cost, must be considered. Moreover, the selection of suitable techniques is necessary for optimal ethanol yield. Although the estimated cellulosic ethanol has a huge potential as transport fuel with high-performance efficiency (in vehicles including racing cars), their optimal production is limited due to the recalcitrant structure of the cell wall [31,32]. On the other hand, biogas production is more efficient compared to cellulosic ethanol, as indicated by the inherent potential energy measured in the fossil fuel equivalent (Mtoe) in Table 6.
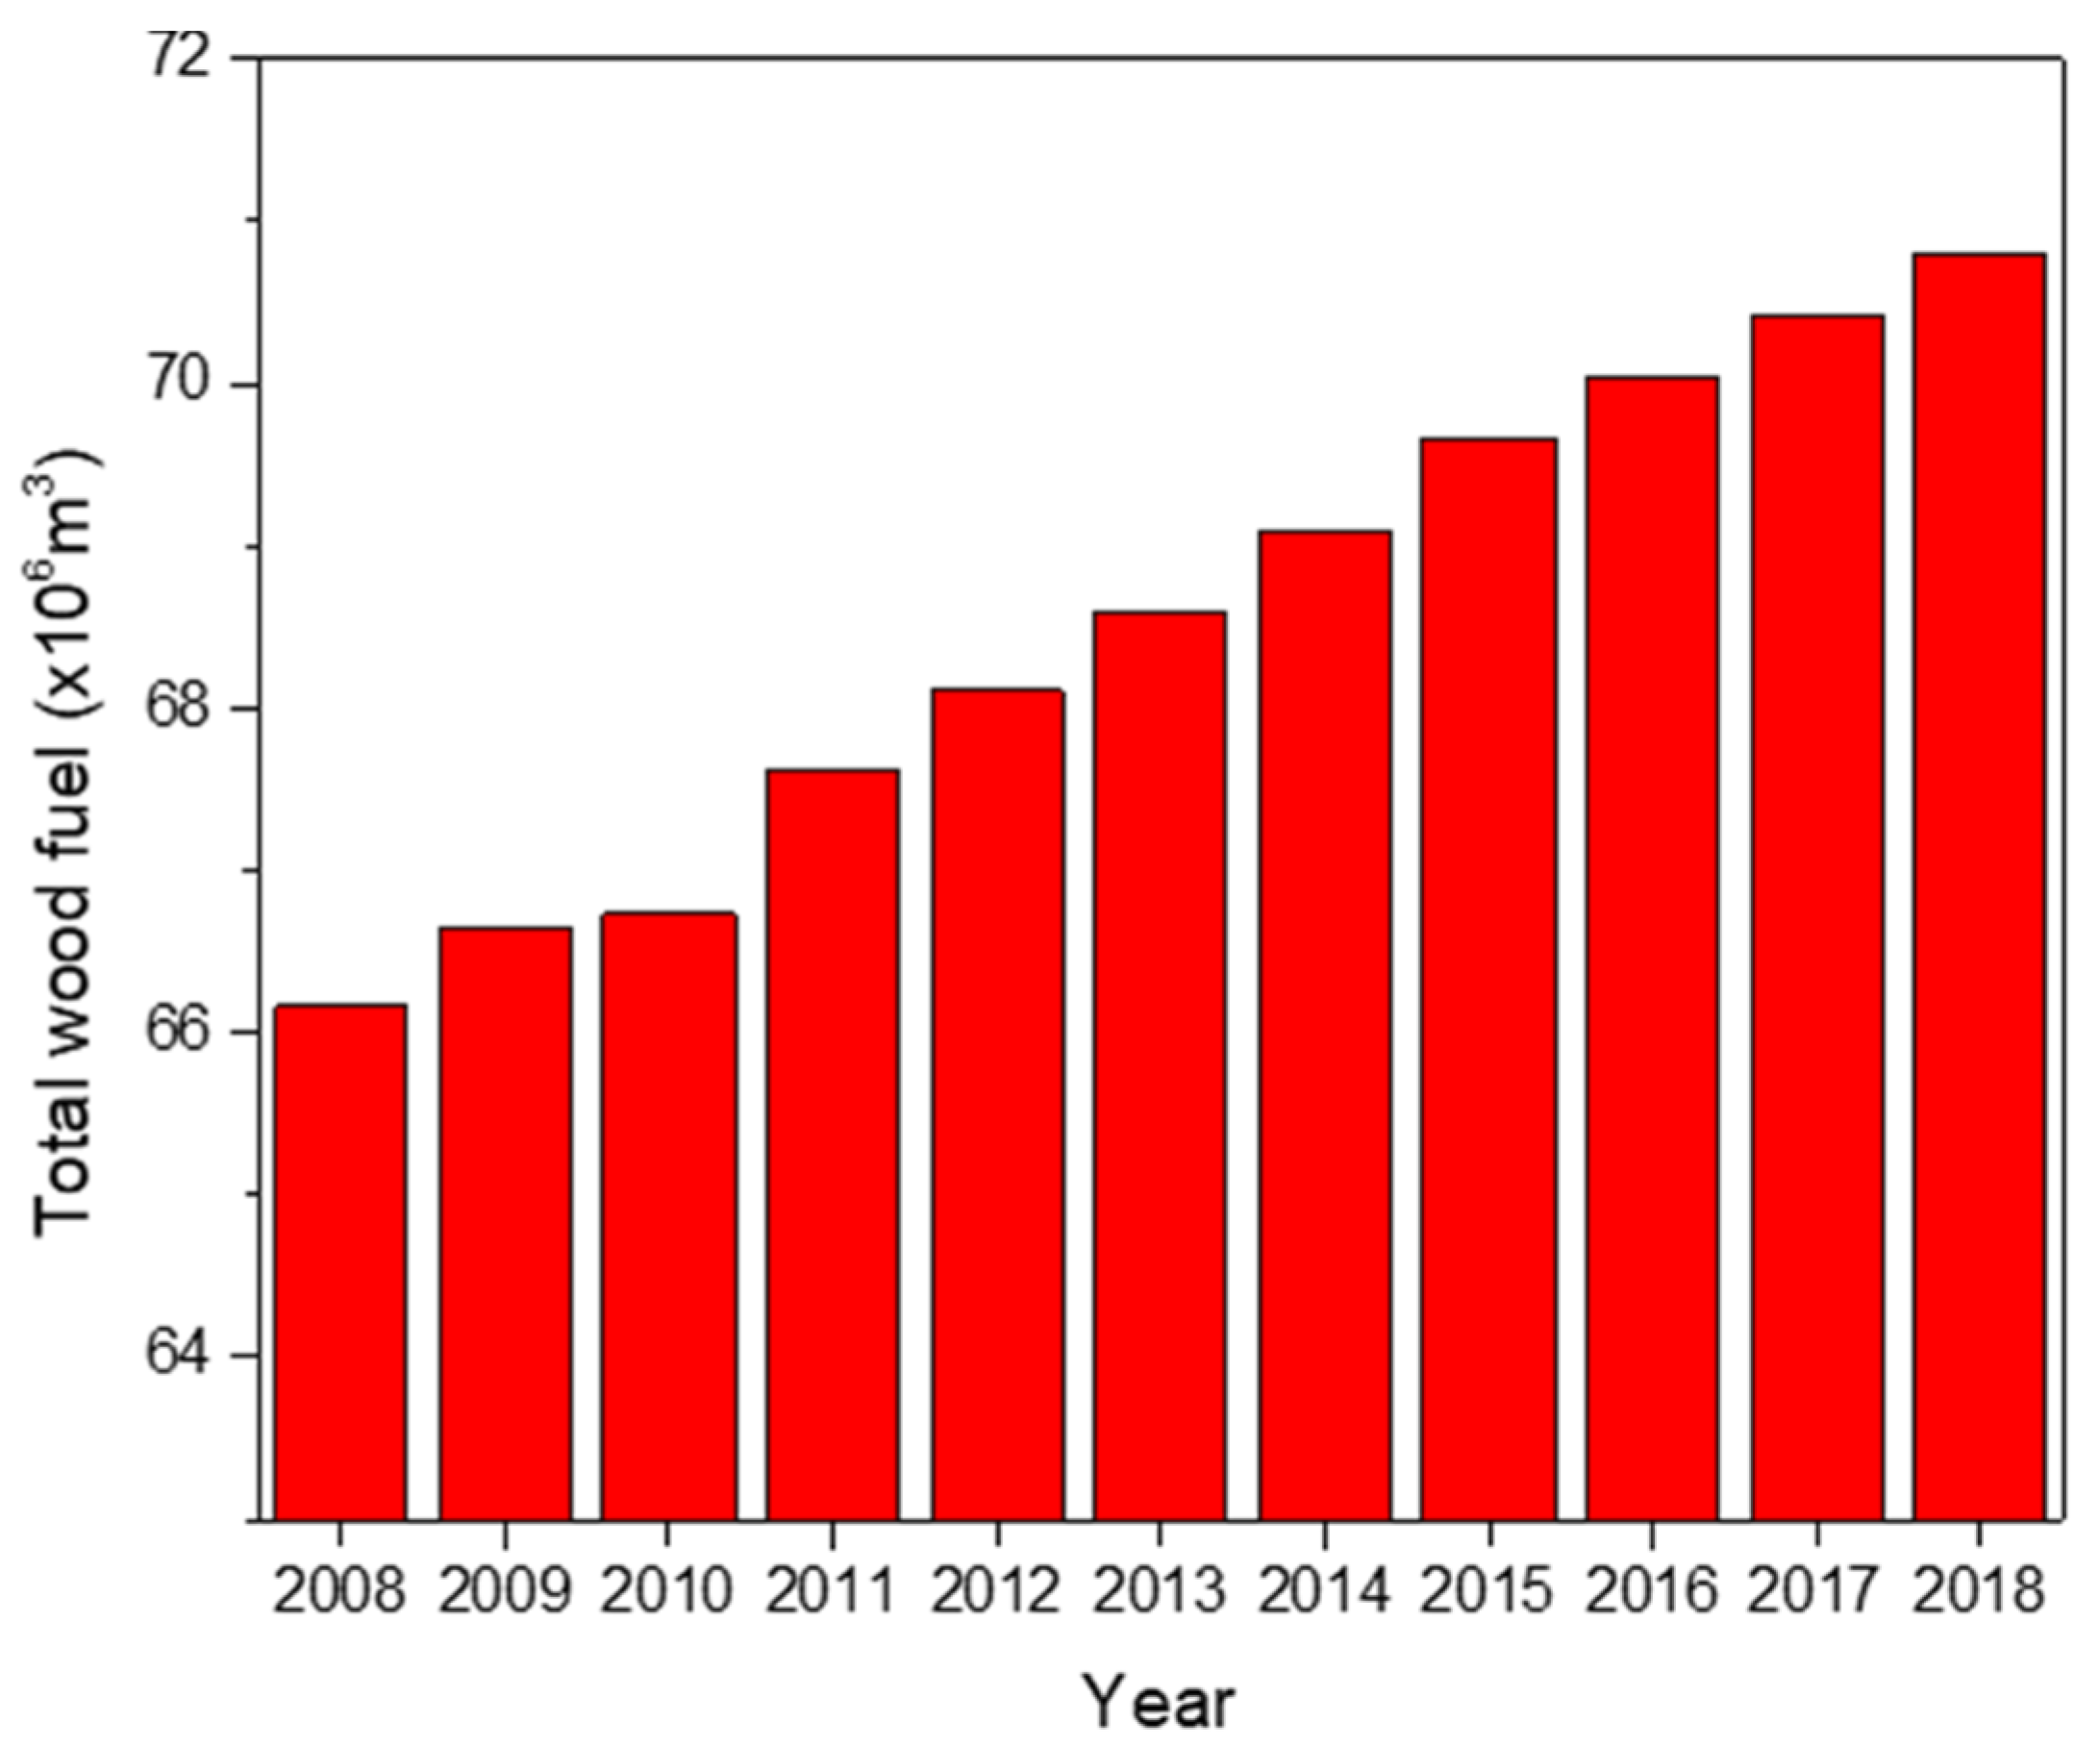
The increase in the use of wood fuel (Figure 3) is primarily a result of the rise in population and poverty. Correspondingly, high wood fuel demand leads to deforestation. The felling of trees for energy purposes plagues Nigeria with the tragedy of climate change, soil infertility (due to erosion), and forest area depletion. Secondary biomass, which includes forest residues, serves as an alternative to wood fuel, for diverse energy forms. These residues are from fallen branches and wood barks during sawmilling and logging processes. Cellulosic ethanol and biogas can be obtained from forest residues. The energy efficiency for biogas implies that biogas is suitable for electricity generation and can positively influence the power condition in Nigeria if properly appropriated. These power sources can serve the inhabitants of the rural areas where bioenergy plants are likely to be situated. Biofuel will not only reduce the adverse effect of smoke from the direct combustion of wood fuel during cooking on the health of the rural dwellers but will also provide an alternative clean cooking energy source [33]. The degree of the recalcitrant varies with the age and maturity of forest residues. For optimizing cellulosic ethanol production, the type of pre-treatment selected should ensure a very high estimate and resulting biofuel. Additionally, reducing the particle size of the residue enhances the surface area for effective hydrolysis. Moreover, a smaller particle size promotes the solubility and biodegradability of organic matter, leading to a significant increase in the cellulosic ethanol yield (Figure 4).
The animals produced in large quantities in Nigeria include chickens, goats, sheep, cattle, and pigs (Table S4, Supplementary Materials). There is a direct relationship between the amount of manure generated and the quality of food intake when considering the weight of the animal. As shown in Table 8, the estimated dung generated and the amount recovered for biogas production was rising monotonously per year (Figure 7) despite the fluctuating livestock production (Figure 6). This result agrees with the work of Suberu et al. [34] and also confirms that Nigeria has a high potential of generating an enormous amount of biogas from animal dung. The present study does not include data from domestic livestock farmers from rural households in Nigeria due to the lack of certified data. The recoverability of the manure from livestock is quite a challenge except in the case of large and mechanized farms that utilize intensive farm practice for commercial purposes. Cattle have the potential of producing higher manure, but most farmers in Nigeria use the nomadic approach. The latter limits the amount of cattle dung for energy purposes. Hence, the quantity of manure recovered is about 50%. Better farm practices and management can enhance the recoverability of animal dung. Nigeria may have to impose mandatory intensive cattle rearing practices. Moreover, intensive farm practices are also economical in food management as the cattle eat more and burn fewer calories; as a result, a higher quantity of manure can be generated.
The high volume of biogas from both MSW and MLW (Figure 8 and Figure 9) may be ascribed to the high population, which is a consequence of migration to these major cities. This migration is mostly an indirect effect of social factors such as the job search, a quest for improved living standards, industrialization, urbanization, and insurgency. The quantity of feces and urine excreted per day is a function of the climate, diet, volume of water consumed, and the occupation of an individual.
In our assessment, among the various energy carriers, biogas presents the highest potential and capacity for the development of both integrated and flexible bioenergy strategies in Nigeria. According to World Bank data and world info, Nigeria consumed an average of about 2.2 Mtoe (24.72 bn KWh) of electric power per year [35,36], of which the average estimated energy equivalent of biogas from crop residues and municipal solid waste combined can yield over 30% increase in energy for consumption. Therefore, biomass has a significantly high potential to improve the available electric energy supply, thereby providing a solution to the power outage problem currently experienced in the country. Our findings are in agreement with Sobamowo and Ojolo [37]. Although there is a linear relationship between the methane potential and the energy equivalent of biogas, the estimated energy was lower than the volume of methane (Figure 8 and Figure 9). This result may be ascribed to the thermodynamic factors involved in the conversion of biogas to heat energy.
From an economic point of view, waste is a resource in the production process, which reduces the extraction of fresh materials and the related energy consumption. The circular economy is a regenerative system that supports the optimal use of resources and waste, thus leading to an economic and ecological resource closed-loop [38,39,40]. In the context of the present study, the circular economy approach prevents resource depletion (resulting from improper waste incineration or decomposition) and a high carbon footprint and ensures production–consumption operations that promote sustainable growth along with the social well-being of Nigerians.

5. Biofuel Potentials and Challenges

5.1. Cellulosic Ethanol and Biogas Potentials

The potential for energy generation from waste, as well as its ability to control waste management, is of great benefit to the rapidly growing population. Nigeria can leverage the latter and the vast arable land for the production of crops and residue generation for energy purposes.
Biomass gasification technology produces relatively clean energy that consists of methane and hydrogen gas from the carbon-based feedstock. The effluent from anaerobic digestion can be used as fertilizer to enhance the soil nutrients and maintain high crop production [23]. The lignocellulose nature of crop and forestry residues possess high biogas energy potential due to its rich methane content.
The conversion technology employed to transform biomass to biofuel depends on the quality of the feedstock. Poor feedstocks with 60–65% moisture content are preferably processed into other forms of biofuel. This diversification ensures an optimum biofuel recovery. The application of pre-treatment conditions (such as drying the biomass) improves its quality for gasification. Nigeria has high solar radiation capable of drying feedstock at a low cost. Besides, solar resources are abundant in regions where sufficient cereal residues are produced. The benefits and challenges of producing biogas or cellulosic ethanol from biomass residues are presented in Table 9.
The comparison between biogas and cellulosic ethanol production (Table 9) has shown that the process of biogas production is simple, feasible, and less expensive [43]. Therefore, it is more appropriate to start with biogas production.

5.2. Challenges

The production of either biogas or cellulosic ethanol is feasible in principle, considering the availability of different types of residues and the high demand for a steady power supply. However, some challenges could potentially limit its viability in Nigeria, as discussed subsequently.
First, the assessment of biomass residues, as well as the estimation of total bioenergy potentials, involves many uncertainties. The latter can affect the available residue potential. Secondly, the technical residue potential is usually lower than the theoretical one. This reduction emanates from the various value chains of the residues. The competition makes it expedient to source biomass residues solely for energy production. In this regard, there is a need to identify other crop residues that have little or no competitive use. These crops include energy crops, grasses, algae, and other aquatic plants. Furthermore, poor mechanization may limit the collection as well as the conversion method involved in processing the residues [44]. The lack of data on some biomasses (e.g., grass) with high bioenergy potential has contributed to insufficient information on the total residue estimate available in Nigeria. A more comprehensive residue valuation should include energy crops such as Jatropha curcas and aquatic weeds (water hyacinth, water lettuce, and bracken fern), which are abundant in swampy regions. There is also a need to regularly update the national biomass database.
The estimates for solid and liquid waste produced in Nigeria focused on the major cities and are shown in Tables S5 and S6 (Supplementary Materials). Although these cities account for the large and diverse forms of waste estimated due to the high population, it represents only a fraction of the total population (16 major cities out of 36 states in Nigeria). Nonetheless, it is difficult to assess the data for major cities, and it is needless to consider the rural areas. This barrier hinders the detailed assessment of municipal waste generated in Nigeria. Currently, only the city of Abuja practices a central sewage system, while others practice a system where a few households are connected to a septic tank. Regarding MSW, the nation needs to adopt a solid waste disposal practice, properly sorting waste into different categories. This will ensure better processing of MSW into energy carriers.
Another challenge in the realization of biofuel production hinges on infrastructure. This includes investment in bio-digesting systems, structural facilities, and technologies required for an efficient biofuel yield.

5.3. Implications on the Bio-Economy of Nigeria

An essential focus of the bio-economy is the production and processing of biomass wastes into value-added products [45]. The valorization of biomass residue is connected to the sustainable utilization of renewable biological resources (which includes food, bio-based products, and bioenergy) leading to the restoration and preservation of biodiversity. Therefore, the bio-economic perspective provides a balance to the social, environmental, and economic benefits that promote the use of renewable resources, allowing an optimal trade-off between food and bioenergy production.
The implication of our assessment on the bio-economy of Nigeria includes the following:
  • Prompts the implementation of good farm practices that will increase crop production, food security, and residue generation and, consequently, will create jobs for the unemployed. Additionally, it leads to a sustainable ecosystem.
  • Provides business opportunities for innovative start-ups that will attract foreign investment in value-based products for a global market. This could position Nigeria at the forefront of the bioenergy market in Africa.
  • Diversification into bioenergy generation will enable a healthy environment by reducing greenhouse gas emissions from fossil fuels.
  • Decrease our overdependence on foreign nations, thereby making Nigeria’s economy tend towards self-reliance (reducing external debits).
  • Enforce collaboration among researchers of various fields as well as the cooperation between Nigeria and other countries towards the establishment of functional bioenergy plants.
  • Facilitates the transition from a circular economy to a bio-economy, as information on the residues generated, their availability, and the bioenergy potential are valuable for policy-making.

5.4. Recommendations

The energy equivalent from crop residues is higher for biogas production than for cellulosic ethanol. Moreover, livestock manure, MSW, and MLW can be preferably processed into biogas, hence leading to a higher volume of biogas compared to cellulosic ethanol. Since biogas can easily be converted to electricity, Nigeria can partly deal with its electricity challenge by focusing on biogas production. Furthermore, the assessment and estimation of the bioenergy potential from biomass residues in Nigeria are but one side of the coin. A more holistic approach that accounts for the cost of establishing a functional biogas plant for residue conversion should also be taken into consideration. The concept of bioenergy from biomass resources involves a multi-dimensional study that includes raw material availability, assessment, and energy potential. It also covers various divisions from agriculture through the industrial, government, and power sectors. However, the socio-economic influence towards bioenergy establishment is another measure of its sustainability [46,47,48].
Finally, the implementation of proper biofuel policy is expedient; in this regard, the government plays a vital role in the exploitation of natural resources and the attainment of environmental sustainability [49]. However, sustained biofuel production requires the cooperation of other stakeholders [50,51], as illustrated in Figure 10. It is important to note that promoting the use of biogas in Nigeria may require the introduction of subsidies [52].

6. Conclusions

The assessment of biomass residues and their bioenergy potential is often performed for either solid biofuel or biogas. However, in this work, we estimated the bioenergy potential from both solid biofuel and biogas perspectives. We discovered that 143 Mt of crop residues produces about 84 Mt of technical residue potential on average. Hence, only about 58% of the total residue is available for energy purposes. Our findings revealed that crop production is directly correlated with the quantity of biofuel produced. For the forest residues, enzyme pre-treatment led to higher cellulosic ethanol. Among the bioenergy carriers evaluated, biogas had the highest potential, with an average of 15,014 Mm3 from crop residues. Therefore, it is a more promising energy carrier to be adopted in Nigeria. Although biogas production is favoured, there is a need to investigate its cost, feasibility, and the economic analysis of setting up the plant in Nigeria. Additionally, the pragmatic behaviour of the biomass residues during anaerobic activity (i.e., the breakdown of lignocellulose content) needs to be experimentally validated. Finally, the policies that will facilitate the optimum collection of these biomass residues are expedient.

Supplementary Materials

The following are available online https://www.mdpi.com/article/10.3390/su132413806/s1, Table S1: Annual wood production, Table S2: Annual industrial round wood production, Table S3: Forestry Residue, Table S4: Annual livestock production, Table S5: Municipal solid waste generated and bioenergy potential, Table S6: Municipal liquid waste generated and bioenergy potential.

Author Contributions

U.S.E.: manuscript writing, conceptualization, data curation, and formal analysis. B.N.E.: graph analysis, manuscript review, and editing. F.K.: statistical validation, manuscript review, and editing. L.E.K.A.: manuscript review, editing, and general supervision. A.P.O.: manuscript review, editing, and general supervision. All authors have read and agreed to the published version of the manuscript.

Funding

This research received no external funding.

Institutional Review Board Statement

Not applicable.

Informed Consent Statement

Not applicable.

Data Availability Statement

The data presented in this study are available in this manuscript and Supplementary Materials.

Acknowledgments

U.S. Ezealigo is grateful for the PAMI fellowship and the African development bank for the publication grant.

Conflicts of Interest

The authors declare no conflict of interest.

References

  1. Hall, D.O.; Rao, K.K. Photosynthesis, 6th ed.; Cambridge University Press: Cambridge, UK, 1999. [Google Scholar]
  2. Balat, M.; Ayar, G. Biomass Energy in the World, Use of Biomass and Potential Trends. Energy Sources 2005, 27, 931–940. [Google Scholar] [CrossRef]
  3. Fernandes, U.; Costa, M. Potential of biomass residues for energy production and utilization in a region of Portugal. Biomass Bioenergy 2010, 34, 661–666. [Google Scholar] [CrossRef]
  4. Oyewo, A.S.; Aghahosseini, A.; Bogdanov, D.; Breyer, C. Pathways to a fully sustainable electricity supply for Nigeria in the mid-term future. Energy Convers. Manag. 2018, 178, 44–64. [Google Scholar] [CrossRef]
  5. Ikram, M.; Zhang, P.Q.; Sroufe, P.R.; Shah, P.S.Z.A. Towards a sustainable environment: The nexus between ISO 14001, renewable energy consumption, access to electricity, agriculture and CO2 emissions in SAARC countries. Sustain. Prod. Consum. 2020, 22, 218–230. [Google Scholar] [CrossRef]
  6. Ikram, M.; Ferasso, M.; Sroufe, R.; Zhang, Q. Assessing green technology indicators for cleaner production and sustainable investments in a developing country context. J. Clean. Prod. 2021, 322, 129090. [Google Scholar] [CrossRef]
  7. Ezealigo, U.S.; Otoijamun, I.; Onwualu, A.P. Electricity and biofuel production from biomass in Nigeria: Prospects, challenges and way forward. In IOP Conference Series: Earth and Environmental Science; IOP Publishing: Bristol, UK, 2021; Volume 730, p. 012035. [Google Scholar] [CrossRef]
  8. Jekayinfa, S.O.; Scholz, V. Potential availability of energetically usable crop residues in Nigeria. Energy Sources Part A Recover. Util. Environ. Eff. 2009, 31, 687–697. [Google Scholar] [CrossRef]
  9. Simonyan, K.J.; Fasina, O. Biomass resources and bioenergy potentials in Nigeria. Afr. J. Agric. Res. 2013, 8, 4975–4989. [Google Scholar]
  10. Alhassan, A.E.; Olaoye, O.J.; Olayanju, A.; Okonkwo, E.C. An investigation into some crop residues generation from farming activities and inherent energy potentials in Kwara State, Nigeria. In Proceedings of the IOP Conference Series: Materials Science and Engineering, Ota, Nigeria, 24–28 June 2019; Volume 640, p. 012093. [Google Scholar]
  11. Batidzirai, B.; Smeets, E.; Faaij, A. Harmonising bioenergy resource potentials—Methodological lessons from review of state of the art bioenergy potential assessments. Renew. Sustain. Energy Rev. 2012, 16, 6598–6630. [Google Scholar] [CrossRef]
  12. FAOSTAT. Food and Agriculture Organization of The United Nations—Statistics Division. Crop Production. 2021. Available online: https://www.fao.org/faostat/en/#data/QCL (accessed on 8 October 2020).
  13. Edmeades, D.C. The long-term effects of manures and fertilisers on soil productivity and quality: A review. Nutr. Cycl. Agroecosyst. 2003, 66, 165–180. [Google Scholar] [CrossRef]
  14. Loveland, P.; Webb, J. Is there a critical level of organic matter in the agricultural soils of temperate regions: A review. Soil Tillage Res. 2003, 70, 1–18. [Google Scholar] [CrossRef]
  15. Iye, E.L.; Bilsborrow, P.E. Assessment of the availability of agricultural residues on a zonal basis for medium- to large-scale bioenergy production in Nigeria. Biomass Bioenergy 2013, 48, 66–74. [Google Scholar] [CrossRef]
  16. Kemausuor, F.; Kamp, A.; Thomsen, S.T.; Bensah, E.; Østergård, H. Assessment of biomass residue availability and bioenergy yields in Ghana. Resour. Conserv. Recycl. 2014, 86, 28–37. [Google Scholar] [CrossRef]
  17. Bhattacharya, S.C.; Pham, H.L.; Shrestha, R.M.; Vu, Q.V. CO2 emissions due to fossil and traditional fuels, residues and wastes in Asia. AIT, 1992; Unpublished Work. [Google Scholar]
  18. FAOSTAT. Food and Agriculture Organization of The United Nations–Statistics Division. Forestry Production. 2021. Available online: https://www.fao.org/faostat/en/#data/FO (accessed on 8 October 2020).
  19. Koopmans, A.; Koppejan, J. Agricultural and Forest Residues—Generation, Utilization and Availability. Available online: http://www.fao.org/DOCREP/006/AD576E/ad576e00.pdf (accessed on 25 March 2020).
  20. FAOSTAT. Food and Agriculture Organization of The United Nations–Statistics Division. Live Animal. 2021. Available online: http://www.fao.org/faostat/en/#data/QA/visualize (accessed on 8 October 2020).
  21. Macrotrends. Nigeria Metro Area Population 1950–2020. 2020. Available online: https://www.macrotrends.net/cities/22007/lagos/population (accessed on 2 April 2020).
  22. Feachem, R.G.; Bradley, D.J.; Garelick, H.; Mara, D.D. Sanitation and Disease: Health Aspects of Excreta and Wastewater Management; John Wiley and Sons: New York, NY, USA, 1983. [Google Scholar]
  23. Arthur, R.; Brew-Hammond, A. Potential biogas production from sewage sludge: A case study of the sewage treatment plant at Kwame Nkrumah University of science and technology, Ghana. Int. J. Energy Environ. 2010, 1, 1009–1016. [Google Scholar]
  24. Arthur, R. Feasibility Study for Institutional Biogas Plant at KNUST Sewage Treatment Plant. Master’s Thesis, Kwame Nkrumah University of Science and Technology, Kumasi, Ghana, 2009. [Google Scholar]
  25. Suhartini, S.; Lestari, Y.P.; Nurika, I. Estimation of methane and electricity potential from canteen food waste. In IOP Conference Series: Earth and Environmental Science; IOP Publishing: Bristol, UK, 2019; Volume 230, p. 012075. [Google Scholar] [CrossRef]
  26. Chynoweth, D.P.; Owens, J.M.; Legrand, R. Renewable methane from anaerobic digestion of biomass. Renew. Energy 2001, 22, 1–8. [Google Scholar] [CrossRef]
  27. Rose, C.; Parker, A.; Jefferson, B.; Cartmell, E. The characterization of feces and urine: A review of the literature to inform advanced treatment technology. Crit. Rev. Environ. Sci. Technol. 2015, 45, 1827–1879. [Google Scholar] [CrossRef] [PubMed] [Green Version]
  28. Clauser, N.M.; González, G.; Mendieta, C.M.; Kruyeniski, J.; Area, M.C.; Vallejos, M.E. Biomass waste as sustainable raw material for energy and fuels. Sustainability 2021, 13, 794. [Google Scholar] [CrossRef]
  29. Moreira, B.R.D.A.; Viana, R.D.S.; Cruz, V.H.; Magalhães, A.C.; Miasaki, C.T.; De Figueiredo, P.A.M.; Lisboa, L.A.M.; Ramos, S.B.; Sánchez, D.E.J.; Filho, M.C.M.T.; et al. Second-generation Lignocellulosic supportive material improves atomic ratios of C:O and H:O and thermomechanical behavior of hybrid non-woody pellets. Molecules 2020, 25, 4219. [Google Scholar] [CrossRef]
  30. Jekayinfa, S.; Orisaleye, J.; Pecenka, R. An assessment of potential resources for biomass energy in Nigeria. Resources 2020, 9, 92. [Google Scholar] [CrossRef]
  31. Gonzalez-Estrella, J.; Asato, C.M.; Jerke, A.C.; Stone, J.J.; Gilcrease, P.C. Effect of structural carbohydrates and lignin content on the anaerobic digestion of paper and paper board materials by anaerobic granular sludge. Biotechnol. Bioeng. 2017, 114, 951–960. [Google Scholar] [CrossRef]
  32. Patinvoh, R.J.; Osadolor, O.A.; Chandolias, K.; Horváth, I.S.; Taherzadeh, M.J. Innovative pretreatment strategies for biogas production. Bioresour. Technol. 2017, 224, 13–24. [Google Scholar] [CrossRef] [Green Version]
  33. Sa’ad, S.; Bugaje, M.I. Biomass consumption in Nigeria: Trends and policy issues. J. Agric. Sustain. 2016, 9, 127–157. [Google Scholar]
  34. Suberu, M.Y.; Bashir, N.; Mustafa, M.W. Biogenic waste methane emissions and methane optimization for bioelectricity in Nigeria. Renew. Sustain. Energy Rev. 2013, 25, 643–654. [Google Scholar] [CrossRef]
  35. World Bank Data. Available online: https://data.worldbank.org/indicator/EG.USE.ELEC.KH.PC?end=2014&locations=NG&start=1971&view=chart (accessed on 24 December 2020).
  36. World Data Info. Available online: https://www.worlddata.info/africa/nigeria/energy-consumption.php (accessed on 24 December 2020).
  37. Sobamowo, G.M.; Ojolo, S.J. Techno-economic analysis of biomass energy utilization through gasification technology for sustainable energy production and economic development in Nigeria. J. Energy 2018, 2018, 1–16. [Google Scholar] [CrossRef] [Green Version]
  38. Haas, W.; Krausmann, F.; Wiedenhofer, D.; Heinz, M. How circular is the global economy? An assessment of material flows, waste production, and recycling in the European Union and the world in 2005. J. Ind. Ecol. 2015, 19, 765–777. [Google Scholar] [CrossRef]
  39. Sariatli, F. Linear economy versus circular economy: A comparative and analyzer study for optimization of economy for sustainability. Visegr. J. Bioecon. Sustain. Dev. 2017, 6, 31–34. [Google Scholar] [CrossRef] [Green Version]
  40. Morone, P.; Imbert, E. Food waste and social acceptance of a circular bioeconomy: The role of stakeholders. Curr. Opin. Green Sustain. Chem. 2020, 23, 55–60. [Google Scholar] [CrossRef]
  41. Achinas, S.; Achinas, V.; Euverink, G.J.W. A technological overview of biogas production from biowaste. Engineering 2017, 3, 299–307. [Google Scholar] [CrossRef]
  42. Bušić, A.; Marđetko, N.; Kundas, S.; Morzak, G.; Belskaya, H.; Šantek, M.I.; Komes, D.; Novak, S.; Šantek, B. Bioethanol production from renewable raw materials and its separation and purification: A review. Food Technol. Biotechnol. 2018, 56, 289–311. [Google Scholar] [CrossRef]
  43. Ishola, M.M.; Brandberg, T.; Sanni, S.A.; Taherzadeh, M.J. Biofuels in Nigeria: A critical and strategic evaluation. Renew. Energy 2013, 55, 554–560. [Google Scholar] [CrossRef]
  44. Oyedepo, S.O.; Dunmade, I.S.; Adekeye, T.; Attabo, A.A.; Olawole, O.C.; Babalola, P.O.; Oyebanji, J.A.; Udo, M.O.; Kilanko, O.; Leramo, R.O. Bioenergy technology development in Nigeria—Pathway to sustainable energy development. Int. J. Env. Sustain. Dev. 2019, 18, 175–205. [Google Scholar] [CrossRef]
  45. D’Adamo, I.; Morone, P.; Huisingh, D. Bioenergy: A sustainable shift. Energies 2021, 14, 5661. [Google Scholar] [CrossRef]
  46. D’Adamo, I.; Falcone, P.M.; Morone, P. A new socio-economic indicator to measure the performance of bioeconomy sectors in Europe. Ecol. Econ. 2020, 176, 106724. [Google Scholar] [CrossRef]
  47. Saracevic, E.; Koch, D.; Stuermer, B.; Mihalyi, B.; Miltner, A.; Friedl, A. Economic and global warming potential assessment of flexible power generation with biogas plants. Sustainability 2019, 11, 2530. [Google Scholar] [CrossRef] [Green Version]
  48. Bacenetti, J. Economic and environmental impact assessment of renewable energy from biomass. Sustainability 2020, 12, 5619. [Google Scholar] [CrossRef]
  49. Abid, N.; Ikram, M.; Wu, J.; Ferasso, M. Towards environmental sustainability: Exploring the nexus among ISO 14001, governance indicators and green economy in Pakistan. Sustain. Prod. Consum. 2021, 27, 653–666. [Google Scholar] [CrossRef]
  50. Attard, J.; McMahon, H.; Doody, P.; Belfrage, J.; Clark, C.; Ugarte, J.A.; Pérez-Camacho, M.N.; Martín, M.D.S.C.; Morales, A.J.G.; Gaffey, J. Mapping and analysis of biomass supply chains in Andalusia and the Republic of Ireland. Sustainability 2020, 12, 4595. [Google Scholar] [CrossRef]
  51. Mahmood, A.; Wang, X.; Shahzad, A.; Fiaz, S.; Ali, H.; Naqve, M.; Javaid, M.; Mumtaz, S.; Naseer, M.; Dong, R. Perspectives on bioenergy feedstock development in Pakistan: Challenges and opportunities. Sustainability 2021, 13, 8438. [Google Scholar] [CrossRef]
  52. D’Adamo, I.; Falcone, P.M.; Huisingh, D.; Morone, P. A circular economy model based on biomethane: What are the opportunities for the municipality of Rome and beyond? Renew. Energy 2021, 163, 1660–1672. [Google Scholar] [CrossRef]
Figure 1. Analytical framework for estimating cellulosic ethanol and biogas from residues.
Sustainability 13 13806 g001
Figure 2. Total annual wood fuel production. (Total wood fuel = wood fuel + charcoal; Table S1, Supplementary Materials).
Sustainability 13 13806 g002
Figure 3. Solid fuel potential showing the technical energy available (TEA) in crop residues generated annually in Nigeria.
Sustainability 13 13806 g003
Figure 4. Volume of cellulosic ethanol produced from forest residue with and without pre-treatment.
Sustainability 13 13806 g004
Figure 5. Estimated volume of methane (biogas) and the energy equivalent.
Sustainability 13 13806 g005
Figure 6. Total annual livestock production.
Sustainability 13 13806 g006
Figure 7. Estimated energy potential of biogas from livestock.
Sustainability 13 13806 g007
Figure 8. Methane potential and energy equivalent generated from municipal solid waste.
Sustainability 13 13806 g008
Figure 9. Methane potential and energy equivalent generated from municipal liquid waste.
Sustainability 13 13806 g009
Figure 10. Structural framework showing the stakeholders in bioenergy from biomass resources.
Sustainability 13 13806 g010
Table 1. Categories of biomass resources used for the bioenergy potential assessment.
S/NClass of ResiduesCategoryExamples
1Agricultural residuesPrimary by-productAll residues from crops (Table 2), during harvesting
Secondary residuesAll crop residues during processing (Table 2)
Tertiary residuesMunicipal solid waste (MSW) and
municipal liquid waste (MLW)
2Forest residuesPrimary by-productWood bark and wood slab
Secondary residuesSawdust
3LivestockPrimary by-productManure
Table 2. Crop production in Nigeria.
Crop TypeCrop Production (Mt)
20082009201020112012201320142015201620172018
Soya beans0.5910.4270.3650.4930.6500.5180.6240.5890.6150.7300.758
Seed cotton0.4920.3640.6020.5380.2880.2700.2900.2780.2790.2910.271
Sugar cane1.4101.4000.8500.7561.0901.2701.4101.4501.4901.4901.420
Sorghum9.3205.2807.1405.6905.8405.3006.8807.0107.5606.9406.860
Plantain2.7302.7002.6802.6802.9502.9603.0103.0803.0303.0603.090
Groundnut2.8702.9803.8002.9603.3102.4703.4003.4703.5802.4202.890
Coconut 0.2340.2430.2640.2650.2650.2660.2680.2690.2830.2820.285
Rice 4.1803.5504.4704.6105.4304.8206.0006.2607.5606.6106.810
Cocoa0.3670.3640.3990.3910.3830.3670.3300.3020.2980.3240.333
Millet9.0604.9305.1701.2701.2800.9101.4001.4901.5501.5002.240
Cowpea2.9202.3703.3701.6405.1504.6302.1402.3103.0202.4902.610
Cassava 44.6036.8042.5046.2051.0047.4056.3057.6059.6059.4059.50
Yam 35.0029.1037.3033.1032.3035.6045.2045.7049.4047.9047.50
Sweet potatoes3.3203.3003.4703.5203.5903.6803.6703.8203.8903.9604.030
Cocoyam5.3903.0302.9603.0103.2002.9303.2703.2803.2303.2703.300
Maize7.5307.3607.6808.8808.6908.42010.1010.6011.5010.4010.20
Oil palm8.5008.5008.0008.0008.1008.0007.9707.8907.8107.7407.850
TOTAL138.514112.698131.02124.003133.516129.811152.262155.398164.695158.807159.947
Source: FAOSTAT [12].
Table 4. Summary of indices for cellulosic ethanol production from crop and forest residues.
Conditions Y e t h Y h y d η P r e   ( % ) η e n z   ( % ) ρ D i s t i l   ( % ) ρ F e r m   ( % ) η S c a l e   ( % )
No pre-treatment0.511.11-3010010050
With pre-treatment0.511.11809010010080
Where ρ D i s t i l = distillation efficiency; ρ F e r m = fermentation efficiency. Values were sourced from Kemausuor et al. [16].
Table 5. Indices for estimating the biogas potential of residues and wastes.
FactorsUnit ValueReference
Volatile solid (VS)64.7%[24]
Lower calorific value of CH410 kWh/m3 STP[25]
Methane yield VS reduction0.24 m3/kg (24%)[26]
CH4 yield0.525 m3 CH4/kg VS[23]
Energy potential of CH4 conversion0.278 GWh/yr[16]
TJ to Mtoe conversion factor24
Table 6. Estimated crop potential residues and bioenergy potentials.
YearTheoretical (Mt)Technical (Mt)Cellulosic EthanolBiogas
ML/yrMtoeMm3 CH4/yrMtoe
2008115.8290.5315,578.778.5215,859.2613.69
200990.4571.1012,237.416.6912,405.5610.71
2010106.9484.1814,429.097.8914,534.4112.55
201193.8872.3713,023.507.1213,198.3611.39
2012103.6981.0613,835.727.5614,024.9112.11
201397.1475.6012,800.567.0013,095.0011.31
2014112.9786.8115,529.048.4915,747.2213.59
2015115.9589.1315,926.228.7116,173.4313.96
2016125.7997.2017,226.249.4217,571.0915.17
2017116.1488.6615,754.788.6116,144.1513.94
2018118.5490.8416,088.558.7916,404.5314.16
Average108.8584.3214,766.358.0715,014.3612.96
Mt = million tonnes; Mm3 = mega cubic meter (volume); Toe: tonne of oil equivalent is a unit of energy defined as the amount of energy released by burning one tonne of crude oil. Mtoe = one million toe.
Table 7. Estimated residues generated from forestry.
ResiduesEstimated Average Residues Generated (m3)
2008–20132014–2018
Saw dust360,408379,249
Wood bark71,62175,424
Wood slab1,352,4901,422,960
Total1,784,5191,877,633
Table 8. Details of estimated livestock dung generated.
YearDung Produced (million kg) Recoverable Dung (million kg)Dung *VS per day (106)Dung VS per yr (109)
200834577.610.73.90
200935179.110.93.98
201035780.611.14.07
201140187.912.34.49
201240889.612.54.58
201341491.012.74.65
201442292.913.04.75
201543094.913.24.83
201643896.613.54.92
201744998.813.85.05
201845710014.05.13
* VS = volume solid.
Table 9. Potential benefits and challenges in cellulosic ethanol and biogas production in Nigeria.
FactorsBiogasCellulosic Ethanol
1Bio-digesterSimple.Complex to handle due to multiple purification processes.
2Feedstock typeRelatively dry and low moisture biomass are preferred for biogas production.All types of feedstock type are suitable as water is required.
3Energy costNo drying is required.High energy is needed for drying, grinding, and purification of ethanol.
4TechnologyLow technical know-how is needed at a low or medium scale.Advance technology is essential both in the design and installation of hardware for industrial ethanol production.
5ResearchLittle research and development in the area of inoculation for constituent biogas production.To overcome the recalcitrant nature of the biomass, constant R&D is necessary, even in the area of genetic modification of cellulose.
6ProductsMethane, CO2, H2, etc.Cellulosic ethanol, water, fertilizer, and other recyclable products.
7CostRelatively low-cost compared to ethanol production.Enzymes and microbes for hydrolysis and fermentation; equipment are capital intensive.
8Engine modificationNeeds regular adjustment.No intensive adjustment is required.
Source: [41,42].
Publisher’s Note: MDPI stays neutral with regard to jurisdictional claims in published maps and institutional affiliations.

