Author Contributions
The authors confirm the following contributions to the paper: conceptualization and design, J.V., J.A.A., R.G.-Q., F.A., T.O., A.M. and J.K.; methodology, J.V., J.A.A., R.G.-Q., F.A., T.O., A.M. and J.K.; field campaign, J.V., J.A.A., R.G.-Q. and F.A.; data preparation, J.V., J.A.A., F.A., T.O. and A.M.; analysis and interpretation of results, J.V., J.A.A., R.G.-Q., F.A., T.O., A.M. and J.K.; writing—original draft preparation, J.V. and F.A.; writing—review and editing, J.V., J.A.A., R.G.-Q., F.A., T.O., A.M. and J.K.; project administration, J.V. and J.K. All authors have read and agreed to the published version of the manuscript.
Figure 1.
Research-stage synthesis as timeline flowchart.
Figure 1.
Research-stage synthesis as timeline flowchart.
Figure 2.
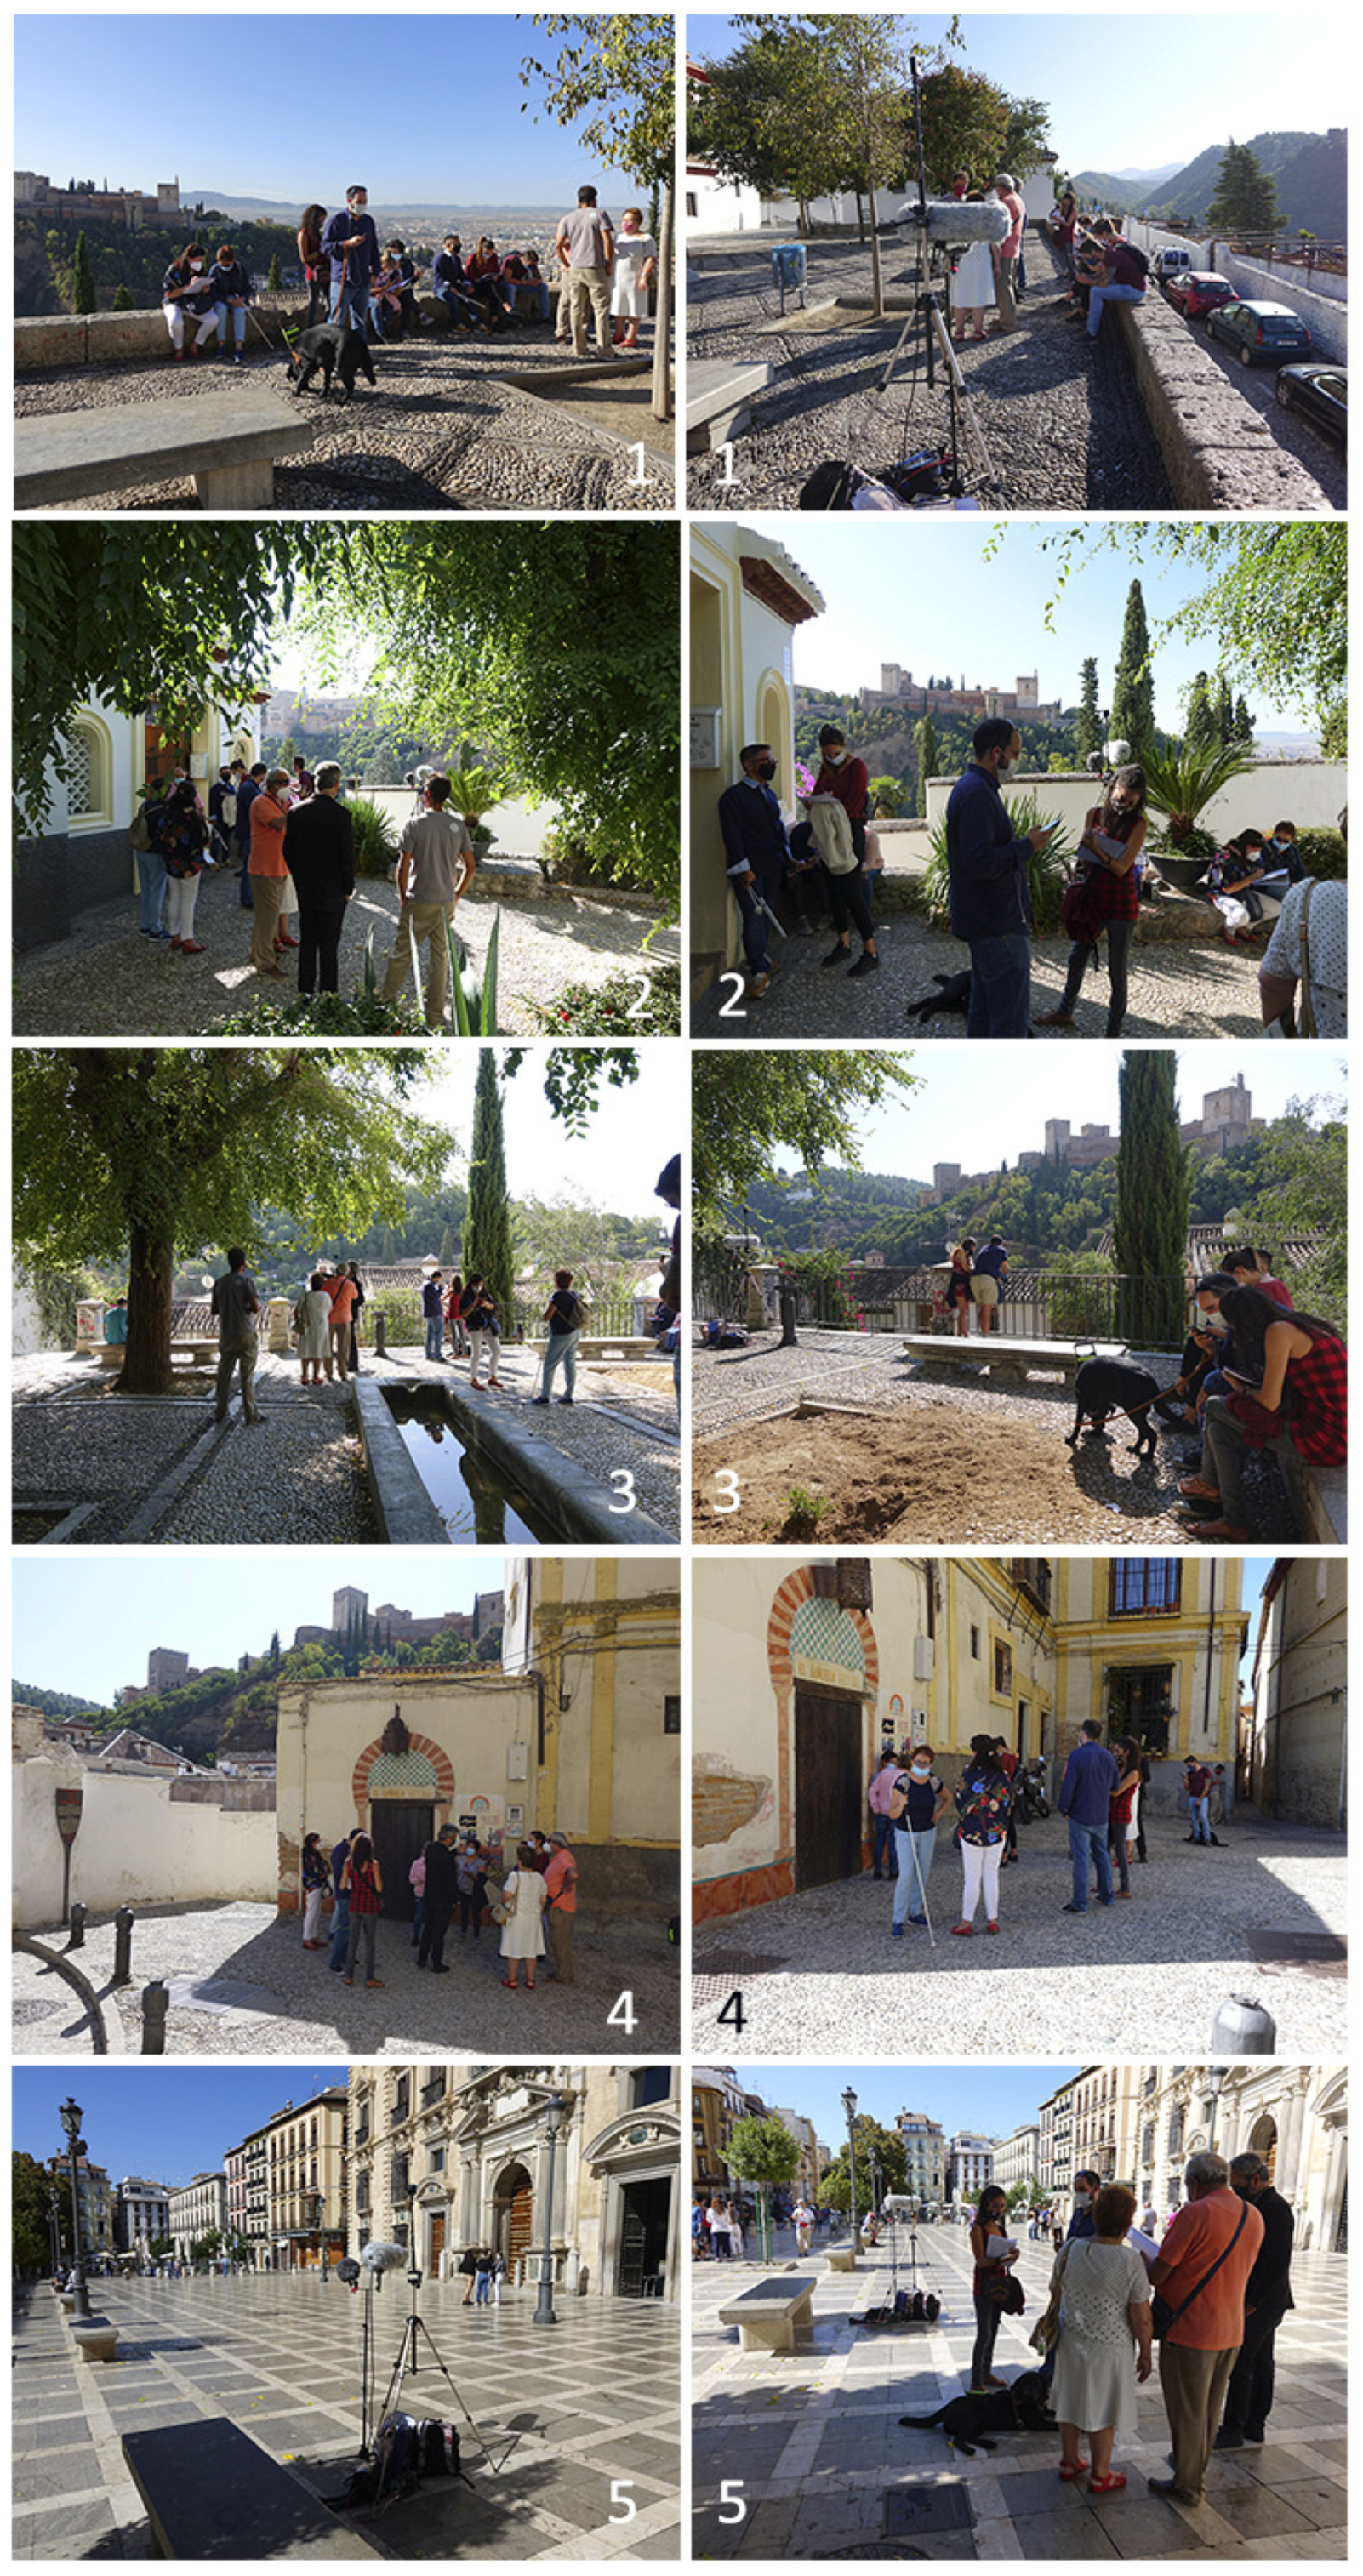
Photographic tour of evaluation sites during the first soundwalk (SW1). Double views for each stop site: from top to bottom, Stop Sites 1, 2, 3, and 4.
Figure 2.
Photographic tour of evaluation sites during the first soundwalk (SW1). Double views for each stop site: from top to bottom, Stop Sites 1, 2, 3, and 4.
Figure 3.
Photographic tour of evaluation sites during the second soundwalk (SW2). Double views for each stop site: from top to bottom, Stop Sites 1, 2, 3, 4, 5, and 6.
Figure 3.
Photographic tour of evaluation sites during the second soundwalk (SW2). Double views for each stop site: from top to bottom, Stop Sites 1, 2, 3, 4, 5, and 6.
Figure 4.
Photographic tour of evaluation sites during the third soundwalk (SW3). Double views for each stop site: from top to bottom, Stop Sites 1, 2, 3, 4, and 5.
Figure 4.
Photographic tour of evaluation sites during the third soundwalk (SW3). Double views for each stop site: from top to bottom, Stop Sites 1, 2, 3, 4, and 5.
Figure 5.
First soundwalk (SW1) path description on the street map of Granada. The Alhambra is clearly seen in the centre right of the image.
Figure 5.
First soundwalk (SW1) path description on the street map of Granada. The Alhambra is clearly seen in the centre right of the image.
Figure 6.
Second soundwalk (SW2) path description on the street map of Granada. SW2_1 stop is the same as SW1_3 in
Figure 4.
Figure 6.
Second soundwalk (SW2) path description on the street map of Granada. SW2_1 stop is the same as SW1_3 in
Figure 4.
Figure 7.
Third soundwalk (SW3) path description on the street map of Granada. SW3_5 stop is the same as SW1_4 in
Figure 4.
Figure 7.
Third soundwalk (SW3) path description on the street map of Granada. SW3_5 stop is the same as SW1_4 in
Figure 4.
Figure 8.
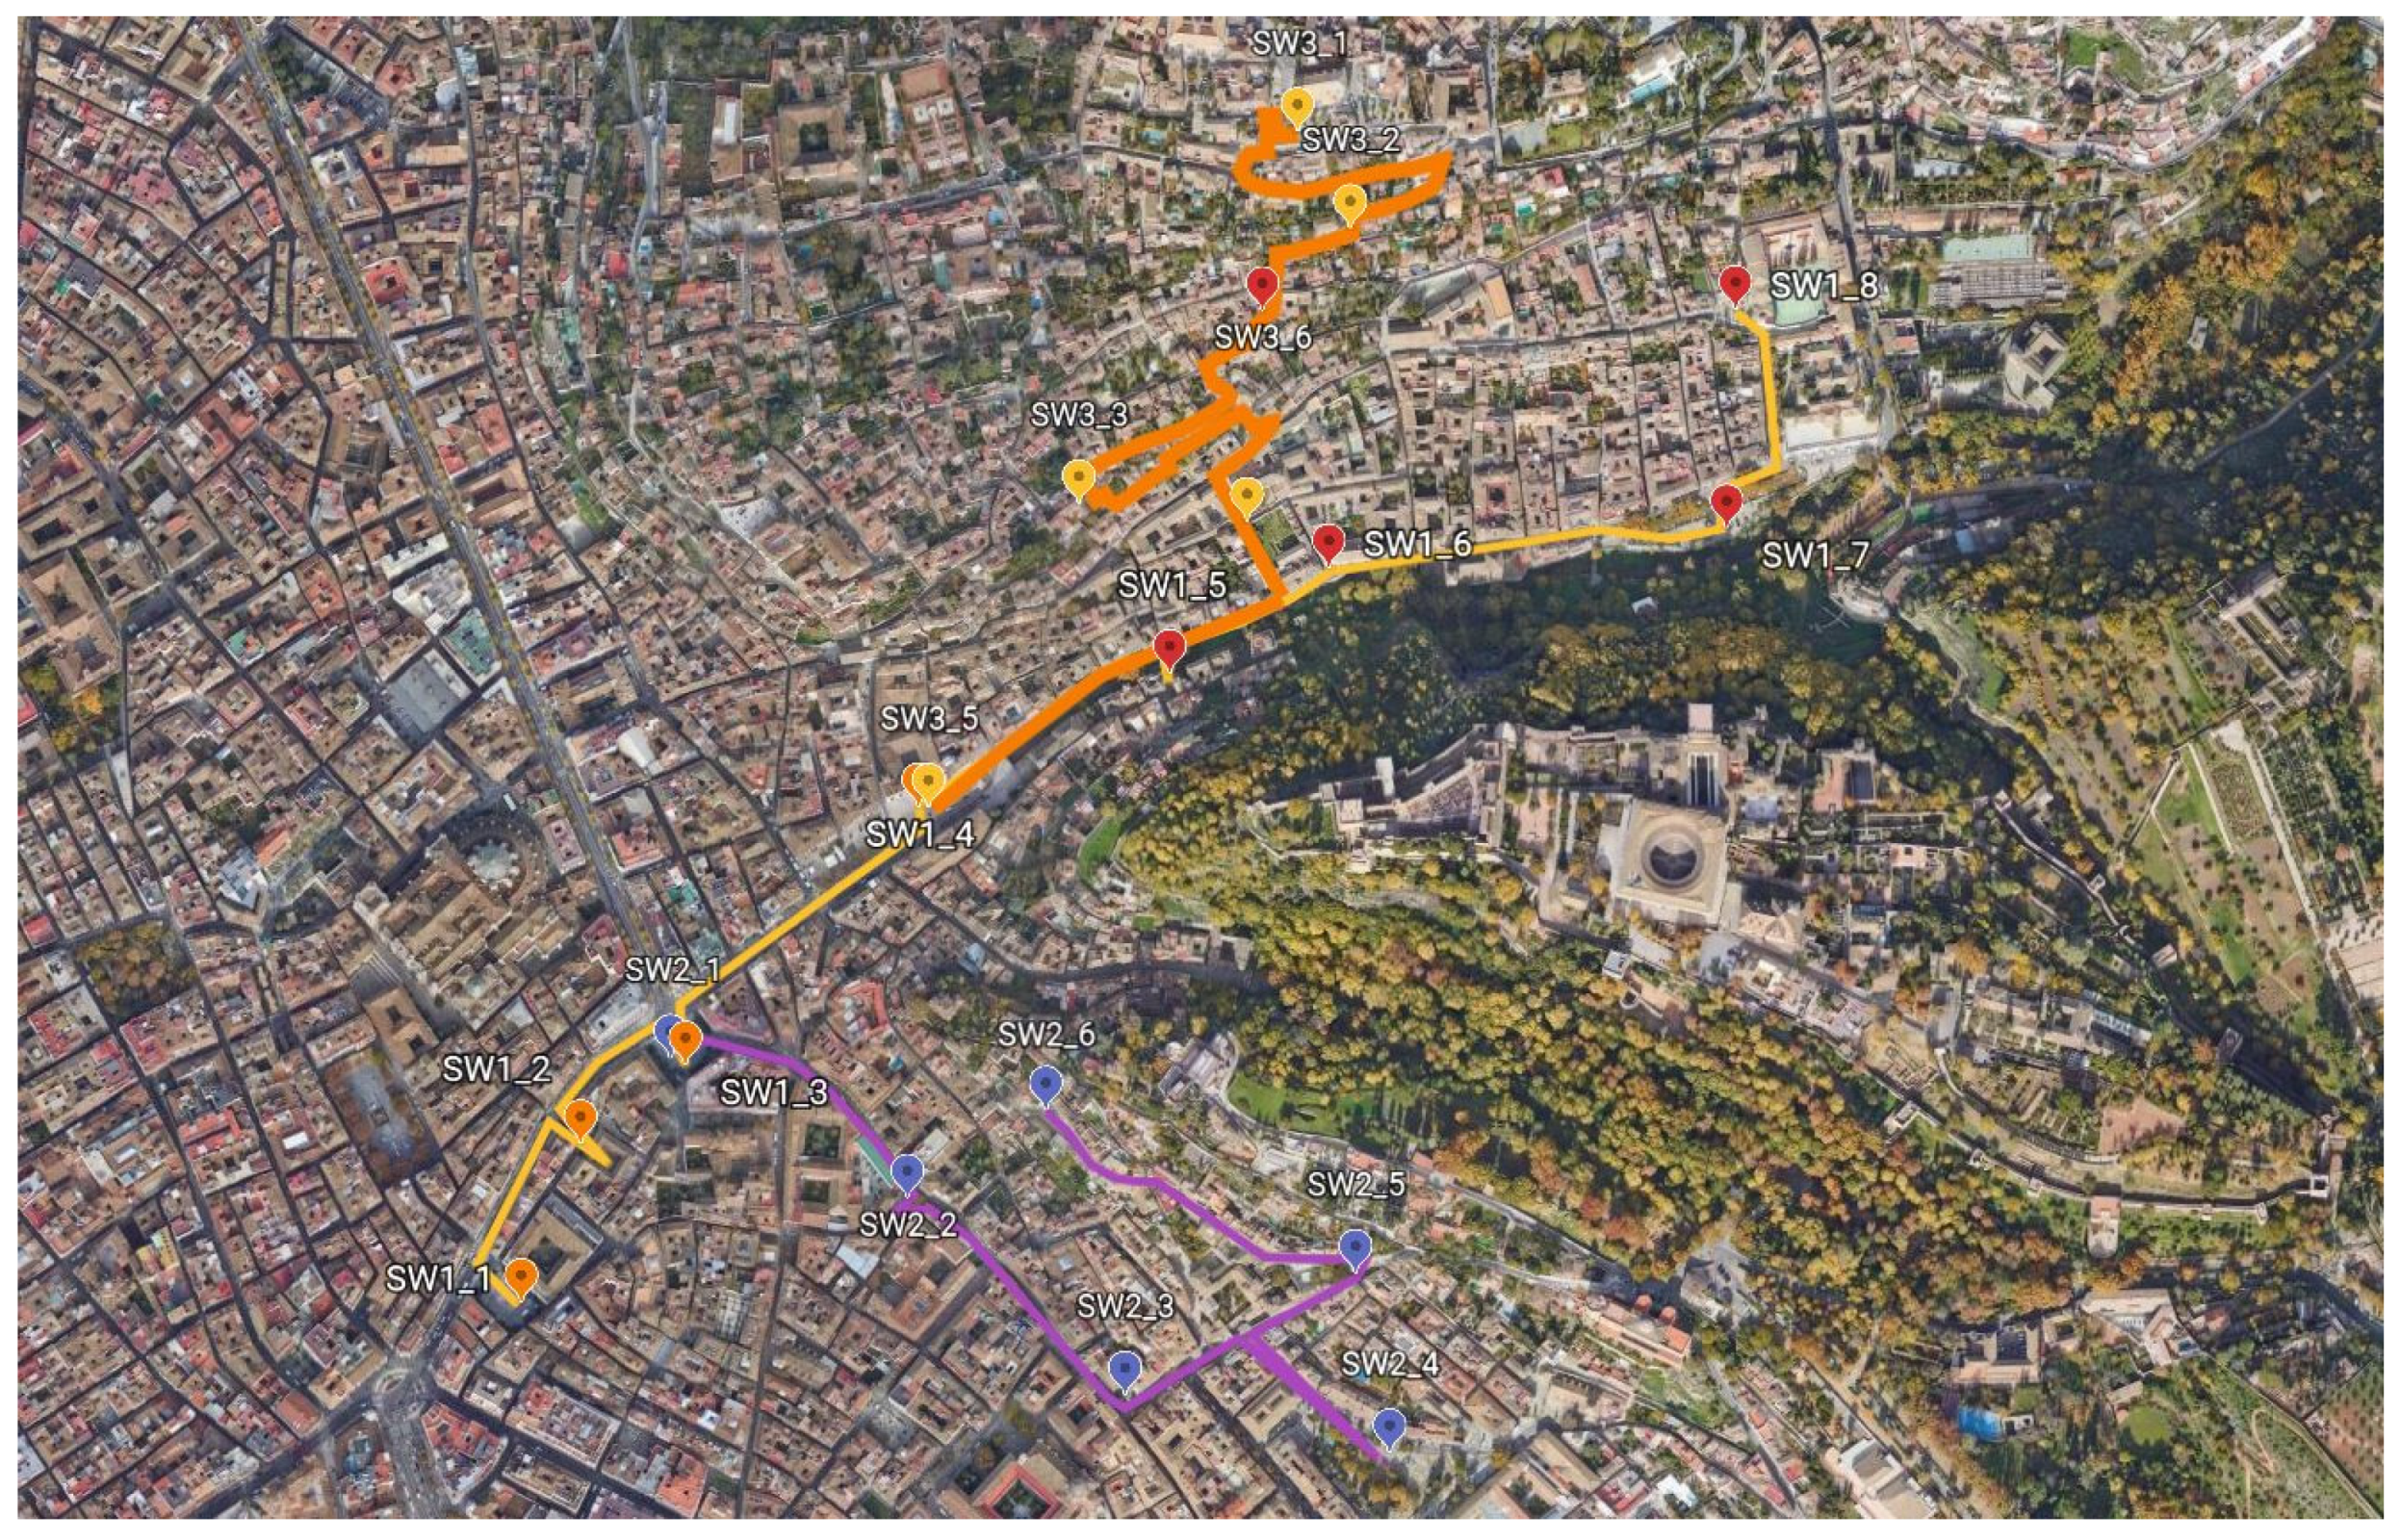
The three soundwalk paths on the street map of Granada.
Figure 8.
The three soundwalk paths on the street map of Granada.
Figure 9.
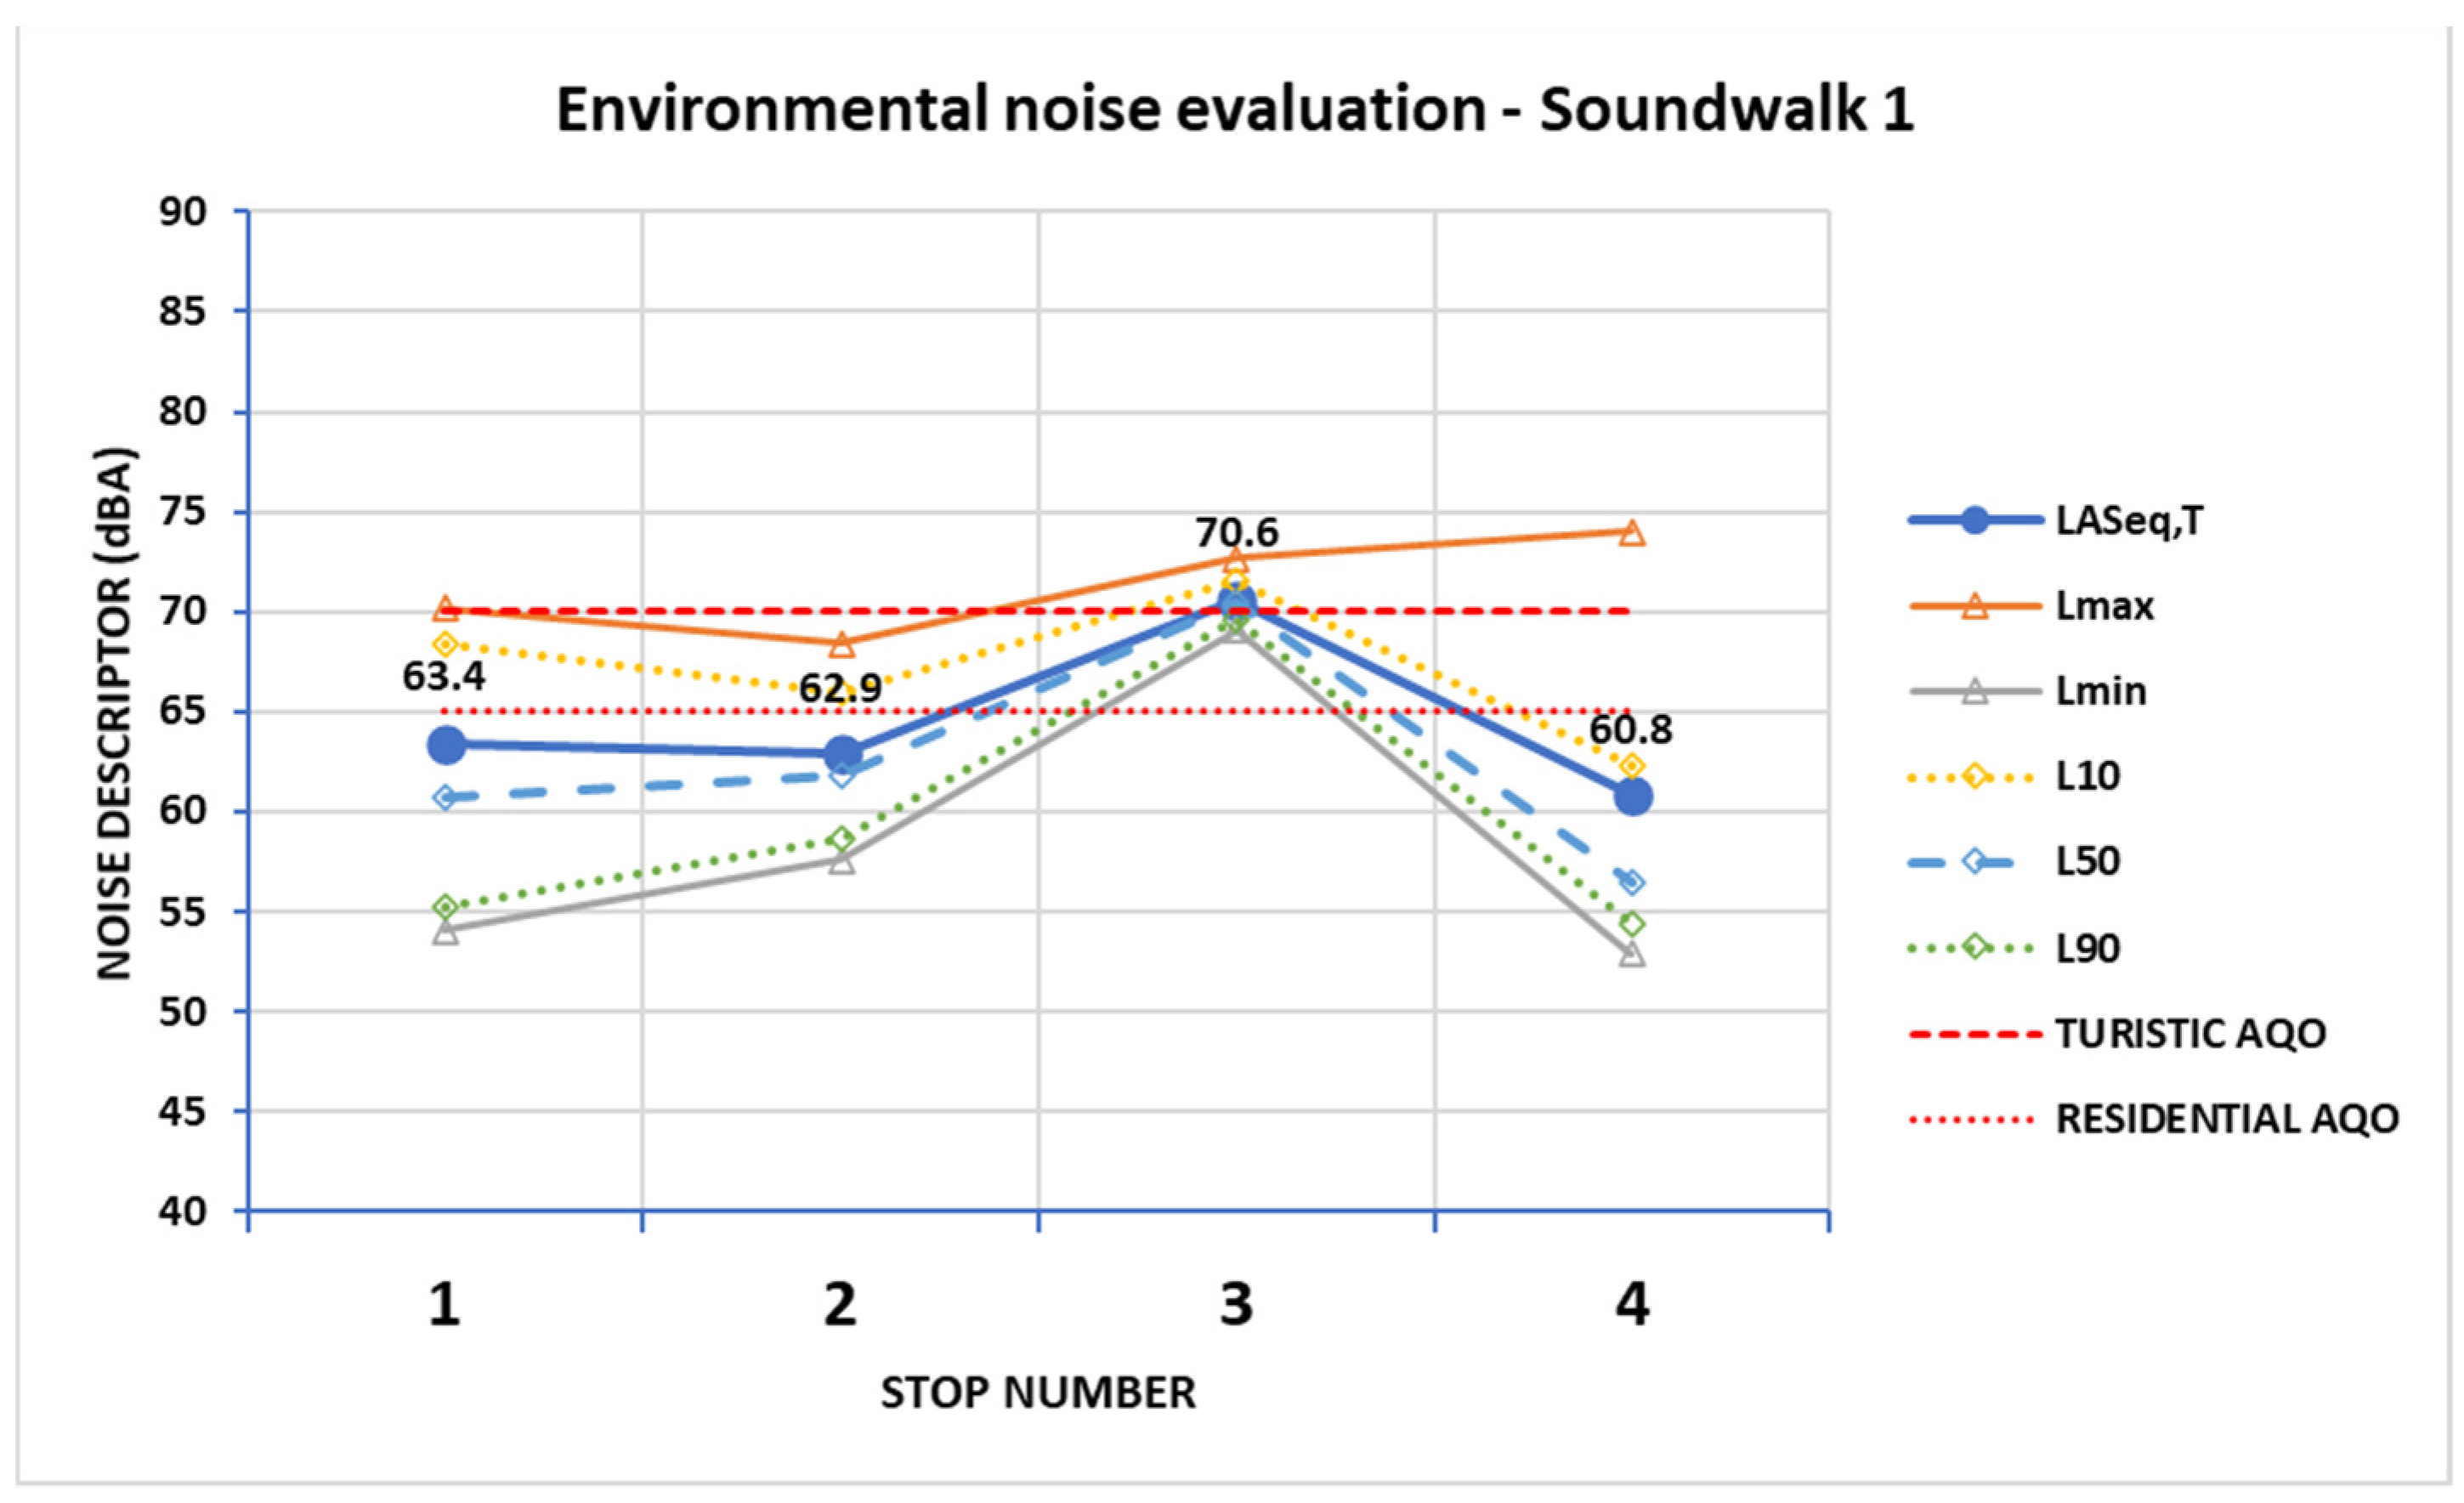
Environmental noise descriptors for Soundwalk 1 (SW1).
Figure 9.
Environmental noise descriptors for Soundwalk 1 (SW1).
Figure 10.
Environmental noise descriptors for Soundwalk 2 (SW2).
Figure 10.
Environmental noise descriptors for Soundwalk 2 (SW2).
Figure 11.
Environmental noise descriptors for Soundwalk 3 (SW3).
Figure 11.
Environmental noise descriptors for Soundwalk 3 (SW3).
Figure 12.
Sound source identification during Soundwalk 1 (SW1). Mean answers with standard deviations as error bars, and the noise equivalent levels at each evaluation site.
Figure 12.
Sound source identification during Soundwalk 1 (SW1). Mean answers with standard deviations as error bars, and the noise equivalent levels at each evaluation site.
Figure 13.
Sound source identification during Soundwalk 2 (SW2). Mean answers with standard deviations as error bars, and noise equivalent levels at each evaluation site.
Figure 13.
Sound source identification during Soundwalk 2 (SW2). Mean answers with standard deviations as error bars, and noise equivalent levels at each evaluation site.
Figure 14.
Sound source identification during Soundwalk 3 (SW3). Mean answers with standard deviations as error bars, and noise equivalent levels at each evaluation site.
Figure 14.
Sound source identification during Soundwalk 3 (SW3). Mean answers with standard deviations as error bars, and noise equivalent levels at each evaluation site.
Figure 15.
Perceived affective quality during Soundwalk 1 (SW1). Mean answers with standard deviations as error bars, and noise equivalent levels at each evaluation site.
Figure 15.
Perceived affective quality during Soundwalk 1 (SW1). Mean answers with standard deviations as error bars, and noise equivalent levels at each evaluation site.
Figure 16.
Perceived affective quality during Soundwalk 2 (SW2). Mean answers with standard deviations as error bars, and noise equivalent levels at each evaluation site.
Figure 16.
Perceived affective quality during Soundwalk 2 (SW2). Mean answers with standard deviations as error bars, and noise equivalent levels at each evaluation site.
Figure 17.
Perceived affective quality during Soundwalk 3 (SW3). Mean answers with standard deviations as error bars, and noise equivalent levels at each evaluation site.
Figure 17.
Perceived affective quality during Soundwalk 3 (SW3). Mean answers with standard deviations as error bars, and noise equivalent levels at each evaluation site.
Figure 18.
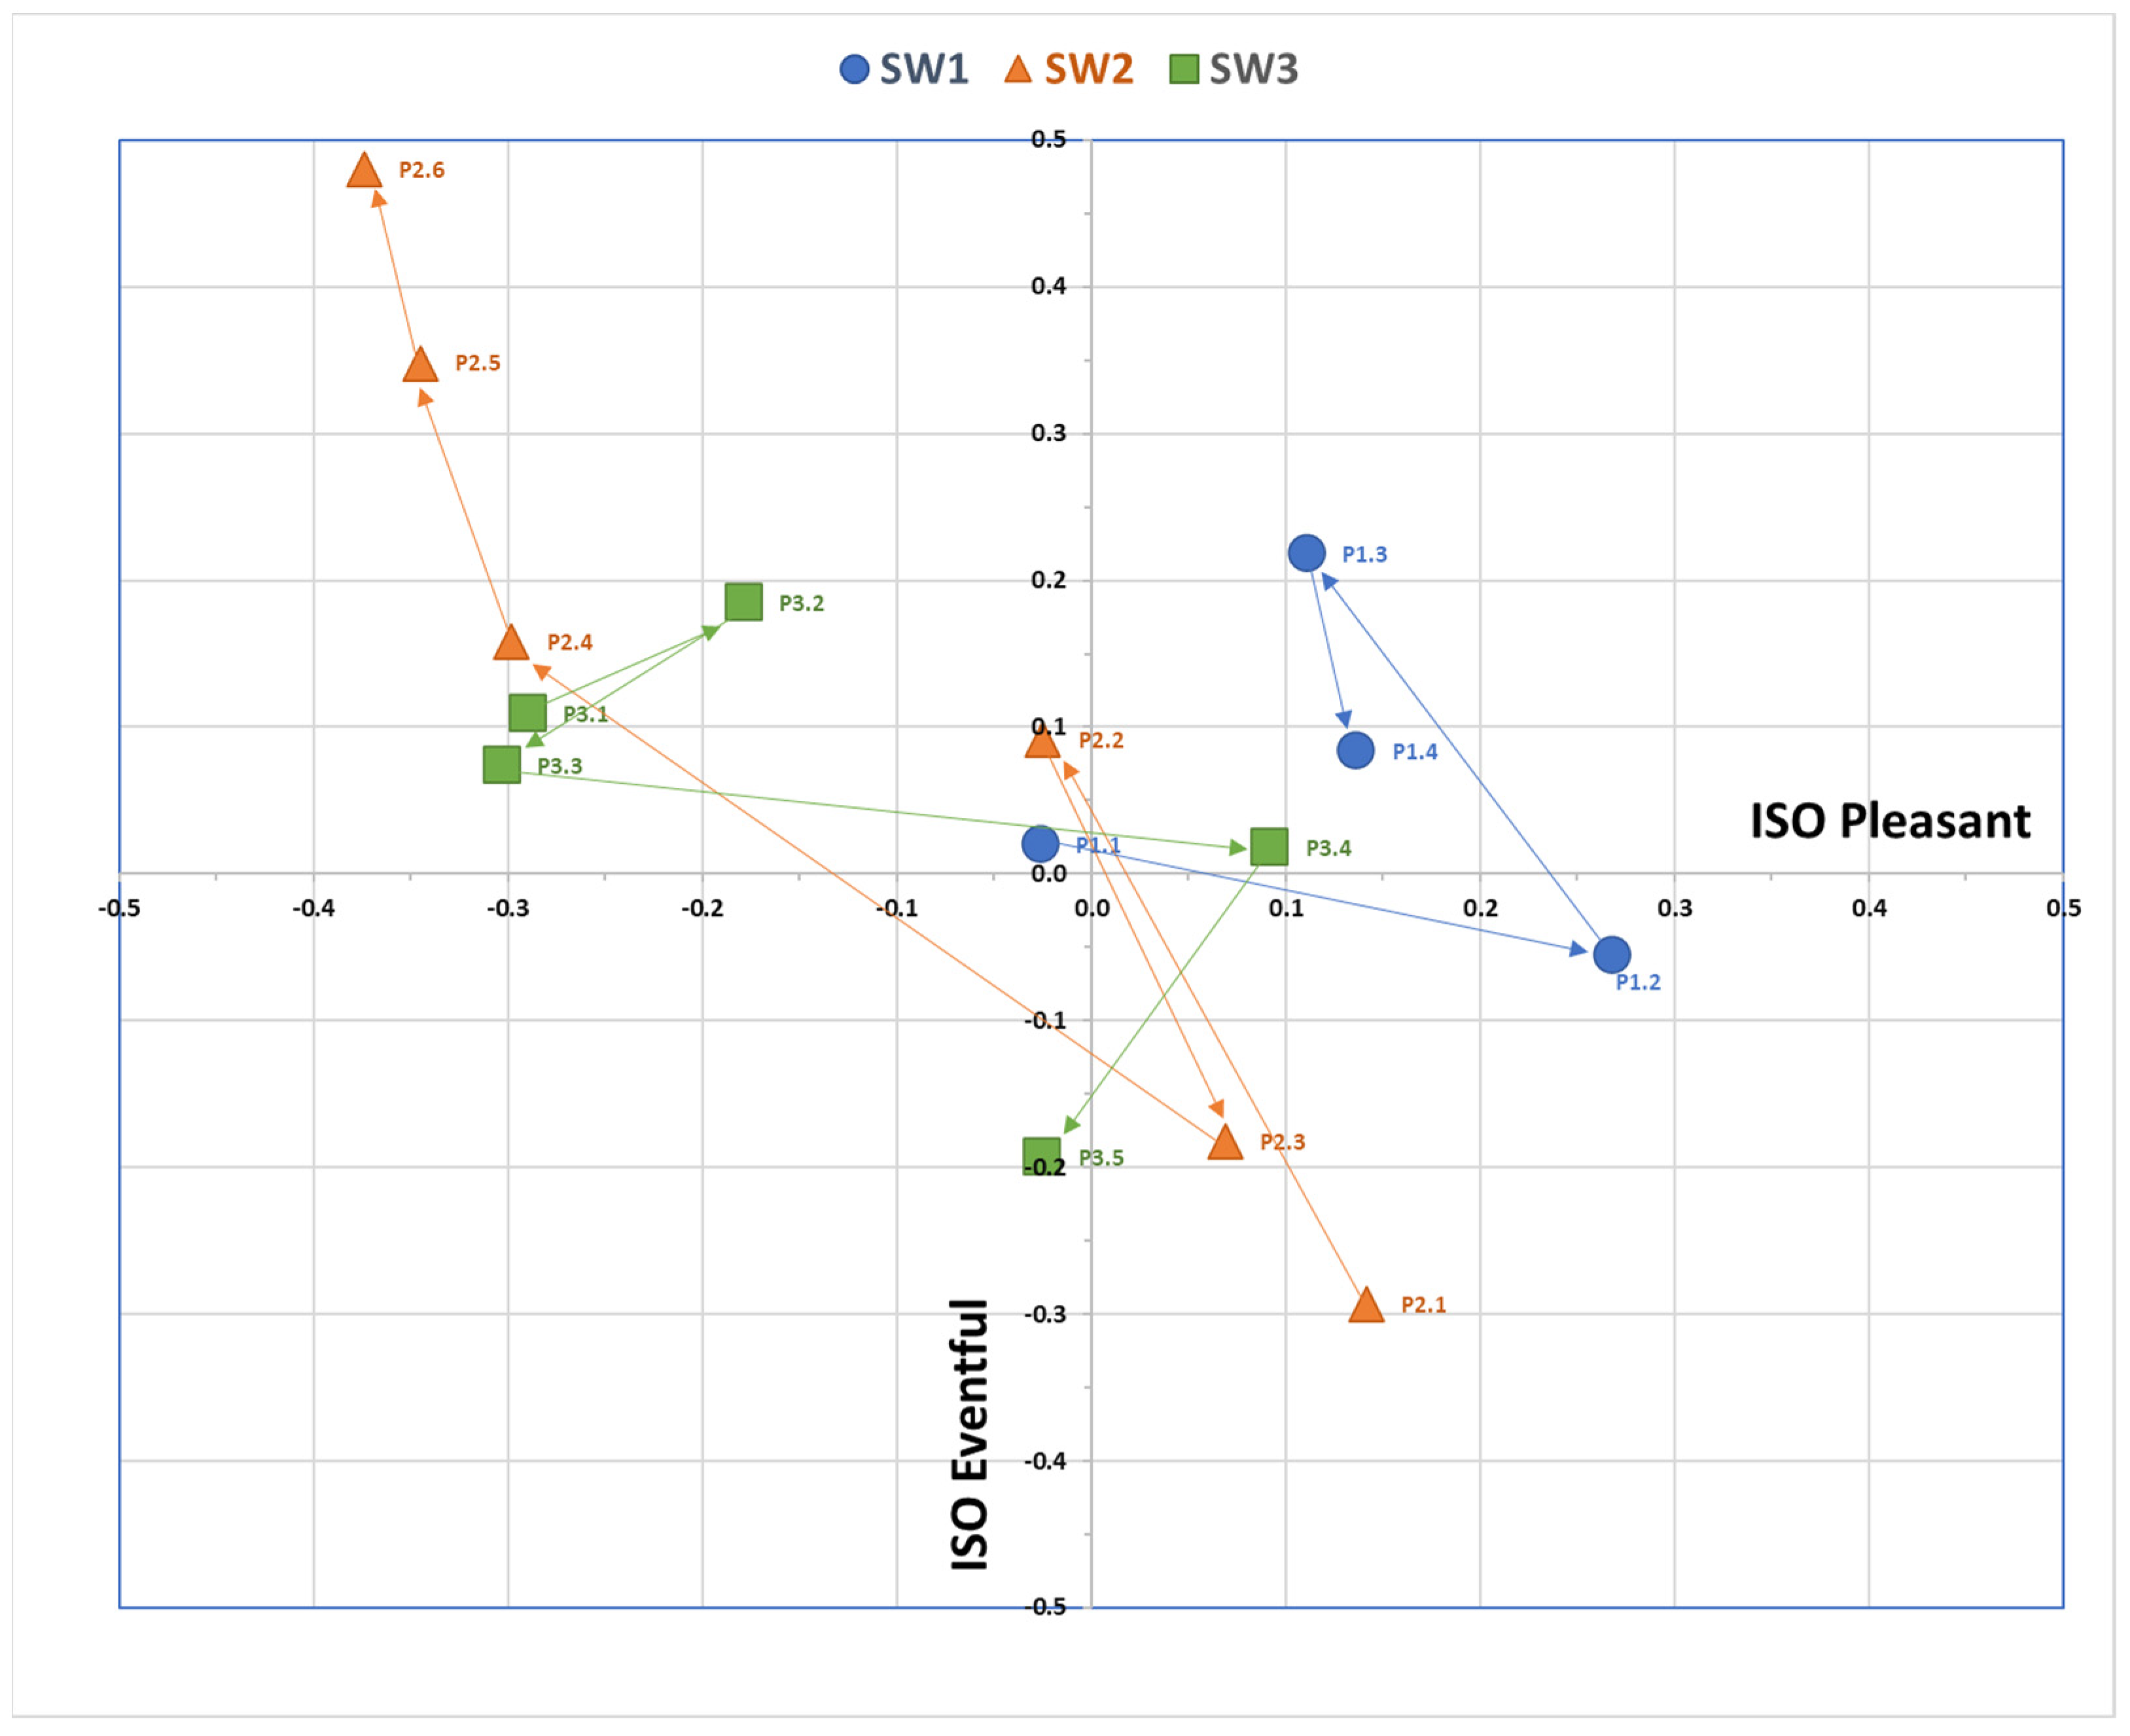
Pleasantness (P) and Eventfulness (E), as derived from ISO 12913-3 formulae and Q2 data, at every stop on the path during SW1, SW2, and SW3—the arrows indicate the sequences of stops during the soundwalks.
Figure 18.
Pleasantness (P) and Eventfulness (E), as derived from ISO 12913-3 formulae and Q2 data, at every stop on the path during SW1, SW2, and SW3—the arrows indicate the sequences of stops during the soundwalks.
Figure 19.
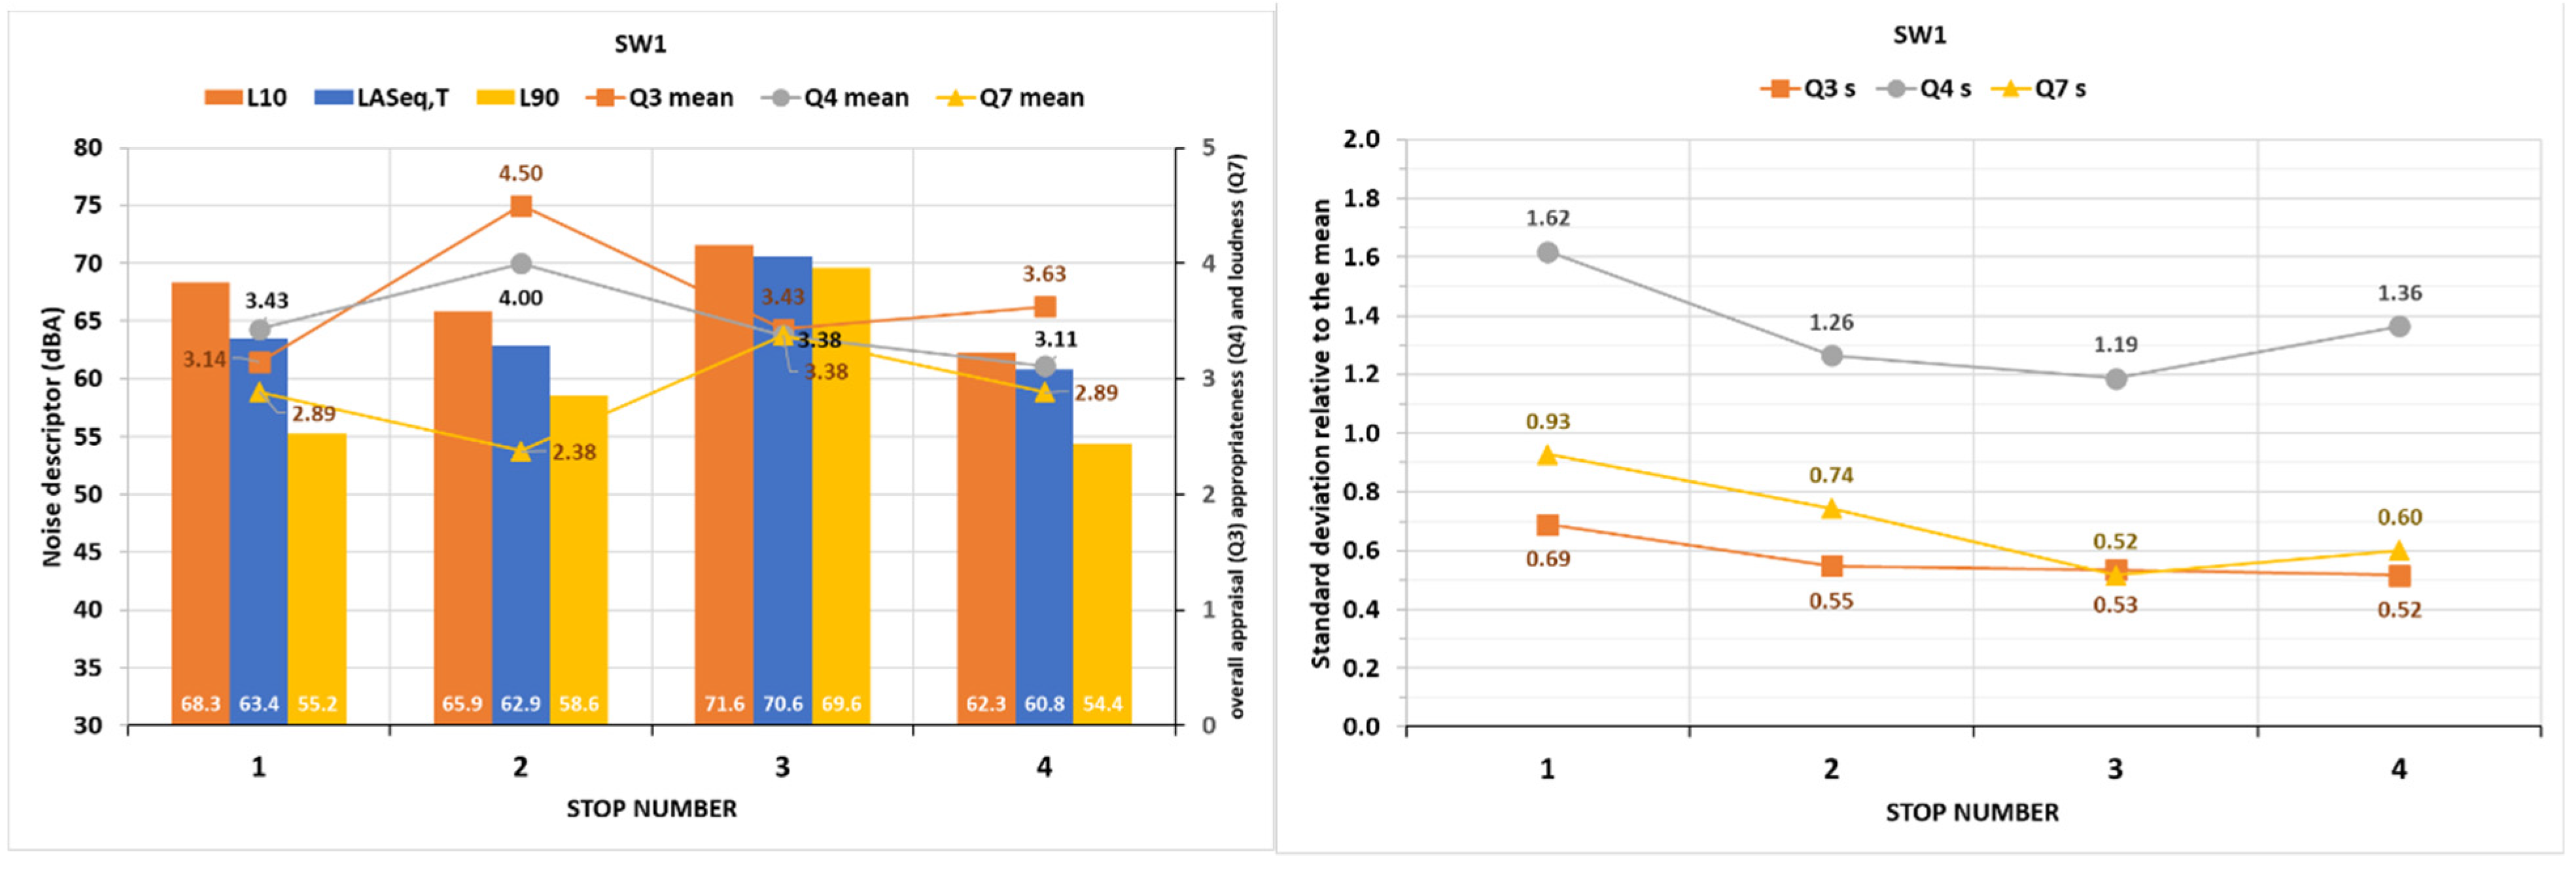
Mean answers to Q3 (overall appraisal), Q4 (appropriateness), and Q7 (loudness), together with environmental noise descriptor information: (left) standard deviations around the means for these answers at each stop site; and (right) during the first soundwalk (SW1).
Figure 19.
Mean answers to Q3 (overall appraisal), Q4 (appropriateness), and Q7 (loudness), together with environmental noise descriptor information: (left) standard deviations around the means for these answers at each stop site; and (right) during the first soundwalk (SW1).
Figure 20.
Mean answers to Q3 (overall appraisal), Q4 (appropriateness), and Q7 (loudness), together with environmental noise descriptor information: (left) standard deviations around the means for these answers at each stop site; and (right) during the second soundwalk (SW2).
Figure 20.
Mean answers to Q3 (overall appraisal), Q4 (appropriateness), and Q7 (loudness), together with environmental noise descriptor information: (left) standard deviations around the means for these answers at each stop site; and (right) during the second soundwalk (SW2).
Figure 21.
Mean answers to Q3 (overall appraisal), Q4 (appropriateness), and Q7 (loudness), together with environmental noise descriptor information: (left) standard deviations around the means for these answers at each stop site; and (right) during the third soundwalk (SW3).
Figure 21.
Mean answers to Q3 (overall appraisal), Q4 (appropriateness), and Q7 (loudness), together with environmental noise descriptor information: (left) standard deviations around the means for these answers at each stop site; and (right) during the third soundwalk (SW3).
Figure 22.
Mean score comparison of the eight perceptual attributes, at the Mirador San Nicolas viewpoint, SSID (nonvisually impaired) (2019), and ONCE (visually impaired) (2020) evaluations. Standard deviations as error bars, and noise equivalent levels as in
Figure 14,
Figure 15 and
Figure 16.
Figure 22.
Mean score comparison of the eight perceptual attributes, at the Mirador San Nicolas viewpoint, SSID (nonvisually impaired) (2019), and ONCE (visually impaired) (2020) evaluations. Standard deviations as error bars, and noise equivalent levels as in
Figure 14,
Figure 15 and
Figure 16.
Table 1.
Soundwalks with ONCE affiliates: main characteristics.
Table 1.
Soundwalks with ONCE affiliates: main characteristics.
| Soundwalk | Urban Typology | Code | Length (km) | Stops | Date |
|---|
| SW1 | City centre | URB_1 | 1.4 | 8 (*) | 17 September 2020 |
| SW2 | City centre | URB_2 | 1.1 | 6 | 22 September 2020 |
| SW3 | Albaicín Moorish district | ALB_1 | 0.8 | 6 (*) | 25 September 2020 |
Table 2.
Versions of the soundwalk questionnaire including hosting system and number of questions.
Table 2.
Versions of the soundwalk questionnaire including hosting system and number of questions.
| Soundwalk | Version | Online Hosting | Number of Questions |
|---|
| SW1 | Online | Qualtrix | 12 |
| SW2 | Online and paper booklet | Google | 15 |
| SW3 | Online and paper booklet | Google | 16 |
Table 3.
Detailed description of SW1 questionnaire, including correspondence with the SSID project and the ISO standard. For full questionnaire (both Spanish version and English translation), please see
Supplementary Materials.
Table 3.
Detailed description of SW1 questionnaire, including correspondence with the SSID project and the ISO standard. For full questionnaire (both Spanish version and English translation), please see
Supplementary Materials.
| Question | Content | SSID | ISO 12913-2:2018 |
|---|
| Q1 | Sound source dominance | Yes | Yes | Method A |
| Q2 | Soundscape perceptual attributes | Yes | Yes | Method A |
| Q3 | Overall assessment of sound environment | Yes | Yes | Method A |
| Q4 | Appropriateness of sound environment | Yes | Yes | Method A |
| Q5 | How calm is it here? | No | No | |
| Q6 | How pleasant is it here? | No | No | (Opposite question is in Method B) |
| Q7 | How loud is it here? (volume, not quality) | Yes | Yes | Method B |
| Q8 | How often do you visit this place? | Yes | No | (Similar question is found in Method B) |
| Q9 | Gender | Yes | No | |
| Q10 | Occupational status | Yes | No | (Similar question is found in Method C) |
| Q11 | Level of education | Yes | No | |
| Q12 | WHO-5 items | Yes | No | |
Table 4.
Detailed description of SW2 questionnaire.
Table 4.
Detailed description of SW2 questionnaire.
| Question | Content | Origin |
|---|
| A | Q9 | as in SW1 |
| B | Q10 | as in SW1 |
| C | Q11 | as in SW1 |
| D | Q12 | as in SW1 |
| 1 | Q8 | as in SW1 |
| 2 | Q1 | as in SW1 |
| 3 | Q2 | as in SW1 |
| 4 | Q3 | as in SW1 |
| 5 | Q4 | as in SW1 |
| 6 | Q7 | as in SW1 |
| 7 | To what extent are you able to orientate yourself in this site? | NEW (Q7N) |
| 8 | Would you say environmental noise could be a problem at this site? | NEW (Q8N) |
| 9 | Would you recognize this site if your ever came back here? | NEW (Q9N) |
Table 5.
Description of SW3 Question 10.
Table 5.
Description of SW3 Question 10.
| Question | Content | Origin |
|---|
| 10 | In relation to pedestrian accessibility, comfort, and architectural barriers that would prevent access, what was the soundwalk like until you reached the site number? (a reference to every stop site follows) | NEW (Q10N) |
Table 6.
“sOuNdsCapE Granada 2020” project dataset description. (N° stands for number).
Table 6.
“sOuNdsCapE Granada 2020” project dataset description. (N° stands for number).
| Soundwalk | Participants
Total (F/M) | Stops | Answers
(Max. Resp. Number) | N° of Questions in Survey | Pieces of Info from Soundwalk |
|---|
| SW1 | 9 (3/6) | 4 | 34 (36) | 12 | 408 |
| SW2 | 13 (6/7) | 6 | 67 (78) | 13 | 871 |
| SW3 | 11 (7/4) | 5 | 50 (55) | 14 | 700 |
| TOTAL | 33 | 15 | 151 (169) | - | 1.979 |
Table 7.
Environmental noise descriptors in dBA for each soundwalk. Note: stop sites marked (*) are the same place; similarly, stop sites marked (**) are the same place.
Table 7.
Environmental noise descriptors in dBA for each soundwalk. Note: stop sites marked (*) are the same place; similarly, stop sites marked (**) are the same place.
| Soundwalk | Stop Site | Time (hh:mm) | LASeq | LAmax | LAmin | L10 | L50 | L90 | (L10–L90) |
|---|
| SW1 | 1 | 8:55 | 63.4 | 70.2 | 54.0 | 68.3 | 60.8 | 55.2 | 13.1 |
| 2 | 11:07 | 62.9 | 68.4 | 57.6 | 65.9 | 61.8 | 58.6 | 7.3 |
| * 3 | 11:41 | 70.6 | 72.7 | 69.1 | 71.6 | 70.5 | 69.6 | 2.0 |
| ** 4 | 12:15 | 60.8 | 74.0 | 52.9 | 62.3 | 56.4 | 54.4 | 7.9 |
| SW2 | * 1 | 10:24 | 65.6 | 68.7 | 60.4 | 68.4 | 65.6 | 61.2 | 7.2 |
| 2 | 11:06 | 66.2 | 70.7 | 61.7 | 69.1 | 65.5 | 62.1 | 7.0 |
| 3 | 11:03 | 67.5 | 81.2 | 58.6 | 68.0 | 61.6 | 58.7 | 9.3 |
| 4 | 11:25 | 54.5 | 58.8 | 50.4 | 56.9 | 54.2 | 51.8 | 5.1 |
| 5 | 11:48 | 50.5 | 54.3 | 44.9 | 53.3 | 49.9 | 46.0 | 7.3 |
| 6 | 12:13 | 55.7 | 67.4 | 40.6 | 60.1 | 47.7 | 41.3 | 18.8 |
| SW3 | 1 | 10:28 | 50.5 | 54.7 | 45.2 | 52.8 | 50.5 | 46.5 | 6.3 |
| 2 | 11:00 | 55.4 | 61.1 | 48.6 | 58.5 | 53.9 | 50.6 | 7.9 |
| 3 | 11:24 | 53.0 | 63.0 | 45.7 | 55.4 | 50.2 | 46.9 | 8.5 |
| 4 | 11:51 | 60.0 | 70.0 | 48.1 | 64.7 | 54.4 | 49.9 | 14.8 |
| ** 5 | 12:15 | 61.0 | 67.1 | 55.3 | 64.0 | 59.4 | 57.2 | 6.8 |
Table 8.
Comparison of sound levels in dB(A) for the 2019 (SSID) and 2020 (ONCE) data collection campaigns.
Table 8.
Comparison of sound levels in dB(A) for the 2019 (SSID) and 2020 (ONCE) data collection campaigns.
| San Nicolás Viewpoint | LCeq (1) | LAeq | LAF10 | LAFmax | LAF90 | LAFmin | LAF10-LAF90 | LAE |
|---|
| SSID (2019) | 67.3 | 62.0 | 64.2 | 78.2 | 56.7 | 52.0 | 7.5 | 87.6 |
| ONCE (2020) | 62.3 | 50.5 | 52.8 | 54.7 | 46.5 | 45.2 | 6.3 | 68.3 |


