Article

Residential Solar Thermal Performance Considering Self-Shading Incidence between Tubes in Evacuated Tube and Flat Plate Collectors

by
Esteban Zalamea-Leon
1,*,
Edgar A. Barragán-Escandón
2,
John Calle-Sigüencia
2,
Mateo Astudillo-Flores
3 and
Diego Juela-Quintuña
3
1
School of Architecture and Urban Planning, Universidad de Cuenca, Cuenca 010112, Ecuador
2
Energy Research Group GIE, Universidad Politécnica Salesiana, Cuenca 010105, Ecuador
3
Research Department, Universidad de Cuenca, Cuenca 010112, Ecuador
*
Author to whom correspondence should be addressed.
Sustainability 2021, 13(24), 13870; https://doi.org/10.3390/su132413870
Submission received: 27 October 2021 / Revised: 11 December 2021 / Accepted: 12 December 2021 / Published: 15 December 2021

Abstract

:
The performance of solar thermal technology under high-altitude equatorial climatic and solar path conditions has not been determined. Evacuated tube solar collectors are more efficient than flat plate collectors in cold and cloudy regions; however, due to their dependence on orientation, the irradiation incidence between the tubes of these collectors can be blocked. In this study, the performance of these types of collectors was analyzed to determine the implications of their orientation under these specific climate conditions. Four solar thermal systems were installed: two of the systems used evacuated tube collectors, and two used flat plate collectors. Each collector was connected to storage and discharge points to simulate residential consumption when observing the real performance of the four systems in terms of irradiation availability. The evacuated tube collectors were more efficient and reduced the backup energy requirement by up to 20.6% more on average than the flat plate collectors. In addition, the performance of the evacuated tube collectors increased by up to 9.8% when the tubes were arranged parallel to the solar path, compared to when they were arranged perpendicular to the solar path, verifying that the blockage effect is an important parameter to consider for evacuated tube technology. The main novelty of this research is the comparison of these two technologies under different orientations, with perpendicular and parallel dispositions toward the solar path, in a high-altitude equatorial location where solar collectors are not typically oriented in any particular orientation. To the best of our knowledge, this is the first complete analysis of real systems deployed under these conditions.

1. Introduction

The sun is the power source with the greatest capacity to supply human energy needs [1]. Solar thermal technology has been used in buildings since the late 19th century [2]. An extensive amount of research and development on solar thermal collectors (STCs) for use in buildings has been conducted, with flat plate collectors (FPCs) and evacuated tube collectors (ETCs) being among the most commonly used technologies [3]. The operating principle of FPCs is a primitive form of solar thermal technology, which is the same as the first solar boxes developed at the beginning of the 20th century and is based on the greenhouse effect surrounding a solar absorption surface [2]. ETCs, in which heat is collected by glass tubes enclosing heat pipes, represent a technological improvement. The glass tubes create a vacuum or a minimal steady-state air environment that isolates the collector from the outside environment [4].
Water heating for both sanitary and heating purposes accounts for a large proportion of the energy required by buildings [5]. In Corsica, France, Lamnatou et al. [6] found that the energy payback time of using an FPC is shorter than that of an ETC, which indicates that in middle latitudes with high irradiation, FPCs are more cost-effective. Likewise, Valančius et al. [7] showed that the payback time of these technologies is 8 years, depending on the climate in Central and Nordic Europe and local costs. Although the price of ETCs can be a limiting factor, this technology is increasingly used instead of FPCs because ETCs are better at maintaining the recovered heat. However, relatively speaking, ETCs are more expensive than FPCs [8].
The majority of STCs are installed in China (71.0% of the global total). In 2014, approximately 80.0% of all installed STCs in the world were ETCs [5]. In Turkey, the United States, Mexico and China, FPCs account for 99.0%, 86.0%, 36.0%, and 5.0% of all STCs, respectively [9,10,11]. The improved performance of ETCs is particularly noticeable in cold and cloudy climates [8]; in summer, with seasonal climates such as that in Lithuania, the two types of collectors can produce similar amounts of energy [7]. Ayompe et al. [12] concluded that for a domestic system, ETCs are approximately 23.0% more efficient than FPCs. Chow et al. [13] found that ETCs are between 11.0% and 25.0% more efficient than FPCs for different European cities. Adsten et al. [14] showed that ETCs are between 28.0% and 35.0% more efficient than FPCs in three different Swedish contexts, demonstrating the superior performance of ETCs under seasonally variable conditions.
However, optimal conditions are not always met because the efficiencies of different types of STCs depend on the design, weather conditions, demand, and consumption profiles [8]. For example, Ge et al. [5] showed that the efficiencies of FPCs and ETCs can be similar under certain operating conditions. Likewise, Tanha et al. [15] found that in snowy and cold conditions, FPCs can provide almost 47.0% more energy than ETCs because ETCs are likely to be covered with snow for a longer time, due to the low convection heat transfer from the absorber to the outer glass tubes.
In terms of incident irradiation, the net internal collector surface area of FPCs is greater than the collector surface area of ETCs for collectors of similar sizes. ETCs, which are subdivided or segmented in tubular collectors, produce an irradiated surface area for an infinite number of solar incidence angles that are essentially tangential around the tubes; however, due to the separation between the tubes, part of the irradiation flows between them (and the internal collectors in the tubes) when the solar incidence is perpendicular or nearly perpendicular to the collector. In contrast, FPCs capture all irradiation that falls on their surface with a single angle of incidence, which varies throughout the day, resulting in higher thermal losses due to convection in the collector. As a result of the superior insulation of ETCs, higher fluid temperatures can be attained, and low amounts of irradiation in cold weather can be better utilized; heat collection is even possible under diffuse irradiation conditions. In contrast, in climates with high levels of direct irradiation and high ambient temperatures, FPCs perform better than ETCs [16]. The comparative performance trend between the two technologies assumes that the performance of ETCs will be superior as the required temperature differential becomes more demanding (relative to the ambient temperature) [3]. The characteristic relationship between these two types of collectors, in terms of the efficiency of both technologies, is presented in Figure 1 according to a report published by Norton [17].
Despite the emergence of various typologies of STC products developed for architectural integration [18,19], the standard ETC and FPC products remain the most widespread and cost-effective technologies for housing. These STCs are economical and efficient and can be installed coplanar to building surfaces to reduce the esthetic–architectural impact.
In this study, the performance of these technologies under equatorial climatic conditions at high altitudes was measured. The study area is located in the South American Andes Mountain Range in a context that makes it possible to characterize the capacity of these technologies in inter-Andean valleys, at altitudes of between 2000 and 3000 meters above sea level. A recent (2020) analysis examined six cities with these geographical conditions, from Bogotá (4.7° Lat North) to Arequipa (16.3° Lat South), and included a variety of urban areas, such as Pasto (Colombia), Ambato, Riobamba, Quito, Cuenca, Loja (Ecuador), Cajamarca and many smaller towns. An average maximum temperature of 22.8 °C was recorded in the city of Loja, and an average minimum temperature of 6.8 °C was recorded in Arequipa in Peru [20]. The thermal energy requirements in this region are high and stable under these conditions. Under the equatorial solar path, the solar gain is significant only on roofs [21,22].
A previous study examined the electricity generation performance of photovoltaic (PV) installations in the same city as is used for the present research. The previous study examined a different technology but with a performance that was directly correlated with irradiation incidence, using PV panels arranged in sloped arrangements similar to the roofs of buildings. The revealed that the maximum annual generation is not highest from PV panels that are inclined and oriented toward the Equator (to the north), as is normally considered the general rule for optimal solar capture. Overall, an improvement of only 7.0% in annual generation was found when the panels were oriented to the east, relative to the worst orientation (to the west); the yield from north and south orientations was intermediate. The difference in yield is a consequence of cloud cover, as the annual balance shows higher cloud cover in the afternoon and midday and lower cloud cover in the morning [23]. Regarding solar PV, it has been found that there is not a significant incidence regarding orientation at this latitude, especially when the solar plates are arranged in a low inclination with a flat surface, as in FPC technology. However, the performance of PVs is dependent on electromagnetic waves, specifically those that are more related to light waves. In contrast, the performance of STCs is determined by thermal and infrared electromagnetic waves; therefore, although the efficiency of both technologies is influenced by the irradiation levels, the technologies use different wavelengths of solar irradiation. Photovoltaics, unlike STCs, exhibit a reduced performance according to temperature [24].
Previous researchers have analyzed the performance of ETCs under equatorial Andean conditions in terms of inclination modifications, with each tube receiving direct solar incidence [25]; under such conditions, the fluid could be heated even at slopes of up to 60°. Despite the potential of STCs for buildings and the relevant diffusion of this technology, the performance of STCs under different collector orientations has not been analyzed. By applying the F-Chart method [26], which is a mathematical model that allows the performance of STCs to be predicted based on irradiation, inclination, orientation, climatic conditions, and other factors, the most favorable orientation for surface collectors under the irradiation conditions of Cuenca, Ecuador, was determined to be toward the north if the inclination was above 18°; however, for lower inclinations (14°), the solar performance was similar for all orientations.
The novelty of this research is based on a comparative determination of the heating capacity of ETC and FPC technologies and measurements of the incidence of the intershading effect between the evacuated tubes in an ETC. FPC and ETC technologies have been compared in the past [3,27,28] and their performance characteristics and the effects of collector orientations have been analyzed. However, to the best of our knowledge, the performance of these technologies has not been analyzed using the methodology presented here, in the context of a working residential hot water system under equal irradiation incidence.
This work is structured as follows: first, the solar thermal installations, monitoring equipment, and programming of the consumption of the systems are described. Then, the main results and temperatures obtained as a consequence of the different technologies being oriented in different directions are compared under different extreme and average irradiation scenarios. Then, the comparative temperatures obtained in the solar collector outlets and in the storage tank outlets (with the hot water supply representing this last parameter) are presented, and the systems are compared under different scenarios with high, low, and average irradiation potentials.

2. Materials and Methods

Four STCs were installed in the Andean city of Cuenca, Ecuador, and configured as completely built systems to simulate four residences with identical levels of consumption and storage (200 L). The configuration of each of the four systems was a split collector-storage system, which is an appropriate configuration to reduce architectural impacts and seismic risks, which are common throughout the Andes Mountains. The collectors were deployed facing each of the four cardinal directions, and each collector was paired with each technology to orient the solar incidence parallel to the equatorial solar path (east to west) or perpendicular to the equatorial solar path (north to south. The collectors were thus positioned such that there was direct irradiation incidence in the morning or in the afternoon; thus, the evacuated tubes were installed so that one ETC was oriented to the west (ETC.w) and the other ETC to the south (ETC.s), i.e., with the tubes parallel to the solar path. Similarly, one of the FPCs was deployed parallel to the solar path to the east (FPC.e), and the other was deployed with a north-facing orientation (FPC.n). We set four systems to compare their performance under identical irradiation conditions: one FPC facing parallel to the solar path and one facing perpendicular to the solar path, and one ETC facing parallel to the solar path with the other facing perpendicular to the solar path.
In this experiment, we used the Shanghai APS Eco-tech CO model FPC, with an absorber surface area of 1.9 m2, and the Apricus ETC-20 model ETC, with a net surface area of 3.0 m2 and an absorber surface area of 1.9 m2 [29] (Figure 2). Although the vacuum tubes have 50% larger spatial occupancy, they are similar in terms of collector surface. The STCs were installed with an inclination of 15° with respect to the horizon, which is close to the slope known as “tercia” (18°), typical of local roofs, and is the minimum recommended inclination to achieve the appropriate thermosiphon effect on flat roofs. Figure 2 shows the deployment scheme of the STC, installed on one of the roofs of the Universidad de Cuenca’s Recreation Centre (CREDU). The system is complemented by individual storage units. Figure 3 shows photographs of both the STC and the integrated storage tanks. As a consequence of the low slope, the solar arrangement of the collectors interferes minimally and only for a few minutes, very early in the morning and very late in the afternoon with shadowing between collectors, showing negligible performance losses due to this effect. The built environment also does not affect the solar incidence in this location.
For typical FPC products, the irradiation incidence varies with respect to the flat collector surface according to the time of day. However, in the case of ETCs, where the collector geometry consists of smaller-capture curved surfaces, the irradiation incidence on each tube varies or is mostly direct in some strips and essentially tangential in other strips. The aim of this study was to determine the difference in the incident irradiation on evacuated tubes if the tubes are arranged parallel or perpendicular to the solar path. The incident irradiation is affected by the proximity between tubes and the shadowing effect. Normally, evacuated tubes are separated by approximately 1.0 cm and have a diameter of 6.0 cm. In regions far from the Equator, orienting STCs toward the solar path (southward in the Northern Hemisphere and northward in the Southern Hemisphere) has typically been considered optimal. In equatorial regions, irradiation collection is feasible with an orientation toward any cardinal point when the tilt of the collector is low [21,22]. However, in equatorial regions, when the tubes are oriented either toward the north or south or in arrangements near these orientations, a shading effect between the tubes affects the solar incidence that does not occur when the ETC faces directly east or west. Evidently, this blocking of irradiation affects the performance of these types of collectors, mostly in the early morning and late afternoon hours, when the irradiation is not high; therefore, there is no information as to the global relevance of this self-blocking phenomenon, an effect that is not present when the solar path is parallel to the orientation of the tubes. Appendix A shows a simulation and diagrams of the incident irradiation, developed in Graphisoft ArchiCAD 24 [30], and indicates the irradiation permeability of the tubes. The time of day is evidenced when the light and dark stripes of shadow appear below, i.e., the light passes over the collectors at the moment when the direct irradiation hits the total diameter of the vacuum tubes. In these simulations, the data show that with the collector facing south, the shadow begins to cross the stripes at 10:30 a.m. This effect continues until 2:15 p.m., after which time the light stripes disappear, which implies that blockage of irradiation between tubes begins to occur. When we analyze the same effect with the collector oriented to the west at a 15° tilt, the data show that although the collector is facing away from the sunrise at 7:30 a.m., direct irradiation already begins to cause an effect. This incidence of direct irradiation occurs throughout the day, and the irradiation always crosses between the tubes, a sign that there is no blockage between them. During the afternoon, the solar incidence is more direct, even in the late afternoon. Figure 4 shows diagrams of the intershading effect at early morning solar altitude (8 a.m.) and the permeability of irradiation through the collectors at 1 p.m. In addition, an in-site photograph of the south-facing evacuated tube collector, demonstrating the intershading effect, is shown; this image was taken on an equinox day (21 September 2020 at 8 a.m.). Observing this phenomenon, it is clear that intershading only affects ETCs, so this research focused on comparing the effect of orientation on performance. So, for this purpose, an analysis comparing the various orientations of ETC was conducted, displaying one unit perpendicular to the sun’s path versus one that was deployed parallel to the solar path. These were also compared to FPC, to establish the incidence in terms of orientation at this latitude.
For a full simulation of each residential system, it is necessary to replicate similar water consumption demands to understand the real effect of system performance in a consumption scenario. To this end, an automatic actuation system was installed to ensure water discharge at specific times throughout the day. Industri Mega timers [31] with LS-MC 18 B contactors were installed, along with Autonics TM4-NDSB temperature sensors [32], which, in conjunction with thermocouple systems (with an accuracy of +/− 0.5 °C) located throughout the network, allowed the hot water to be activated and evacuated, while the temperature of the water entering and leaving the STC in the inlet, outlet, and storage systems was measured. The calibrated volume corresponds to a consumption of 50 L per person per day. Each system is calculated as serving a family of four. This magnitude corresponds to the simulation from Calle and Tinoco’s analysis regarding local conditions [33]. The scheduled discharge times are shown in Table 1. The discharges were planned to be five minutes apart to avoid the coincidence of water evacuation in the network because the collectors flow into a single pipe that carries the water to the heated pool, which is the evacuation location.
Simultaneously, meteorological data were taken from a Delta T Devices GP2 weather station [34], which is located on the campus 120 m away from the collector site. Sensors at this station provide data on irradiation, air temperature, wind speed and direction, humidity conditions, and other parameters, which ensures that irradiation and climate are known at the time the temperature readings are taken at the collectors.
The performance reading period for the four systems ran from 26 February to 30 June 2020. These are months of high relative cloudiness, although, at this latitude, cloud cover is substantial throughout the year. The solar altitude is always nearly perpendicular to the ground at noon, with maximum deviations of approximately 26° to the north on the June solstice and 20° to the south on the December solstice (Appendix A).
Once the systems were installed, the performance of each of the ST plates and the thermal energy obtained in each of the collectors were determined. The temperature of use at the storage outlets was determined by considering a consumption temperature of 50 °C, which is the normal temperature for residential heaters and a minimum requirement in concordance with the local norm for residential hot-water heaters [35].

3. Results

Data collection was executed and temperature comparisons were established on hourly day curves of maximum irradiance, minimum irradiance, and average irradiance. Additionally, a comparison between the global yield cases was performed.

3.1. Temperatures at the Outlets of the STCs

The curves in Figure 5a,b show the temperatures at the outlets of the four STCs and the irradiation levels throughout the day on the maximum irradiation day, the minimum irradiation day, and the average irradiation of all the days examined. The data in Figure 5a show that on a day with a high level of solar energy being irradiated (5195 wh/m2), FPC.n reached a temperature of 41.9 °C at the outlet of the collector, exceeding the maximum temperature observed in FPC.e (38.5 °C) by 3.4 °C; this difference is attributed to the high level of irradiation at midday and in the early afternoon, when a higher level of irradiation occurred at a more direct angle in the north-south orientation compared to the east-west orientation. During a day with minimum irradiation, a maximum outlet temperature of 25.4 °C was measured at FPC.e, which was only 0.5 °C lower than that measured at FPC.n (25.9 °C).
With regard to the ETC (Figure 5b), the ETC.w system showed an outlet temperature of 50.6 °C, which was significantly higher than that of the ETC.s collector, with a maximum temperature of 41.6 °C on the same day of high irradiation. In other words, with the orientation of the tubes arranged parallel to the solar path, the data revealed a temperature that was 9.0 °C higher, indicating a significant difference between the two systems with the same solar technology, thus supporting the initial hypothesis of the occurrence of irradiation blocking between tubes. On days with low irradiation as a consequence of cloud cover, the ETC.w system with the tubes parallel to the solar path also outperformed the other systems as expected, with a temperature of 30.9 °C compared to 27.3 °C for the ETC.s collector, an improvement of 3.6 °C and 4.7 °C, respectively, over both FPCs; this result also supports the initial hypothesis despite the lower direct irradiation, and the superior performance of ETC versus FPC is also demonstrated.
In the case of the FPCs, under average irradiation conditions, for both FPC.e and FPC.n, the maximum temperatures were similar, indicating that with this technology, the orientation is not a major factor (FPC.e = 30.2 °C vs. FPC.n = 30.1 °C). In contrast, in the ETCs, with respect to average temperature and irradiation, the data show that the maximum temperature was recorded for ETC.w, with an average maximum of 38.8 °C, compared to 33.2 °C for ETC.s, i.e., 5.6 °C higher on average in the measurement period. Comparing the performance between the ETC and FPC technologies revealed that the temperatures of the ETCs were, on average, 3.7% higher than those of the FPCs.
Comparing the average temperatures of the two technologies (total days and total average hours) revealed similar average outlet temperatures for the two FPC systems, with that of FPC.n being only 0.1 °C higher than that of FPC.e. However, in the case of the ETCs, the average temperatures were 1.7 °C higher in the west orientation than in the south orientation. Moreover, the maximum temperature at the outlet of the ETC collector was 5.6 °C higher for ETC.w than for ETC.s (Table 2).
Table 2 also shows an analysis of the temperature at the outlet of the STCs under average irradiance conditions on the days (scenarios) when the measurements were taken (3177 Wh/m2). At this point, the day with the lowest irradiated energy (1565 Wh/m2), a day of considerable cloud cover, and the day with the highest irradiated energy (5195 Wh/m2) were analyzed. In the three scenarios, the average temperatures at the collector outlet were measured, and the percentage difference in temperature at the collector was compared to that of another collector with the same technology in a different orientation. The temperatures of the FPCs revealed a reduced heating differential depending on the orientation; greater differences were observed for the ETCs, especially for the maximum irradiation scenario, with an 8.9 °C higher temperature in ETC.w than in ETC.s. At the end of Table 2, the difference in temperature between units using the same technology at the collectors’ outlets is expressed, detecting more differences when comparing ETC collectors than for the FPC collectors.

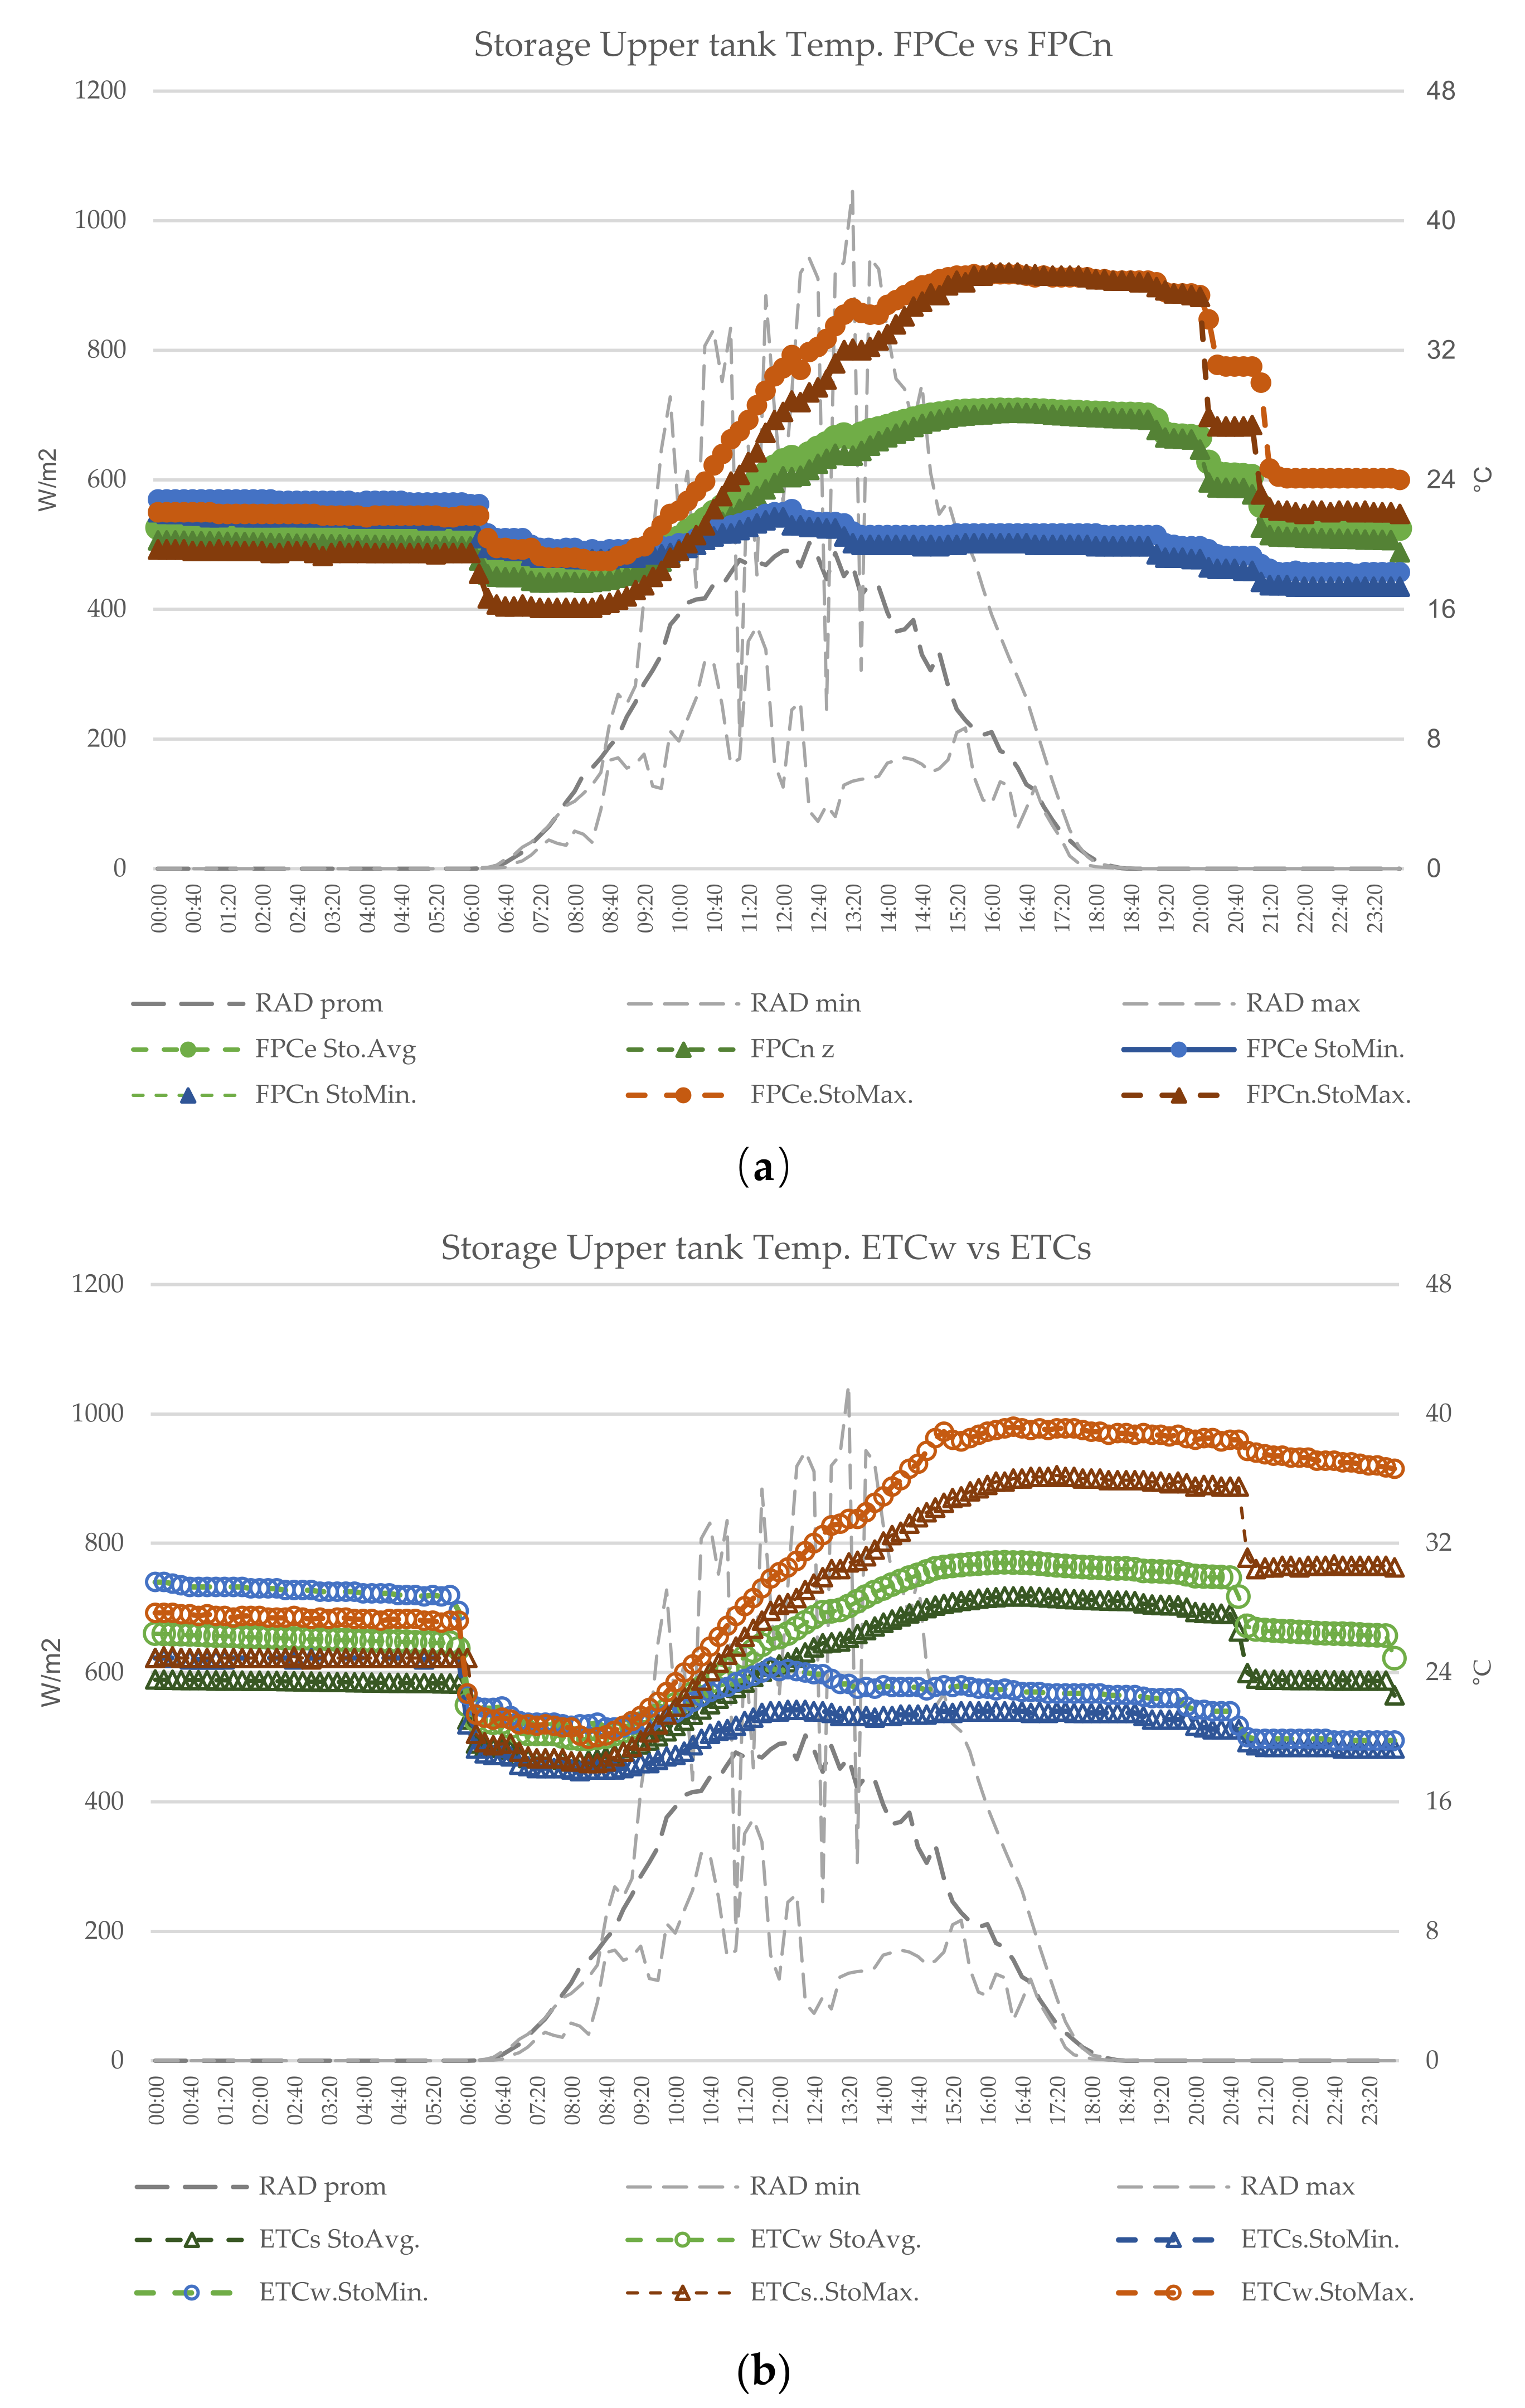
3.2. Temperatures at the Storage Outlets

While the temperature of STCs is the most important indicator of the performance and thermal capacity of the two technologies, and orientation is a useful parameter for the selection of both technologies for different uses, it is also important to analyze their influence on residential water systems. For this purpose, it is important to simulate systems configured for residential operation, with storage tanks. In this manner, the performance differential of the systems with respect to the required Domestic Hot Water (DHW) usage temperature and the contribution to a typical boiler with an outlet temperature of 50.0 °C can be measured.
When observing the FP at high or minimum levels of irradiation, the temperatures with the north and east orientations were similar. In addition, the temperature barely increased on a day of low irradiation, i.e., increasing by 2.5 °C compared with the temperature early in the morning, prior to any irradiation, which was taken as the base temperature, indicating a low capacity under very cloudy conditions. In contrast, on days with high irradiation, the temperature increased by more than 20.0 °C in both FPC systems. On average, the tank outlet temperature increased by approximately 10.5 °C every day, indicating the low efficiency of the FPCs under high cloud cover conditions, even in warm ambient temperatures. During hot water evacuation, a drop in storage temperature was observed, especially during times of heavy discharge (Figure 6a).
The situation is different for ETCs. On days of minimum irradiation, the temperature increased between 3.8 °C and 5.0 °C, with greater heating of the west-facing system, where there was no intershading between tubes. Under the high-irradiation scenario, the increase was between 19.3 °C and 17.8 °C, with ETC.w performing better than ETC.s; however, due to the starting temperature in the early morning, the ETC oriented to the west reached a 3.2 °C-higher temperature as a result of the higher heat of the previous day. On a day of average irradiance, the temperature of ETC.w was 2.1 °C higher than that of ETC.s (Figure 6b).
Finally, when comparing the storage temperatures in the upper outlet of the tank sensor of the two technologies (Table 3), temperatures very close to those of the two FPC systems were observed only with ETC.s; however, the temperatures of these three systems were exceeded by that of ETC.w, reaching a maximum of 3.0 °C on a day of high irradiation, 2.1 °C with average irradiation, and 2.6 °C on a day of minimal irradiation. Interestingly, and in contrast to previous results, the FPC.e system outperformed the FPC.n system by almost 2.0 °C under high-irradiation conditions. Although this differential is smaller on average and, under low irradiation conditions, this higher performance could correspond to the higher irradiation level expected in the morning hours in this region, as has been demonstrated by Izquierdo et al. [23]; thus, the FPC that was facing east has the best local performance. The temperature was always higher in the upper storage outlet of the ETC systems, with the average temperature of ETC.w exceeding that of ETC.s by between 2.1 °C and 3.0 °C in both average conditions and at the maximum temperature, demonstrating the higher performance when the tubes are not affected by shadowing from other tubes in ETC, i.e., when these are arranged parallel to the solar path (Table 3). At the end of Table 3, the differences in temperature between the same technology systems are expressed, detecting more differences when comparing ETC systems than in the FPC systems.

3.3. Supplementary Energy Requirement for Residential Use

Finally, we determined the missing energy requirement. Assuming that the temperature differential is fed by a typical wall boiler, according to the energy requirement for hot water, we considered 50.0 °C as the normal required temperature [36] at the outlet of the heating system [37]. For this calculation, we considered the number of discharges described in Table 1 in terms of quantity and the existing temperatures at the outlets of the tanks at those hours. The amount of energy required was obtained from the volume of hot water required and the temperature shortfall, as shown in Table 4. The data show that in terms of daily energy volume, when comparing extreme conditions, the worst-case scenario is one of minimum irradiation in the FPC.n system, where the energy shortfall is 7.0 kWh per day, a 67.5% greater shortfall than the 4.2 kWh shortfall in the best-case scenario in the ETC.w system. However, in the case of average irradiation magnitude, the ETC.w system has a 9.7% lower energy requirement than the ETC.s system. Furthermore, the systems powered by the ETC required, on average, 8.0% less backup power compared to the FPC installations, and the ETC.w required 18.5% less backup power than both FPCs, on average.

4. Discussion

As noted above, this study is unique in the sense that it is based on executing four complete solar system installations as a laboratory, which allows the performance of four complete solar thermal systems to be measured simultaneously under identical climatic conditions. Although the performance of these technologies according to irradiation availability has been extensively studied by different authors [38,39], those analyses have been performed in a simulation environment. Local studies have also previously been performed [25], but only with ETC technology. ETC is an important alternative in the studied region since it has a better performance in cold and cloudy climates, as is typical in Andean cities throughout the year, so it is important to define the performance of ETC and compare it to that of FPC.
The performance of ETCs is influenced by the self-shading effect between the evacuated tubes of the ETC. The data reveal that the orientation affected the performance, with an average ETC temperature that was 1.7 °C higher when the tubes were deployed parallel to the solar path than when they were deployed perpendicular to it, i.e., with shading being cast between the tubes. A comparative analysis of the performance of the two technologies indicated that the ETC on average achieved temperatures 9.9 °C higher than those of the FPC, confirming the better performance of ETC technology under high cloud cover conditions, as noted above, which are characteristic of this area of the Andes. In contrast, the average heating difference between the two FPC collectors was minimal (0.1 °C higher for FPC.n than for FPC.e), indicating that the orientation of the FPC was not decisive, at least at the reduced slopes representative of local pitched roofs. However, comparing the performance of complete ST systems fed by ETC.s revealed that for ETC.w, with the tubes parallel to the solar path, the average outlet temperature was 2.1 °C higher than that of ETC.s; however, on days of high irradiation (when there is more incidence of shade), this difference was 3.0 °C.
The temperature performance at the outlets of the storage tanks (upper band of the tanks that feed the DHW system), with respect to the temperature of the evacuation volume for DHW use, show that on average, there was a greater difference when comparing the two systems supplied by the FPC, with FPC.n requiring 0.7 °C more energy than FPC.e. The difference was more pronounced in the ETC, with an average temperature differential of up to 3.0 °C higher in the system supplied by ETC.w than in that supplied by ETC.s, confirming the better performance of ETC without self-shading between evacuated tubes when these are arranged parallel to the solar path in a complete residential system.
In accordance with simulated residential consumption, the thermal energy differential required to reach a consumption temperature of 50.0 °C was analyzed; the temperature can be adjusted with a backup heating system using wall-mounted boilers. Comparatively, a system powered by other ETCs demands 9.8% more thermal energy on average than the best-performing system (ETC.w). The FPC had a higher deficit and energy demand, with FPC.e and FPC.n requiring 16.5% and 20.6% more energy, respectively, compared to the best-performing system (ETC.w). With respect to the difference between the two FPCs, the FPC.n system required on average 0.7 °C more thermal energy than FPC.e due to the higher morning irradiation at the site, as previously established [23]. It is necessary to consider that the analysis of the FPC system takes into account the water outlet temperatures of the storage and the volume of hot water at the time of evacuation (preset hours of use), which differ from the whole-day average temperature. It is also necessary to consider the efficiency of on-demand heaters, which is approximately 70–80% for typical gas- or electric-powered units, for the estimation of the fuel or electricity requirements [23].

5. Conclusions

In this study, four residential DHW installations were simulated with STCs, starting from complete residential systems, considered in terms of consumption levels determined by programmed evacuations from the storage tanks. The installations were analyzed under the scenario of solar use, such that the collectors were inclined on a slope similar to that used locally for building roofs or for installations on flat slabs (15°). The collectors included two FPCs, one parallel with the solar path (FPC.e) and the other perpendicular to the solar path (FPC.n), and two ETCs, one parallel with the solar path, in this case in the afternoon (ETC.w), and the other perpendicular to the solar path (ETC.s).
As expected, considering the high level of cloudiness, the superior performance of the ETC collector was confirmed under this climate. However, some novel aspects were determined, such as the difference in ETC performance when the collectors were arranged in different orientations, a situation that has not been observed in FPC technology or even in PV technology. In terms of the heat output from FPCs, a temperature of less than 0.1 °C was observed in both collector outlets. However, in ETC systems, at the collector outlet, a 1.7 °C higher temperature was observed. When compared at the tank outlet, an average 2.1 °C higher temperature was observed when the tubes of the ETC were aligned parallel with the solar path. This implies a 9.8% higher energy demand on the backup energy system when the ETC collector is facing south than when it is facing west. FPC requires between 20.6% and 17.0% more backup energy than the ETC oriented to the west. These results are very useful as a way to show the implications when choosing solar technology alternatives and show that ETC is more efficient, especially when the collectors are facing parallel to the solar path, when these systems are located in regions close to the Equator.
This study also illustrates the need to analyze these technologies in context for each region of the planet. Thus, in seasonal climates, tube shading effects can also occur in the ETC but it will always be necessary to orient the collectors parallel with the path of the sun as a priority, so this effect must also be analyzed at other latitudes. Based on the proposed methodology, guidelines can be established to avoid losses due to the arrangement of collectors; moreover, climatic conditions such as cloudiness differ, so the technology output must be determined in each region.

Author Contributions

Conceptualization, E.Z.-L. and M.A.-F.; methodology, E.Z.-L., E.A.B.-E. and J.C.-S.; validation, E.A.B.-E. and J.C.-S.; formal analysis, E.Z.-L.; investigation, M.A.-F. and D.J.-Q.; resources, E.Z.-L. and M.A.-F.; writing—E.Z.-L. writing—review and editing, E.A.B.-E. and J.C.-S.; visualization, E.Z.-L.; project administration, E.Z.-L. and M.A.-F.; funding acquisition, E.Z.-L. All authors have read and agreed to the published version of the manuscript.

Funding

This work was developed with funding from the Research Department of the Universidad de Cuenca (VIUC) and the Energia Group of the Universidad Politécnica Salesiana. This work is part of the project “Calibration of the F-chart model for solar thermal collectors with parameterization and validation according to typical layouts for architectural integration in equatorial Andean climates”.

Institutional Review Board Statement

This research do not involve humans or animals.

Informed Consent Statement

Not applicable.

Conflicts of Interest

The authors declare no conflict of interest.

Abbreviations

βSlope angle
°CDegrees Celsius
cmCentimeters
CO2Carbon dioxide
DHWDomestic hot water
ETCEvacuated tube collector
ETC.wEvacuated tube collector facing west
ETC.sEvacuated tube collector facing south
FPCFlat plate collector
FPC.eFlat plate collector facing east
FPC.nFlat plate collector facing north
IEAInternational Energy Agency
kgKilograms
kWhKilowatt hours (energy)
LPGLiquified petroleum gas
LLiters
m2Square meters
maslMeters above sea level
PVPhotovoltaic
STCSolar-thermal collector
SO2Sulfur dioxide
Temp.AvgAverage temperature
USDUnited States dollars
Wh/m2Watt-hours per square meter (energy)

Appendix A

Figure A1. Level of insolation and shading of ETCs at different times of the day.
Sustainability 13 13870 g0a1

References

  1. Perez, R.; Perez, M. A Fundamental Look at Energy Reserves for the Planet. Int. Energy Agency SHC Program. Sol. Updat. 2009, 50, 4–6. Available online: http://www.iea-shc.org/data/sites/1/publications/2015-11-A-Fundamental-Look-at-Supply-Side-Energy-Reserves-for-the-Planet.pdf (accessed on 13 December 2021).
  2. Vázquez Espí, M. Una brevísima historia de la arquitectura solar. Por una Arquit. Urban. Contemp. 1999, pp. 1–31. Available online: http://habitat.aq.upm.es/boletin/n9/amvaz.html (accessed on 13 December 2021).
  3. Kalogirou, S. Solar thermal collectors and applications. Prog. Energy Combust. Sci. 2004, 30, 231–295. [Google Scholar] [CrossRef]
  4. Duffie, J.A. Solar technologies. Energy for Rural and Island Communities IV. In Proceedings of the 4th International Conference, Inverness, Scotland, 16–19 September 1985; pp. 275–280. [Google Scholar] [CrossRef]
  5. Ge, T.; Wang, R.; Xu, Z.; Pan, Q.; Du, S.; Chen, X.; Ma, T.; Wu, X.; Sun, X.; Chen, J. Solar heating and cooling: Present and future development. Renew. Energy 2018, 126, 1126–1140. [Google Scholar] [CrossRef]
  6. Lamnatou, C.; Cristofari, C.; Chemisana, D.; Canaletti, J. Building-integrated solar thermal systems based on vacuum-tube technology: Critical factors focusing on life-cycle environmental profile. Renew. Sustain. Energy Rev. 2016, 65, 1199–1215. [Google Scholar] [CrossRef] [Green Version]
  7. Valančius, R.; Jurelionis, A.; Jonynas, R.; Katinas, V.; Perednis, E. Analysis of Medium-Scale Solar Thermal Systems and Their Potential in Lithuania. Energies 2015, 8, 5725–5737. [Google Scholar] [CrossRef] [Green Version]
  8. Olczak, P.; Matuszewska, D.; Zabagło, J. The Comparison of Solar Energy Gaining Effectiveness between Flat Plate Collectors and Evacuated Tube Collectors with Heat Pipe: Case Study. Energies 2020, 13, 1829. [Google Scholar] [CrossRef] [Green Version]
  9. Benli, H. Potential application of solar water heaters for hot water production in Turkey. Renew. Sustain. Energy Rev. 2016, 54, 99–109. [Google Scholar] [CrossRef]
  10. Rosas-Flores, J.A.; Rosas-Flores, D.; Zayas, J.L.F. Potential energy saving in urban and rural households of Mexico by use of solar water heaters, using geographical information system. Renew. Sustain. Energy Rev. 2016, 53, 243–252. [Google Scholar] [CrossRef]
  11. Han, J.; Mol, A.; Lu, Y. Solar water heaters in China: A new day dawning. Energy Policy 2010, 38, 383–391. [Google Scholar] [CrossRef]
  12. Ayompe, L.; Duffy, A.; Mc Keever, M.; Conlon, M.; McCormack, S. Comparative field performance study of flat plate and heat pipe evacuated tube collectors (ETCs) for domestic water heating systems in a temperate climate. Energy 2011, 36, 3370–3378. [Google Scholar] [CrossRef] [Green Version]
  13. Chow, T.-T.; Dong, Z.; Chan, L.-S.; Fong, K.-F.; Bai, Y. Performance evaluation of evacuated tube solar domestic hot water systems in Hong Kong. Energy Build. 2011, 43, 3467–3474. [Google Scholar] [CrossRef]
  14. Adsten, M.; Perers, B.; Wäckelgård, E. The influence of climate and location on collector performance. Renew. Energy 2002, 25, 499–509. [Google Scholar] [CrossRef]
  15. Tanha, K.; Fung, A.S.; Kumar, R. Performance of two domestic solar water heaters with drain water heat recovery units: Simulation and experimental investigation. Appl. Therm. Eng. 2015, 90, 444–459. [Google Scholar] [CrossRef]
  16. Sokhansefat, T.; Kasaeian, A.; Rahmani, K.; Heidari, A.H.; Aghakhani, F.; Mahian, O. Thermoeconomic and environmental analysis of solar flat plate and evacuated tube collectors in cold climatic conditions. Renew. Energy 2018, 115, 501–508. [Google Scholar] [CrossRef]
  17. Norton, B. Anatomy of a solar collector: Developments in Materials, Components and Efficiency Improvements in Solar Thermal Collector Systems. Refocus 2006, 7, 32–35. [Google Scholar] [CrossRef]
  18. Munari, C. Architectural Integration and Design of Solar Thermal Systems; École Polytechnique Fédérale de Lausanne: Lausanne, Suisse, 2009. [Google Scholar]
  19. IEA SHC Task 41. SOLAR ENERGY SYSTEMS IN ARCHITECTURE integration criteria and guidelines. 2012. Available online: http://leso2.epfl.ch/solar/pdf/SolThePh.pdf (accessed on 13 December 2021).
  20. Zalamea, E.; Barrgán-Escandón, A. Revisión conjunta de fuentes primordiales para autoabastecimiento energético urbano e incidencia solar como principal fuente, en contexto de ciudad ecuatorial-andina. ACI Av. Cienc. Ing. 2020, 12, 21. [Google Scholar] [CrossRef]
  21. Nieto, L.F.M.; Mora-López, L. A new model to predict the energy generated by a photovoltaic system connected to the grid in low latitude countries. Sol. Energy 2014, 107, 423–442. [Google Scholar] [CrossRef]
  22. Fitriaty, P.; Shen, Z. Predicting energy generation from residential building attached Photovoltaic Cells in a tropical area using 3D modeling analysis. J. Clean. Prod. 2018, 195, 1422–1436. [Google Scholar] [CrossRef]
  23. Izquierdo-Torres, I.F.; Pacheco-Portilla, M.G.; Gonzalez-Morales, L.G.; Zalamea-León, E.F. Simulación fotovoltaica considerando parámetros de integración en edificaciones. Ingenius 2018, 21, 21–31. [Google Scholar] [CrossRef] [Green Version]
  24. Luque, A.; Hegedus, S. Handbook of Photovoltaic Science and Engineering Handbook of Photovoltaic Science and Engineering, II; John Wiley & Sons: West Sussex, UK, 2011. [Google Scholar]
  25. Recalde, C.; Cisneros, C.; Avila, C.; Logroño, W.; Recalde, M. Single Phase Natural Circulation Flow through Solar Evacuated Tubes Collectors on the Equatorial Zone. Energy Procedia 2015, 75, 467–472. [Google Scholar] [CrossRef] [Green Version]
  26. Beckman, W.A.; Klein, S.A.; Duffie, J.A. Solar heating design, by the f-chart method. NASA STI/Recon Tech. Rep. A 1977, 78, 31071. [Google Scholar]
  27. Hudon, K. Chapter 20- Solar Energy- Water Heating. In Future Energy, 2nd ed.; Elsevier Inc.: London, UK, 2014; pp. 351–433. [Google Scholar]
  28. Sarbu, I.; Sebarchievici, C. Solar Collectors. In Solar Heating and Cooling Systems Fundamentals, Experiments and Applications; Elsevier: Amsterdam, The Netherlands, 2017; pp. 29–97. [Google Scholar]
  29. APS Products, “Separated Pressure Solar Water Heater”. 2020. Available online: http://www.aps-china.net/aps/ArticleShow1.asp?ArticleID=4697 (accessed on 13 December 2021).
  30. Graphisoft@. Archicad 24. 2021. Available online: https://www.graphisoft.es/archicad/ (accessed on 21 February 2021).
  31. MEGA, “Mega TimerTMControl Units”. 2021. Available online: https://www.megaendustri.com.tr/En/ProductsMegatimer (accessed on 12 December 2021).
  32. Autonic, “Autonic Serie TM”. 2021. Available online: https://www.autonics.com/series/3000413 (accessed on 13 December 2021).
  33. Sigüencia, J.C.; Gómez, O.T. Obtención de ACS con energía solar en el cantón Cuenca y análisis de la contaminación ambiental. Ingenius 2018, 89–101. [Google Scholar] [CrossRef]
  34. Delta-T Devices, “WS-GP2 Advanced Automatic Weather Station System”. 2019. Available online: https://www.delta-t.co.uk/product/ws-gp2/ (accessed on 4 March 2019).
  35. Ministerio de Sanidad Consumo y Bienestar Social. Sistemas de Agua Caliente Sanitaria; Ministerio de Sanidad Consumo y Bienestar Social: Madrid, España, 2003; pp. 1–25. [Google Scholar]
  36. Ministerio de Desarrollo Urbano y Vivienda. NEC-HS-ER, Sistemas Solares Térmicos Para Agua Caliente Sanitaria (ACS)–Aplicaciones Menores A 100 °C; Ministerio de Desarrollo Urbano y Vivienda: Quito, Ecuador, 2020. [Google Scholar]
  37. Ferroli Inc. Que Temperatura debe Tener el agua Caliente Sanitaria? 2017. Available online: https://blog.ferroli.es/que-temperatura-debe-tener-el-agua-caliente-sanitaria/ (accessed on 9 March 2021).
  38. Moldovan, M.; Visa, I.; Burduhos, B. Experimental Comparison of Flat Plate and Evacuated Tube Solar Thermal Collectors for Domestic Hot Water Preparation in Education Facilities. J. Sustain. Dev. Energy Water Environ. Syst. 2020, 8, 293–303. [Google Scholar] [CrossRef]
  39. Shah, L.; Furbo, S. Vertical evacuated tubular-collectors utilizing solar radiation from all directions. Appl. Energy 2004, 78, 371–395. [Google Scholar] [CrossRef]
Figure 1. Efficiency curve of STCs based on climatic conditions [17].
Sustainability 13 13870 g001
Figure 2. Schematic diagram of the installation of the STCs and storage.
Sustainability 13 13870 g002
Figure 3. Photographs of the installation of one of the STCs and a storage tank taken from the south.
Sustainability 13 13870 g003
Figure 4. Diagrams showing solar incidence on the vacuum tubes and irradiance blocking at 8 a.m. and at 1 p.m. The photograph shows the solar incidence on the equinox at 8 a.m. in south-facing ETCs.
Sustainability 13 13870 g004
Figure 5. (a,b) Hourly temperature difference for the FPCs and ETCs outlets, according to orientation and different radiations scenarios.
Sustainability 13 13870 g005
Figure 6. (a) FPC systems storage tank temperature difference. (b) ETC systems storage tank temperature difference.
Sustainability 13 13870 g006
Table 1. Volume of water discharge as a simulation of residential use.
Timetable/STCETC.wETC.sFPC.nFPC.eVolume of Hot Water Evacuated (L)
Morning 1 Shower06:0006:0506:1006:1552
Morning 2 Hand wash basins06:5507:0007:0507:1020
Morning 3 Dishwasher07:5007:5508:0008:058
Afternoon 1 Kitchen12:0012:1512:3012:4516
Afternoon 2 Dishwasher13:1513:3013:4514:0016
Night 1 Kitchen19:0019:0519:1019:1516
Night 2 Dishwasher19:5520:0020:0520:1020
Night 3 Shower20:5020:5521:0021:0552
Table 2. Comparative average (Avg.) and maximum (Max.) temperatures at the solar collector outlets.
Average Daily Irradiation Collector Water Outlet Temperature. Maximum and Average Temperature Comparative Analysis (°C) for 3177 Wh/m2 Daily Solar Energy ScenarioLow-Irradiation Day Collector Water Outlet Temperature. Maximum and Average Temperature Comparative Analysis (°C) for 1565 Wh/m2 Solar Energy ScenarioHigh-Irradiation Day Collector Water Outlet Temperature. Maximum and Average Temperature Comparative Analysis (°C) for 5195 Wh/m2 Daily Solar Energy Scenario
Average Temperature Detected(°C)Average Temperature Detected (°C)Average Temperature Detected (°C)
FPC.eFPC.nETC.sETC.wFPC.e.FPC.n.ETC.s.ETC.wFPC.eFPC.nETC.sETC.w
18.818.921.723.416.916.919.320.221.323.824.827.2
Temperature difference against the same technology outlet collector (°C)Temperature difference against the same technology outlet collector (°C)Temperature difference against the same technology outlet collector (°C)
−0.10.1−1.71.70.00.0−1.01.0−2.52.5−2.42.4
Maximum Temperature Detected (°C)Maximum Temperature Detected (°C)Maximum Temperature Detected (°C)
FPC.eFPC.nETC.sETC.wFPC.eFPC.nETC.sETC.wFPC.eFPC.nETC.sETC.w
30.230.133.238.825.425.827.631.441.140.941.750.6
Temperature difference against the same technology outlet collector (°C)Temperature difference against the same technology outlet collector (°C)Temperature difference against the same technology outlet collector (°C)
0.1−0.1−5.65.6−0.40.4−3.73.70.2−0.2−8.98.9
Table 3. Comparative average (Avg.) and maximum (Max.) temperatures at the storage tank outlets.
Average Irradiation Day Outlet Storage Temperature and Comparative analysis (°C) for 3177 Wh/m2 Daily Solar Energy ScenarioLow-Irradiation Day Outlet Storage Temperature and Comparative Analysis (°C) for 1565 Wh/m2 Daily Solar Energy ScenarioHigh-Irradiation Day Outlet Storage Temperature and Comparative Analysis (°C) for 5195 Wh/m2 Daily Solar Energy Scenario
Average Temperature (°C)Average Temperature (°C)Average Temperature (°C)
FPC.eFPC.nETC.sETC.wFPC.eFPC.nETC.sETC.wFPC.eFPC.nETC.sETC.w
23.122.424.226.420.820.121.423.827.225.228.231.1
Temperature difference against the same technology outlet storage(°C)Temperature difference against the same technology outlet storage (°C)Temperature difference against the same technology outlet storage (°C)
0.7−0.7−2.12.10.8−0.8−2.32.32.0−2.0−3.03.0
Maximum Temperature Detected (°C)Maximum Temperature Detected (°C)Maximum Temperature Detected (°C)
FPC.eFPC.n.ETC.sETC.wFPC.eFPC.nETC.sETC.wFPC.e.FPC.nETC.sETC.w Max
28.328.128.730.822.221.721.724.336.736.836.239.2
Temperature difference against the same technology outlet storage(°C)Temperature difference against the same technology outlet storage (°C)Temperature difference against the same technology outlet storage (°C)
0.2−0.2−2.12.10.5−0.5−2.62.6−0.10.1−3.03.0
Table 4. Daily energy shortfall for residential water heating in the four systems, considering a residential water use of 200 L of DHW per household.
Total Energy Shortfall (kWh/day)
STCIrradiation Conditions% Comparative avg. Energy Requirement vs. Minimum avg. Requirement
Irrad.Min (1565 Wh/m2)Irrad.Max (5195 Wh/m2)Irrad.Avg. 3177 (Wh/m2)
FPC.e6.85.16.2116.5%
FPC.n7.05.66.5120.6%
ETC.s6.64.75.9109.8%
ETC.w (base)6.14.25.4100.0%
Publisher’s Note: MDPI stays neutral with regard to jurisdictional claims in published maps and institutional affiliations.

