Research on Coupling Coordination and the Development of Green Shipping and Economic Growth in China
Abstract
:1. Introduction
2. Literature Review
2.1. Ships Reduce Emissions and Consumption
2.2. Green Port Management
2.3. Green Shipping Policy Regulation
2.4. Coupling Coordination between Other Fields and the Economy
2.5. Review of Research Status
3. Methods
3.1. Entropy Weighting
3.2. Comprehensive Development Index Model
3.3. Coupling Coordination Model of the Comprehensive System
3.4. Relative Development Degree Model
4. Construction of a Green Shipping and Economic Growth Index System
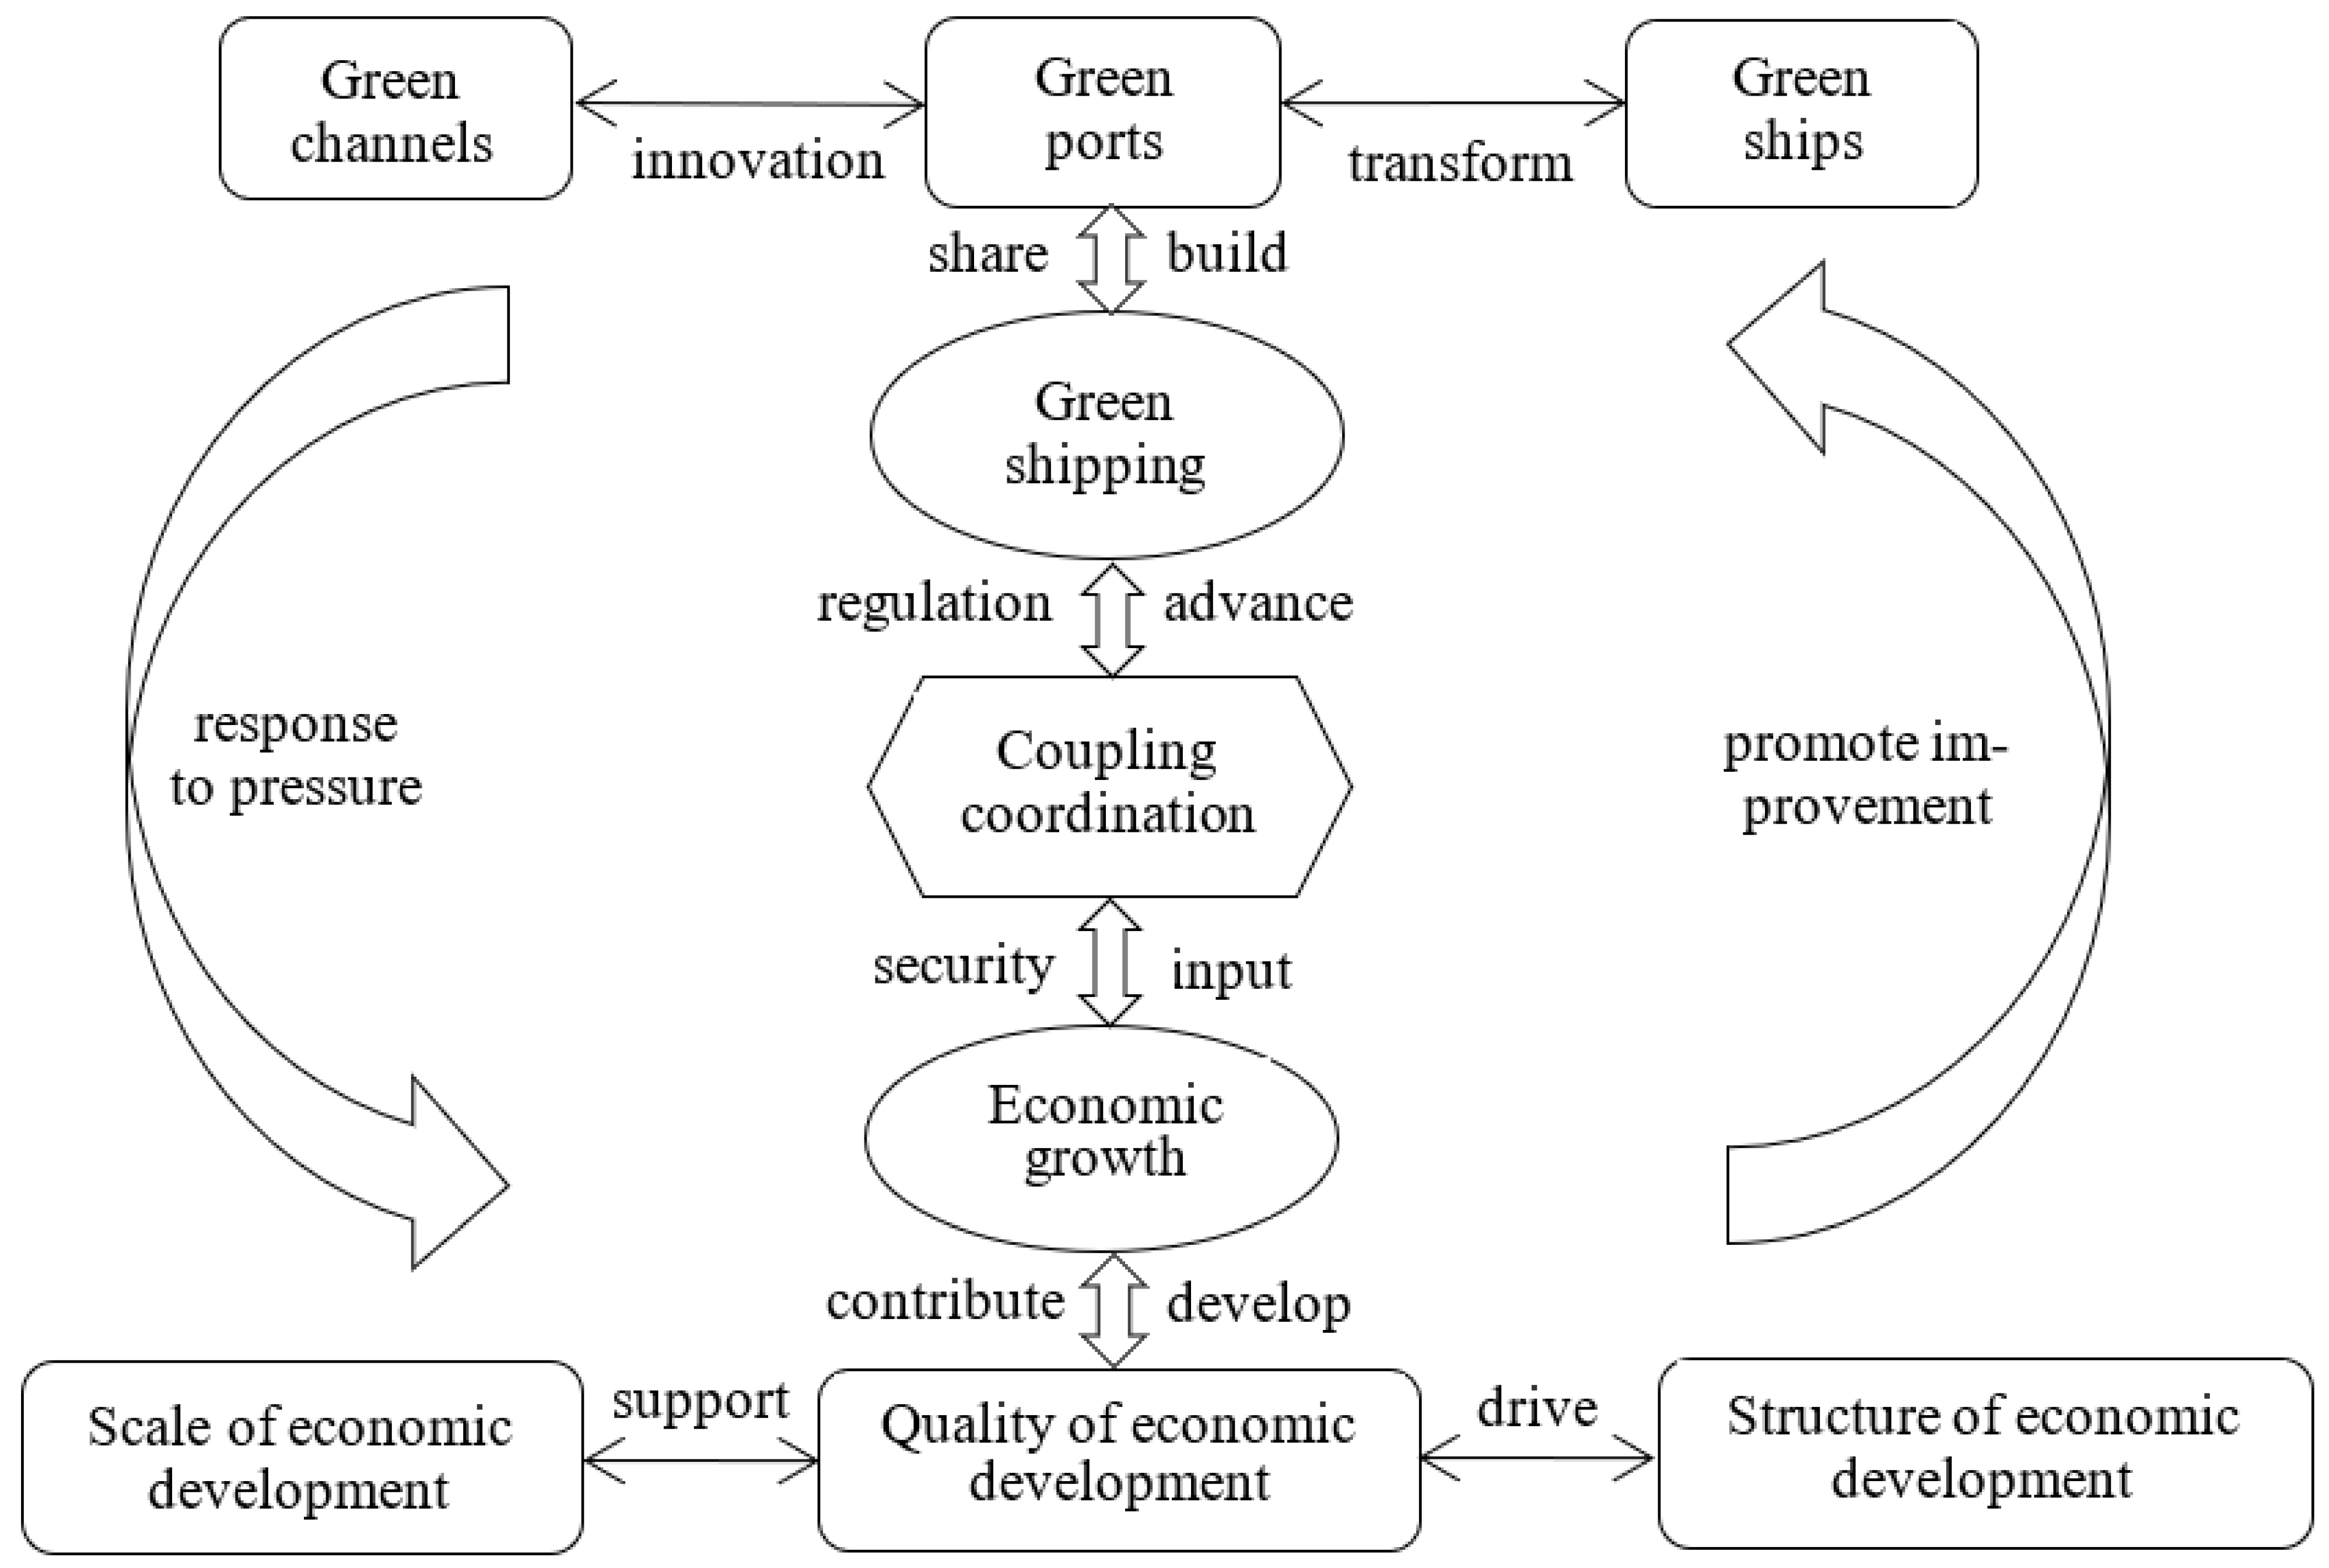
4.1. Mechanism for Coupling Coordination between Green Shipping and the Economic Growth Subsystem
4.2. Index System of Green Shipping and Economic Growth
- (1)
- Index system of green shippingSince green shipping covers energy conservation and emissions reduction, environmental governance, ecological protection, guarantee measures and input, this paper chooses the following indexes for quantification based on the application of other indicators in relevant literature:
- (A)
- Green channelsa. Grade channel mileage [40]: advanced navigation mileage of the channel.b. Proportion of grade channel mileage: the proportion of advanced channel mileage in total channel mileage.c. Wastewater discharge per unit output value (reverse index) [39,43]: total wastewater discharge/GDP. The lower the index value is, the better the channel’s protection is.d. Chemical oxygen demand per unit output value (reverse index) [44]: total chemical oxygen demand/GDP. The lower the index value is, the better the channel’s ecological environment is.
- (B)
- Green portsf. Number of berths in newly built and reconstructed (expanded) wharves [41]: to alleviate the lack of port capacity or to solve the need for small berths.g. New carrying capacity: the port’s annual increase in freight carrying capacity.h. The proportion of 10,000 DWT berths in production berths [41]: the number of 10,000 DWT berths/the number of production berths. The higher the index is, the stronger the port carrying capacity is, and the higher the current quality is.i. Port cargo turnover [42]: the cargo transportation volume in the composite unit of weight and distance.j. Employment in water transport (reverse index) [42,43,44]: a lower index is better, as it indicates the use of green port automation.k. Investment in water transport construction [44]: the government’s investment in the construction of fixed assets for water transport.
- (C)
- Green Shipsl. Average net carrying capacity: net carrying capacity/total number of ships.m. Average ship power [40]: total ship power/total number of ships.n. Energy consumption of ocean and coastal freight enterprises (reverse index): standard coal consumed by shipping enterprises per thousand tons of nautical miles.
- (2)
- Index system of economic growthSince economic growth covers investment, labor and productivity, we should not only consider the increase in economic aggregate, but also the improvement and optimization of the economic structure and economic quality. Therefore, on the basis of previous studies, this paper selects the following 10 indexes for analysis:
- (A)
- Scale of economic developmentb. Per capita actual utilization of foreign capital [41]: actual utilization of foreign capital/total population.c. Per capita fiscal revenue [39]: fiscal revenue/total population.d. GDP growth rate [44]: %.
- (B)
- Quality of economic development.e. Per capita investment in fixed assets [42,43]: total investment in fixed assets/total population.f. Total retail sales of social consumer goods per capita [41]: total retail sales of social consumer goods/total population.
- (C)
- Structure of economic developmenth. The proportion of primary industry (reverse index): added value of primary industry/GDP. According to the current development of China’s primary, secondary and tertiary industries, the index is set as a reverse index.
5. Analysis Results
5.1. Weight Calculation
5.2. Comprehensive Development Index Analysis
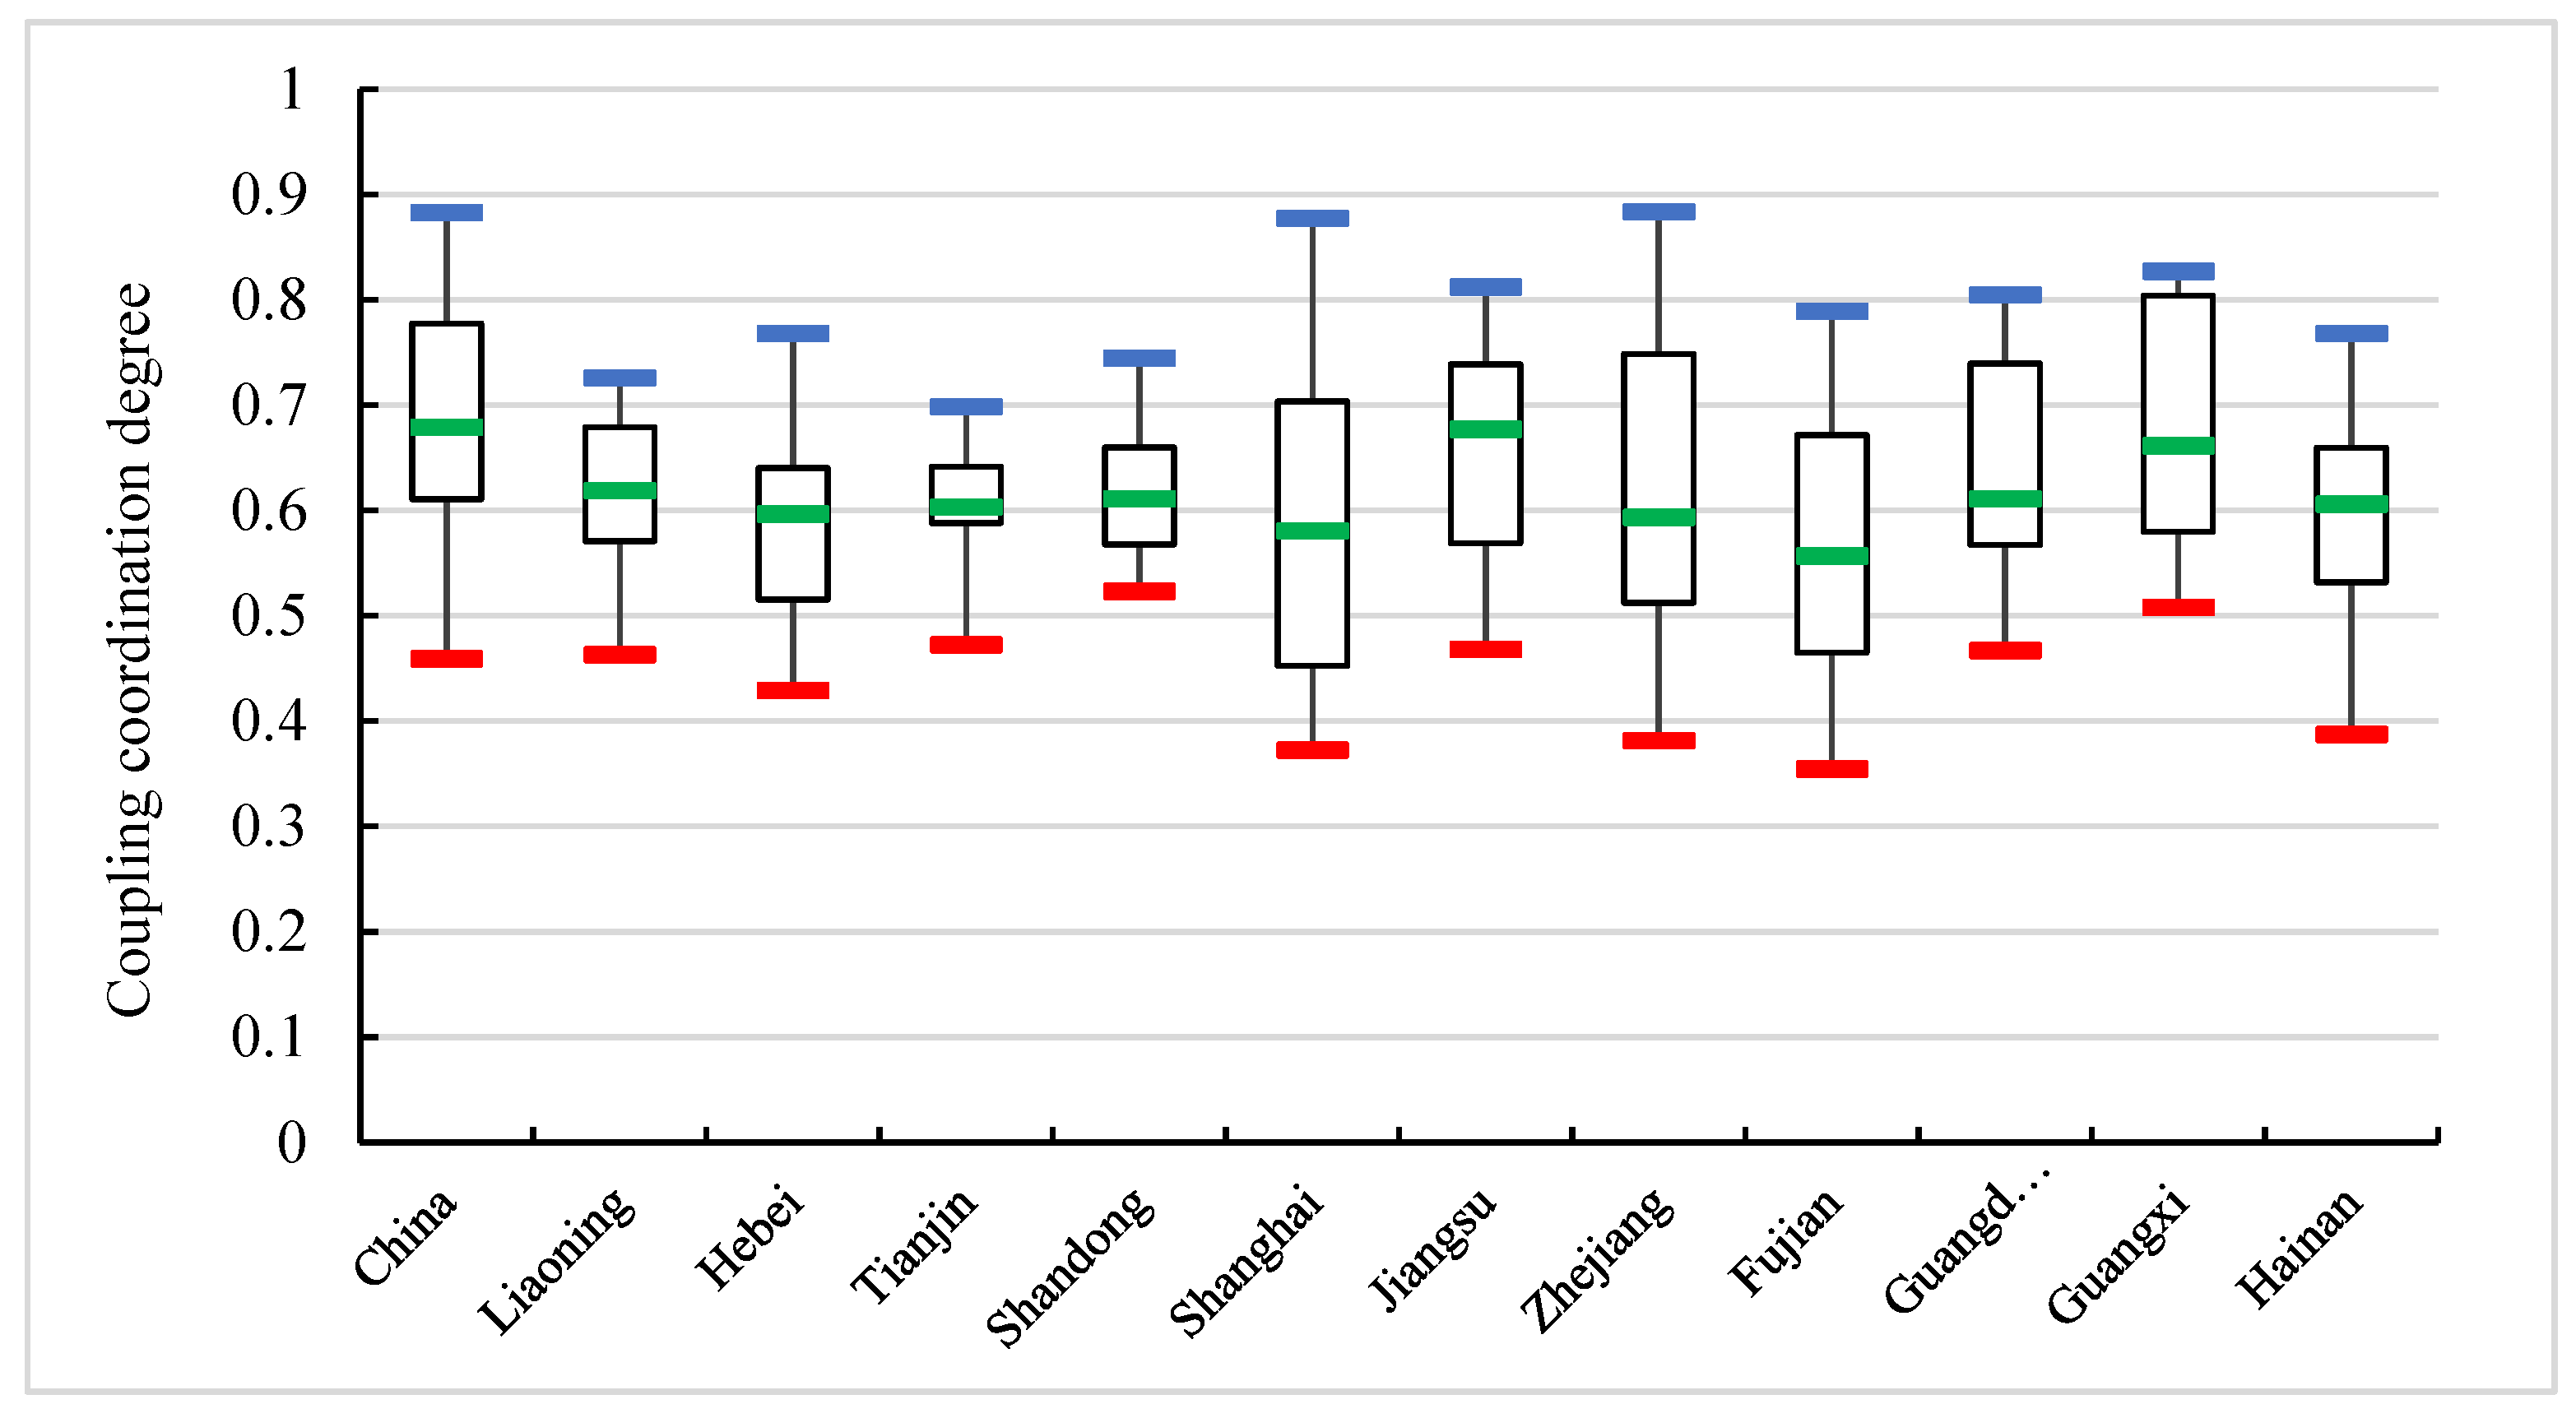
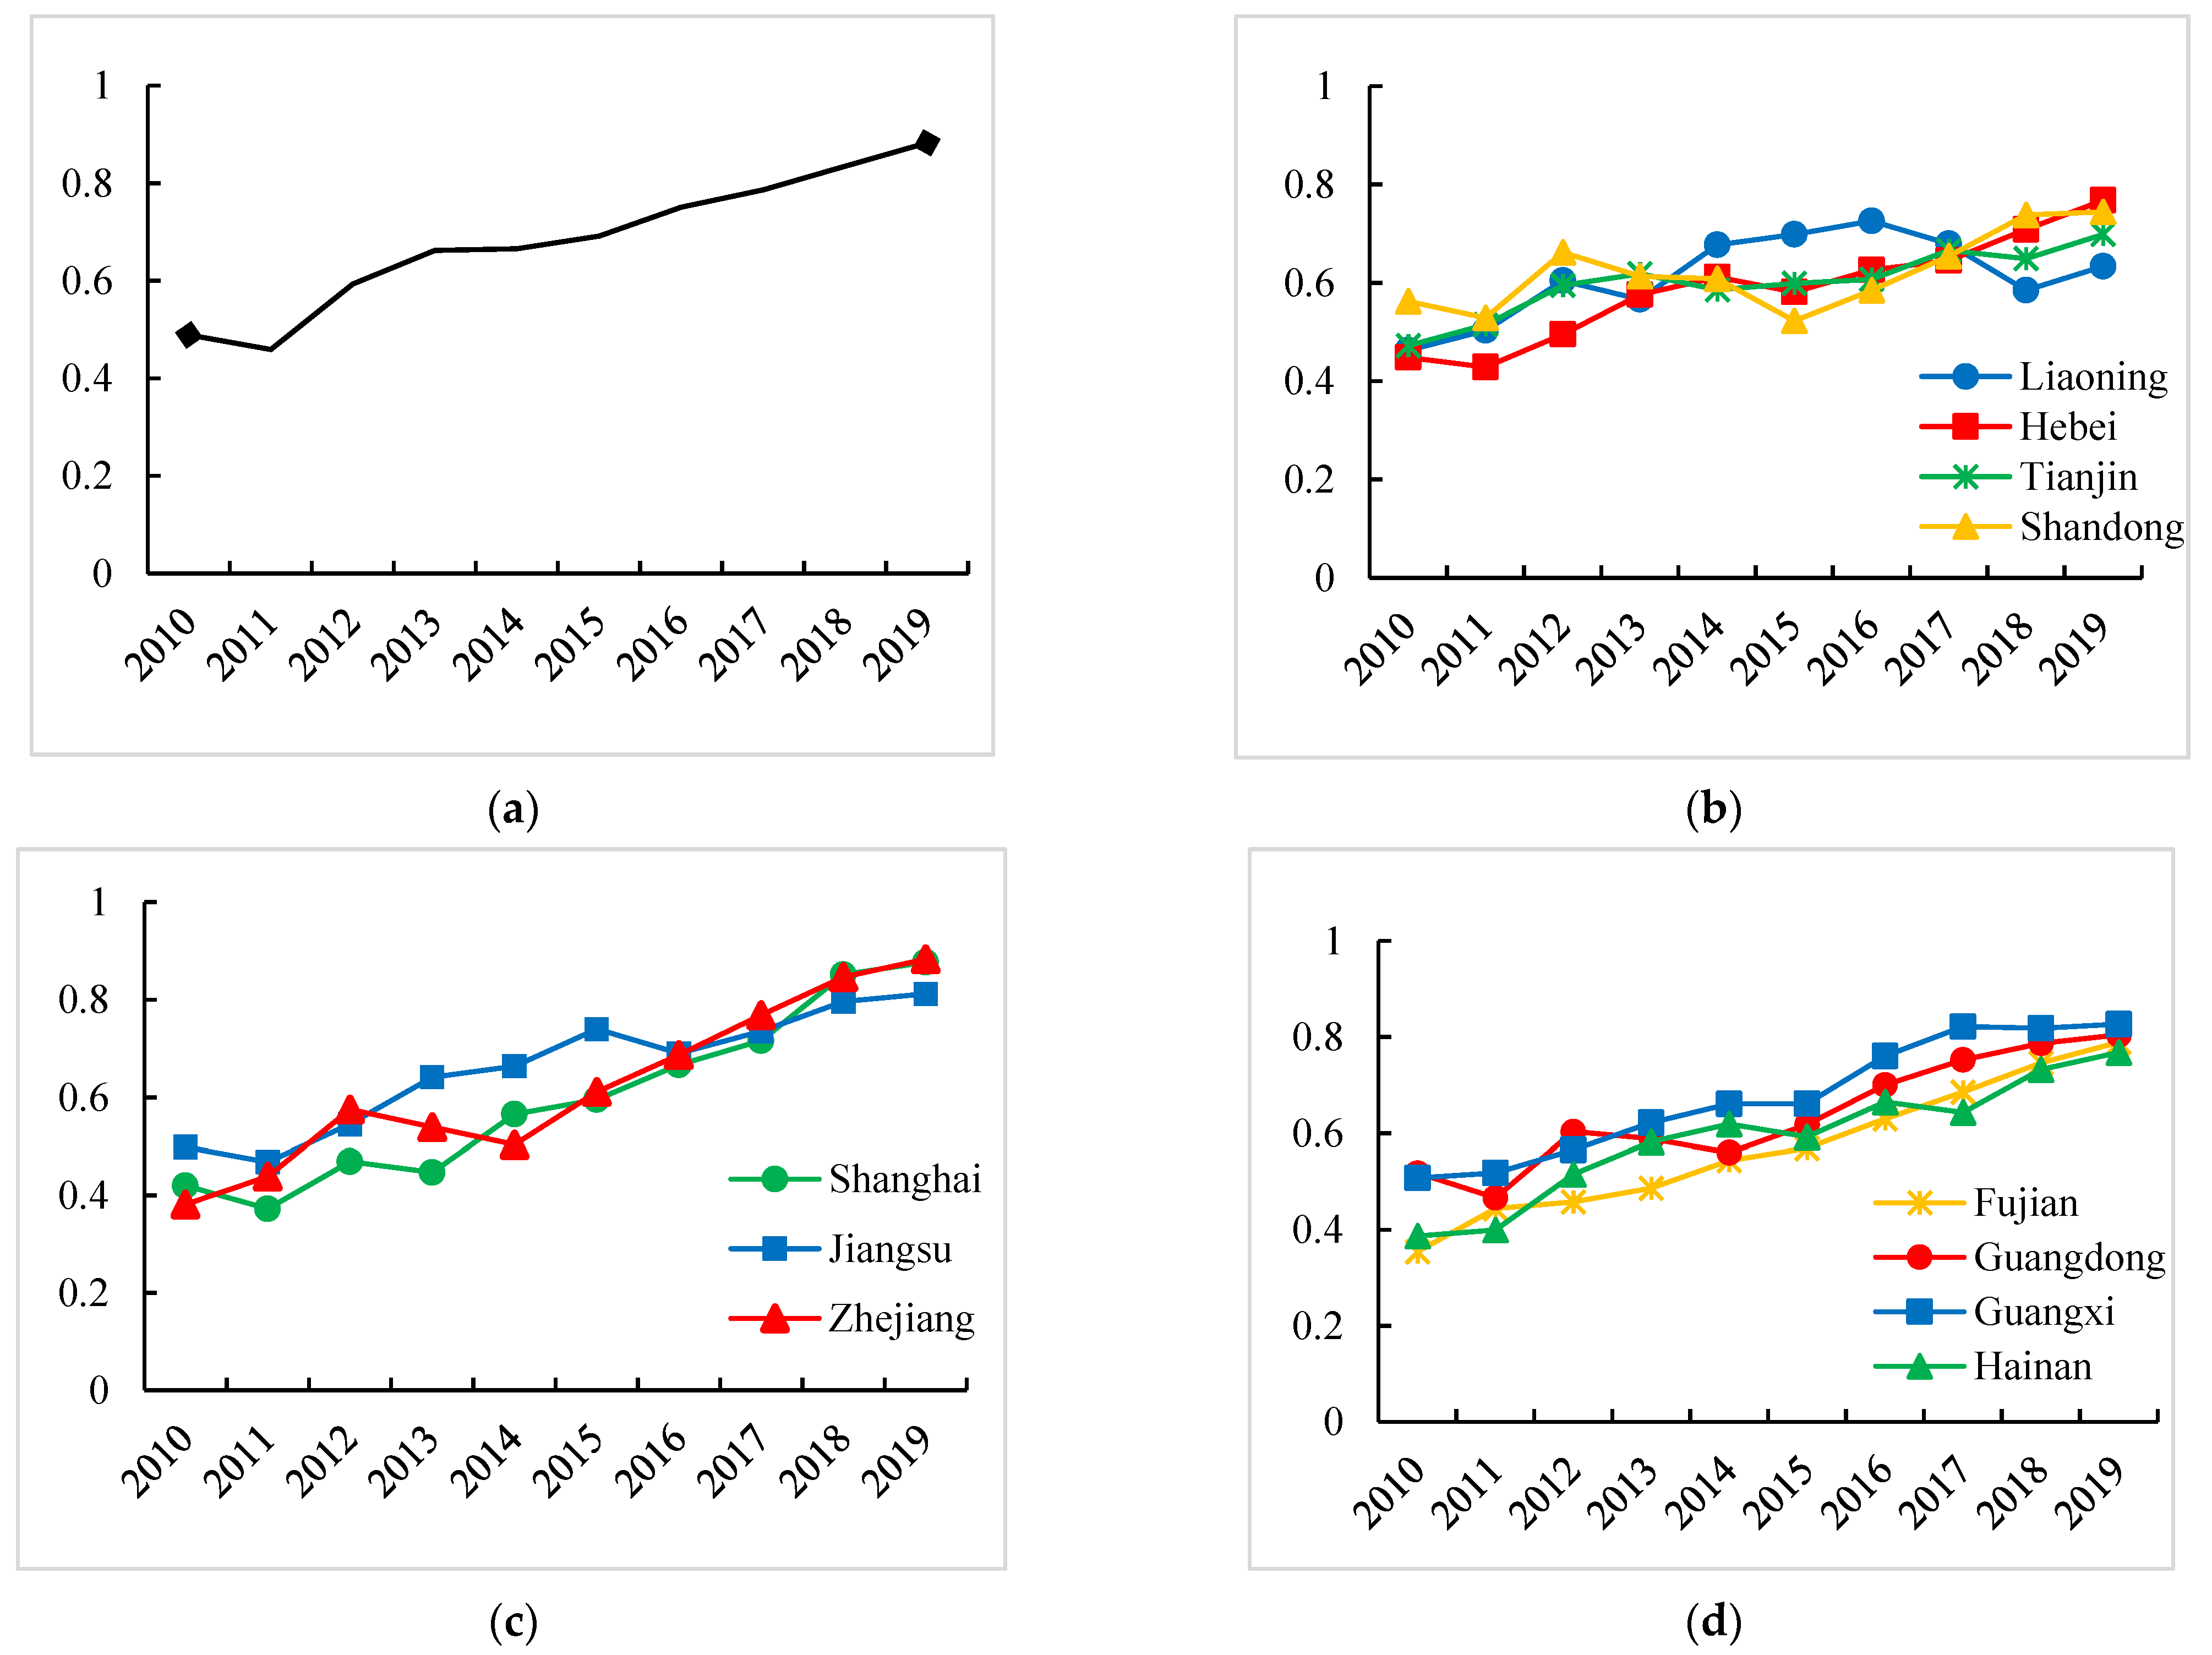
5.3. Analysis of Coupling Coordination
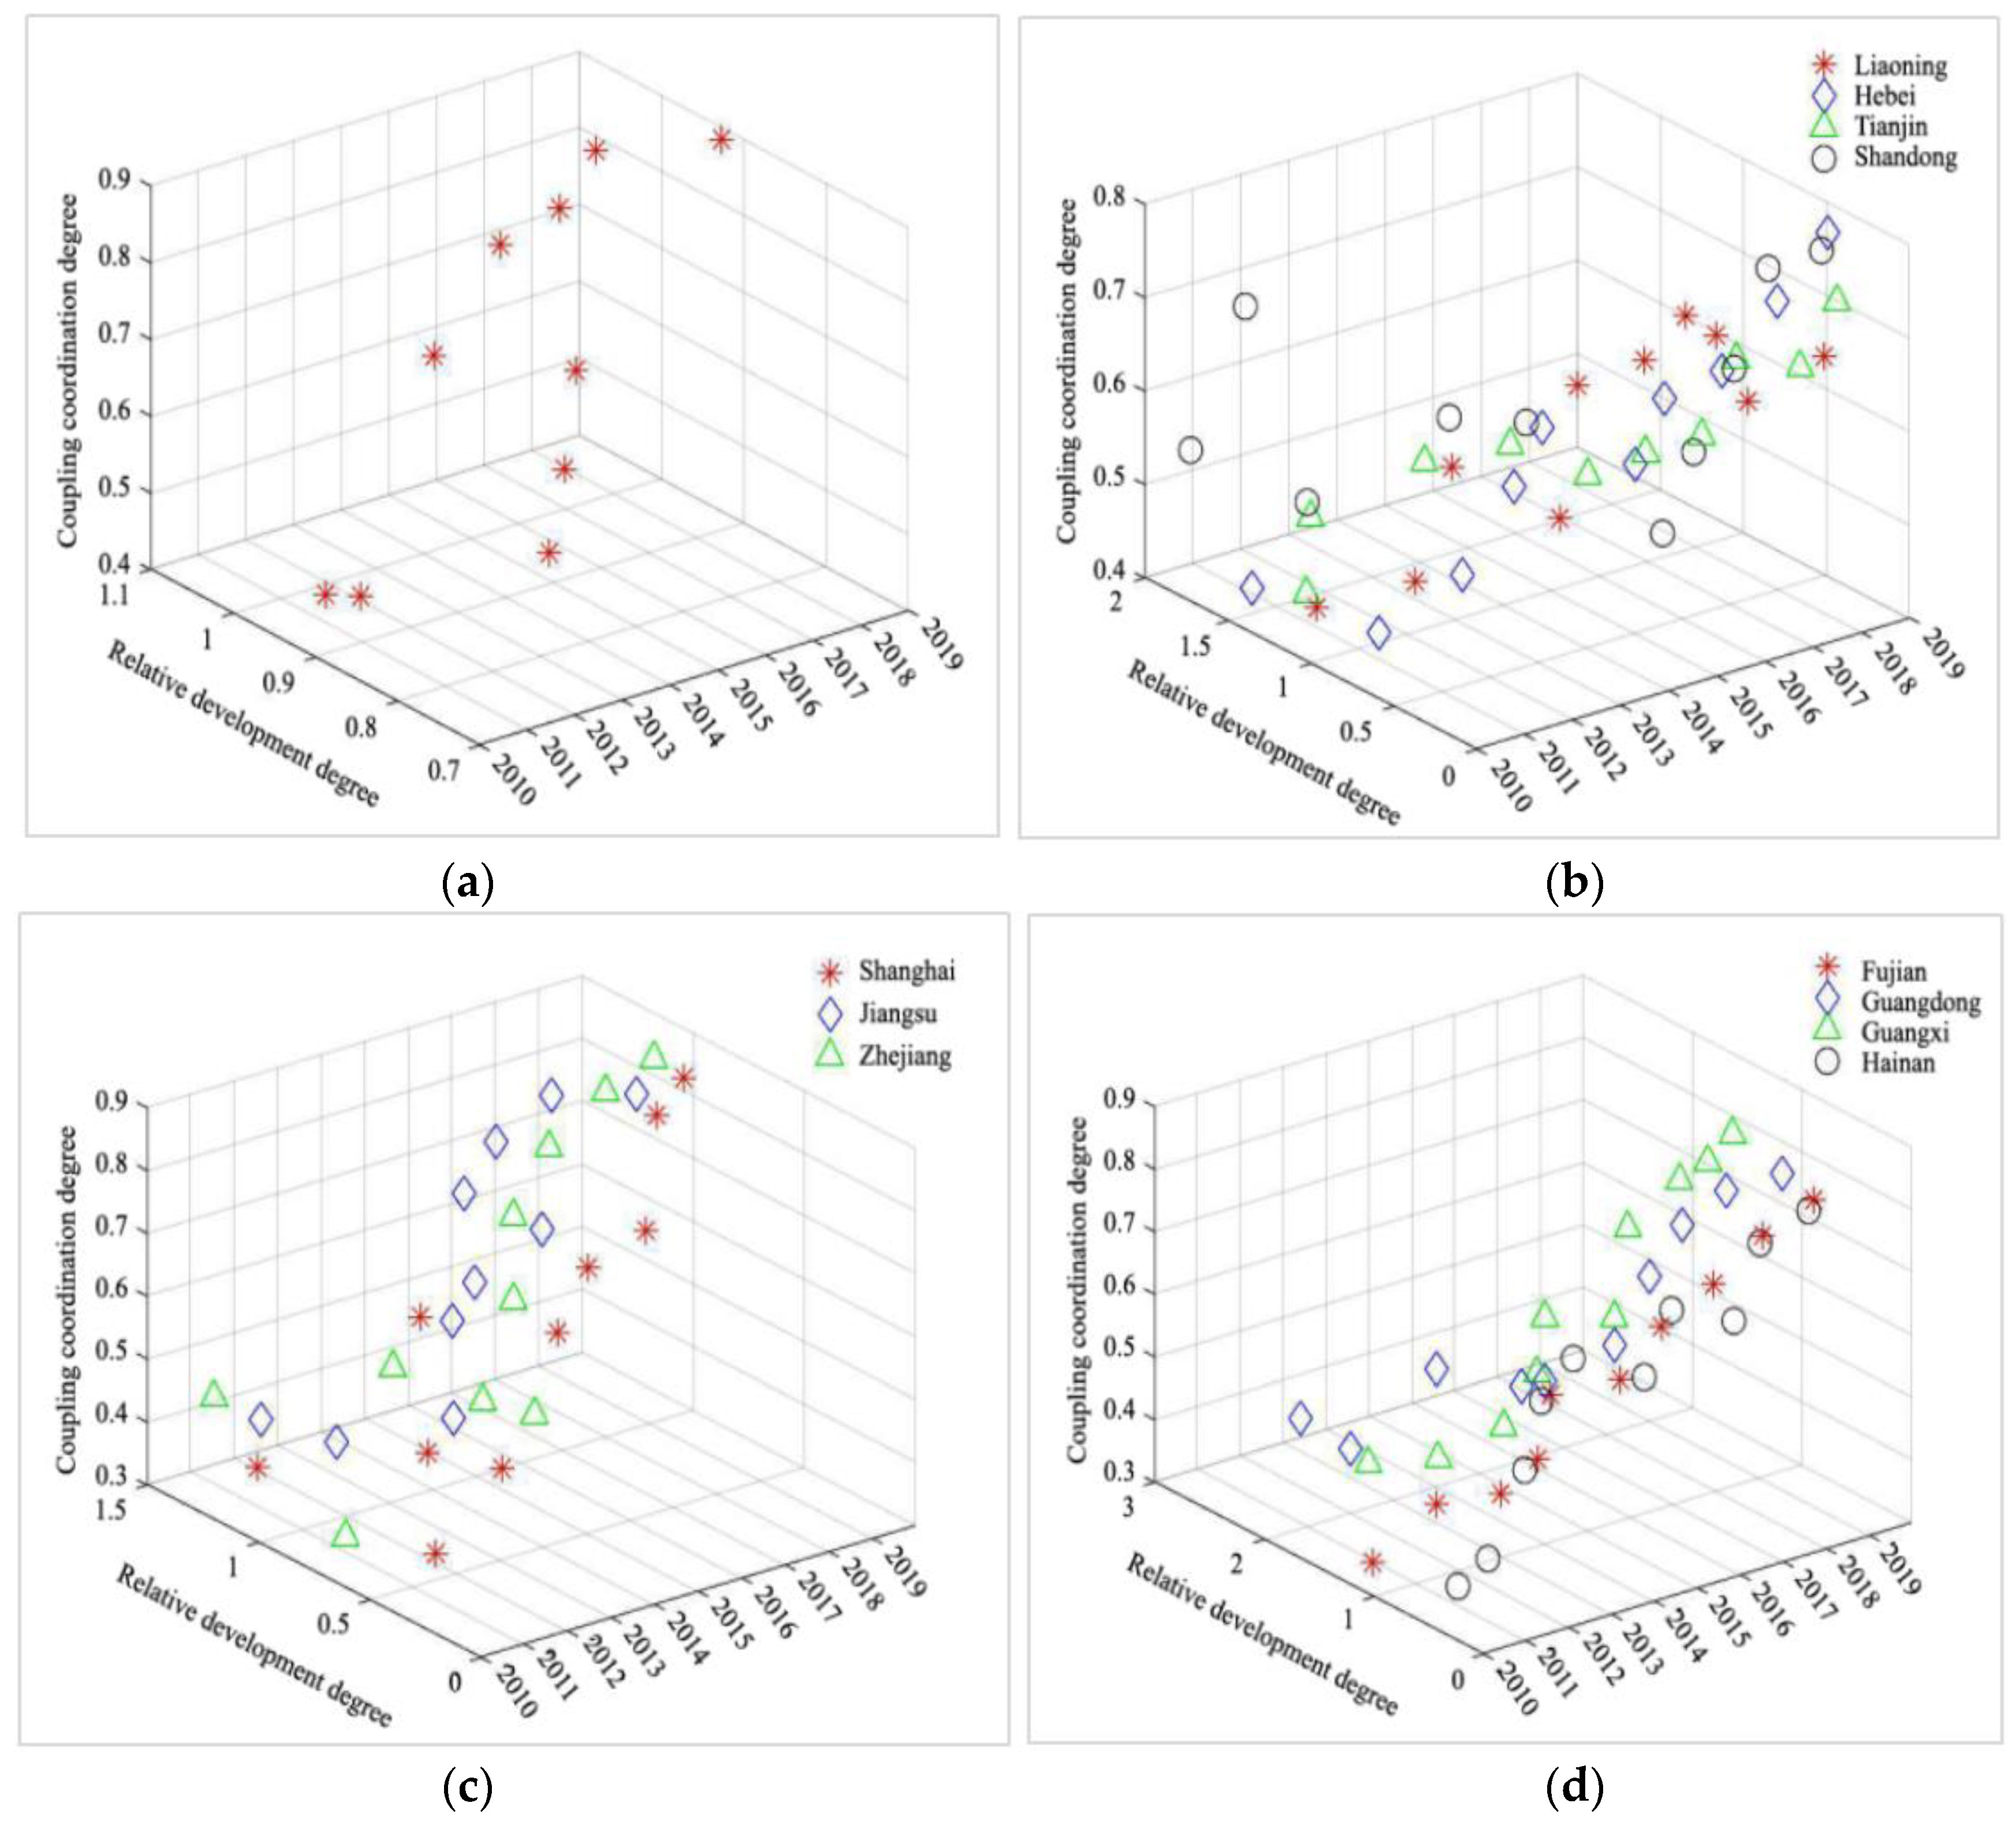
5.4. Analysis of Relative Development
6. Conclusions and Discussion
6.1. Conclusions
6.2. Suggestions
6.3. Discussion
Author Contributions
Funding
Institutional Review Board Statement
Informed Consent Statement
Data Availability Statement
Acknowledgments
Conflicts of Interest
References
- Lun, Y.H.V.; Lai, K.H.; Daniel, N.C.T.; Wong, C.W.Y.; Cheng, T.C.E. Editorial:researh in shipping and transport logistics. Int. J. Shipp. Transp. Logist. 2011, 3, 1–5. [Google Scholar]
- Bao, T.T.; Lian, F.; Yang, Z.Z. Research review of shipping management. J. Traffic Transp. Eng. 2020, 20, 55–69. [Google Scholar]
- Zhen, L.; Zhuge, D.; Wang, X.F. Researches on green ports and shipping management: An overview. Syst. Eng. Theory Pract. 2020, 40, 2037–2050. [Google Scholar]
- Wang, S.; Meng, Q. Sailing speed optimization for container ships in a liner shipping network. Transp. Res. Part E Logist. Transp. Rev. 2012, 48, 701–714. [Google Scholar] [CrossRef]
- Dedes, E.K.; Hudson, D.A.; Stephen, R.T. Assessing the potential of hybrid energy technology to reduce exhaust emissions from global shipping. Energy Policy 2012, 40, 204–218. [Google Scholar] [CrossRef]
- Qi, X.T.; Song, D.P. Minimizing fuel emissions by optimizing vessel schedules in liner shipping with uncertain port times. Transp. Res. Part E Logist. Transp. Rev. 2012, 48, 863–880. [Google Scholar] [CrossRef]
- Elizabeth, H.L.; Carl, F.R.; Gunnar, S.E. Sulphur abatement globally in maritime shipping. Transp. Res. Part D Transp. Environ. 2017, 57, 303–313. [Google Scholar]
- Abadie, L.M.; Nestor, G.; Ibon, G. Adapting the shipping sector to stricter emissions regulations: Fuel switching or installing a scrubber? Transp. Res. Part D Transp. Environ. 2017, 57, 237–250. [Google Scholar] [CrossRef]
- Santos, T.A.; Soares, C.G. Methodology for ro-ro ship and fleet sizing with application to short sea shipping. Marit. Policy Manag. 2017, 44, 859–881. [Google Scholar] [CrossRef]
- Ren, J.Z.; Liang, H.W. Measuring the sustainability of marine fuels: A fuzzy group multi-criteria decision making approach. Transp. Res. Part D Transp. Environ. 2017, 54, 12–29. [Google Scholar] [CrossRef]
- Christodoulou, A.; Woxenius, J. Sustainabitity short sea shipping. Sustainability 2019, 11, 2874. [Google Scholar] [CrossRef] [Green Version]
- Tang, R.L.; An, Q.; Xu, F.; Zhang, X.D.; Li, X.; Lai, J.G.; Dong, Z.C. Optimal operation of hybrid energy system for intelligent ship: An ultrahigh-dimensional model and control methods. Energy 2020, 211, 119077. [Google Scholar] [CrossRef]
- Vitali, N.; Jasna, P.O.; Soares, G. Coupling voyage and weather data to estimate speed loss of container ships in realistic conditions. Ocean. Eng. 2020, 210, 106758. [Google Scholar] [CrossRef]
- Yang, Y.C.; Chang, W.M. Impacts of electric rubber-tired gantries on green port performance. Res. Transp. Bus. Manag. 2013, 8, 67–76. [Google Scholar] [CrossRef]
- He, J.L.; Huan, Y.F.; Yan, W.; Wang, S.A. Integrated internal truck, yard crane and quay crane scheduling in a container terminal considering energy consumption. Expert Syst. Appl. 2015, 42, 2464–2487. [Google Scholar] [CrossRef]
- Aregall, M.G.; Rickard, B.; Monios, J. A global review of the hinterland dimension of green port strategies. Transp. Res. Part D Transp. Environ. 2018, 59, 23–34. [Google Scholar] [CrossRef]
- Correcher, J.F.; Thomas, V.D.B.; Ramon, A.V.; Greet, V.B. The berth allocation problem in terminals with irregular layouts. Eur. J. Oper. Res. 2019, 272, 1096–1108. [Google Scholar] [CrossRef]
- Tseng, P.H.; Pilcher, N. Evaluating the key factors of green port policies in Taiwan through quantitative and qualitative approachess. Transp. Policy 2019, 82, 127–137. [Google Scholar] [CrossRef] [Green Version]
- Lam, J.S.L.; Li, K.X. Green port marketing for sustainable growth and development. Transp. Policy 2019, 84, 73–81. [Google Scholar] [CrossRef]
- Comi, A.; Polomeni, A. Assessing the potential of short sea shipping and the benefifits in terms of external costs: Application to the Mediterranean basin. Sustainability 2020, 12, 5383. [Google Scholar] [CrossRef]
- Munim, Z.H.; Friese, H.S.; Dushenkoa, M. Identifying the appropriate governance model for green port management: Applying analytic network process and best-worst methods to ports in the Indian ocean rim. J. Clean. Prod. 2020, 268, 122156. [Google Scholar] [CrossRef]
- Nadine, H.; Setareh, K. Accounting for carbon dioxide emissions from international shipping: Burden sharing under different UNFCCC allocation options and regime scenarios. Marine Policy 2011, 35, 682–691. [Google Scholar]
- Lee, T.C.; Chang, Y.T.; Paul, T.W.L. Economy-wide impact analysis of a carbon tax on international container shipping. Transp. Res. Part A Policy Pract. 2013, 58, 87–102. [Google Scholar] [CrossRef]
- Dessens, O.; Anger, A.; Barker, T.; Pyle, J. Effects of decarbonising international shipping and aviation on climate mitigation and air pollutions. Environ. Sci. Policy 2014, 44, 1–10. [Google Scholar] [CrossRef]
- Wang, K.; FuX, W.; Luo, M.F. Modeling the impacts of alternative emission trading schemes on international shipping. Transp. Res. Part A Policy Pract. 2015, 77, 35–49. [Google Scholar] [CrossRef] [Green Version]
- Shi, Y.B. Reducing greenhouse gas emissions from international shipping: Is it time to consider market-based measures? Mar. Policy 2016, 62, 123–134. [Google Scholar] [CrossRef]
- Konstantinus, A.; Zuidgeest, M.; Cristodoulou, A. Barriers and Enablers for Short Sea Shipping in the Southern African Development Community. Sustainability 2019, 11, 1532. [Google Scholar] [CrossRef] [Green Version]
- Hu, H.T.; Yuan, J.; Nian, V. Development of a multi-objective decision-making method to evaluate correlated decarbonization measures under uncertainty-The example of international shipping. Transp. Policy 2019, 82, 148–157. [Google Scholar] [CrossRef]
- Raza, Z. Effects of regulation-driven green innovations on short sea shipping’s environmental and economic performance. Transp. Res. Part D Transp. Environ. 2020, 84, 102340. [Google Scholar] [CrossRef]
- Ge, P.F.; Han, Y.N.; Wu, X.X. Measurement and evaluation of the coupling coordination between innovation and economic development in China. Quant. Tech. Econ. Res. 2020, 10, 101–117. [Google Scholar]
- Han, Z.L.; Zhao, Y.Q.; Yan, X.L.; Zhong, J.Q. Coupling coordination mechanism and spatial-temporal relationship between gross ecosystem product and regional economy: A case study of Dalian. Econ. Geogr. 2020, 40, 1–10. [Google Scholar]
- Wang, Y.S.; Li, Y.H.; Jie, X.M.; Li, Y.L.; Li, G.J.; Wang, W.T. Coupling between marine technology, economy and environment systems in China. China Popul. Resour. Environ. 2020, 30, 168–176. [Google Scholar]
- Li, W.W.; Yi, P.T. Assessment of city sustainability-coupling coordinated development among economy, society and environment. J. Clean. Prod. 2020, 256, 120453. [Google Scholar] [CrossRef]
- Song, M.L.; Pan, X.F.; Pan, X.Y. Sustainable Marine Resource Utilization in China: A Comprehensive Evaluation; Elsevier: Amsterdam, The Netherlands, 2019. [Google Scholar] [CrossRef]
- Lin, Y.Q. Coupling analysis of marine ecology and economy: Case study of Shanghai, China. Ocean. Coast. Manag. 2020, 195, 105278. [Google Scholar] [CrossRef]
- Zhou, D.; Zhou, M.X. Coupling level difference and coupling path of human capital and economic growth in five urban agglomerations. Stat. Decis. 2020, 20, 67–71. [Google Scholar]
- Sun, J.F.; Li, S.T.; Ji, X.M.; Qin, W.S.; Wang, F.X. Evaluation and optimization of coordinated development of cultural resources and tourism industry in Shandong Province. Econ. Geogr. 2019, 39, 207–215. [Google Scholar]
- Shu, X.L.; Gao, Y.B.; Zhang, Y.X.; Yang, C.Y. Study on the coupling relationship and coordinated development between tourism industry and ecological civilization city. China Popul. Resour. Environ. 2015, 25, 82–90. [Google Scholar]
- Zhang, X.; Bai, F.C. Study on the coupling relationship between marine resources environment system and marine economic system in Guangdong Province. Ecol. Econ. 2018, 34, 75–80. [Google Scholar]
- Zhan, B.; Lu, Y.C. Design of comprehensive evaluation index system for green shipping development in Hubei Province. Water Transp. Manag. 2017, 39, 24–28. [Google Scholar]
- Wang, J.; Deng, Y. Relationship of coupling coordination between port logistics and direct hinterland economy: A case study on nine seaport-type national logistics hubs. J. Ind. Technol. Econ. 2020, 11, 62–68. [Google Scholar]
- Song, A.H. Evaluation of coordination degree between regional logistics industry and economic development. Stat. Decis. 2020, 16, 126–129. [Google Scholar]
- Li, J.Y.; Chen, X. Research on the coupling coordinating relationship of marine economy, marine science and technology innovation and marine ecological environment in coastal areas of China. Ocean. Dev. Manag. 2020, 10, 56–61. [Google Scholar]
- Liu, B.; Long, R.Y.; Zhu, C.G.; Sun, X.X.; Pan, K.Y. Comprehensive measurement of the index system for marine economy high-quality development in Jiangsu Province. Econ. Geogr. 2020, 40, 104–113. [Google Scholar]


| Coupling Coordination Degree (D) | Coordination Type | Relative Development Degree (H) | Development Types |
|---|---|---|---|
| 0~0.09 | Extreme maladjustment | H < 0.8 0.8 ≤ H ≤ 1.2 H > 1.2 | Green shipping lags behind Antagonistic type. Economic growth lags behind. |
| 0.1~0.19 | Serious maladjustment | ||
| 0.2~0.29 | Moderate maladjustment | ||
| 0.3~0.39 | Mild maladjustment | ||
| 0.4~0.49 | On the verge of maladjustment | ||
| 0.5~0.59 | Grudging coordination | H < 0.8 0.8 ≤ H ≤ 1.2 H > 1.2 | Green shipping lags behind. Running in type. Economic growth lags behind. |
| 0.6~0.69 | Primary coordination | H < 0.8 0.8 ≤ H ≤ 1.2 H > 1.2 | Green shipping lags behind. Synchronous type. Economic growth lags behind. |
| 0.7~0.79 | Intermediate coordination | H < 0.8 0.8 ≤ H ≤ 1.2 H > 1.2 | Green shipping leads. Synchronous type. Economic growth leads. |
| 0.8~0.89 | Good coordination | ||
| 0.9~1 | High quality coordination |
| Subsystem | Dimension | Evaluating Index | Weight |
|---|---|---|---|
| Green shipping | Green channels | Grade channel mileage | 0.068 |
| Proportion of grade channel mileage | 0.082 | ||
| Wastewater discharge per unit output value (−) | 0.053 | ||
| Chemical oxygen demand per unit output value (−) | 0.061 | ||
| Investment in waterway environmental protection | 0.082 | ||
| Green ports | Number of berths in newly built and reconstructed (expanded) wharves | 0.112 | |
| New carrying capacity | 0.050 | ||
| The proportion of 10,000 DWT berths in production berths | 0.070 | ||
| Port cargo turnover | 0.048 | ||
| Employment in water transport (−) | 0.046 | ||
| Investment in water transport construction | 0.050 | ||
| Green ships | Average net carrying capacity | 0.051 | |
| Average ship power | 0.069 | ||
| Energy consumption of ocean and coastal freight enterprises (−) | 0.066 | ||
| The proportion of container throughput in cargo throughput | 0.091 | ||
| Economic growth | Scale of economic development | Per capita GDP | 0.104 |
| Per capita actual utilization of foreign capital | 0.071 | ||
| Per capita fiscal revenue | 0.098 | ||
| GDP growth rate | 0.143 | ||
| Quality of economic development | Per capita investment in fixed assets | 0.101 | |
| Total retail sales of social consumer goods per capita | 0.106 | ||
| Trade dependence (−) | 0.067 | ||
| Structure of economic development | The proportion of primary industry (−) | 0.077 | |
| The proportion of secondary industry | 0.105 | ||
| The proportion of tertiary industry | 0.127 |
| Year | Development Types | Areas | Year | Development Types | Areas | ||
|---|---|---|---|---|---|---|---|
| 2010 | Mild maladjustment | Green shipping lags behind | Zhejiang, Hainan | 2019 | Primary coordination | Green shipping lags behind | Liaoning, Tianjin |
| Antagonistic type | Fujian | Intermediate coordination | Green shipping leads | Hebei, Shandon, Fujian, Hainan | |||
| On the verge of maladjustment | Antagonistic type | China, Liaoning, Tianjin, Shanghai, Jiangsu | |||||
| Good coordination | Synchronous type | China, Shanghai, Jiangsu, Zhejiang, Guangdong | |||||
| Economic growth lags behind | Hebei | ||||||
| Grudging coordination | Running in type | Guangxi | |||||
| Economic growth lags behind | Shandong, Guangdong | Economic growth lead | Guangxi | ||||
Publisher’s Note: MDPI stays neutral with regard to jurisdictional claims in published maps and institutional affiliations. |
© 2021 by the authors. Licensee MDPI, Basel, Switzerland. This article is an open access article distributed under the terms and conditions of the Creative Commons Attribution (CC BY) license (https://creativecommons.org/licenses/by/4.0/).
Share and Cite
Deng, G.; Li, X.; Chen, J. Research on Coupling Coordination and the Development of Green Shipping and Economic Growth in China. Sustainability 2021, 13, 13901. https://doi.org/10.3390/su132413901
Deng G, Li X, Chen J. Research on Coupling Coordination and the Development of Green Shipping and Economic Growth in China. Sustainability. 2021; 13(24):13901. https://doi.org/10.3390/su132413901
Chicago/Turabian StyleDeng, Gaodan, Xinchun Li, and Jingxiao Chen. 2021. "Research on Coupling Coordination and the Development of Green Shipping and Economic Growth in China" Sustainability 13, no. 24: 13901. https://doi.org/10.3390/su132413901
APA StyleDeng, G., Li, X., & Chen, J. (2021). Research on Coupling Coordination and the Development of Green Shipping and Economic Growth in China. Sustainability, 13(24), 13901. https://doi.org/10.3390/su132413901


