Abstract
Since the Green Deal, ambitious climate and resource neutrality goals have been set in Europe. Here, process industries hold a unique position due to their energy and material transformation capabilities. They are encouraged to develop cross-sectorial hubs for achieving not only climate ambition, but also joining a circular economy through urban–industrial symbiosis with both business and community stakeholders. This research proposes a data-based approach to identify potential hub locations by means of cluster analysis. A total of three different algorithms are compared on a set of location and pollution data of European industrial facilities: K-means, hierarchical agglomerative and density-based spatial clustering. The DBSCAN algorithm gave the best indication of potential locations for hubs because of its capacity to tune the main parameters. It evidenced that predominately west European countries have a high potential for identifying hubs for circularity (H4Cs) due to their industrial density. In Eastern Europe, the industrial landscape is more scattered, suggesting that additional incentives might be needed to develop H4Cs. Furthermore, industrial activities such as the production of aluminium, cement, lime, plaster, or electricity are observed to have a relatively lower tendency to cluster compared with the petrochemical sector. Finally, further lines of research to identify and develop industrial H4Cs are suggested.
1. Introduction
Climate change and resource intensity are some of the most challenging problems humanity faces today. To prevent escalation, action is needed on all levels of society [1,2,3]. In recent years, circular economy (CE) and industrial symbiosis (IS) have grown in importance as sustainable development concepts addressing both challenges. The European Union sees both as key pillars in the ambitious new Green Deal presented at the end of 2019 [2], which aims at making Europe climate neutral by 2050. To make this transition a reality, the Circular Economy Action Plan (CEAP) [3] was launched in March 2020, which outlines the steps needed to achieve the goals of a fully circular economy. An important actor in this field is the public–private partnership Processes4Planet (P4Planet), an association of process industries, research institutions and other organisations aiming for a circular and climate neutral economy in Europe [4]. Of the prominent accelerators for this transformation, one is the concept of hubs for circularity (H4C). In these hubs, energy, materials, services, infrastructure and information are shared with the aim of achieving climate and resource neutrality [4]. Such a self-sustaining economic ecosystem involves a manifold of regional stakeholders from industry, civil society, local authorities, and RTOs to deploy full-scale urban–industrial symbiosis (UIS) and circular economics [4].
Hubs for circularity address the implementation of the circular economy at a meso-level, while industrial clusters are expected to have industrial symbiosis as a central strategy [5,6]. IS refers to collaboration models that engage two or more organisations towards valorisation of under-used resources and services across sectors and value chains [7,8]. Such models often result in novel sourcing of required inputs and value added destinations for by-product outputs [7,9]. The scope also includes infrastructure and service sharing to improve business and operating processes [10,11].
In the academic literature there are two main concepts related to H4C: zero waste hubs and urban–industrial symbiosis. Zero waste hubs originated in 1997 [12,13], focusing on industrial waste but not restricted to industry boundaries. The concept builds on considering waste as an under-used resource, proposing a hierarchy for end-of-life use based on the ladder of Lansink [14]. True to this approach, Accenture [6] developed a strategy for hubs in Europe targeting net-zero emissions with a focus on energy-intensive industries. The second concept, urban–industrial symbiosis [15,16], introduces synergies among industries and cities, acknowledging the importance of urban collaboration to effectively reduce the environmental impact in a region. Such strategy becomes more prominent as the distance between industries, traditionally established in suburban areas, reduces due to the expansion of cities in regions around the world [17].
1.1. Circular Economy and the Relevance of European Cities and Industry
The CE is conceptualised as a regenerative economic system that keeps the use of resources within the planetary boundaries while reducing the footprint of consumption in Europe [3]. The CE framework aims to decouple economic growth from natural resource depletion and environmental degradation [18]. The implementation of such a framework creates profitable opportunities where value creation integrates environmental performance, joining improved energy and material productivity with the access and creation to green market places [19].
The economic model of the circular economy (CE) has gained attention and attraction in the last 15 years [20]. It aims at replacing the linear economy that follows the ‘take, make and dispose off’ principle by ‘closing the loop’. The linear economic model exposes risks regarding the finite supply of raw materials such as resource scarcity and price volatility [7,21]. Limited supplies also increase material dependency, especially in the European Union. According to the CEAP on critical raw materials [22], the European Union is dominated by the manufacturing and the refining industry compared to the extractive industry. The need for access to primary sources, including ores, concentrates and processed or refined materials is vast and crucial for European industries’ wealth—even its survival—and the associated jobs and economic benefits. However, most primary raw materials are produced and supplied from non-European countries, indicating a supply risk [22]. The risks have supported the idea to start valorising waste and growing a more circular model.
The circular economy also plays a critical role in helping to reduce climate change [23,24], enabling goods and services with lower emissions. Based on the ladder of Lansink [14], the CE policy in Europe integrates the principle of preserving the value of materials with a cascade approach, leaving energy recovery as the last option (omitting disposal), thus avoiding unnecessary emissions [14]. The merging of both economic and environmental goals has led the CE concept to become one of the most prominent sustainable development models in academic and policy domains [14,25].
To implement the CE concept, action from a diverse range of stakeholders is critical. Crucial actors are industries and cities establishing symbiotic relations towards higher levels of circularity [15,16]. The relevance of cities in the creation of industrial hubs for circularity is high. Although cities occupy only around 3% of the planet’s surface, the concentration of the population in urban areas is over 50% and is expected to increase to almost 70% by 2050 [26]. Urban areas are related to 75% of the world’s resources and are linked to 60–80% of the total greenhouse gas emissions [16,27]. Consumption of domestic materials in cities is projected to reach approximately 90 billion tonnes by 2050 [28]. European figures show an urbanisation rate of 72% in 2015 and a population density of 3000 residents per km2 [29]. High-density urbanised areas have implications for industries in terms of product and service demands and the availability of qualified professionals. Moreover, European cities enable a concentrated demand for industrial products and can recirculate resources back to the industry at scale. Hence, the collaboration between cities and industries is vital to the European policy agenda to reach common goals.
On the industry side, energy-intensive industries (steel, chemicals, cement and refining, etc.) provide the material and energetic building blocks to virtually any sector [5,30]. Therefore, they concentrate massive amounts of energy, resources, waste and emissions in industrial sites and clusters. Such profile makes the process industry significant in terms of environmental impact and economic development. As an example, in 2018, the chemicals industry in Europe represented 20.7% of the world output sales in Euros [31], producing about 330 Mt of product per year [32] but also generating CO2 emissions at 27% of the total industrial CO2 emissions in the EU ETS in 2018 [33]. In the last few decades, many efforts have been made to reduce process emissions via energy and resource efficiency. The energy consumption per production unit in the chemical industry, including pharmaceuticals, was nearly 55% lower in 2017 than in 1991 [31]. Of the key features enabling the sector’s transition to a net-zero economy, one is its clustering capacity. This does not only enhance competitiveness [32,34] but also answers to socio-environmental questions by making effective synergies between different processes and sectors or communities in a specific region [9,35].
Examples are given for the steel and cement sector, industries that position Europe as a world reference. In 2019, the steel sector accounted for 10% of the world output (metric tonnes) in the EU [36]. Steel is fundamental for both the manufacturing and the construction industry and thus for the logistic development of any region. In 2018, the steel sector made up for 22% of the total industrial CO2 emissions in the EU ETS [33]. Nevertheless, over the last 40 years the EU steel industry has reduced its energy consumption by 50% owing to higher scrap recycling levels and a decrease in production [37]. Likewise, in 2018 cement production in EU-28 represented 4.4% of the total world production (metric tonnes) [38]. Cement is fundamental for building durable structures as it is a hydraulic binder in concrete [32]. The CO2 emissions from the sector in Europe take up a 21% share of the total industrial CO2 emissions in the EU ETS in 2018 [33]. However, an essential aspect of this industry is its ability to use fuels derived from waste and biomass to produce heat in its kilns. Between 1990 and 2017, the EU-28 cement industry has reduced its gross CO2 emissions per tonne of product by 13% [38].
Industrial sectors and urban centers have essential relevance towards a circular economy. Therefore, synergies among industries including cities are a natural way forward. Industrial symbiosis strategies precisely focus on such synergies, and to facilitate urban–industrial symbiosis, the identification of regions and clusters is essential.
1.2. Cluster Analysis for Identification of Hubs
Cluster analysis is an exploratory analysis tool that finds structures and patterns in data sets. Clustering algorithms are unsupervised learning algorithms that identify patterns from untagged data [39].
According to Estivill and Castro [40], there is a top-down and bottom-up view to clustering. In the top-down approach, clustering is the process of segmenting a heterogeneous population into a number of homogeneous subgroups. In the bottom-up view, clustering is defined as “finding groups” in a data set by a specific similarity criterion. These should be grouped into the most homogeneous groups possible, maximising the difference between groups and minimising the differences among the elements of each group. However, given the diversity of methods and purposes, other views and classification strategies are possible [41].
Relevant examples of applying clustering methods range from identifying groups of indicators across frameworks to the segmentation of regions and industries according to certain parameters. Superti et al. [42] organised circularity indicators into common groups using hierarchical clustering based on a selection of circular economy projects and frameworks. Dunkelberg et al. mapped the German plastic industry using clustering analysis to support waste heat utilisation strategies [43]. Arbolino et al. identified homogeneous regions to improve the monitoring and evaluations of regional waste policies [44] based on economic indicators. Although these applications relate to the circular economy, none entered into developing cross-sector hubs, including industries and cities.
The latest European projects on industrial symbiosis potential in regions indicate the importance of geo-based data. An initial approach in the EPOS project led to the mapping of process industries with high potential for industrial symbiosis [45]. The procedure was further elaborated in the SCALER project, adding potential exchanges among the industries in a specific area [46]. This regional approach is turned into an implementation strategy in the INCUBIS project, where incubators are located around Europe to promote symbiosis, mainly focusing on industrial waste heat utilisation [47]. The hub approach is taken forward by the Process4Planet partnership supported by the European Commission [4], considering the geospatial character for clustering as crucial.
Different clustering methods have differing degrees of complexity. A total of three algorithms are compared on a set of location data of European industrial facilities (E-PRTR): K-means clustering, hierarchical agglomerative clustering (HAC) and density-based spatial clustering of applications with noise (DBSCAN). The first, K-means, is one of the simplest methods capable of both supervised and unsupervised clustering based on the number of clusters ‘K’ in a given dataset [41]. Due to its simplicity and versatility, it is one of the most used clustering methods. The second one, HAC, enables bottom-up clustering based on the distance between points or similarity criteria [48]. Finally, DBSCAN allows for a more sophisticated clustering based on the distance between data points and restrictions about the number of connecting points to each point in a cluster [49]. By selecting this range of methods, we can explore the suitability of clustering methods for a first identification of hubs.
Using clustering methods to define regions that can become hubs for circularity can provide useful information for identifying regional circular economy strategies, fostering industrial symbiosis and involving a maximum number of cities. This paper aims to make a first-of-a-kind explorative analysis of how cluster analysis methods can support the identification of regions with a high potential for hubs for circularity.
The approach of this study is two-fold: in the first phase, the clustering methods are investigated and compared using both general statistical validation techniques as well visual inspection of the data. In the second phase, the method that is best suited for hubs identification, based on the nature of the data, is selected and used to generate insights on clustering for circularity.
2. Methodology
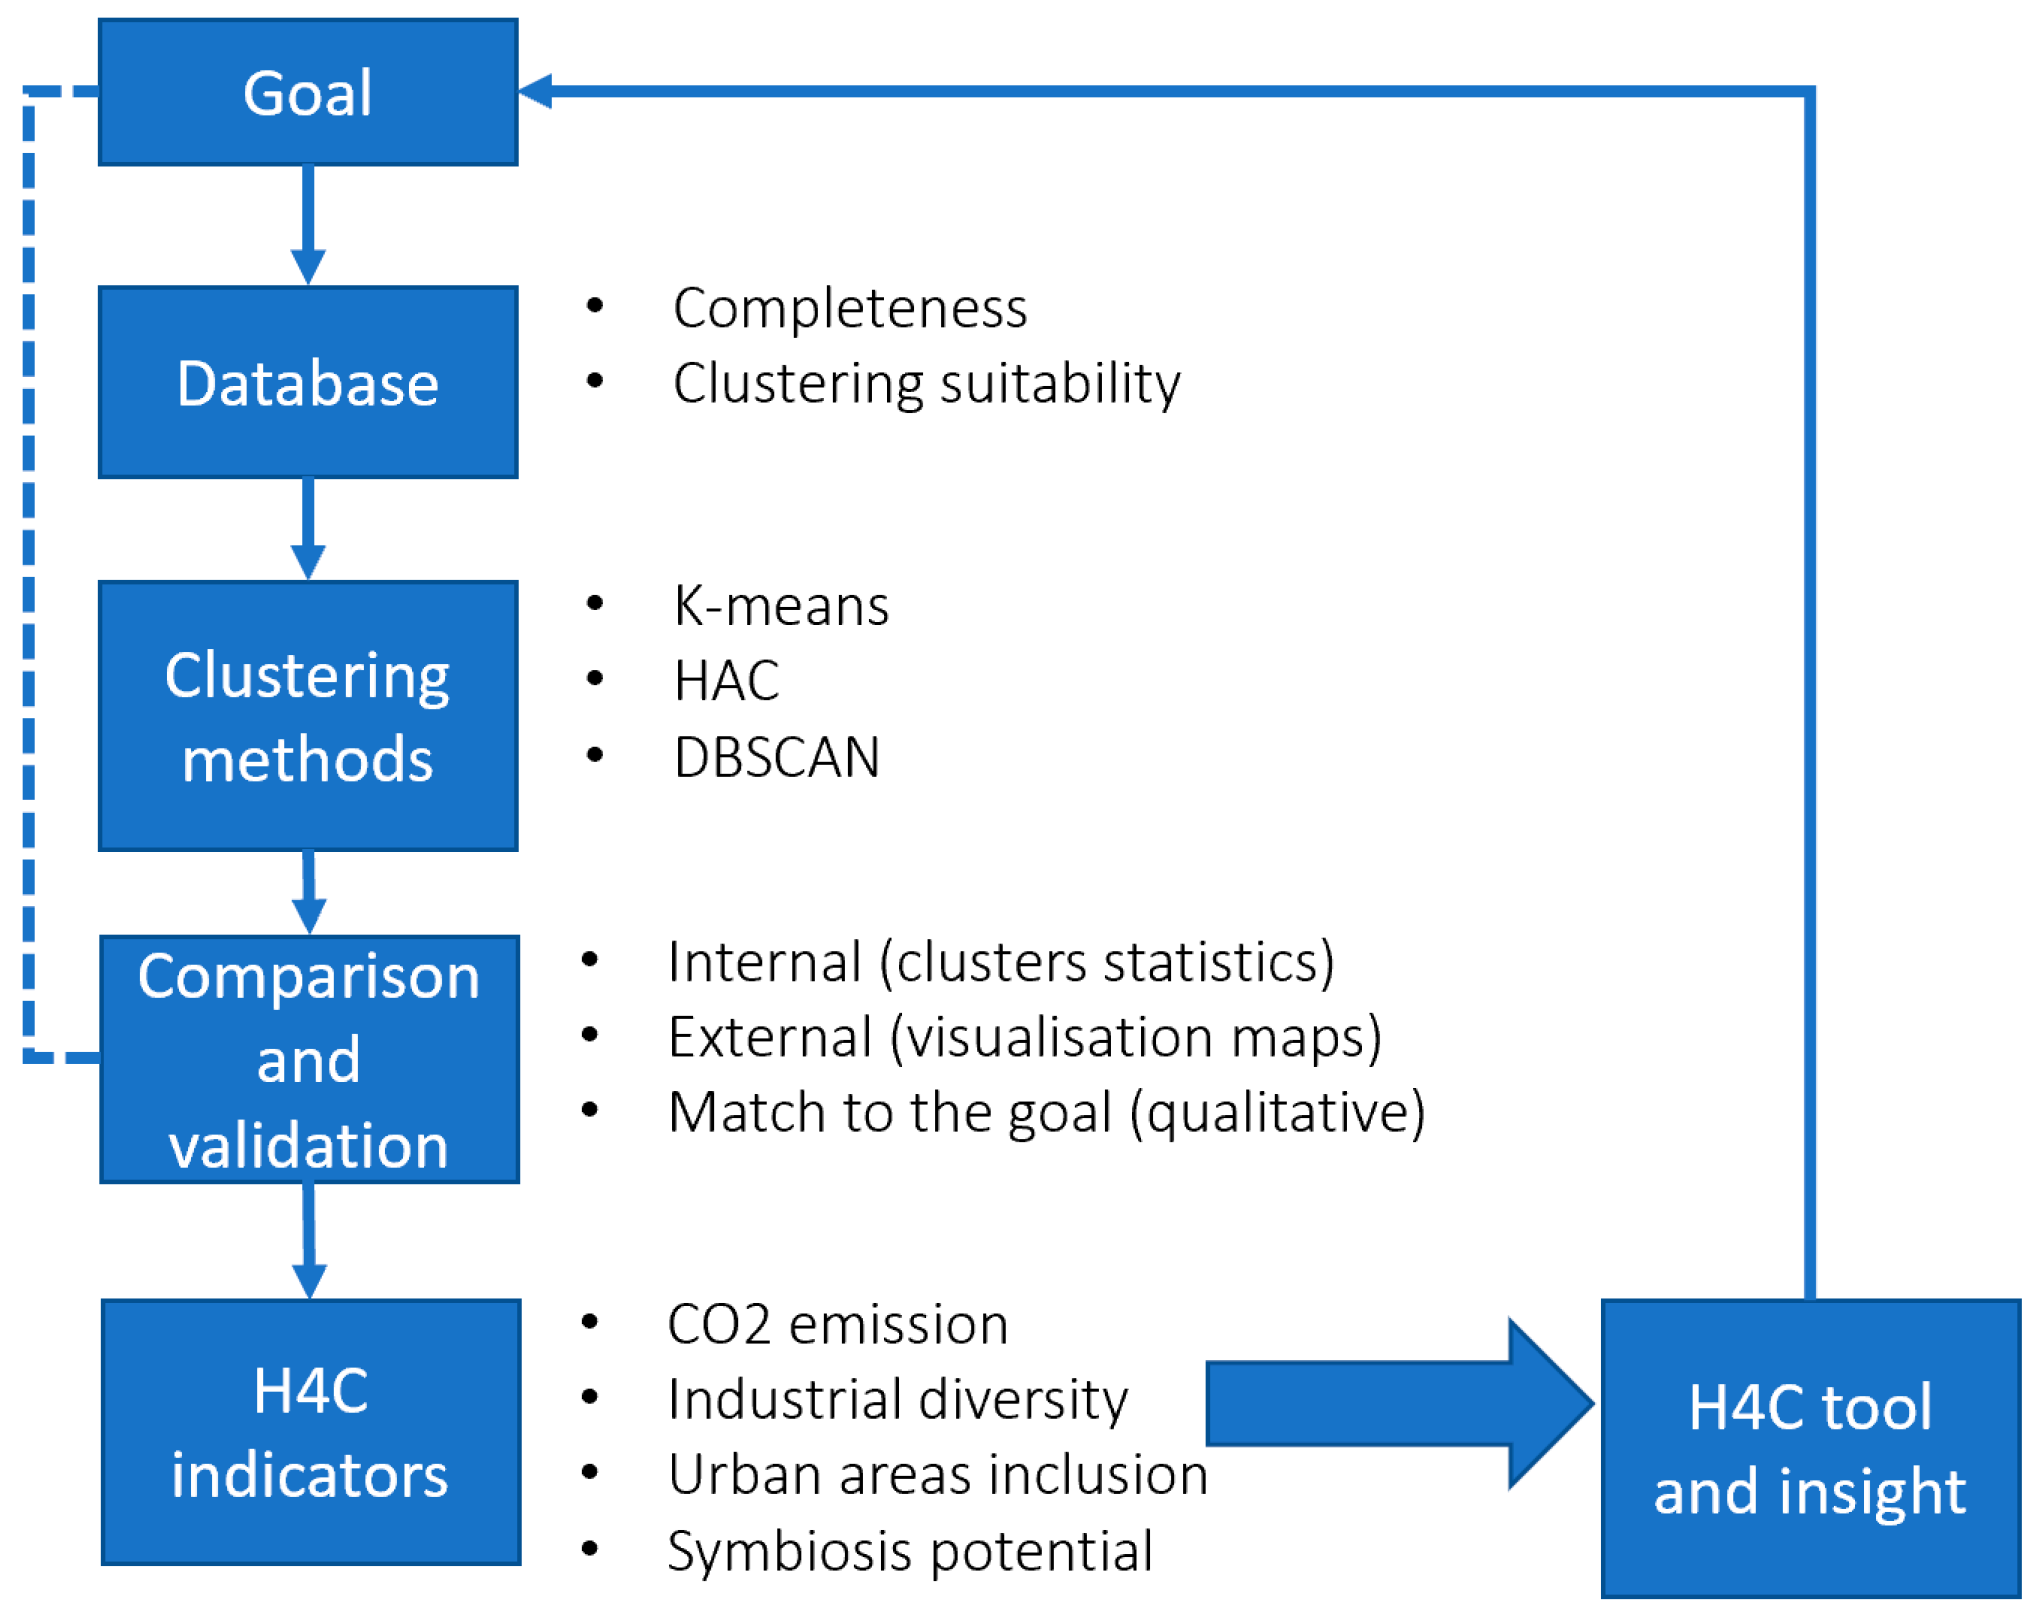
A five-step cyclical methodology was developed to identify H4Cs using clustering algorithms as shown in Figure 1. With the goal set, the checks required to verify a suitable database were defined and the clustering algorithms for comparison and selection described. To end, the circularity indicators were identified in order to enable insights and develop a mapping tool to visualise the clusters.
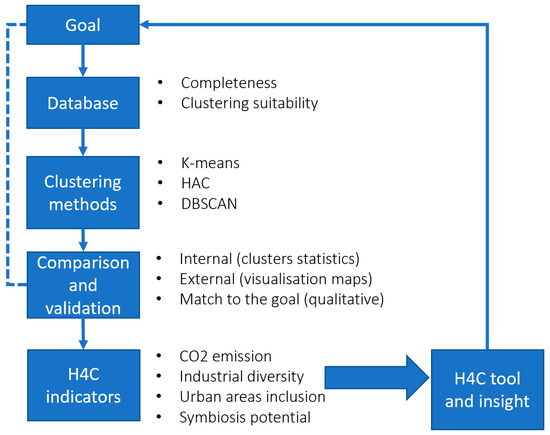
Figure 1.
Methodology: using clustering methods to identify hubs for circularity.
2.1. Goal
We explored the options for defining circularity regions in Europe, using different clustering methods, and focused on distributing industries and cities, as they are critical stakeholders.
The definition of regional circularity is broad, but the pure geographical aspects of the concept are central. The elements considered for this exploration are process industries in Europe as reported in the European Pollutant Release and Transfer Register (E-PRTR) [50], supplemented with information on the concentration of urban areas from the EU Urban Mobility Observatory [51]. Spatial clustering techniques allow to identify groups of location points. They are of a specific size and concentration that are not able to appear randomly and show a visible similarity between each other.
2.2. Database
Information related to the location of an industry was the starting point. The data on industrial facilities, retrieved from E-PRTR, include all 27 European Union member states and Iceland, Liechtenstein, Norway, Switzerland, and the United Kingdom. The register contains data on main pollutant releases to air, water and land of more than 30,000 industrial plants. These facilities cover a total of 65 economic activities across 9 industrial sectors. Besides categorising plants in the above sectors, E-PRTR also supports classification according to NACE codes (Nomenclature of Economic Activities in the European Communities). In this study, data were collected by choosing a set of 24 NACE-coded activities [50]. The database is considered solid owing to the broad range of industries, the relevance of the pollutants for clustering into H4Cs and the continuous improvement of the reporting since 2007 [50].
With the database selected, we tested its suitability for clustering methods. The cluster tendency assessment [52] evaluated whether or not the data have non-random structures. Such evaluation was necessary because the algorithms cluster any type of data, regardless of the data structure. In this step, first a visual inspection was performed to assess the generation of meaningful clusters, and then the Hopkins statistic was calculated, yielding the probability of a uniform data distribution [53].
For the analysis itself, open-source Python libraries were used, in casu the Py-clustertend package to assess cluster tendency [54].
2.3. Clustering Methods
As introduced above, three representative cluster methods were selected, known to have increasing sophistication: K-means, HAC and DBSCAN. K-means and HAC require to determine the optimal number of clusters. Specifically, for this research, we used two different methods: the elbow method [55] and the average silhouette method [56]. The results of these three methods can vary, hence choosing the right value (if existing) relies on direct inspection of the clustering results. The K-means method served as pilot for testing the methods for an optimal number of clusters.
In agglomerative clustering (HAC), the hierarchical clustering is performed from a bottom-up perspective. Each data point starts in a potential cluster, and clusters are merged using a proximity measure such as distance or similarity. The algorithm also requires either a specification of the number of clusters or a distance threshold at which clusters will no longer be merged. The second option is excellent for the H4C application because it allows to specify clusters with a certain distance range [40,48]. The algorithm in Scikit-learn for the HAC method does not support haversine distance [57] as a distance metric, but this can be solved by generating a precomputed distance matrix that calculates circle distances between all data points. This, however, considerably increases the computational complexity of this algorithm. The HAC algorithm has different linkage criteria. The single linkage criterion has the ability to form clusters of non-spherical shapes as compared to circular clusters in other linkage criteria. Likewise, it is able to create larger clusters with a tendency to split such clusters into groups of multiple smaller clusters. Therefore, we selected the single linkage for HAC. The results of the HAC method with a distance threshold of 25 km criteria are discussed below.
DBSCAN requires two main parameters [49] to be set. The first is the epsilon value (EPS) that determines the distance between two data points needed to be considered part of a cluster. When two data points lay within an EPS range of each other, they are called neighbours. The second parameter is called minPoints and sets the minimum number of data points required to define a dense region or cluster. Parameters can be chosen intuitively: the EPS parameter can be transformed into an exact range in kilometres, which allows to choose a specific range. The minPoints parameter allows to determine the minimum number of industrial sites to be identified as a cluster with the rest of the data points categorised as outliers. The DBSCAN algorithm classifies data points (i.e., industrial locations) into three types in order to process outliers. The first one covers the core points: it contains at least the minimum number of points (minPoints; including the point itself) as neighbours with radius EPS. The second type is the border point that is reachable from a core point, with less than minPoints number of points within the neighbouring area. Finally, the outlier point is a point that is not a core point and not reachable from any core point [49]. The results of the DBSCAN method with a distance threshold of 25 km and minPoints = 5 are used for visualisation in next sections.
Here again, open-source Python libraries were used to perform the analysis. They include Scikit-learn, a free software machine learning library and the main library used for the clustering methods [58,59]; NumPy, one of Python’s fundamental libraries for scientific computing [60]; and Pandas, an open-source data analysis and manipulation tool [61].
2.4. Comparison and Validation
The next step in the selection process was to compare the three algorithms via cluster validation statistics and visualisation. Cluster validation is a technique that evaluates the quality of the clustering results [62]. A total of three categories, internal, external and relative cluster validation [63,64], are distinguished. The first only uses internal information to indicate the quality of the clustering by applying the average silhouette score. In the second category, the clustering results are visualised on a map of Europe, thus offering crucial spatial insight on how the clustering is performed. Lastly, relative validation techniques evaluate the clustering by changing the values of the clustering parameters (sensitivity), which is in essence a combination of the internal and external validation technique. This last validation option was used for DBSCAN because the silhouette score was not suitable for the type of clustering (density-based) performed.
Table 1 shows the overview of the clustering algorithms and validation methods applied. The validation results are discussed and used to evaluate and compare the algorithms and select the appropriate algorithm for further application.

Table 1.
Types of validation applied to the selected clustering algorithms.
2.5. Hubs for Circularity Indicators
In a next step, the research gathered statistics and insights on the results of the clustering. Additional parameters are added to the data model alongside the geolocation used at first: data on industrial activities of the facilities, data on European cities, CO2 emission data of the industry sites, and industrial symbiosis options across sectors.
Data on European cities provided helpful information on how clusters are located in relation to the urban zones in order to account for urban–industrial symbiosis. City data were included as data points into the model. Data are gathered from Eltis [51], Europe’s main observatory on urban mobility, covering all cities in the EU, including Norway and the UK but excluding Iceland, Switzerland and Liechtenstein. Eltis is a central place for the exchange of information, knowledge and experience on European cities. It allows for filtering of data points based on the population in a city centre as well as larger urban zones such as communities.
In this paper, cities were defined by having a density of more than 1500 inhabitants per square km and more than 50,000 inhabitants according to European standards for a city centre [29]. From the Eltis dataset, data points were chosen for larger urban zones that had populations of more than 100,000 inhabitants. Data on urban areas in Switzerland, Iceland and Liechtenstein are gathered from the OECD, again for populations of at least 100,000 inhabitants. In total, 567 data points were collected [65].
CO2 emission data associated with industrial sites are included in the E-PRTR [50]. Not all installations listed in the register have an associated value for emissions due to varying reporting policies, but most large emitters are included. These are useful to visually identify and tag them, either within or outside of the potential clusters.
Potential synergies across process industries or in urban-industrial clusters were a vital part of the result analysis. A preliminary list of IS synergies was extracted from the published Insights of the Horizon 2020 project EPOS. The documents summarise relevant outcomes for the H4C study, such as EPOS Insight #17 on industrial symbiosis. It discusses high-potential cross-sectorial cases and their impact in Europe, identifying 20 different generic IS cases [37]. Such cases can be generalised in and across sectors’ profiles of the process industry, such as in steel, cement, chemical, mineral and engineering sectors [66]. The list of 20 cases was applied to a specific cluster to grasp the size of the (potential) cross-sector collaboration in the cluster.
Again, open-source Python libraries were used to perform the analysis, including Matplotlib, a library for creating data visualisations [67]; Folium, facilitating data visualisation on interactive leaflet maps [68]; and Seaborn, another data visualisation library that is based on Matplotlib [67].
3. Results
In this section, the collected data are analysed according to each methodology, comparing the clustering algorithms and assessing the type of clusters and insights found per selected algorithm. After selecting the final algorithm, we analysed the identified clusters to gain insight on their profile and their potential as a hub for circularity.
3.1. Database
In a first explorative analysis, we used the E-PRTR database for localising industrial sites in Europe. To test the suitability of the database, we evaluated the uniformity of the installation distributions. Through visual inspection (Figure 2), cluster formation was observed in known industrial hubs such as port areas (Antwerp and Rotterdam, etc.) or the Ruhr area. This was further verified by the Hopkins statistic.
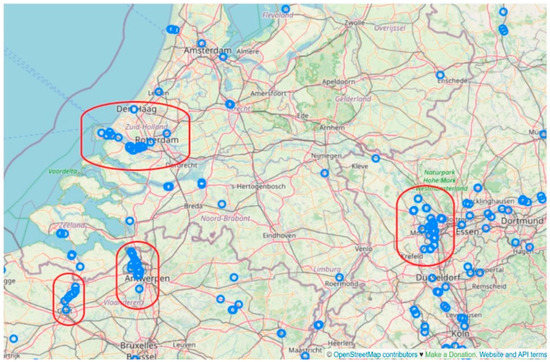
Figure 2.
Initial visual inspection of the dataset (E-PRTR) shows groups of industrial facilities.
The Hopkins statistic was used as a statistical test with the null hypothesis stating that the data are uniformly randomly distributed [52,69]. A value close to zero means that the data are not uniformly distributed and clustering will be meaningful. For higher values (starting from 0.5) data are too uniformly distributed and clustering is not considered useful for the problem. The calculated value of the Hopkins statistic on the E-PRTR database is 0.01187, indicating a very high tendency towards clustering.
3.2. Clustering Methods
In a second step, validation of each of the three selected clustering algorithms, K-means, HAC and DBSCAN, was performed. The methods outlined in the methodology chapter were used, namely the average silhouette score method for internal validation. Visualisation of the results is presented for external as well as relative validation (variation of parameters) mechanisms. In Section 2.4, Table 1 shows the overview of the validation methods per algorithm.
- K-means
The method requires a priori the number of clusters. Using the elbow method, we found seven to be the optimal number of clusters. K-means uses the Euclidean distance as distance metric, however, because geolocation coordinates are not linear, this method does not return entirely accurate results. As shown in Figure 3, the size of the clusters is too large to be practical for articulating local hubs (they are too few and too large to be realistic). In the figure, only five colours can be identified, due to the excessive agglomeration of datapoints in such clusters. A total of two additional colours suggested marginal clusters for datapoints spread in continental African and American locations associated to European countries.
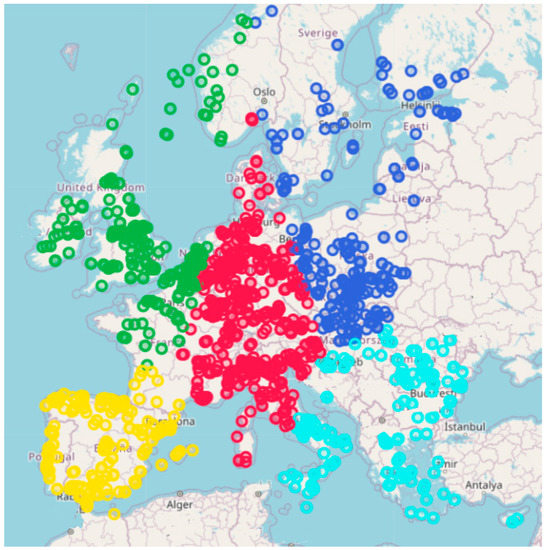
Figure 3.
K-means clustering visualisation; using the elbow method, the optimal number of clusters is 7 (=K).
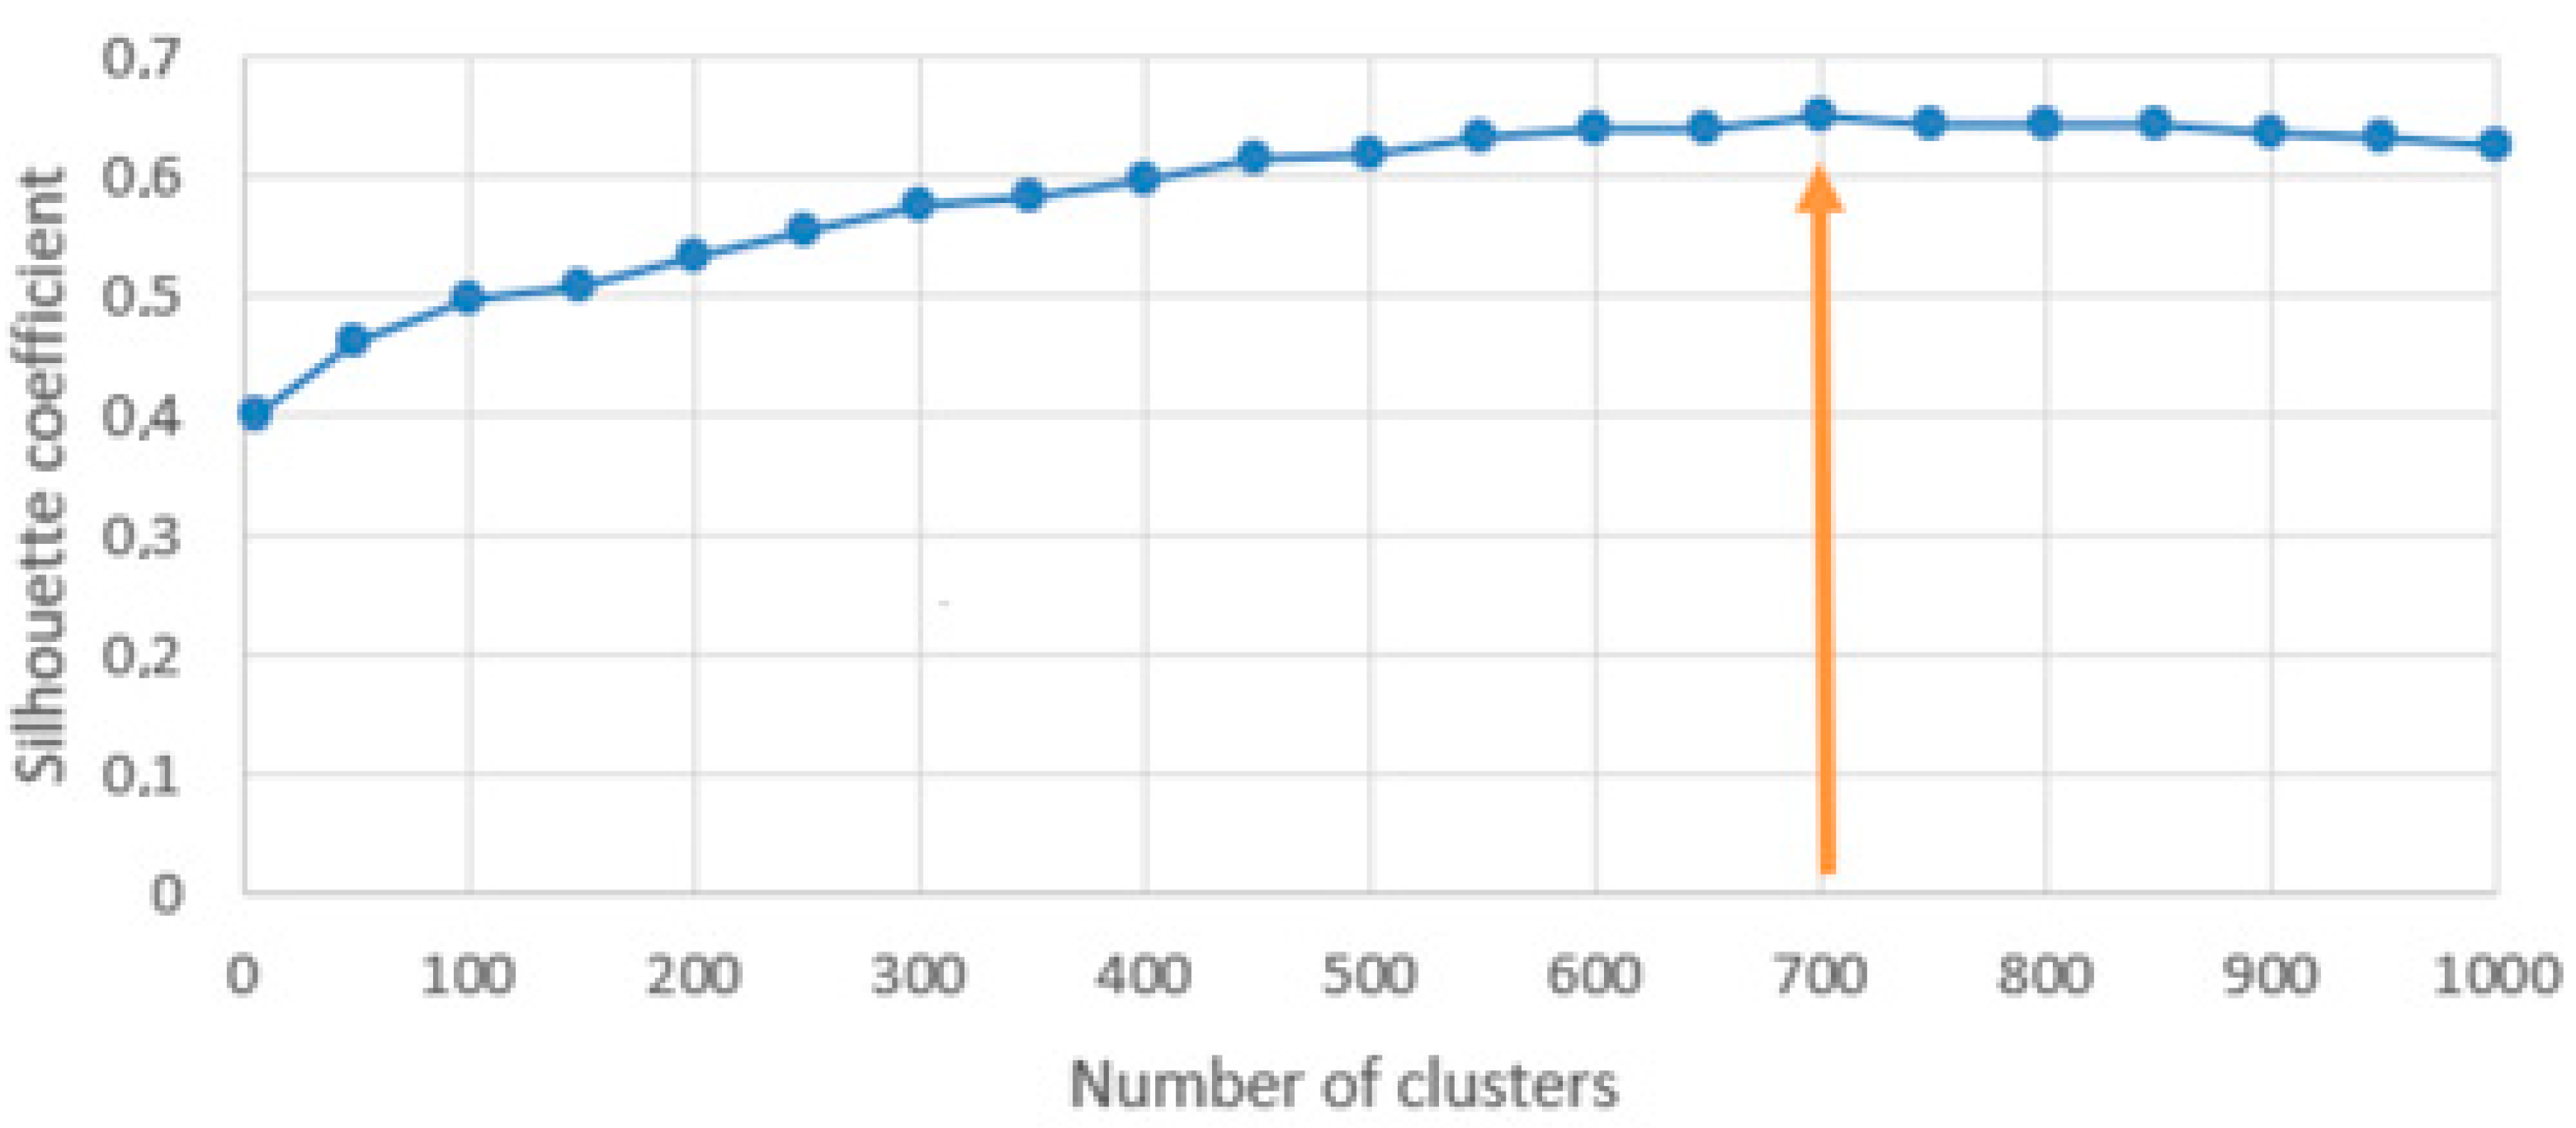
The opposite, i.e., a high value for the optimal number of clusters, is found using the average silhouette score method. It resulted in up to 1000 clusters, divided in intervals of 50 (Figure 4) with a coefficient optimum at 700 clusters. The coefficient shows least variation between 600 and 850 clusters, in a range of 0.64 to 0.65, peaking at 700 clusters. Such wide variation makes it difficult to identify a feasible number of clusters and thus the realistic potential for hubs for circularity.
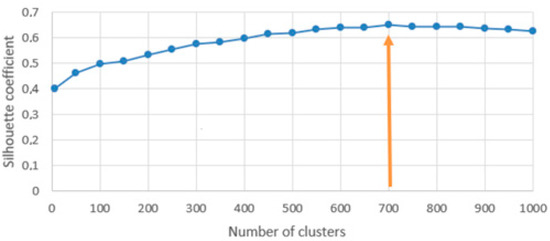
Figure 4.
Silhouette coefficient variation by number of clusters, peaking at 700 clusters.
The average silhouette method returned very high values as optimal number of clusters, but they present either a large range of options or a high degree of sensitivity to the numbers of clusters from the industrial database. This was confirmed in extra visualisations showing that certain neighbouring data points were still grouped into different clusters, and comparatively closely grouped data points were often clustered correctly. Upon further comparison, K-means was discarded as an algorithm for determining the optimal number of clusters.
- HAC
The HAC algorithm (hierarchical agglomerative clustering) requires a specification of a distance threshold at which clusters are no longer merged. For HAC, a precomputed distance matrix was needed to calculate the circle distances between all data points, which considerably increased the computational complexity of this algorithm. The results of the HAC method used a distance threshold of 25 km for different linkage criteria, referring to the average distance for symbiosis between sites in the United Kingdom [70].
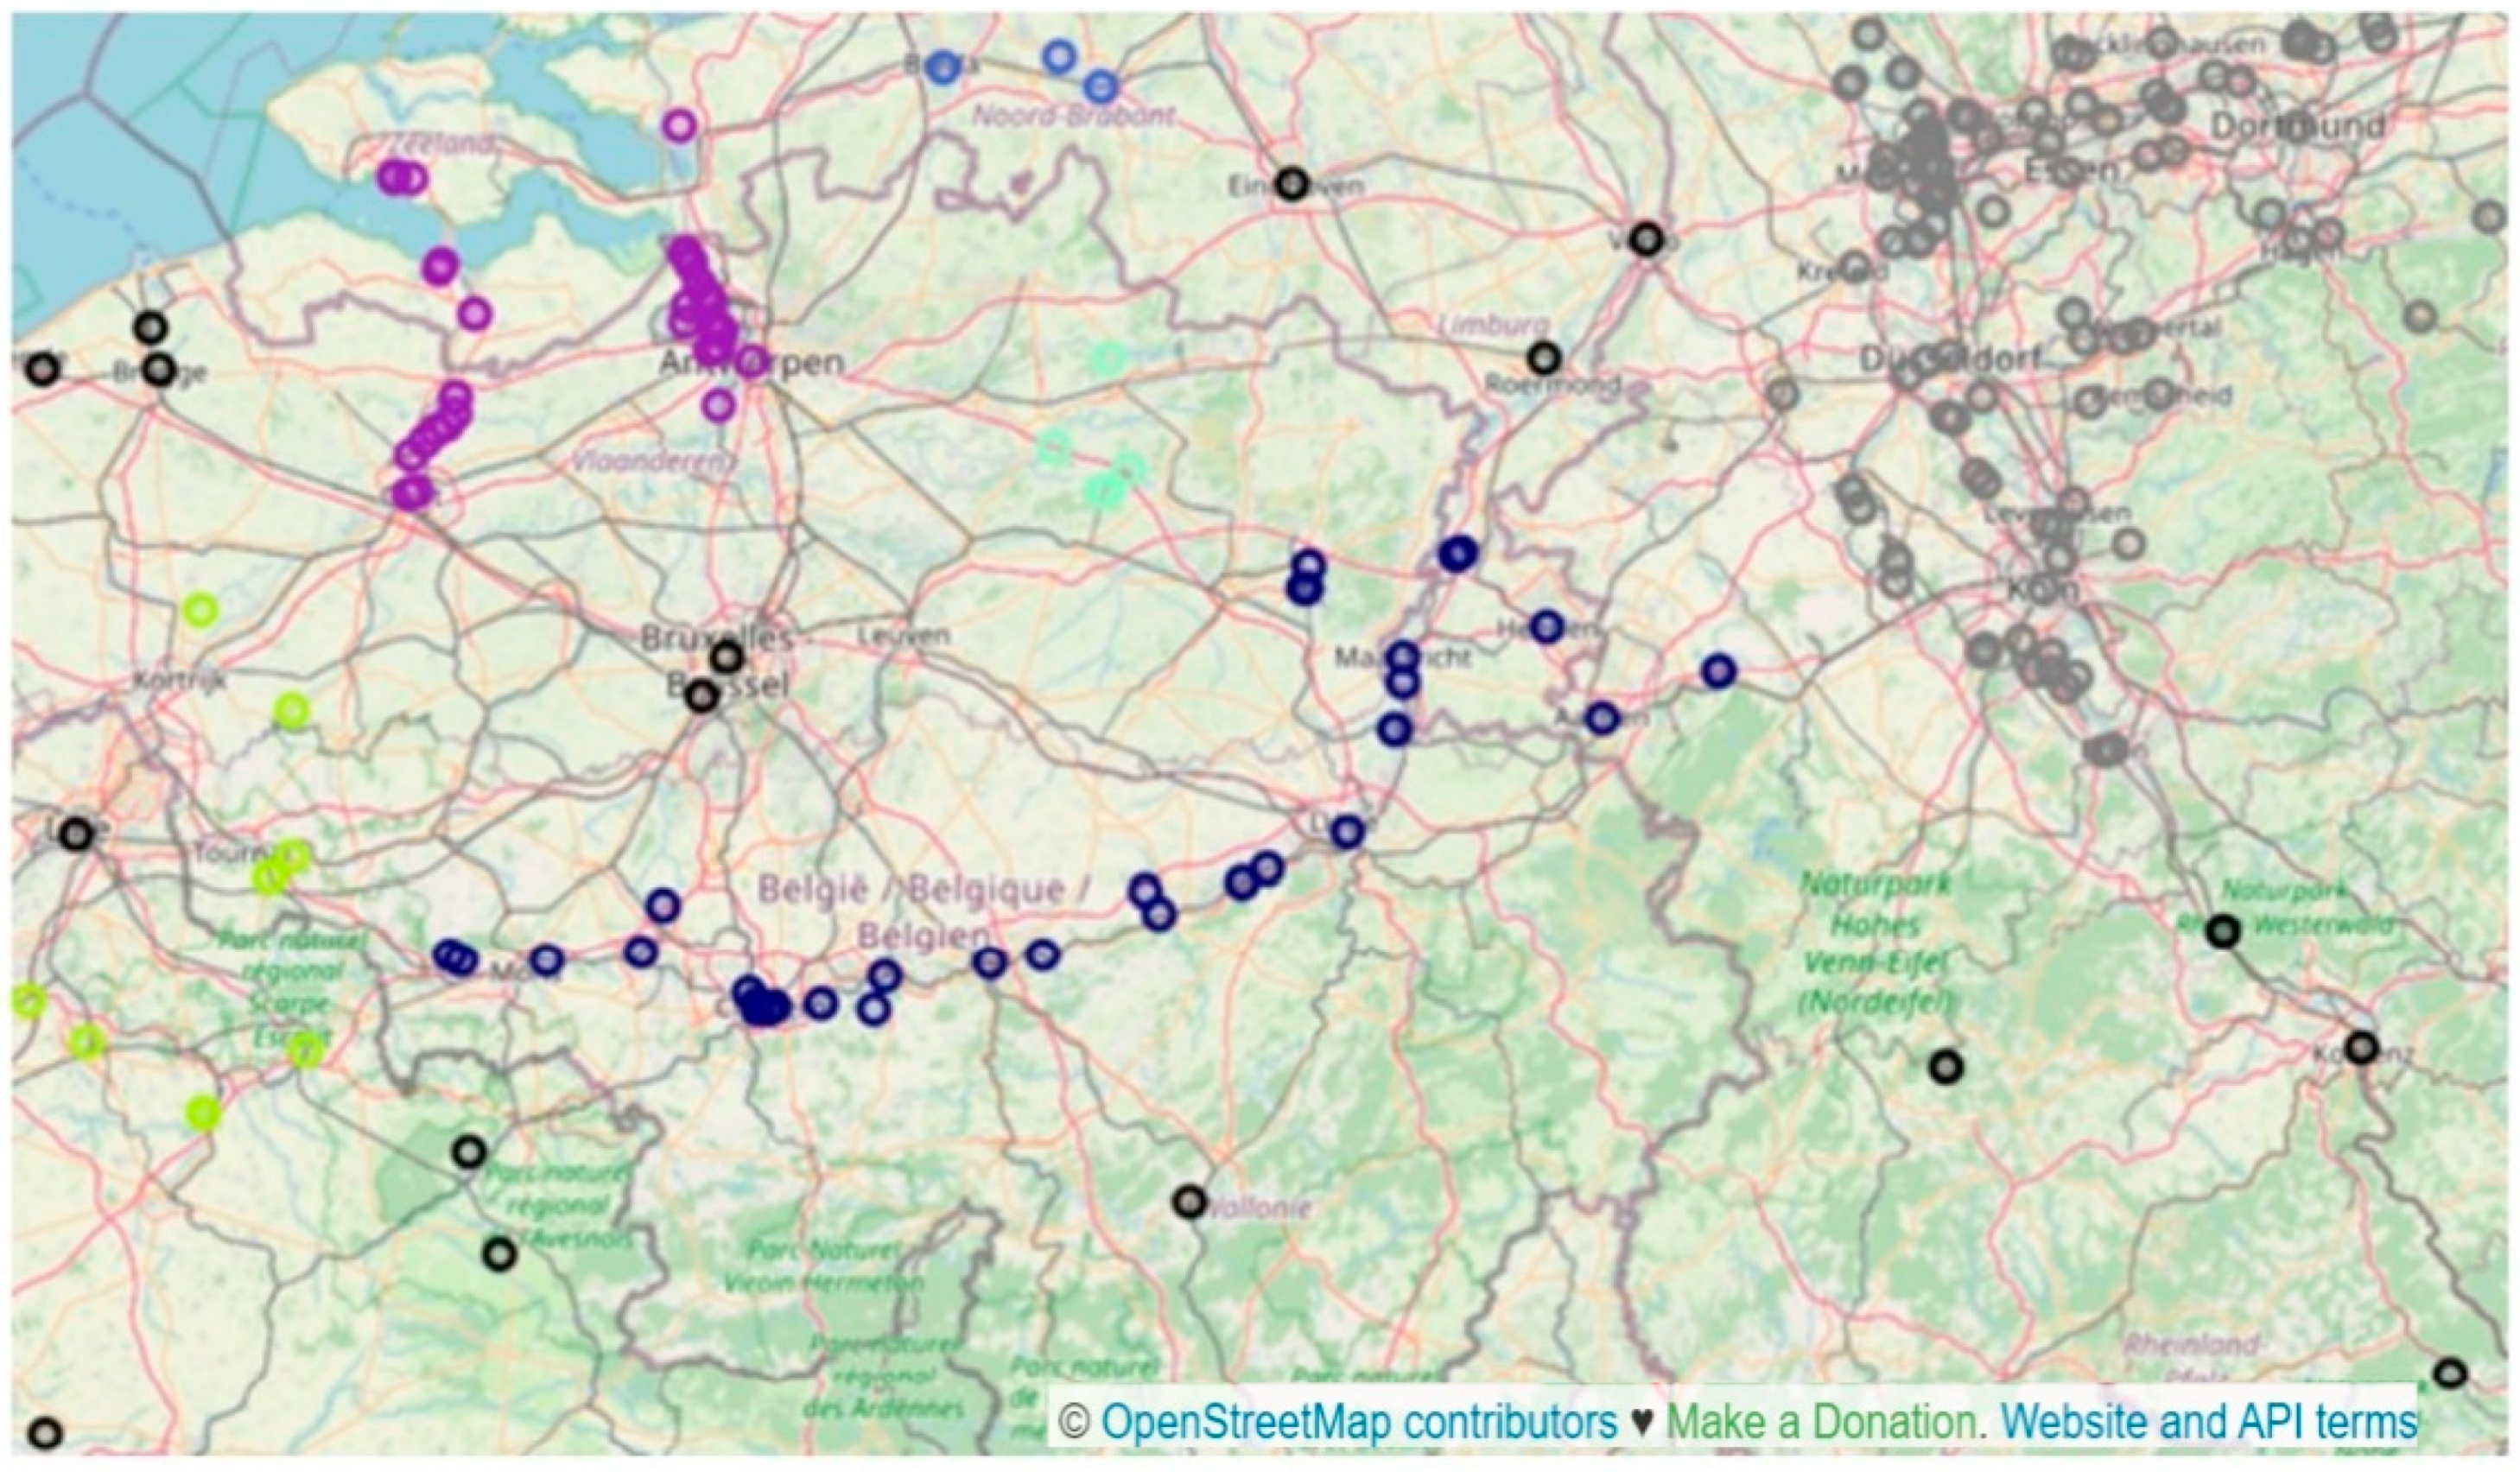
Figure 5 shows the output of the HAC algorithm zooming in on Western Europe [71]. The trilateral industrial zone (western Germany, southern Holland and Flanders) is clearly visible from the plot. The large cluster in western Germany, next to the ports of Antwerp (pink), Rotterdam (purple) and also Ghent (grey), and a long cluster geometry (blue) in the centre of Belgium are identified. The downside to such a chained cluster effect is that the endpoints are distanced further from each other than the data points in other clusters.
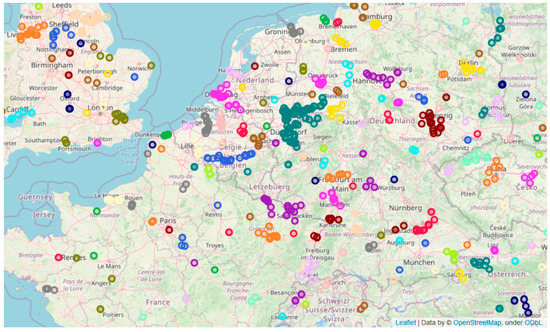
Figure 5.
Visualisation of clusters generated by the HAC algorithm with 25 km threshold.
The algorithm generated 628 unique clusters, with the largest cluster consisting of 103 data points. The silhouette score for the single linkage method with a 25-kilometre range is 0.548. The results with HAC are preferred over K-means because of the ability to influence the clustering based on a distance threshold, and the unnecessity to determine a priori the number of clusters.
- DBSCAN
From the start, the DBSCAN algorithm was considered to have several advantages to make it suitable for the H4C application: the automatic detection of noise and robustness to outliers and parameters are intuitive, easy to set and offer the needed control over the outcome of the algorithm. We chose a range of 25 km (EPS) and five minimum points (minPoints). The distance parameter was chosen based on the input from literature on the median distance for a symbiotic relationship [70]. The minimum number of points is chosen on experimental evidence from previous projects and studies aiming for clusters of a significant size and impact [45,72].
With DBSCAN, 92 clusters were identified using 969 of the 1918 data points, the other half being categorised as not clustered, thus noise data. The silhouette score for these results is −0.0158, because the method is not made to validate noise-labelled points. It assumes that each data point is clustered, thus filtering out the noise would make the score very high because all clusters would be well-defined when non-clustered data are not considered. Alternative internal validation methods are available [73], but they are not applicable for comparison with the other two methods (K-means and HAC).
Regarding the external validation, the DBSCAN results were visually very similar to HAC clustering with the single linkage criterion. The linear cluster is of particular interest due to its unconventional shape (Figure 6). While it may seem undesirable to have clusters in a linear shape, it is clear that all data points are reachable through the cluster core points. A downside of this linearity, however, is that the endpoints can be reached by core points in other clusters, meaning that the locations can be part of multiple clusters at the same time. This makes DBSCAN not fully deterministic [49], but additional testing confirmed that the frequency of returning linear clusters was too low to have a significant effect on the results.
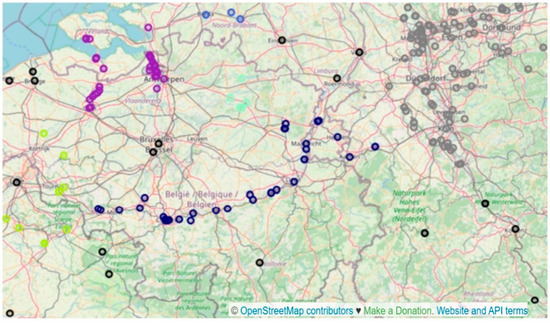
Figure 6.
DBSCAM clustering with radius of 25 km and 5 minPoints, showing various geometries for clusters, identified dark blue cluster along the Maas River.
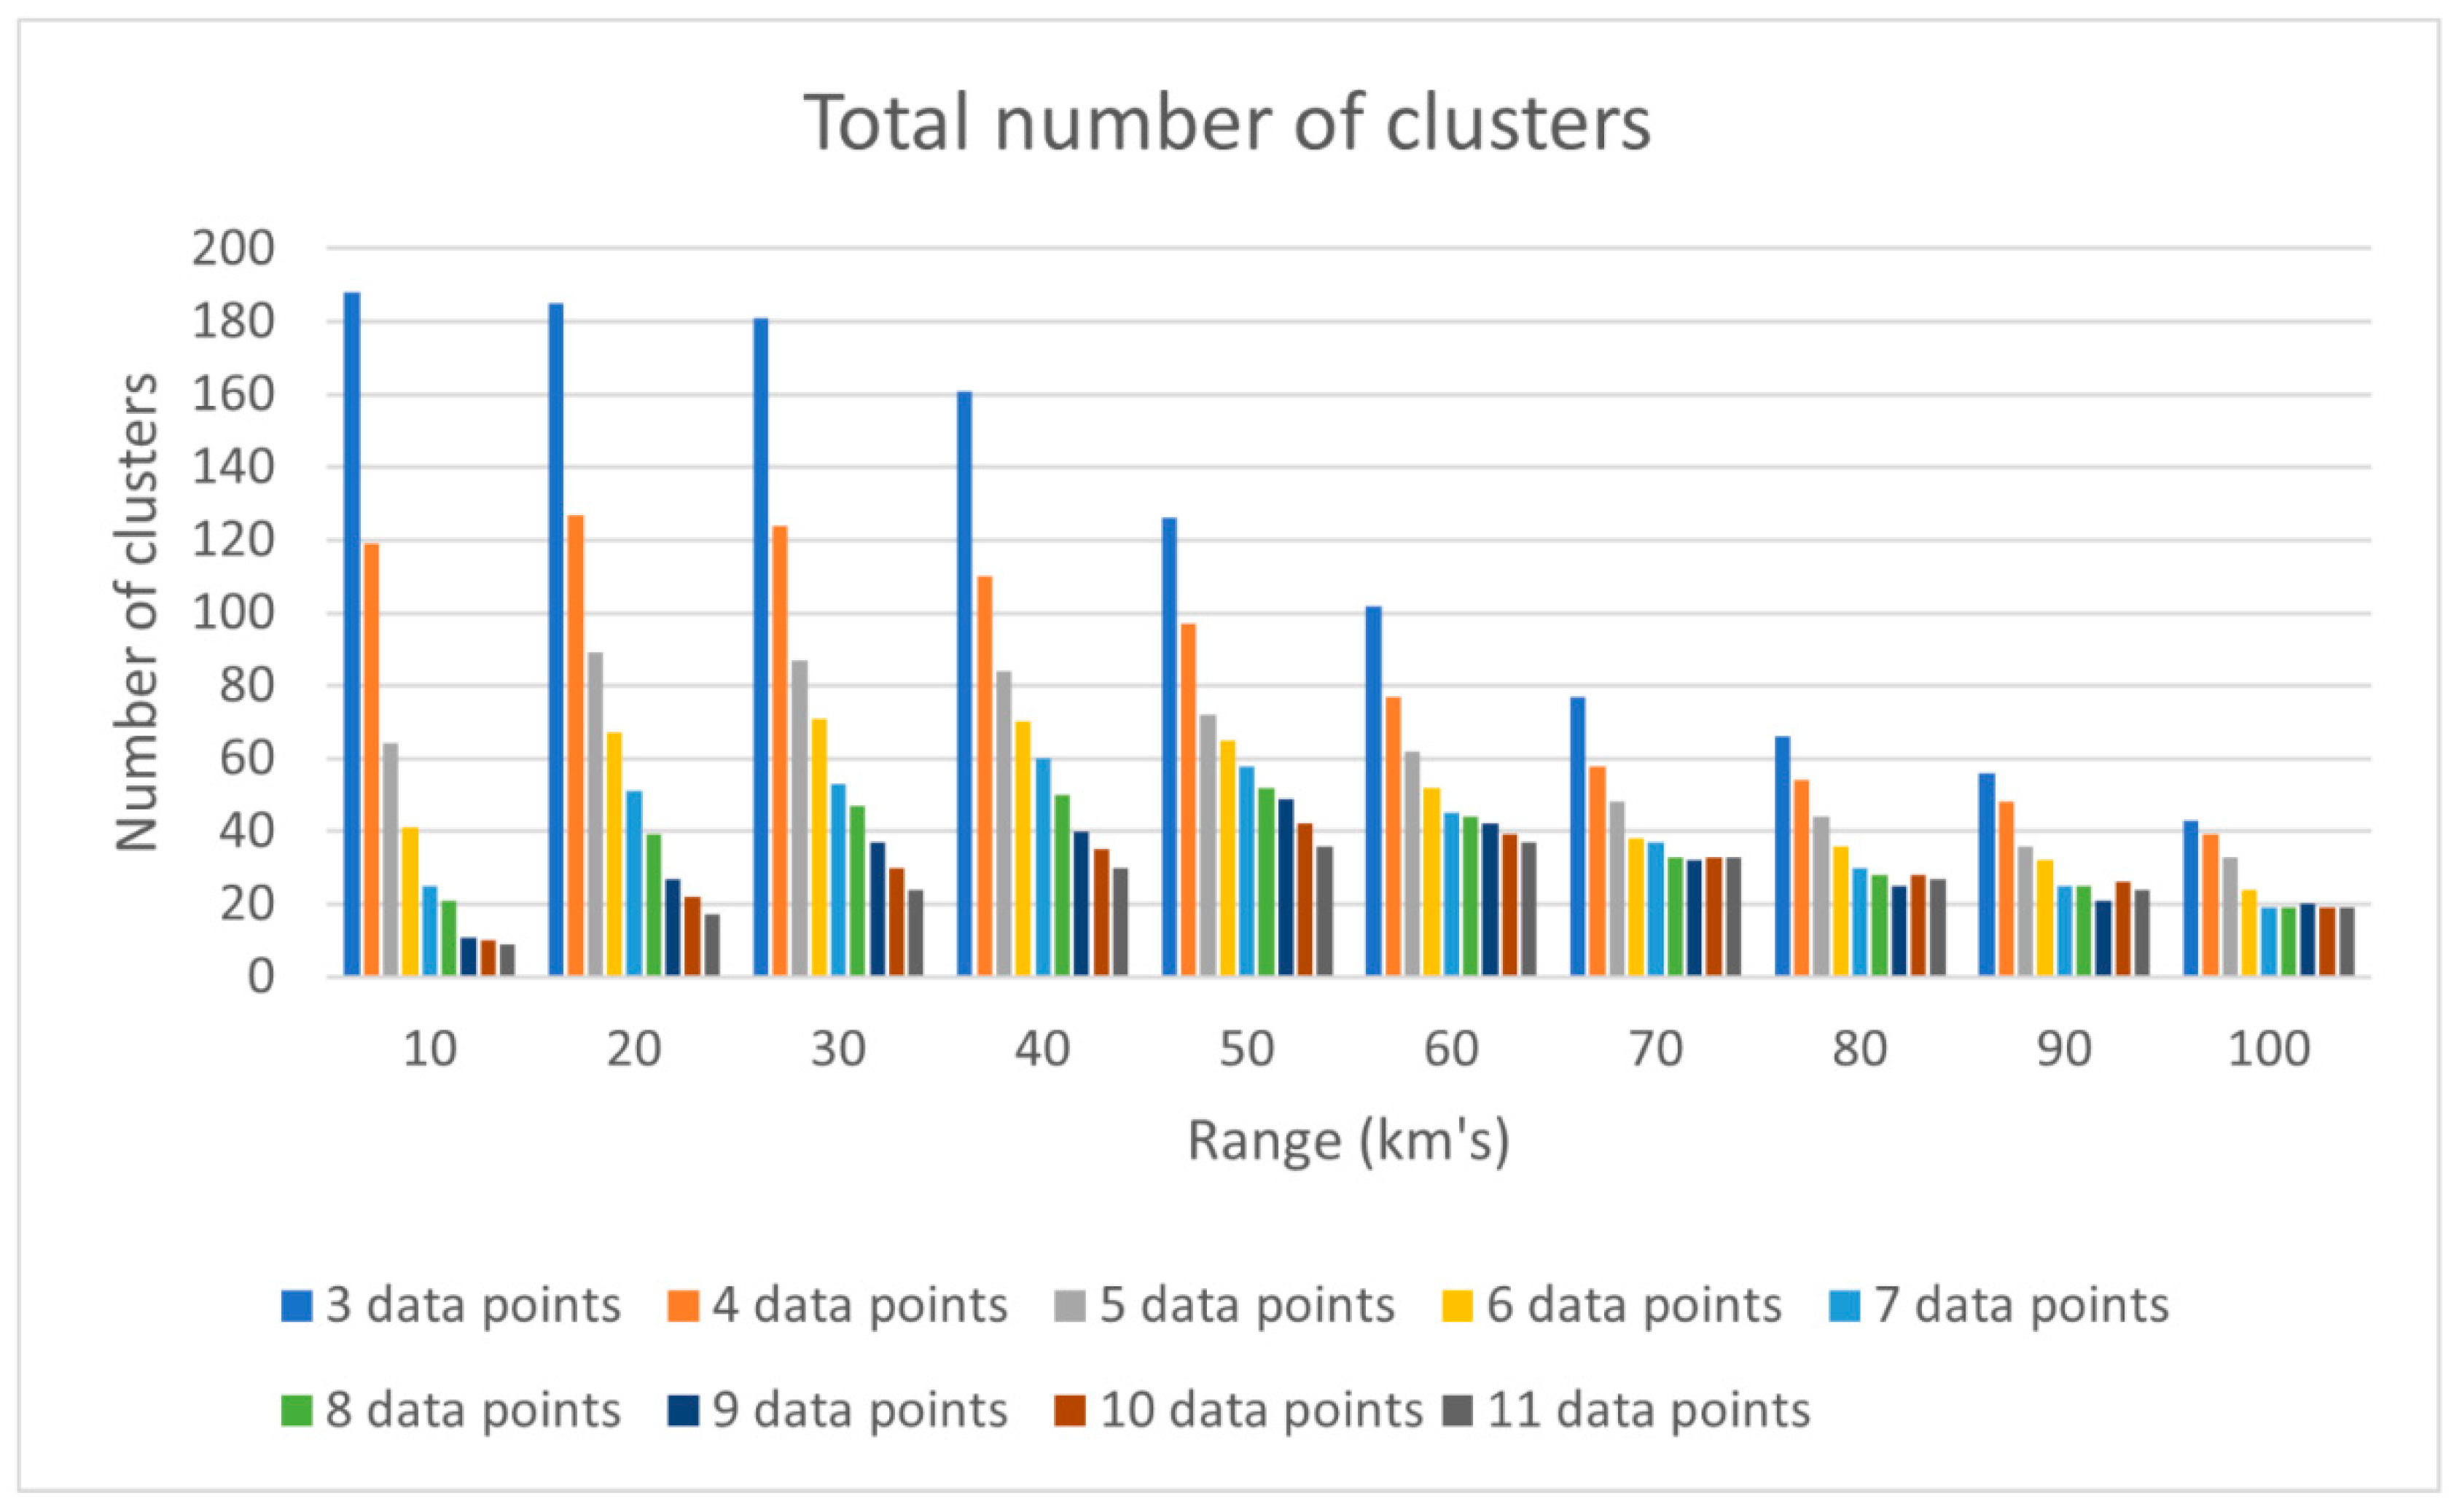
Regarding the relative validation of the algorithm, the results were sensitive to the minimum number of datapoints to form a cluster. This follows the intuitive trends: with an increasing minPoint parameter and decreasing distance between points (range), more outlier data points were identified and less clusters were found; the results being more sensitive for lower numbers of minPoints compared to higher numbers (Figure 7).

Figure 7.
DBSACAN sensitivity analysis, showing a decreasing variation in the number of clusters related to MinPoint (minimum number of data points) for high EPS values (km).
The experiment confirmed that the advantages of the DBSCAN algorithm are manifold: it has automatic detection of noise, it shows robustness to outliers, its parameters are easy to set, and we have indirect and in-built influence over the outcome of the algorithm.
DBSCAN was chosen over the HAC algorithm, primarily because the minimum point parameter in DBSCAN assures that all core points within a cluster are reachable from one another, which is imperative for hubs that aspire circularity. Hence it becomes a condition on the density of data points, an option that is not available when using HAC. The latter gives no guarantee that a minimum number of other data points will be present within a radius around a certain data point.
3.3. H4C Indicators
For incentivising hubs for circularity, we used five indicators in collaboration with Process4Planet [4]: clusters by country, by sector, by synergy, urban-industrial clusters and zero-carbon clusters. The clusters by country and by sector are presented following the DBSCAN output, and additionally by adding cities as actors for clustering. We also show the impact of clusters in terms of CO2 emissions and finally calculate the potential number of synergies for the largest cluster in the database using the matrix of generic cases from the EPOS project [45].
- Clustering overview (size, countries and sectors)
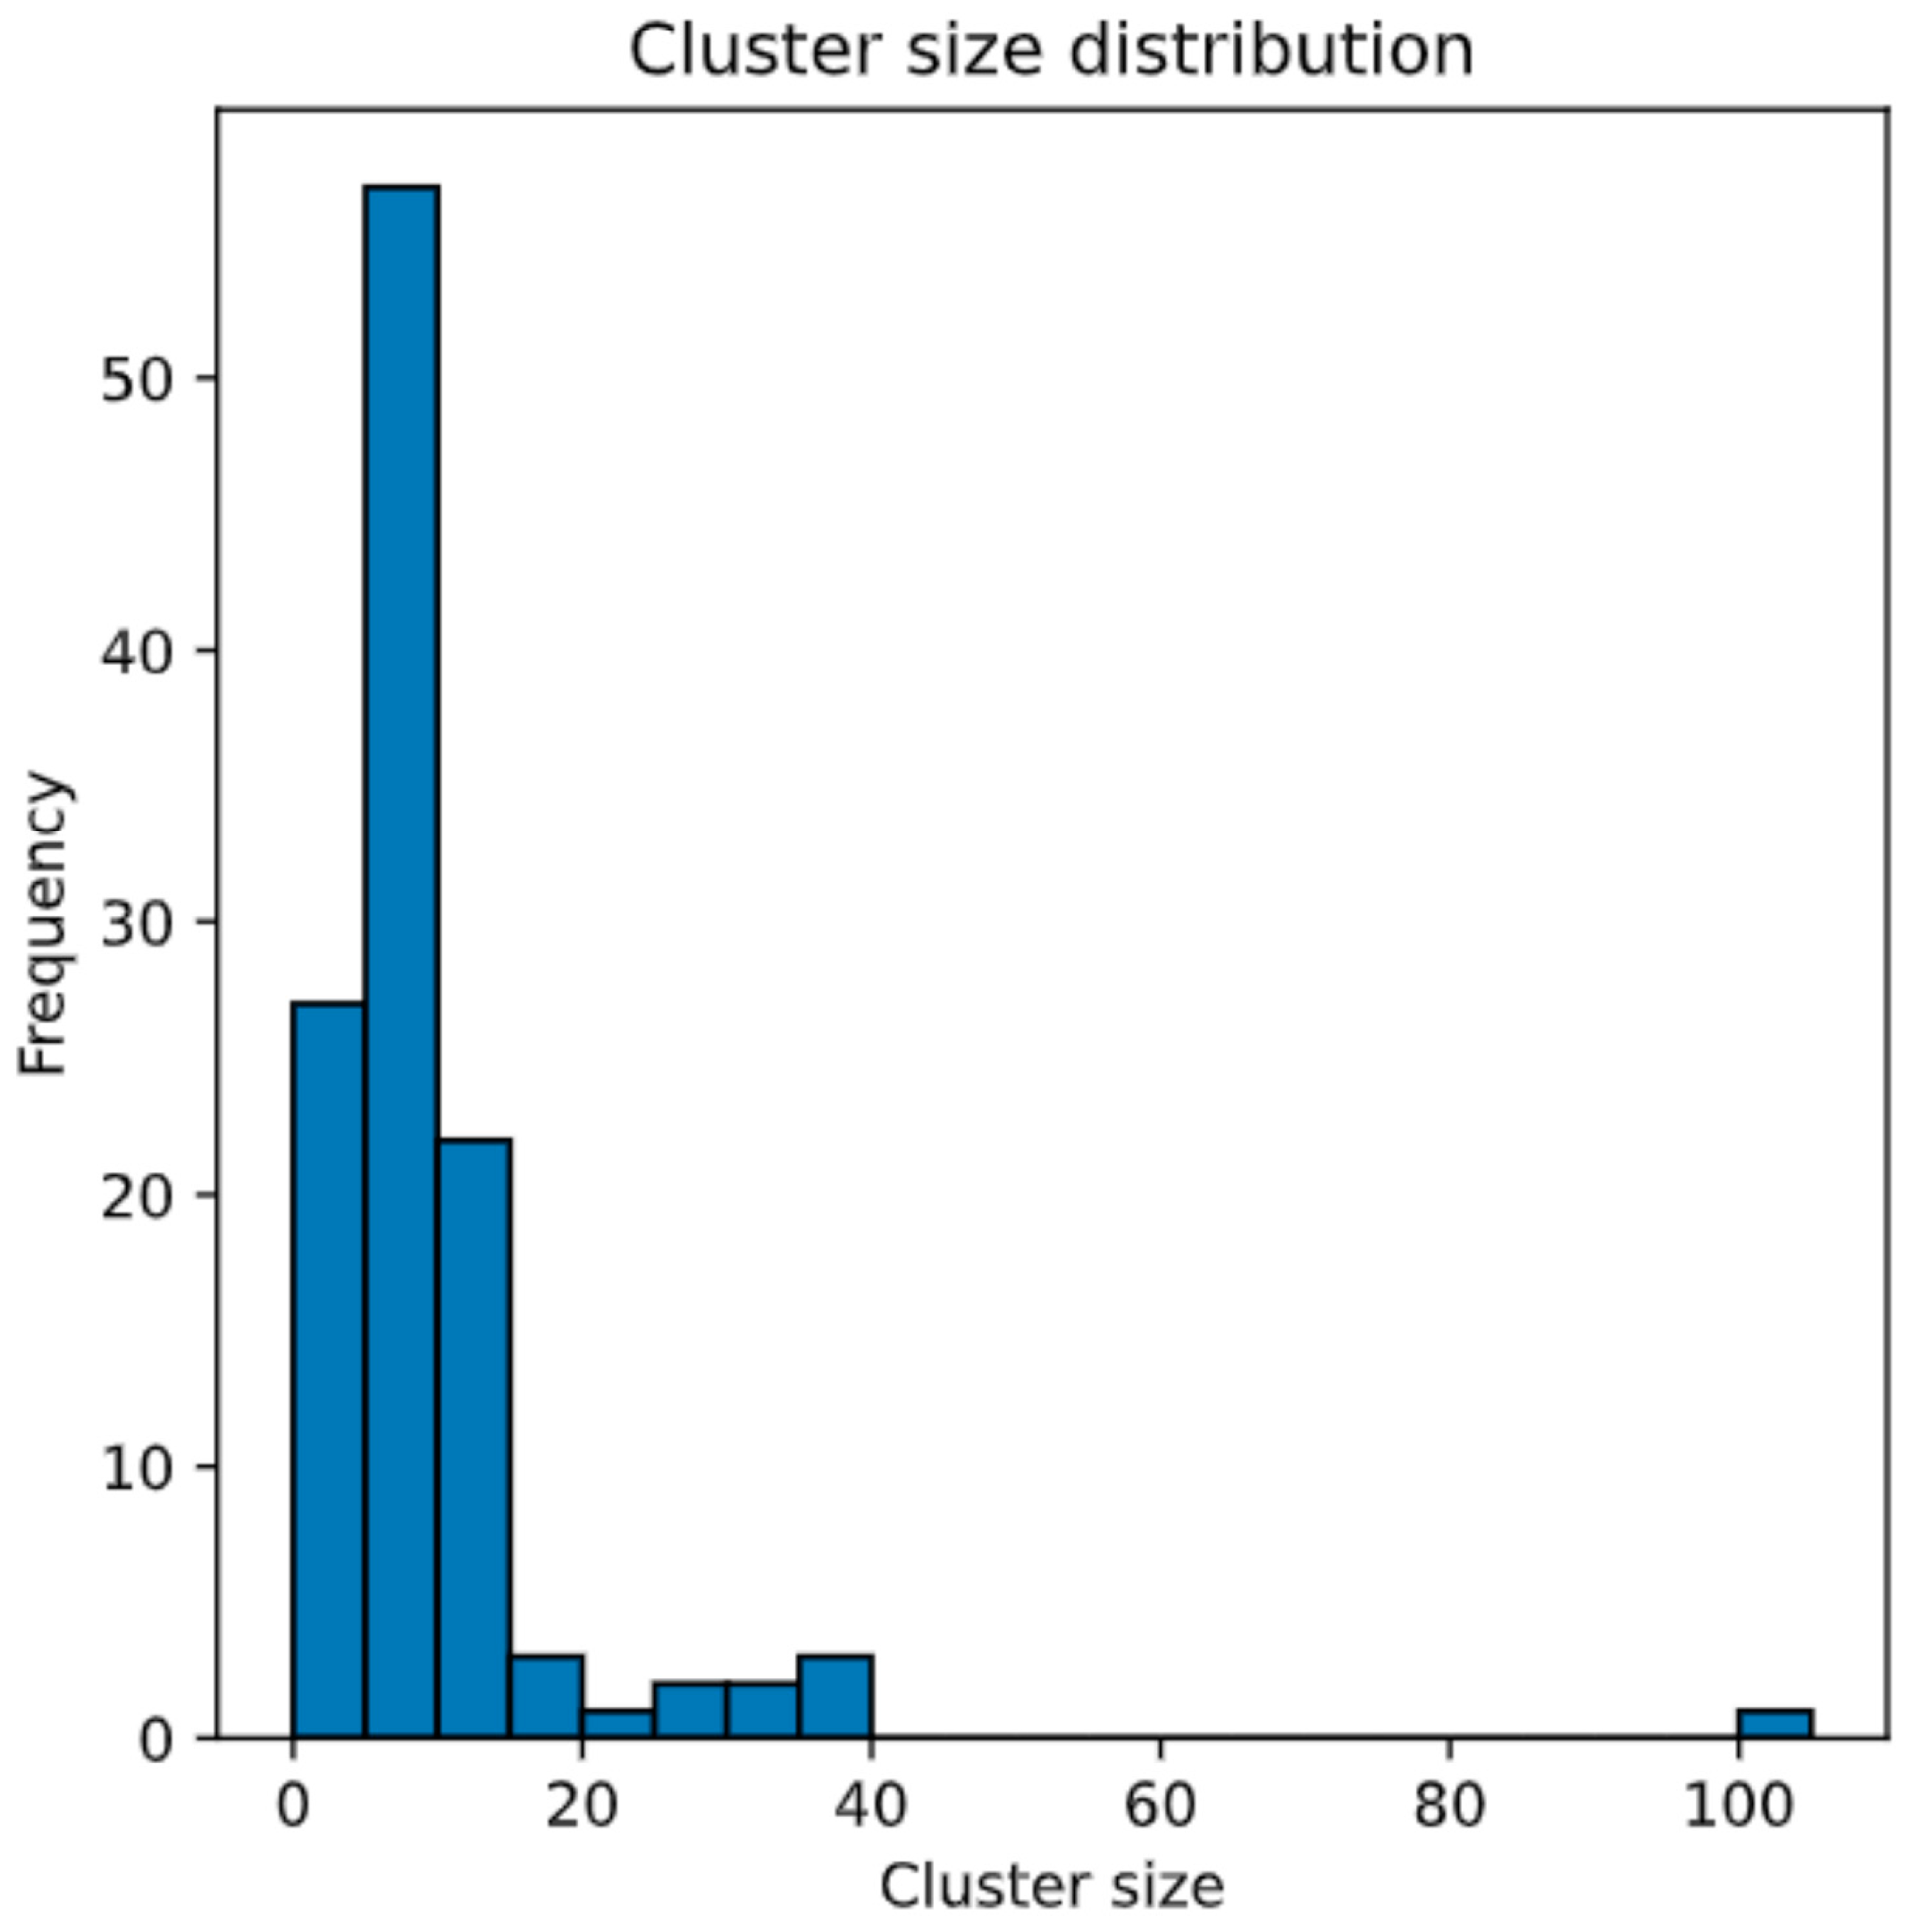
In order to understand the structure of the clustering results, Figure 8 shows the size of the identified industrial clusters, with only eight clusters having more than 20 installations (data points). A prominent outlier in western Germany with 103 data points is shown on the right side of the figure.

Figure 8.
Frequency of cluster sizes, showing an outlier with more than 100 datapoints.
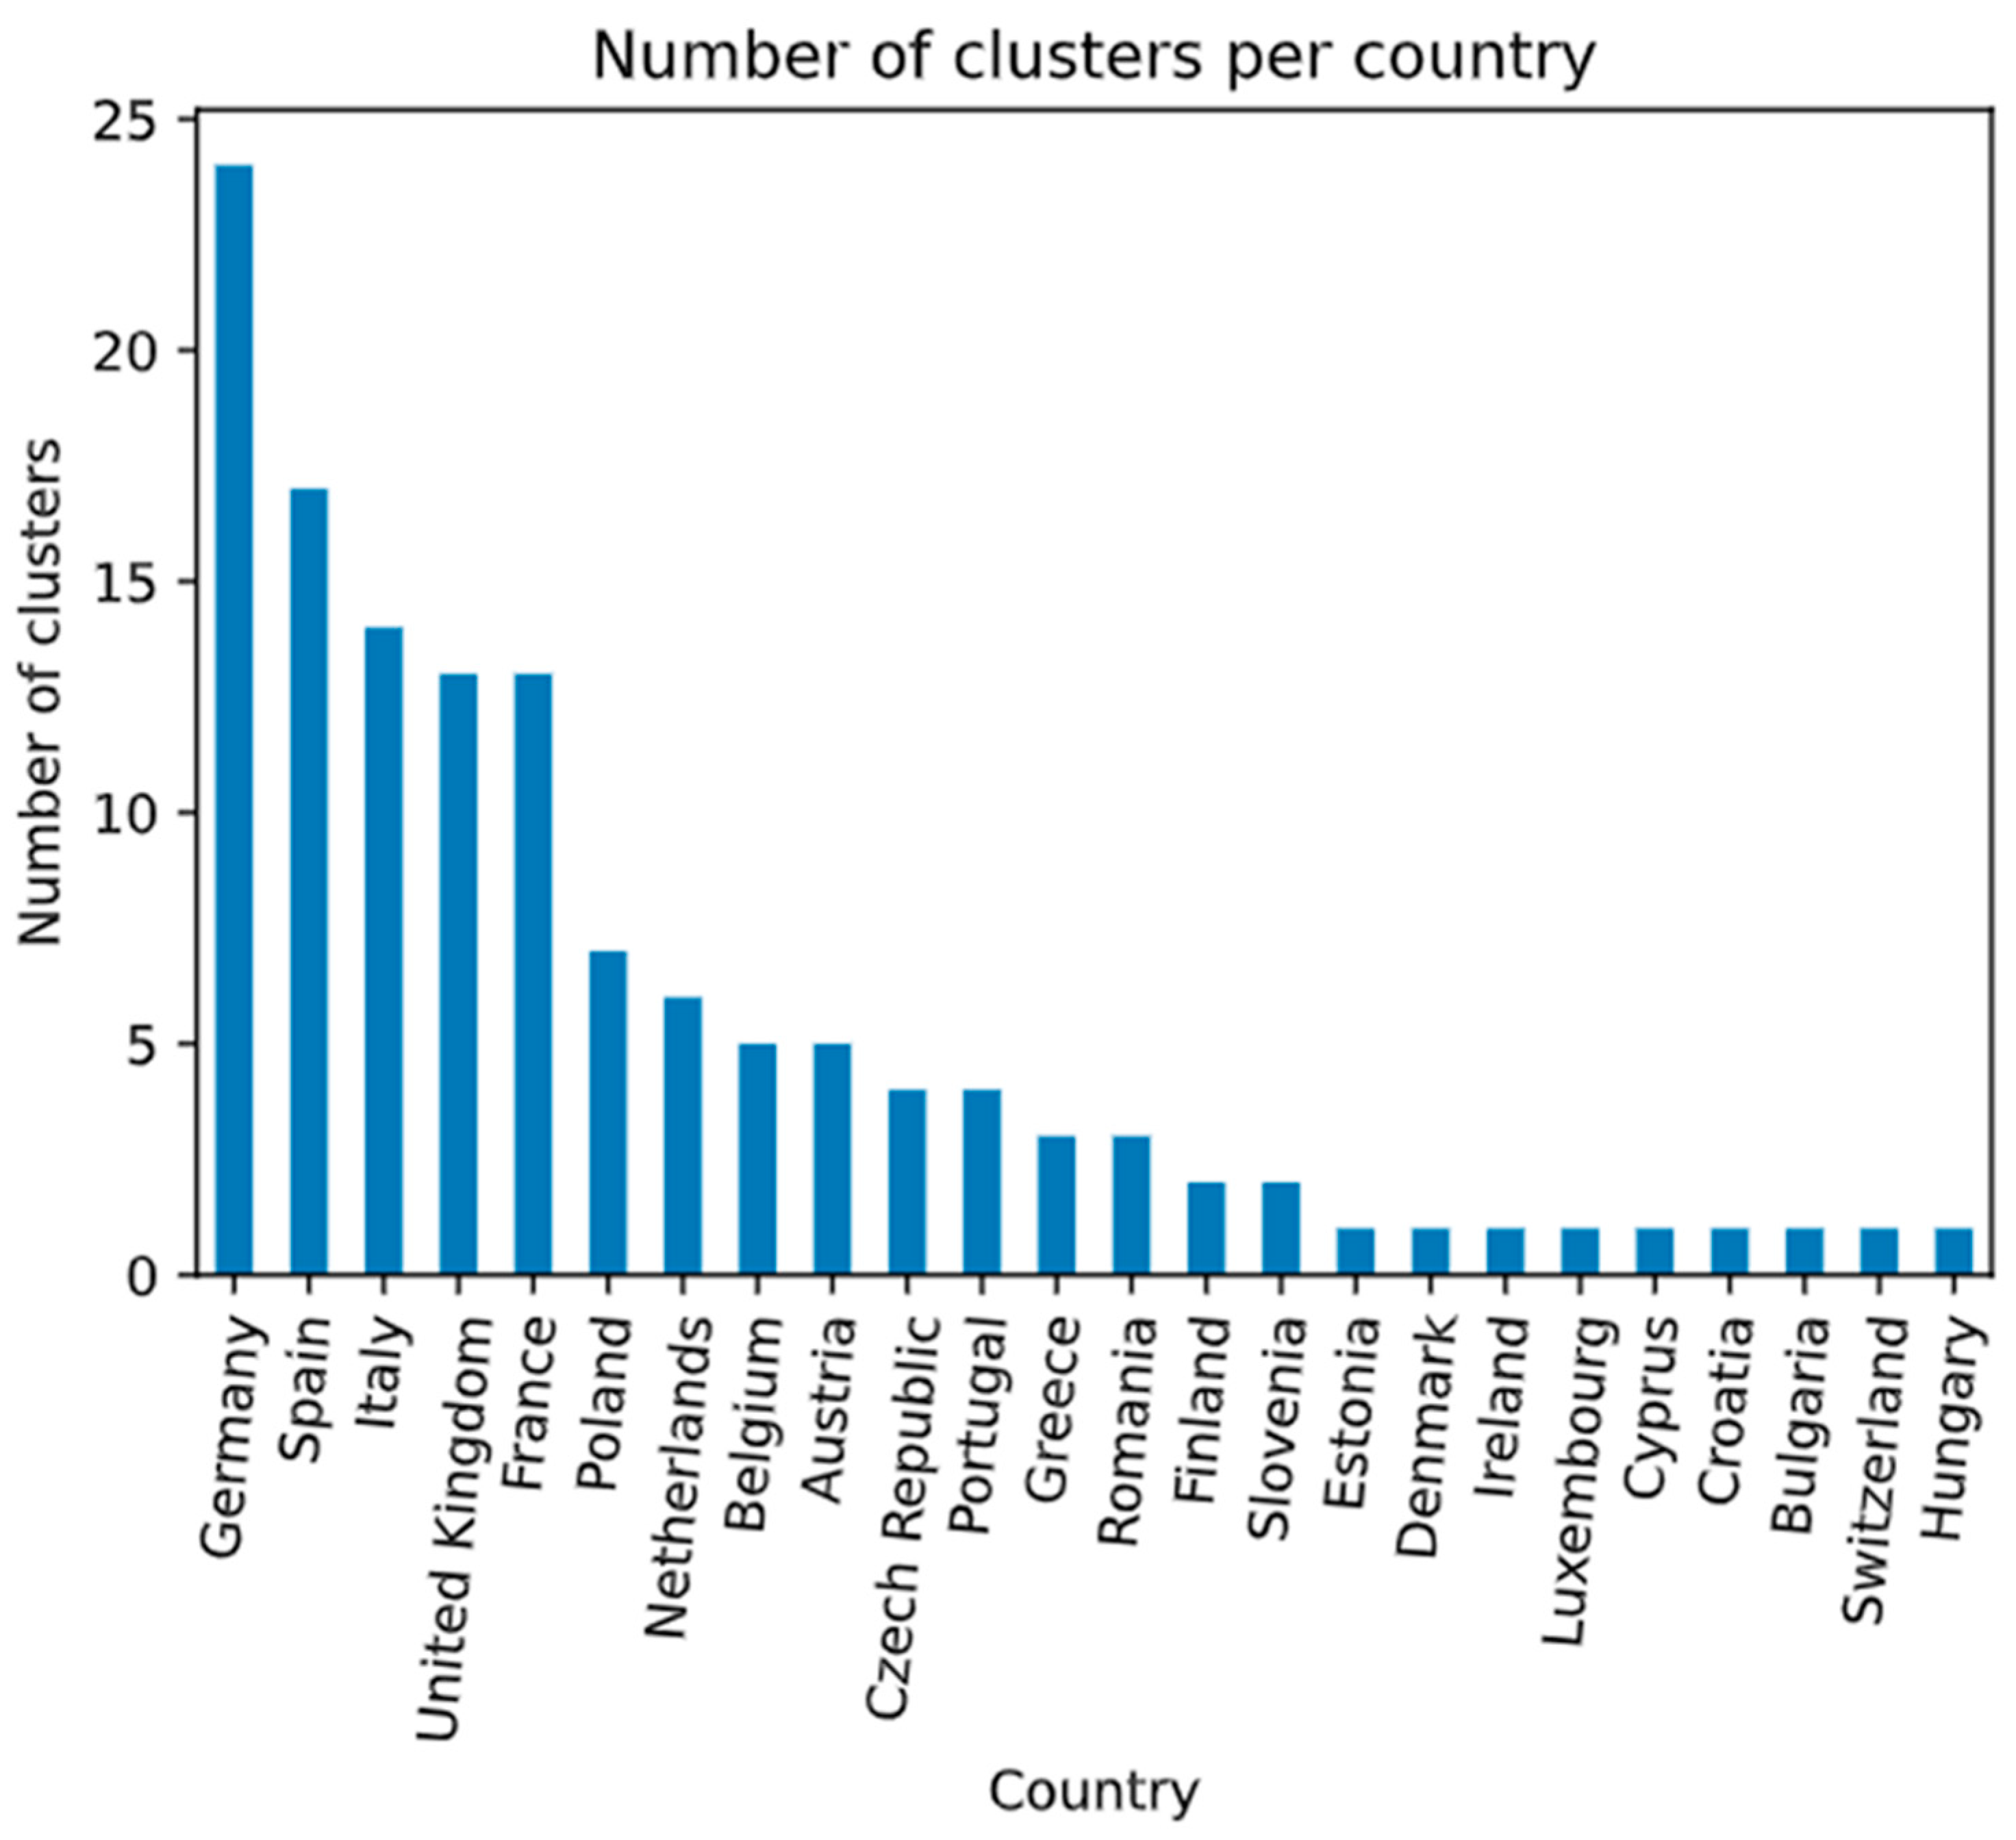
Figure 9 shows the number of clusters per country. Clusters that span over multiple countries are added to each country individually. The figure shows a distribution disparity between western and eastern Europe.

Figure 9.
Distribution of clusters per country, evidencing a disparity between western and eastern Europe.
The largest number of clusters is found in Germany (24), followed by Spain (17), Italy (14), the UK (13) and France (13). Some smaller western European countries have only one cluster, in some cases even involving installations in other countries. We must keep in mind that the dataset is a subset of the total industrial facility population, thus the actual number may be higher, considering sites beyond the subset reported in the database.
Table 2 shows the number of industrial sites clustered per industrial activity and the total number of sites corresponding to each activity in the database. Facilities in aluminium and electricity production, and in manufacturing of cement, lime or plaster all show a relatively low percentage of clustering. They return an average between 45 and 60%, whilst the petrochemical sector scores higher with more than 70% clustering.
Table 2.
Clustering per industrial type, showing some sectors with 100% of their installations in clustered (glues, industrial gases, man-made fibres, ceramic products and precious metals).
- Urban clusters
The addition of European urban zones and cities shows to increase the clustering opportunities. The number of clusters goes from 92 to 119 clusters, implying 254 additional industrial facilities clustered, but also indicating that industrial facilities are located close to cities (Supplementary Materials: Database of cities per cluster.). Therefore, the addition of urban parameters is proven useful for the data analysis, offering the potential for exploring and exploiting urban industrial symbiosis.
Table 3 shows clustered cities per country. The algorithm groups about 40% of the cities. The higher numbers are for densely populated countries such as Belgium and The Netherlands with over 65% of the cities clustered. Countries with low population and industrial density such as Norway and Sweden show limited to no cities clustered.
Table 3.
Overview of the clustered cities per country, showing the countries with the highest percentage of cities clustered (Belgium, Germany and Netherlands, etc.).
- Carbon dioxide emissions
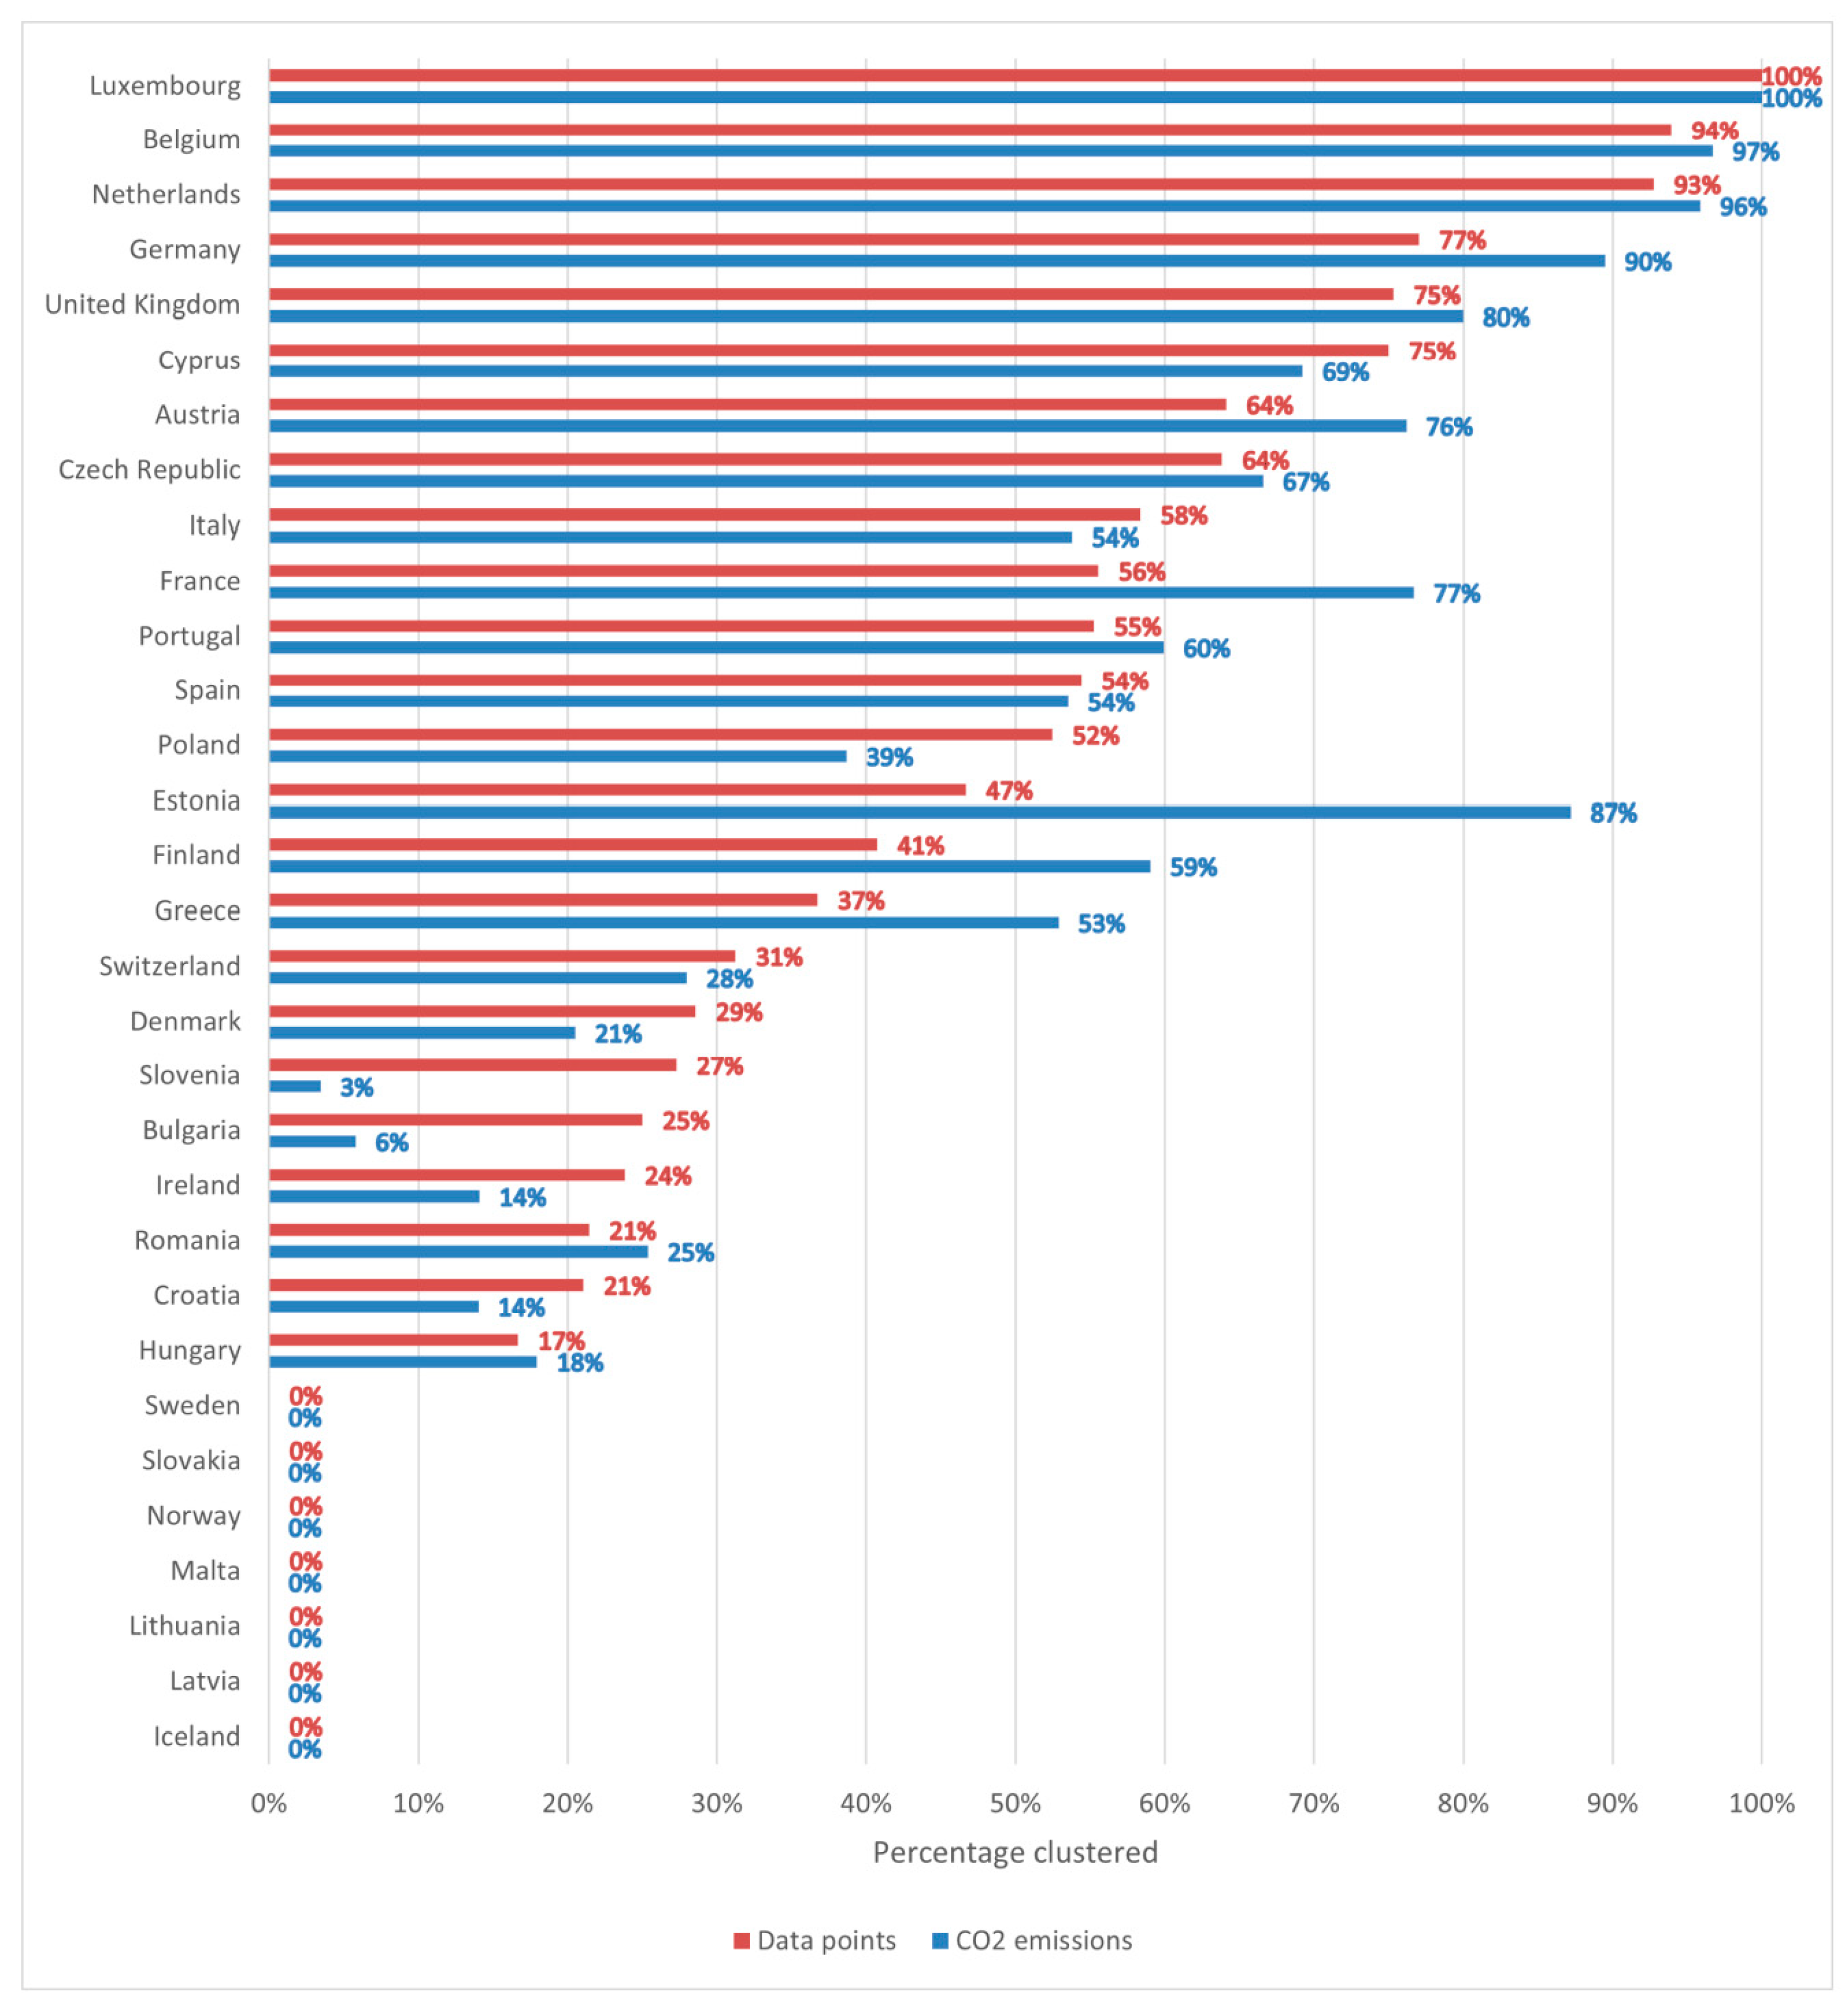
Using CO2 emission data from Carbon4Pur, a pro-rata comparison was made showing the percentage of total CO2 emissions per country in blue and the percentage of industrial installations clustered in the country in red. The Benelux region heads the table with the highest number of groups, indicating the high potential of the region for developing hubs.
France and Germany have a similar profile. In France only 56% of the data points are clustered (red), although that percentage accounts for 77% of the total CO2 emissions. Germany highlights 90% of total CO2 emissions clustered compared to 77% clustered data. This indicates that most large emitters in these countries have the potential to articulate hubs for gaining value from emissions.
Figure 10 shows clustered CO2 emissions per country. A total of 100%, shown in the red bar, indicates that all the datapoints of the corresponding country were clustered. A total of 100%, shown in the blue bar, represents the emission of the clustered installation for that country.
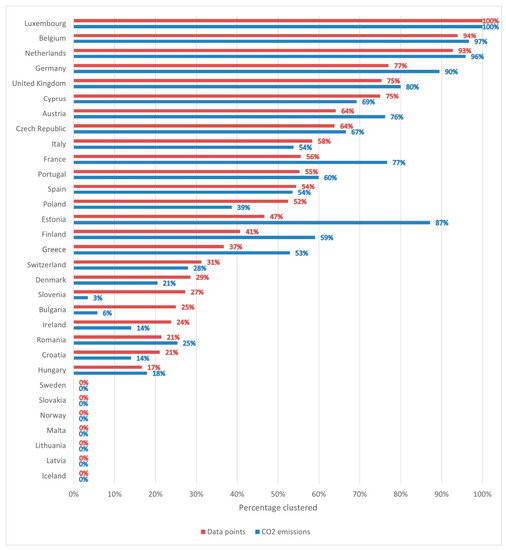
Figure 10.
Clustered CO2 emissions per country, indicating the top countries with clustered installations (Luxemburg, Belgium, Netherlands and Germany, etc), and the corresponding share of CO2 emissions for the clustered installations (blue bar).
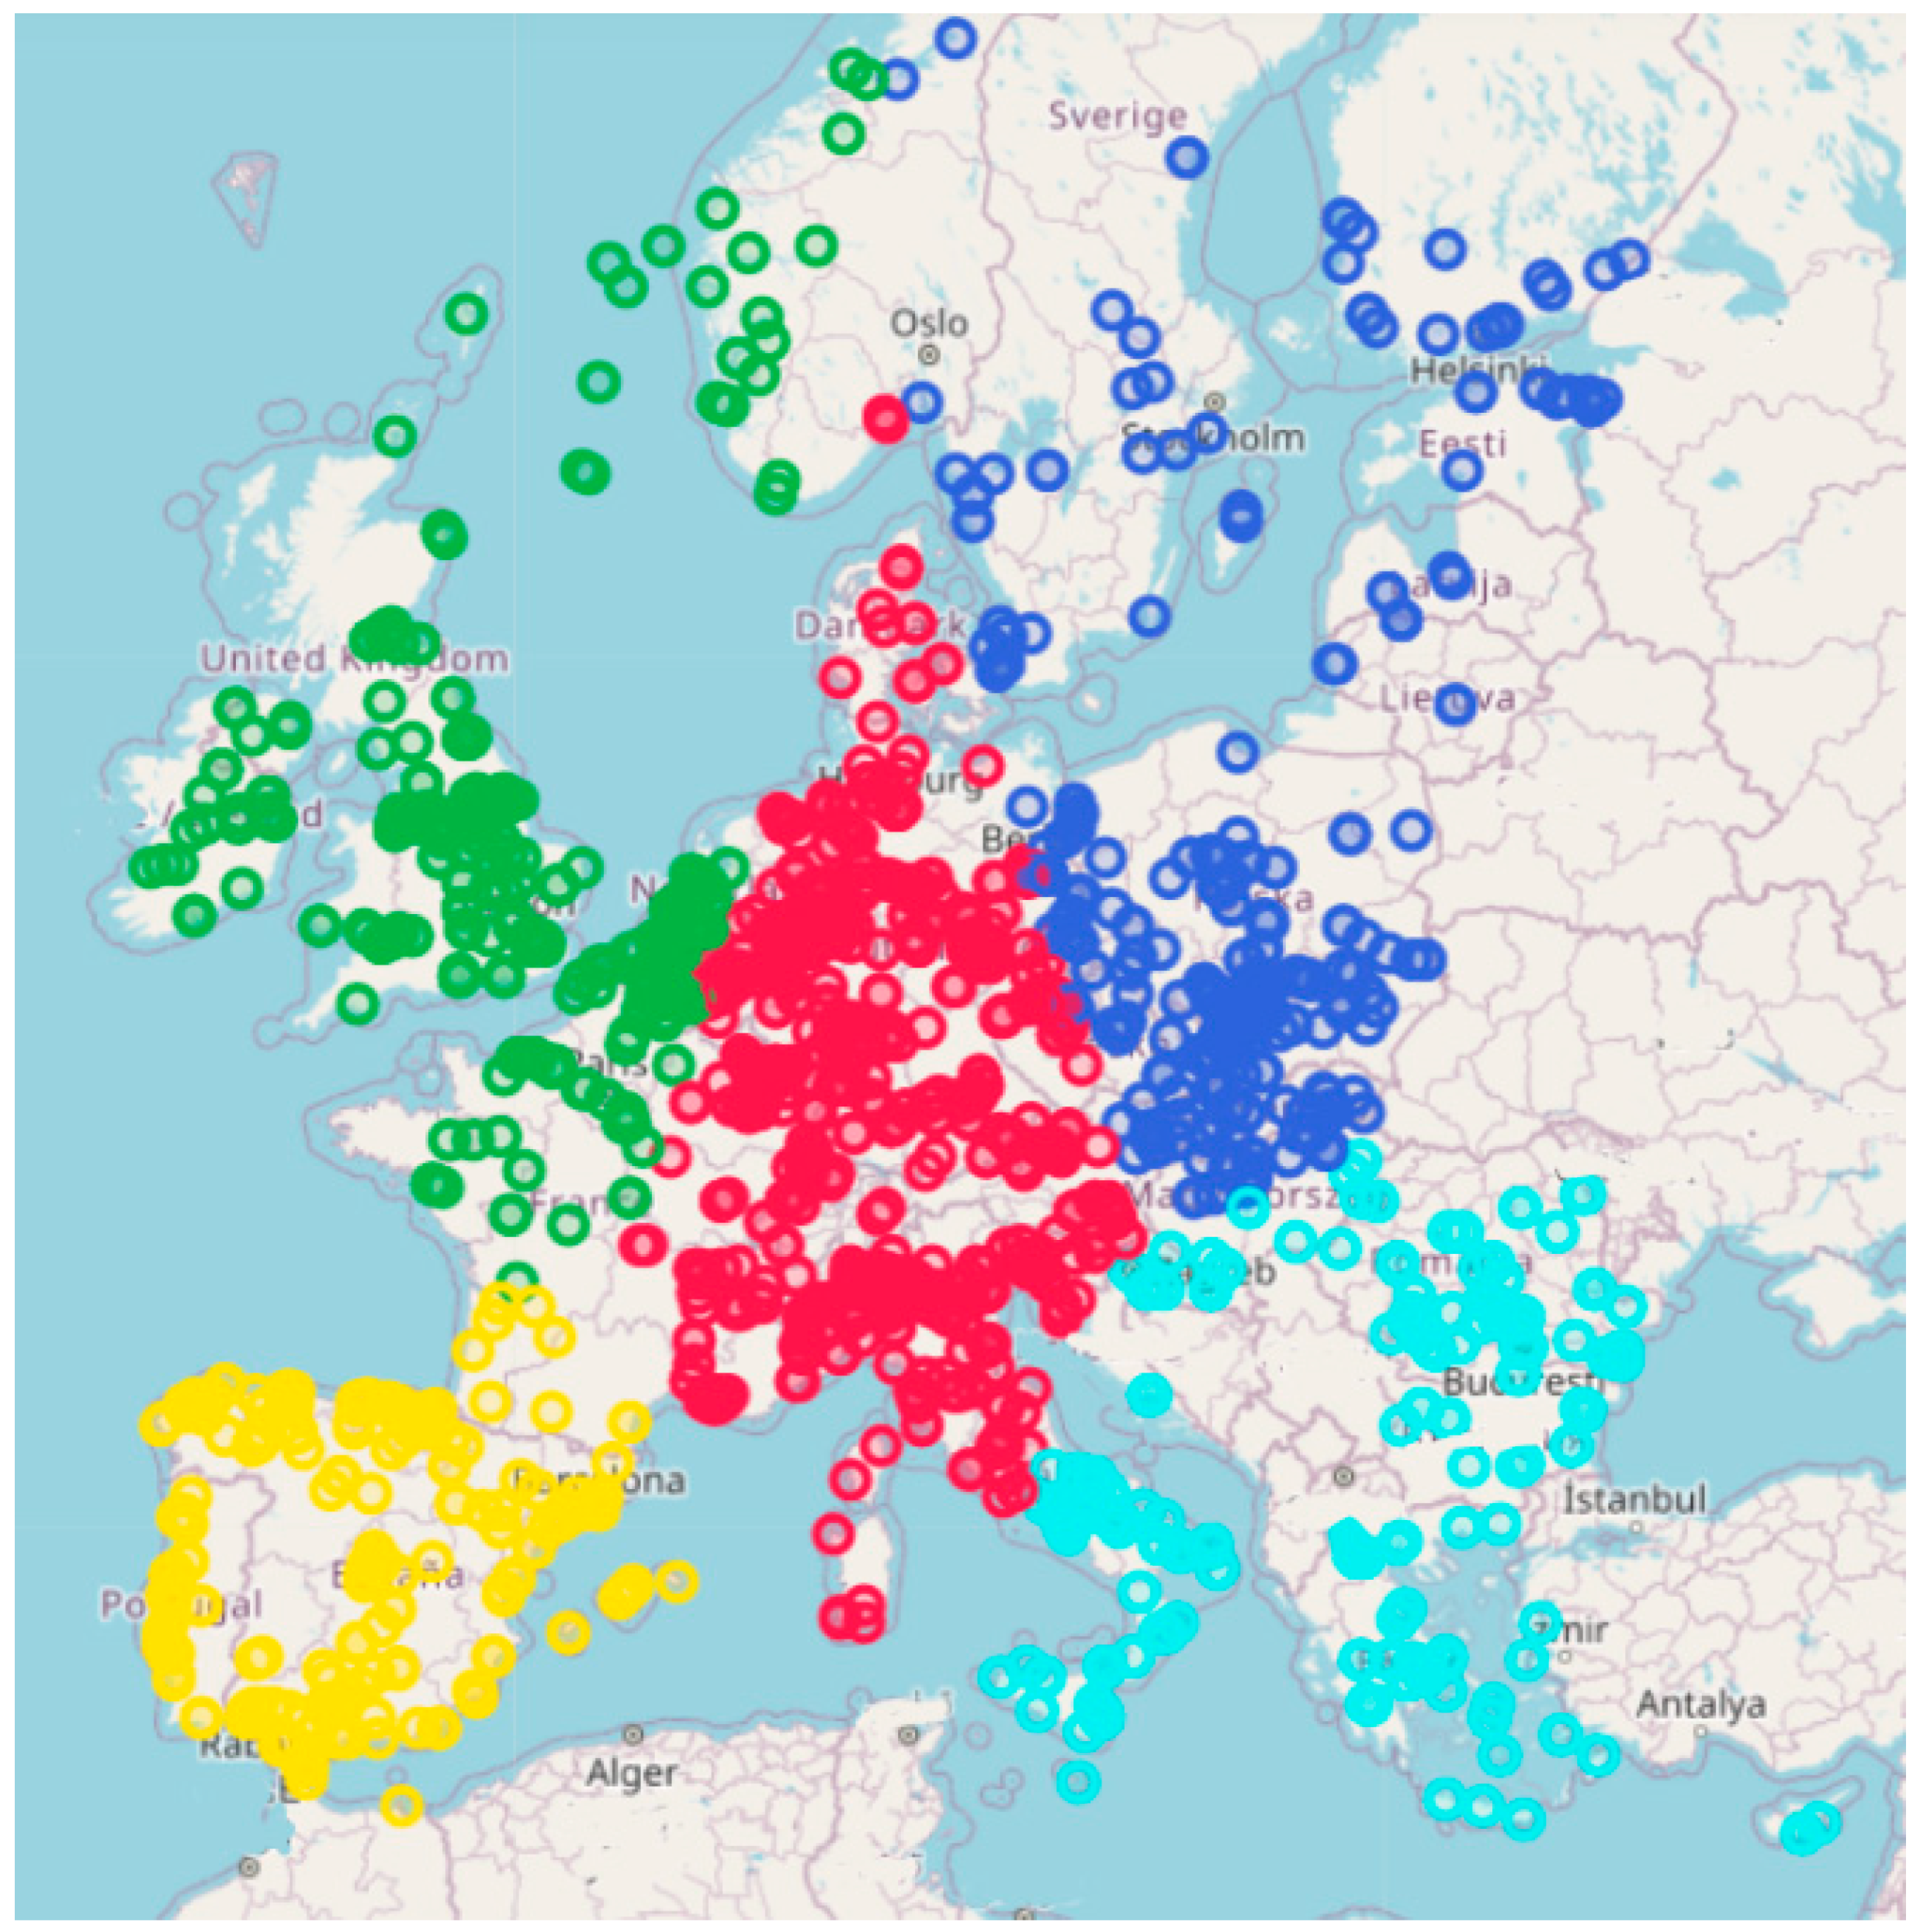
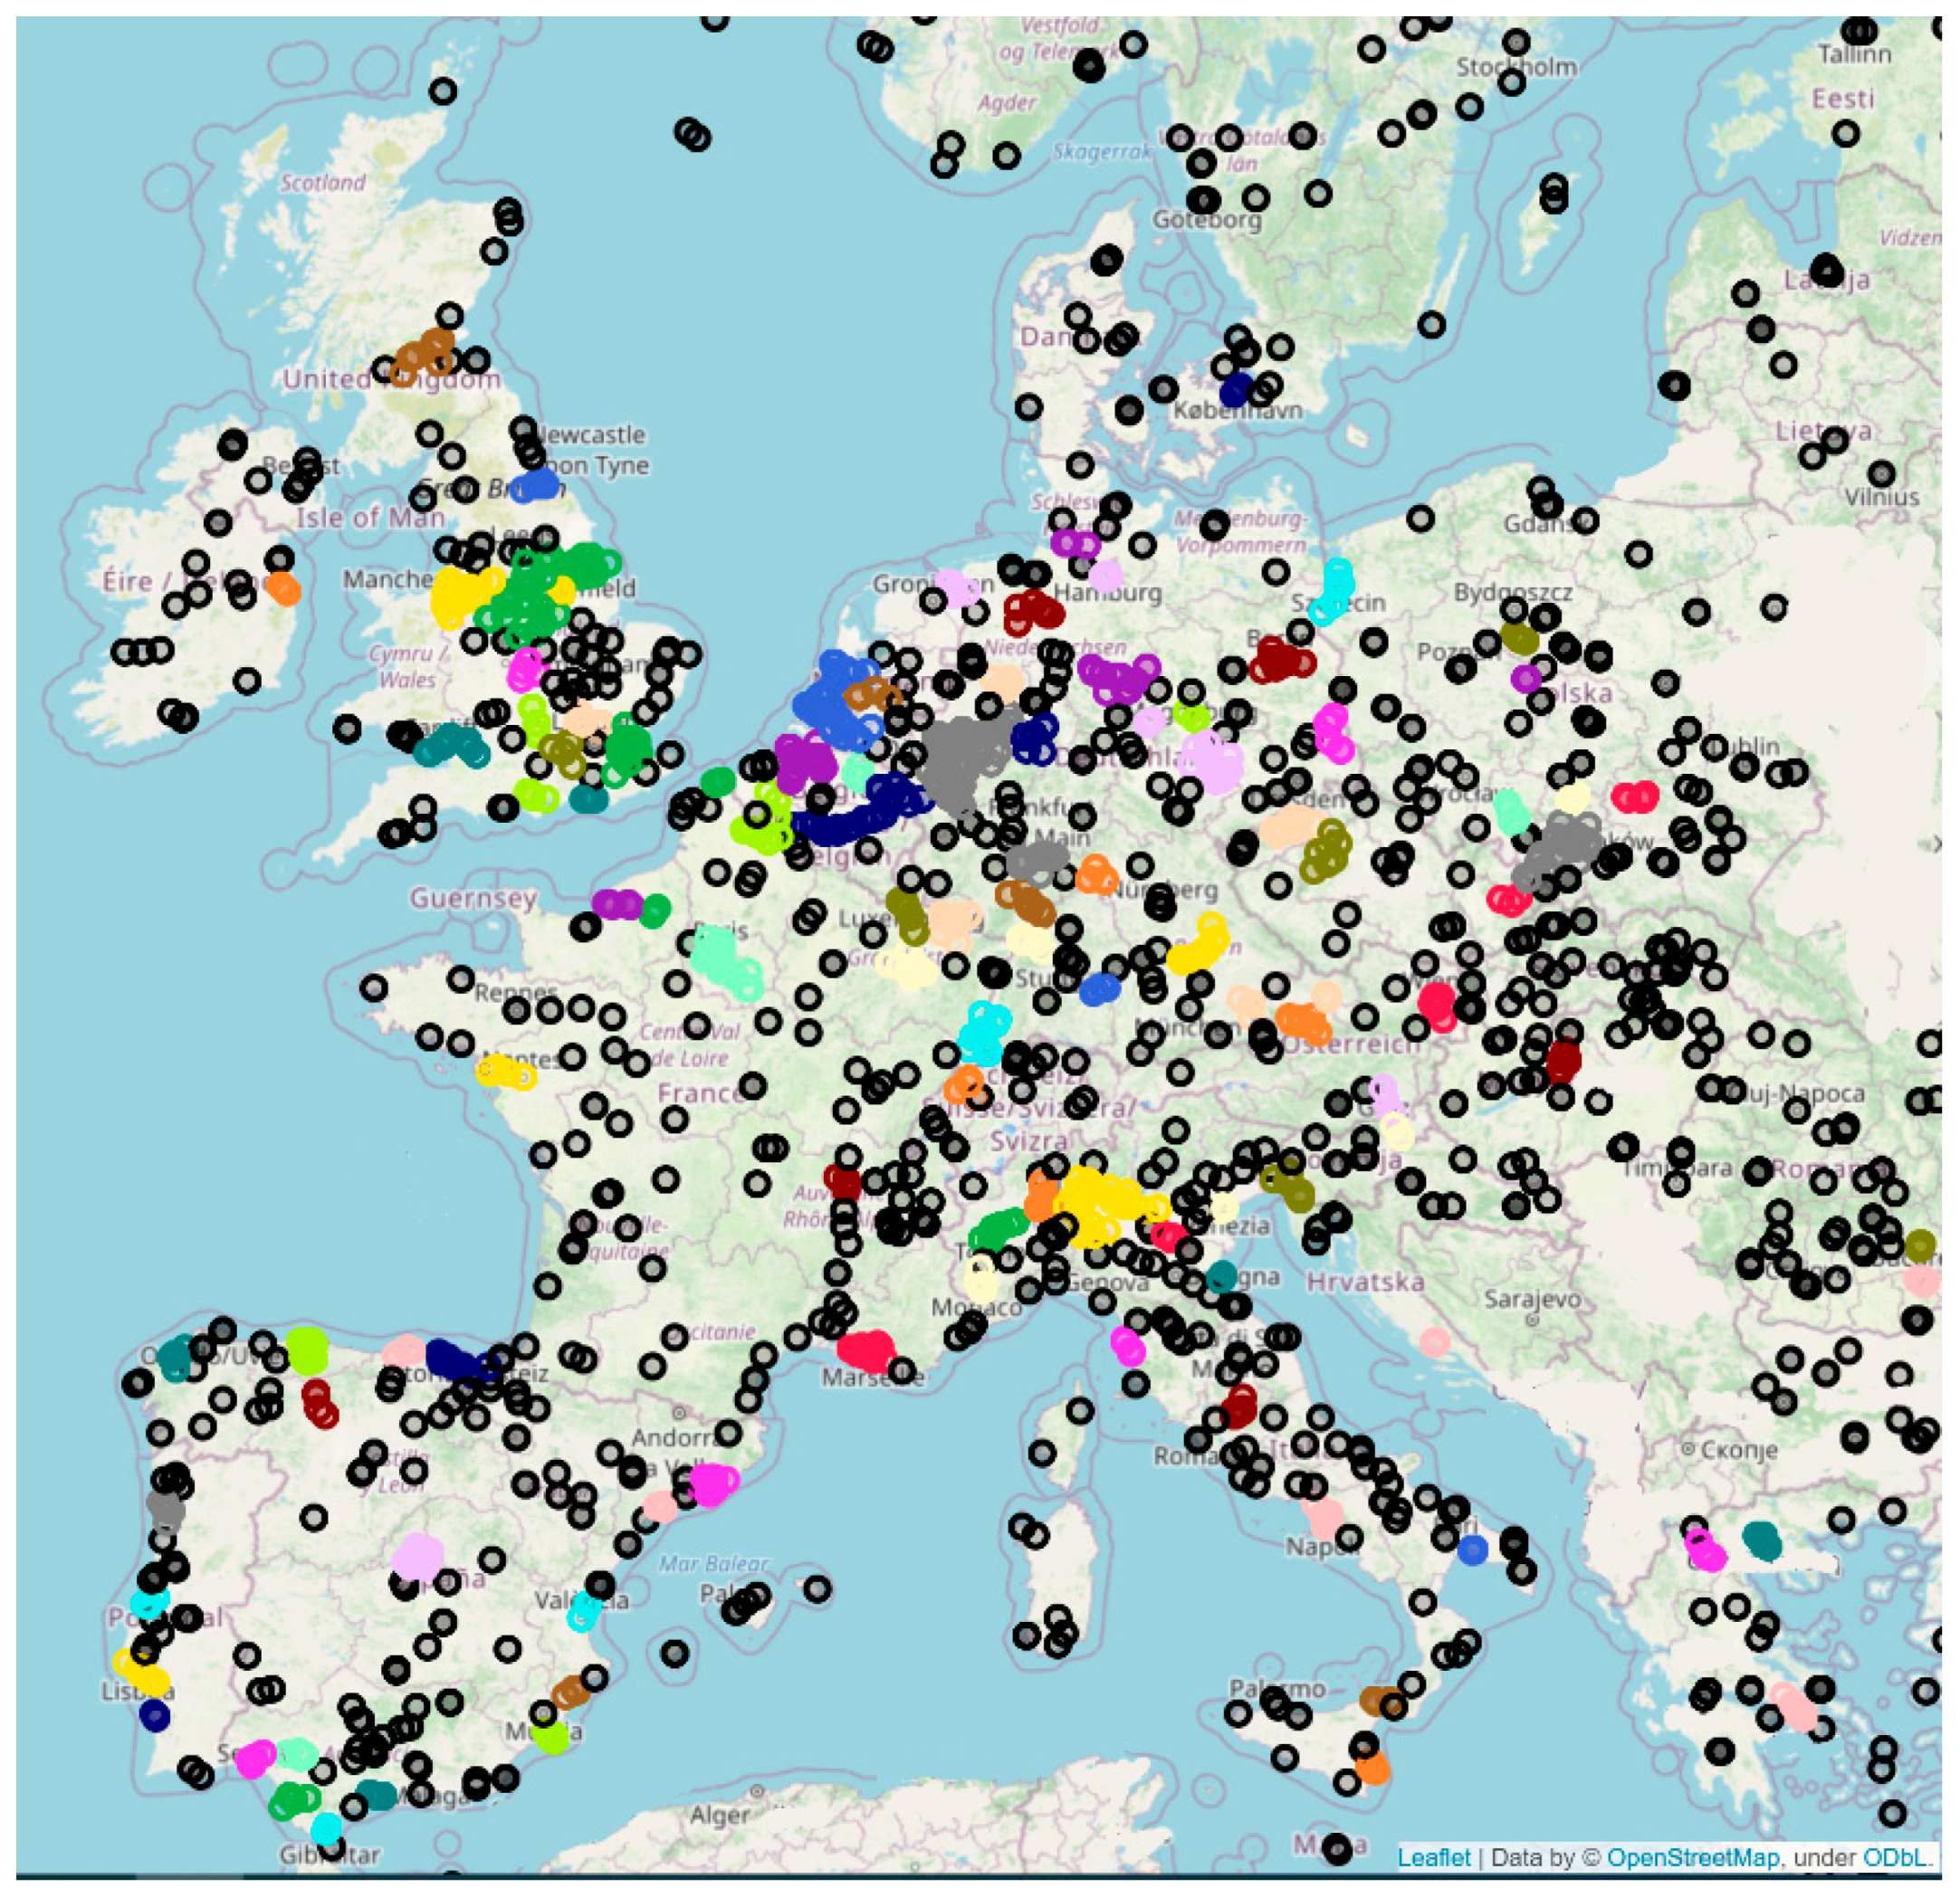
It is observed that the largest CO2 emitters in western Europe are clustered (indicated by the colours in Figure 11 and per countries in Figure 10), while most eastern European large emitters are not (indicated in black on the map). Likewise in southern Europe, various large emitters are seen to be isolated. Such regional differences indicate that the hubs for the circularity concept is likely to vary from region to region, with differing potential to achieve climate and resource neutrality by 2050.

Figure 11.
DBSCAN clustering with radius 25 km and 5 minPoints, where hubs are indicated with colors (non-clustered installations with black).
- Potential synergies
To finalise, we used the cross-sectorial symbiosis matrix from the H2020 EPOS project [45] to roughly estimate the number of potential collaborations between industries of different sectors. We applied the matrix to the western Germany cluster, showing that for several sector combinations, numerous industrial symbiosis opportunities were highlighted. We identified 408 cross-sectorial combinations between sites in the chemical and steel sectors, each combination having 17 different IS cases. Table 4 gives a full overview of the cases per sector pair and the total number of cases in western Germany (cluster #39 in the database).
Table 4.
Synergies overview for the western Germany cluster (cluster id 39) using the generic IS matrix.
This way to quantify the number of potential synergies is the first step towards identifying symbiosis opportunities between different industries in a cluster. The analysis was performed by using a simplified matrix that did not include all relevant sectors nor all potential cases. A more elaborated matrix with more cases and sectors is considered to yield a more realistic synergy potential per industrial facility as well as per cluster as a whole.
4. Discussion
In this section, the clustering results are compared with the outcomes of the H2020 projects and discussed with the view of implementing hubs for circularity. Non-technical factors that are critical to the development of industrial hubs are examined.
4.1. Benchmark of Results
In the EPOS project, a first attempt was made to map the potential for industrial symbiosis in the process industry in Europe using a geographical base [74]. This approach was further developed in the SCALER project, leading to a map of 100 synergy cases involving 18 industrial sectors operating across Europe [75].
A first point of comparison concerns the distance between sites for successful symbiosis. The average distance between coupled sites in SCALER was around 1000 km. Geographical density levels were used in a radius of 100 km computed, arguing that such distance was still within the local transport standards for materials trading [75]. The clustering method proposed in this study enables a flexible selection of distances, currently set at 25 km but allowing for shorter or longer distances. With a 25 km distance, around one third of the emissions do not correspond to clustered facilities for 2017 (Supplementary Materials: Database of industrial facilities per cluster). This indicates that higher distances are convenient to enable a higher emission reduction potential using clustering strategies. Additionally, the proposed method ensures a minimum number of sites in the selected distance, which enhances the possibilities for exchange.
The SCALER study identified several areas of high industrial density based of the number of sites in a 100 km radius: Benelux, western Germany, northern France, northern Italy, Valencia-Castellon and UK midlands. These regions were also detected with DBSCAN, meaning that sites are also surrounded by at least four other sites in a radius of 25 km. Because the E-PRTR database has a central role in both studies, similar results were expected, however, the DBSCAN method also enabled the identification of clusters of diverse geometry at different regional scales. Such clusters often have a connection with geographical presences such as ports, rivers and capital cities, etc. Clusters associated with such can often capitalise on similar strategies to develop a more efficient hub implementation. In Figure 6, the algorithm identifies the dark blue cluster along the Maas River flowing from Belgium to The Netherlands.
In terms of industrial symbiosis, the SCALER results present a broader top-down approach while this paper enables a more local bottom-up approach. The SCALER project mapped 39 synergies involving 18 sectors at the European and regional level, missing the local cluster level. In this paper, a more focused approach was used, mapping 20 synergies covering five sectors for a specific cluster. Such an approach can be used to explore the potential of cross-sectoral collaboration in any other cluster, complementing the results of SCALER and providing a specific methodology and database to support further research that promises relevant benefits for the regional development. According to the broader SCALER study, the potential benefits are situated in around EUR 22 billion of added value, EUR 5 billion of added tax, 230,000 new direct jobs, EUR 11.5 billion in savings related to waste management and 2.5 billion m3 of water saved [75]. In addition, the symbiosis implementation would save around 91 million tons of CO2 [75].
A fundamental remark towards both the SCALER and the current study is the database used to identify hubs. E-PRTR lists installations in terms of energy and emissions, but there is still a significant number of industrial installations not included due to a smaller size or lower level of energy or carbon intensity [75]. These industrial sites also need to be considered, especially in regions with lower industrial densities, i.e., when large installations seem to be in isolation. Smaller companies could find business opportunities in the concentration of resources from larger installations. Moreover, small companies could facilitate collaboration and thus help create the industrial ecosystem needed to form a hub for circularity, supporting, for example, the link to cities.
Regions with a high density of industrial activity can develop superior levels of energy and material efficiency; however, this is subject to contextual factors. A Japanese study, based on spatial econometrics for paper and cement industries, indicates that there are not only sectoral variations related to the effects of industrial density but also a diversity of factors that may lead to positive and negative effects at an increasing industrial concentration [76]. Some symbiosis studies and projects such as EPOS include contextual factors beyond techno-economic assessments, including legal, spatial and social aspects [57], thus acknowledging the relevance of non-technical factors. In order to develop hubs for circularity, industrial density should only be considered as a starting point; additional critical factors should be taken into account to assess the implementation and the impact of hubs for circularity.
4.2. Implementing Hubs
The European Waste Hierarchy Framework Directive [77], in combination with the original Ladder of Lansink [14], offers a basic approach for developing an implementation framework for circularity in hubs. Such a framework does not only set a preference default for projects but also enables the identification of specific symbiosis cases tailored for process industries.
Theoretical circular economy frameworks tend to be compressive, involving as many sectors as possible. They range from the original 4Rs strategy (reduce, reuse, recycle and recover) to more than 12Rs [78]. Some R-verbs mainly apply to end-users of specific products and thus have minor relevance to the industry. On the other hand, more implementation-oriented approaches limit the number of strategies to a minimum. A good example is the 3Rs strategy from the UN in the Asian-Pacific region to promote sustainability principles [79].
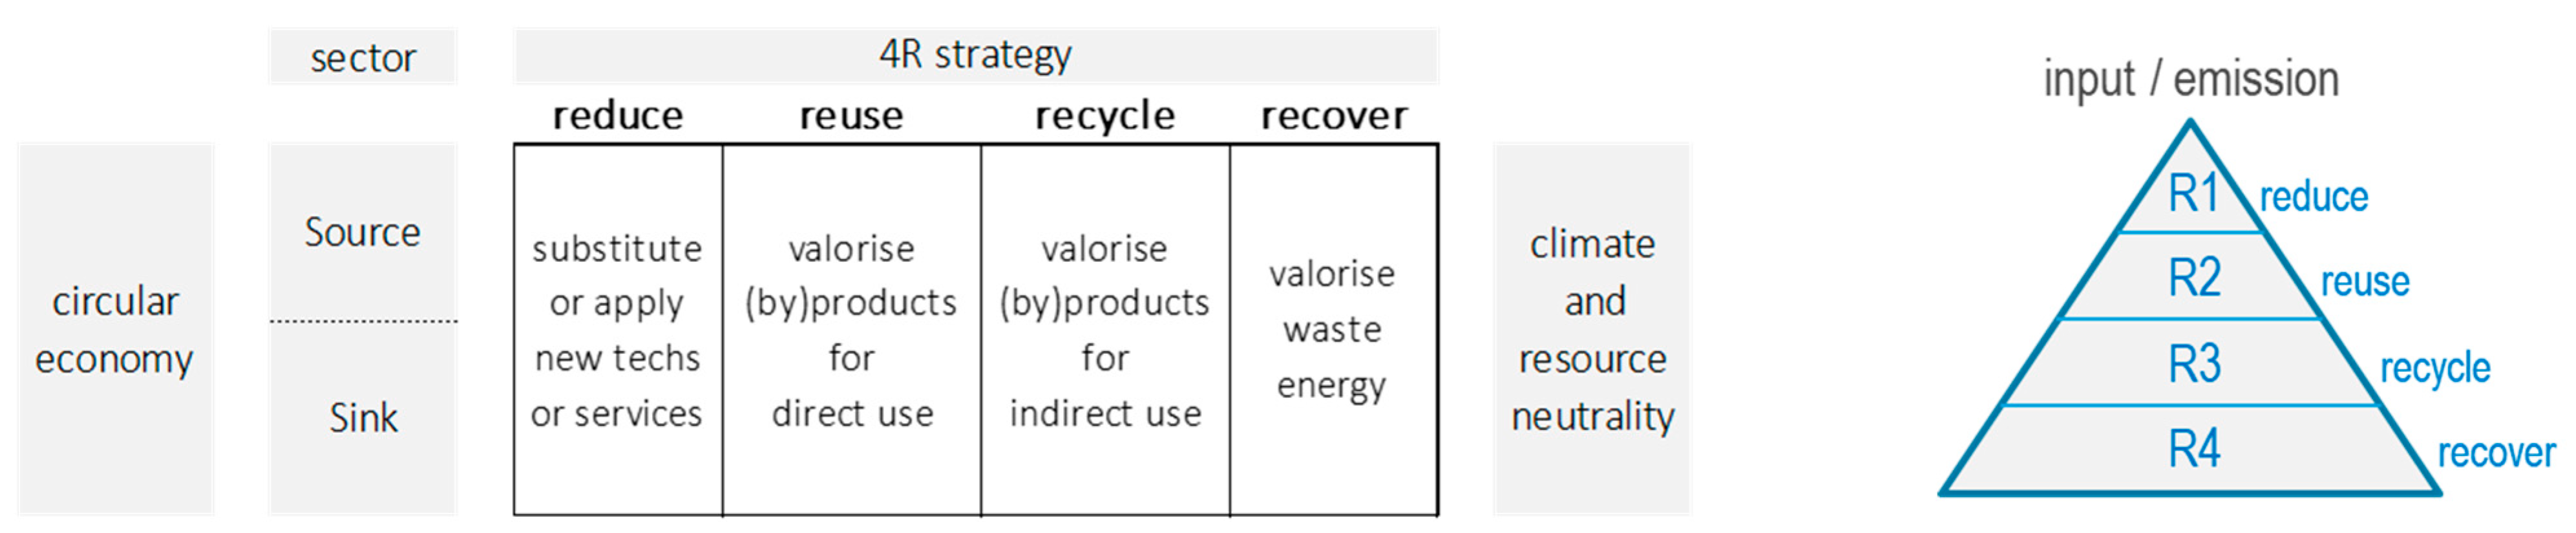
We propose a simple frame for the European process industries based on the 4Rs strategy. In Figure 12 industrial sectors are represented with a dual role as source and sink of resources. For each sector, the 4Rs strategy is defined in view of incentivising circularity.
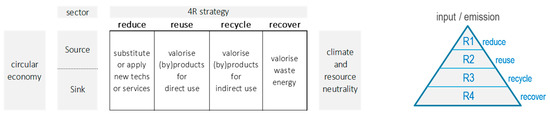
Figure 12.
Circular economy strategies for the process industry, indicating a simple framework to design implementation strategies.
At the top of the ladder, to reduce resource inputs and emissions, industries can jointly invest in (1) renewable energy production or engage in (2) shared infrastructure or services. To reuse materials, (3) by-products and (4) bio-based feedstock play a significant role in replacing virgin inputs. To recycle, (5) mechanical and (6) chemical reprocessing of waste streams is required, with steel and glass as key examples. Finally, to recover energy, (7) heat cascading, upgrading and conversion are considered with the use of alternative fuels from materials that would otherwise be discarded.
The reduce priority (R1) requires technological breakthroughs to enable unprecedented energy, materials and emissions efficiency. It may also lead to substantiating the demand for service approaches for end-products, such as repairing, refurbishing, remanufacturing and repurposing business strategies across multiple product categories (construction materials and renewable energy infrastructure, etc.), developing new materials that cope with such demand while maintaining economic, environmental and social responsibility. R1 strategies enable circularity with virtually any sector, from process industries to urban centres with innovation ecosystems of small to medium-sized enterprise (SMEs).
The different regions demand differing implementation strategies towards hubs for circularity in Europe. The variation between west and east Europe, and also north and south, offers the possibility to use strategies for deployment in broader regions with similar characteristics. For reduce (R1), northern Europe offers opportunities for hubs related to wind energy, while in the south, the potential is more on the use of solar energy. In western regions, the high density of industrial facilities might enable innovation based on spatial proximity, developing pilot projects and taking advantage of the many R&D centres in the region and global energy innovation trends [80]. On the other hand, scattered facilities in eastern Europe may trigger development policies to transfer technology and innovation, developing hybrid hubs for innovation. They could also expand their network to actors that do not match the E-PRTR database, such as SMEs of high relevance due to their diversity and flexibility. Such regions may also advance top-down approaches, promoted by the regional governments to create conditions for circularity. In that sense, invigorating changes in the waste legislation could be an enabler for hub development, and when integrated with energy and emissions directives, could even work towards a broad implementation of the circular economy.
4.3. Circularity Frameworks
With the aim of implementing circularity centres, a set of enabling frameworks is discussed.
A starting option is the ETS Innovation Fund framework from the European Commission. The fund requires a series of sequential steps, each with success criteria. The stages run from proof of concept to pilot plant, then commercial demonstration, and finally the scale up and roll out of a technology [81]. Such a scheme could be used to launch specific symbiosis projects in the scope of hubs for circularity, although the scheme misses the critical collaboration aspects essential to the development of hubs.
A symbiosis readiness level frame was developed based on the technology readiness level scheme [82]. It includes aspects of collaboration, such as relevance of the partners in the proof of concept phase and their indication of interest at an early stage. The maximum readiness level is a resilient partnership, keeping the collaboration priority until the last stage [82].
Former SPIRE projects developed implementation tools focusing on barriers and enablers. For industrial symbiosis in process industries, the EPOS project used the LESTS scores to assess and identify progress at three levels (region, cluster and resource) across five different dimensions: legal, economic, spatial, technical and social incentives [83]. Similar approaches have been developed based on risk identification related to internal and external factors in the domain of non-technological aspects for symbiosis [84]. Such methods aim to develop mitigation actions that increase the potential for success of the project.
In the CARBON4PUR project, a two-stage methodology is outlined towards implementing and replicating symbiosis cases related to CO2 utilisation [85]. The first stage covers hard criteria: a regional selection is based on specific preconditions that can be qualitative (partners and resource types) or quantitative (proximity and resource flows quantities). In the second stage, soft criteria are added, developing a better understating of the context in physical and societal terms. This stage considers for example access to finance, skilled workforce, supporting institutions, regional market profile, local entrepreneurial culture and public support policies. Similarly, the CarbonNext project proposes a framework towards a fully integrated and intensified value chain [86]. A total of five main components are considered: synergy (what is exchanged), physical aspects (distances and infrastructure, etc.), legislation, public support and economic aspects. Both approaches take into account factors that support the selection of regions; therefore, they can be helpful in the planning and implementation of hubs for circularity.
5. Conclusions
The hubs for circularity concept, introduced by the Processes4Planet partnership, is a key pillar in Europe’s roadmap towards achieving the Green Deal circular and climate objectives. Hubs for circularity aim to bring urban and industrial stakeholders together to create collaborations with urban–industrial symbiosis and a circular economy as central elements. The development of these hubs facilitates the practical implementation of climate neutrality by exchanging resources, waste streams, energy and more. This paper provides a first attempt at identifying locations for hubs based on urban–industrial symbiosis centred around energy-intensive industries. By comparing different clustering methods and validation schemes, it is concluded that the DBSCAN algorithm provides core insights to identify potential hubs for circularity.
The study has laid the foundation for developing a flexible tool that provides relevant data on industrial clustering and industrial symbiosis potential in the European Union for all interested stakeholders. When elaborated further, the tool can support and accelerate the implementation of hubs for circularity. Expanding the data set with more industrial sectors and a wider variety of streams and exchanges is considered a first step towards having an improved map of potential hubs. A further research line is about integrating a machine-learning algorithm to include affinity parameters beyond distance and the number of surrounding points. Although obtaining the required data seems to be the first challenge, the digital revolution across industries promises significant opportunities to develop circularity solutions [87,88].
Supplementary Materials
The following are available online at https://www.mdpi.com/article/10.3390/su132413906/s1.
Author Contributions
F.M.A., conceptualisation, methodology development, writing—original draft preparation, data collection and curation, visualisation; R.D.B., methodology development, modelling, data analysis and visualisation, writing; G.V.E., ideation, supervision, full writing review and edition, funding acquisition. All authors have read and agreed to the published version of the manuscript.
Funding
This paper builds on the work conducted and results obtained in the H2020 SPIRE project EPOS. The authors acknowledge the support received by the European Union’s Horizon 2020 research and innovation programme under grant agreement No 679386, and by the Swiss State Secretariat for Education, Research and Innovation (SERI) under contract number 15.0217.
Institutional Review Board Statement
Not applicable.
Informed Consent Statement
Not applicable.
Data Availability Statement
The data generated is available in Supplementary Materials.
Acknowledgments
The authors commend the P4Planet task force at A.SPIRE (Brussels, Belgium) for their insights and guidance on the concept of hubs for circularity and further value-adding interactions.
Conflicts of Interest
The authors declare no conflict of interest.
References
- IPCC. Global Warming of 1.5 °C. An IPCC Special Report on the Impacts of Global Warming of 1.5 °C above Pre-Industrial Levels and Related Global Greenhouse Gas Emission Pathways, in the Context of Strengthening the Global Response to the Threat of Climate Change, Sustainable Development, and Efforts to Eradicate Poverty. IPCC, 2018. Available online: https://www.ipcc.ch/sr15/download/#full (accessed on 12 November 2021).
- European Commission. The European Green Deal. European Commission, Brussels, Communication from the Commission to the European Parliament and the Council. COM(2019) 640 final, November 2019. Available online: https://ec.europa.eu/info/sites/info/files/european-green-deal-communication_en.pdf (accessed on 29 July 2020).
- European Commission. Communication from the Commission to the European Parliament, the Council, the European Economic and Social Committee and the Committee of the Regions: A New Circular Economy Action Plan for a Cleaner and More Competitive Europe; European Commission: Brussels, Belgium, 2020; Available online: https://eur-lex.europa.eu/resource.html?uri=cellar:9903b325-6388-11ea-b735-01aa75ed71a1.0017.02/DOC_1&format=PDF (accessed on 12 November 2021).
- A.SPIRE aisbl. European Partnership under Horizon Europe: Processes4Planet; Proposal Draft; European Commission: Brussels, Belgium, 2020; Available online: https://ec.europa.eu/info/sites/default/files/research_and_innovation/funding/documents/ec_rtd_he-partnerships-industry-for-sustainable-society.pdf (accessed on 24 August 2021).
- A.SPIRE. SPIRE 2050 Hubs for Circularity (H4C). EIT RawMaterials CIRCUIT Workshop. Available online: https://cdn2.hubspot.net/hubfs/2834550/5%202019%20SPIRE%202050%20H4C.pdf (accessed on 10 October 2019).
- Accenture, W. Industrial Clusters: Working Together to Achieve Net Zero. 2021. Available online: https://www.accenture.com/_acnmedia/PDF-147/Accenture-WEF-Industrial-Clusters.pdf (accessed on 31 August 2021).
- Lombardi, D.R.; Laybourn, P. Redefining Industrial Symbiosis. J. Ind. Ecol. 2012, 16, 28–37. [Google Scholar] [CrossRef]
- Wang, Y.; Xie, Y.; Qi, L.; He, Y.; Bo, H. Synergies evaluation and influencing factors analysis of the water–energy–food nexus from symbiosis perspective: A case study in the Beijing–Tianjin–Hebei region. Sci. Total Environ. 2021, 151731. [Google Scholar] [CrossRef]
- Cervo, H. Development of a Methodology Enabling the Identification of Industrial Symbiosis Opportunities and Their Assessment in the Petrochemical Industry. Ph.D. Thesis, Faculteit Ingenieurswetenschappen en Architectuur, Universiteit Gent, Ghent, Belgium, 2020. [Google Scholar]
- Gallaud, D.; Laperche, B. Circular Economy, Industrial Ecology and Short Supply Chain; John Wiley & Sons: Hoboken, NJ, USA, 2016; Available online: https://www.wiley.com/en-us/Circular+Economy%2C+Industrial+Ecology+and+Short+Supply+Chain-p-9781119307471 (accessed on 28 December 2020).
- Van Eetvelde, G. Industrial Symbiosis. In Resource Efficiency of Processing Plants: Monitoring and Improvement; Krämer, S., Engell, S., Eds.; Wiley-VCH Verlag GmbH & Co: Weinheim, Germany, 2018; pp. 441–469. [Google Scholar]
- Connett, P. The Zero Waste Solution; Chelsea Green Publishing: London, UK, 2013. [Google Scholar]
- Friedmann, D.S.J.; Agrawal, M.; Bhardwaj, A. Evaluating Net-Zero Industrial Hubs in the United States: A Case Study of Houston; Center on Global Energy Policy at Columbia University SIPA: New York, NY, USA; p. 32. Available online: https://www.energypolicy.columbia.edu/sites/default/files/file-uploads/Houston,%20final%20design,%206.29.21.pdf (accessed on 5 November 2021).
- Lansink, A. Challenging Changes—Connecting Waste Hierarchy and Circular Economy, 1st ed.; LEA Nijmegen: Nijmegen, The Netherlands, 2017. [Google Scholar] [CrossRef]
- Sun, L.; Fujii, M.; Li, Z.; Dong, H.; Geng, Y.; Liu, Z.; Fujita, T.; Yu, X.; Zhang, Y. Energy-saving and carbon emission reduction effect of urban-industrial symbiosis implementation with feasibility analysis in the city. Technol. Forecast. Soc. Chang. 2020, 151, 119853. [Google Scholar] [CrossRef]
- Feiferytė-Skirienė, A.; Stasiškienė, Ž. Seeking Circularity: Circular Urban Metabolism in the Context of Industrial Symbiosis. Sustainability 2021, 13, 9094. [Google Scholar] [CrossRef]
- Lu, H. Chapter 12—Madrid, Spain. In Eco-Cities and Green Transport; Elsevier: Amsterdam, The Netherlands, 2020; pp. 249–263. [Google Scholar]
- Masi, D.; Day, S.; Godsell, J. Supply Chain Configurations in the Circular Economy: A Systematic Literature Review. Sustainability 2017, 9, 1602. [Google Scholar] [CrossRef] [Green Version]
- Fonseca, L.M.; Domingues, J.P.; Pereira, M.T.; Martins, F.F.; Zimon, D. Assessment of Circular Economy within Portuguese Organizations. Sustainability 2018, 10, 2521. [Google Scholar] [CrossRef] [Green Version]
- Ranjbari, M.; Saidani, M.; Esfandabadi, Z.S.; Peng, W.; Lam, S.S.; Aghbashlo, M.; Quatraro, F.; Tabatabaei, M. Two decades of research on waste management in the circular economy: Insights from bibliometric, text mining, and content analyses. J. Clean. Prod. 2021, 314, 128009. [Google Scholar] [CrossRef]
- EMF. Growth within: A Circular Economy Vision for a Competitive Europe. Ellen MacArthur Foundation, 2015. Available online: https://www.ellenmacarthurfoundation.org/assets/downloads/publications/EllenMacArthurFoundation_Growth-Within_July15.pdf (accessed on 28 January 2020).
- European Commission. Critical Raw Materials. In Internal Market, Industry, Entrepreneurship and SMEs; European Commission: Brussels, Belgium, 2016; Available online: https://ec.europa.eu/growth/sectors/raw-materials/specific-interest/critical_en (accessed on 24 August 2021).
- Sarja, M.; Onkila, T.; Mäkelä, M. A systematic literature review of the transition to the circular economy in business organizations: Obstacles, catalysts and ambivalences. J. Clean. Prod. 2021, 286, 125492. [Google Scholar] [CrossRef]
- Material Economics. Industrial Transformation 2050 Pathways to Net-Zero Emissions from EU Heavy Industry; University of Cambridge Institute for Sustainability Leadership: Cambridge, UK, 2019. [Google Scholar]
- Kusch, S. Industrial Symbiosis: Powerful Mechanisms for Sustainable Use of Environmental Resources. 2015. Available online: https://sustainabledevelopment.un.org/content/documents/635486-Kusch-Industrial%20symbiosis_powerful%20mechanisms%20for%20sustainable%20use%20of%20environmental%20resources.pdf (accessed on 5 November 2021).
- United Nations Environment Programme. The Weight of Cities. Resource Requirements of Future Urbanization. 2018. Available online: https://www.resourcepanel.org/reports/weight-cities (accessed on 31 August 2021).
- United Nations. World Population Prospects—Population Division—United Nations. 2019. Available online: https://population.un.org/wpp/ (accessed on 31 August 2021).
- Baynes, T.M.; Musango, J.K. Estimating current and future global urban domestic material consumption. Environ. Res. Lett. 2018, 13, 065012. [Google Scholar] [CrossRef]
- Joint Research Centre (European Commission). The Future of Cities: Opportunities, Challanges and the Way Forward; EC Publications Office: Luxembourg, 2019; Available online: https://data.europa.eu/doi/10.2760/375209 (accessed on 9 May 2021).
- HLGEEIs. Masterplan for a Competitive Transformation of EU Energy-Intensive Industries Enabling a Climate-Neutral, Circular Economy by 2050; Publications Office of the European Union: Luxembourg, 2019; Available online: http://op.europa.eu/en/publication-detail/-/publication/be308ba7-14da-11ea-8c1f-01aa75ed71a1/language-en (accessed on 6 July 2020).
- CEFIC. Landscape of the European Chemical Industry 2020; European Chemical Industry Council: Brussels, Belgium, 2020; Available online: https://www.chemlandscape.cefic.org/wp-content/uploads/combined/fullDoc.pdf (accessed on 14 July 2020).
- Elser, B.; Ulbrich, M. Taking the European Chemical Industry into the Circular Economy; Accenture: Brussels, Belgium, 2017; Available online: accenture-cefic-report-exec-summary.pdf (accessed on 5 November 2020).
- de Bruyn, S.; Jongsma, C.; Kampman, B.; Görlach, B.; Thie, J.-E. Energy-Intensive Industries—Challenges and Opportunities in Energy Transition; European Parliament: Luxembourg, 2020. [Google Scholar]
- Ketels, C.H.M. The Role of Clusters in the Chemical Industry. Report (Prepared for the Annual Conference of the European Petrochemical Association (EPCA)). 2007. Available online: https://www.hbs.edu/faculty/Pages/item.aspx?num=30557 (accessed on 5 November 2021).
- Lowe, E.A.; Evans, L.K. Industrial ecology and industrial ecosystems. J. Clean. Prod. 1995, 3, 47–53. [Google Scholar] [CrossRef]
- EUROFER. 2020 European Steel in Figures. European Steel Association, 2020. Available online: https://www.eurofer.eu/assets/Uploads/European-Steel-in-Figures-2020.pdf (accessed on 5 November 2021).
- European Commission. Energy Efficiency and CO2 Reduction in the Iron and Steel Industry; European Commission: Brussels, Belgium, 2014. [Google Scholar]
- CEMBUREAU. 2019 Activity Report; The European Cement Association: Brussels, Belgium, 2019; Available online: https://cembureau.eu/media/1967/activity-report-2019.pdf (accessed on 5 November 2021).
- Sinharay, S. An Overview of Statistics in Education. In International Encyclopedia of Education; Elsevier Ltd.: Amsterdam, The Netherlands, 2010; pp. 1–11. [Google Scholar] [CrossRef]
- Estivill-Castro, V. Why so many clustering algorithms: A position paper. ACM SIGKDD Explor. Newsl. 2002, 4, 65–75. [Google Scholar] [CrossRef]
- Berkhin, P. A Survey of Clustering Data Mining Techniques. In Grouping Multidimensional Data: Recent Advances in Clustering; Kogan, J., Nicholas, C., Teboulle, M., Eds.; Springer: Berlin/Heidelberg, Germany, 2006; pp. 25–71. [Google Scholar] [CrossRef]
- Superti, V.; Merino-Saum, A.; Baur, I.; Binder, C.R. Unraveling how the concept of circularity relates to sustainability: An indicator-based meta-analysis applied at the urban scale. J. Clean. Prod. 2021, 315, 128070. [Google Scholar] [CrossRef]
- Dunkelberg, H.; Schlosser, F.; Veitengruber, F.; Meschede, H.; Heidrich, T. Classification and clustering of the German plastic industry with a special focus on the implementation of low and high temperature waste heat. J. Clean. Prod. 2019, 238, 117784. [Google Scholar] [CrossRef]
- Arbolino, R.; Boffardi, R.; Lanuzza, F.; Ioppolo, G. Monitoring and evaluation of regional industrial sustainability: Evidence from Italian regions. Land Use Policy 2018, 75, 420–428. [Google Scholar] [CrossRef]
- EPOS Project. EPOS insight#17: Industrial Symbiosis Generic Cases and EU Impact Potential. 2019. Available online: https://www.spire2030.eu/sites/default/files/users/user222/Epos-docs/Insights/epos_-_insights_17.pdf (accessed on 12 January 2020).
- SCALER Project. SCALing European Resources—With Industrial Symbiosis. 2020. Available online: https://www.scalerproject.eu/ (accessed on 14 July 2020).
- INCUBIS Project. Incubator for Maximizing Waste Heat/Cold Efficiency in Industrial Parks and Districts. 2020. Available online: http://www.incub-is.eu/ (accessed on 31 August 2021).
- Rokach, L.; Maimon, O. Clustering Methods. In Data Mining and Knowledge Discovery Handbook; Maimon, O., Rokach, L., Eds.; Springer: Boston, MA, USA, 2005; pp. 321–352. [Google Scholar] [CrossRef]
- Schubert, E.; Sander, J.; Ester, M.; Kriegel, H.P.; Xu, X. DBSCAN Revisited, Revisited: Why and How You Should (Still) Use DBSCAN. ACM Trans. Database Syst. 2017, 42, 19:1–19:21. [Google Scholar] [CrossRef]
- European Commission. The European Pollutant Release and Transfer Register (E-PRTR)—Environment. 2020. Available online: https://ec.europa.eu/environment/industry/stationary/e-prtr/legislation.htm (accessed on 1 September 2020).
- European Commission. Eltis|The Urban Mobility Observatory. 2021. Available online: https://www.eltis.org/ (accessed on 1 September 2021).
- Datanovia. Assessing Clustering Tendency. Datanovia, 2021. Available online: https://www.datanovia.com/en/lessons/assessing-clustering-tendency/ (accessed on 8 September 2021).
- Lawson, R.G.; Jurs, P.C. New index for clustering tendency and its application to chemical problems. J. Chem. Inf. Comput. Sci. 1990, 30, 36–41. [Google Scholar] [CrossRef]
- Open Source Libs. Pyclustertend—A Python Package to Assess Cluster Tendency—(Pyclustertend). 2021. Available online: https://opensourcelibs.com/lib/pyclustertend (accessed on 9 November 2021).
- Datanovia. Determining The Optimal Number of Clusters: 3 Must Know Methods. 2021. Available online: https://www.datanovia.com/en/lessons/determining-the-optimal-number-of-clusters-3-must-know-methods/ (accessed on 8 September 2021).
- Ketchen, D.J.; Shook, C.L. The Application of Cluster Analysis in Strategic Management Research: An Analysis and Critique. Strateg. Manag. J. 1996, 17, 441–458. [Google Scholar] [CrossRef]
- sklearn.metrics.pairwise.haversine_distances. Scikit-Learn. Available online: https://scikit-learn.org/stable/modules/generated/sklearn.metrics.pairwise.haversine_distances.html (accessed on 17 November 2021).
- Scikit-Learn Developers. Scikit-Learn-Getting Started. Scikit-Learn, 2021. Available online: https://scikit-learn/stable/getting_started.html (accessed on 9 November 2021).
- VanderPlas, J. Chapter 5: Introducing Scikit-Learn. In Python Data Science Handbook: Essential Tools for Working with Data, 2nd ed.; O’Reilly Media, Inc.: Sebastopol, CA, USA, 2017; pp. 343–359. [Google Scholar]
- VanderPlas, J. Chapter 2:Introduction to NumPy. In Python Data Science Handbook: Essential Tools for Working with Data, 2nd ed.; O’Reilly Media, Inc.: Sebastopol, CA, USA, 2017; pp. 33–96. [Google Scholar]
- VanderPlas, J. Chapter 3: Data Manipulation with Pandas. In Python Data Science Handbook: Essential Tools for Working with Data, 2nd ed.; O’Reilly Media, Inc.: Sebastopol, CA, USA, 2017; pp. 97–215. [Google Scholar]
- Datanovia. Cluster Validation Statistics: Must Know Methods. Datanovia, 2021. Available online: https://www.datanovia.com/en/lessons/cluster-validation-statistics-must-know-methods/ (accessed on 8 September 2021).
- Brock, G.; Pihur, V.; Datta, S.; Datta, S. clValid: An R Package for Cluster Validation. J. Stat. Softw. 2008, 25, 1–18. [Google Scholar] [CrossRef] [Green Version]
- Charrad, M.; Ghazzali, N.; Boiteau, V.; Niknafs, A. NbClust: An R Package for Determining the Relevant Number of Clusters in a Data Set. J. Stat. Softw. 2014, 61. [Google Scholar] [CrossRef] [Green Version]
- Joint Research Centre (European Commission); Veneri, P.; Moreno-Monroy, A.; Maffenini, L.; Schiavina, M. GHSL-OECD Functional Urban Areas: Public Release of GHS FUA; Publications Office of the European Union: Luxembourg, 2019; Available online: https://data.europa.eu/doi/10.2760/67415 (accessed on 15 November 2021).
- Mendez-Alva, F.; Cervo, H.; Krese, G.; van Eetvelde, G. Industrial symbiosis profiles in energy-intensive industries: Sectoral insights from open databases. J. Clean. Prod. 2021, 314, 128031. [Google Scholar] [CrossRef]
- VanderPlas, J. Chapter 4: Visualization with Matplotlib. In Python Data Science Handbook: Essential Tools for Working with Data, 2nd ed.; O’Reilly Media, Inc.: Sebastopol, CA, USA, 2017; pp. 217–330. [Google Scholar]
- Rob Story. Folium—Folium 0.12.1 Documentation. 2013. Available online: https://python-visualization.github.io/folium/ (accessed on 9 November 2021).
- Qiu, B.; Cao, X. Clustering boundary detection for high dimensional space based on space inversion and Hopkins statistics. Knowl.-Based Syst. 2016, 98, 216–225. [Google Scholar] [CrossRef]
- Jensen, P.D.; Basson, L.; Hellawell, E.E.; Bailey, M.R.; Leach, M. Quantifying “geographic proximity”: Experiences from the United Kingdom’s National Industrial Symbiosis Programme. Resour. Conserv. Recycl. 2011, 55, 703–712. [Google Scholar] [CrossRef] [Green Version]
- UN-SD. United Nations Standard Country or Area Codes for Statistical Use (M49) Including Geographical Regions. 2021. Available online: https://unstats.un.org/unsd/methodology/m49/ (accessed on 9 December 2021).
- Chertow, M.R. “Uncovering” Industrial Symbiosis. J. Ind. Ecol. 2007, 11, 11–30. [Google Scholar] [CrossRef]
- Moulavi, D.; Jaskowiak, P.A.; Campello, R.J.G.B.; Zimek, A.; Sander, J. Density-Based Clustering Validation. In Proceedings of the 2014 SIAM International Conference on Data Mining, Philadelphia, PA, USA, 24–26 April 2014; pp. 839–847. [Google Scholar] [CrossRef] [Green Version]
- EPOS Project. Insight#1 IS Market Study. 2019. Available online: https://www.spire2030.eu/sites/default/files/users/user222/Epos-docs/epos%20insights%201_v8.pdf (accessed on 25 September 2021).
- SCALER Project and Symbiosis in Europe. Quantified Potential of Industrial Symbiosis in Europe. Deliverable 3.5. Available online: https://www.scalerproject.eu/wp-content/uploads/2020/06/D3.5_SCALER_Quantified-potential-of-industrial-symbiosis-in-Europe_v1.0.pdf (accessed on 10 December 2021).
- Tanaka, K.; Managi, S. Industrial agglomeration effect for energy efficiency in Japanese production plants. Energy Policy 2021, 156, 112442. [Google Scholar] [CrossRef]
- European Commission. Waste Framework Directive. Categorisation System for the Circular Economy. 2008. Available online: https://ec.europa.eu/environment/topics/waste-and-recycling/waste-framework-directive_en (accessed on 27 September 2021).
- European Commission. Categorisation System for the Circular Economy. 2020. Available online: https://ec.europa.eu/info/publications/categorisation-system-circular-economy_en (accessed on 27 September 2021).
- United Nations. Mainstreaming the 3Rs and Resource Efficiency in the Overall Policy Development at Local and National Levels in Asia-Pacific Countries—United Nations Partnerships for SDGs Platform. 2013. Available online: https://sustainabledevelopment.un.org/partnership/?p=96 (accessed on 29 September 2021).
- Elsevier. Report: How Can Research Help the World Hit Net Zero by 2050? Elsevier Connect. Available online: https://www.elsevier.com/connect/net-zero-report (accessed on 15 November 2021).
- European Commission. Innovation Fund. Climate Action—European Commission. 12 February 2019. Available online: https://ec.europa.eu/clima/policies/innovation-fund_en (accessed on 27 September 2021).
- Directorate-General for Research and Innovation (European Commission); Sommer, K.H. Study and Portfolio Review of the Projects on Industrial Symbiosis in DG Research and Innovation: Findings and Recommendations; Publications Office of the European Union: Luxemburg, 2020; Available online: https://data.europa.eu/doi/10.2777/381211 (accessed on 29 September 2021).
- EPOS Project. Insight#11 Generic Industrial Symbiosis Validation Scheme. 2019. Available online: https://www.spire2030.eu/sites/default/files/users/user222/epos%20insights%2011.pdf (accessed on 5 November 2021).
- Henriques, J.D.; Azevedo, J.; Dias, R.; Estrela, M.; Ascenço, C.; Vladimirova, D.; Miller, K. Implementing Industrial Symbiosis Incentives: An Applied Assessment Framework for Risk Mitigation. Circ. Econ. Sustain. 2021, 1–24. [Google Scholar] [CrossRef]
- Barascu, A.; Castillo-Castillo, A.; Papaioannou, R.-F. Deliverable 7.2: Study Including Replication Potentials and Preferred Sites for Industrial Symbiosis (Carbon4PURE). Carbon4PUR Consortium, Project Deliverable/Public Report. March 2021. Available online: www.carbon4pur.eu (accessed on 5 November 2021).
- DECHEMA. D2.2: Report on Fully Integrated and Intensified Value Chain Concepts for Industrial Symbiosis. CarbonNext Project, Public Deliverable. November 2017. Available online: http://carbonnext.eu/Deliverables/_/D2.2%20Industrial%20symbiosis.pdf (accessed on 5 November 2021).
- Fonseca, L.; Amaral, A.; Oliveira, J. Quality 4.0: The EFQM 2020 Model and Industry 4.0 Relationships and Implications. Sustainability 2021, 13, 3107. [Google Scholar] [CrossRef]
- Belhadi, A.; Kamble, S.S.; Jabbour, C.J.C.; Mani, V.; Khan, S.A.R.; Touriki, F.E. A self-assessment tool for evaluating the integration of circular economy and industry 4.0 principles in closed-loop supply chains. Int. J. Prod. Econ. 2021, 108372. [Google Scholar] [CrossRef]


Publisher’s Note: MDPI stays neutral with regard to jurisdictional claims in published maps and institutional affiliations. |
© 2021 by the authors. Licensee MDPI, Basel, Switzerland. This article is an open access article distributed under the terms and conditions of the Creative Commons Attribution (CC BY) license (https://creativecommons.org/licenses/by/4.0/).