1. Introduction
Sustainable Development Goals (SDGs) [
1] are at the heart of the 2030 Agenda for Sustainable Development [
2], which was adopted by all United Nations Member States in 2015. The critical condition for monitoring and meeting the Sustainable Development Goals is the availability of data, including spatial data. Crowdsourced data is helping fill data gaps as well as provide insights into SDGs progress.
In the case of geospatial data, the OpenStreetMap (OSM) project [
3] has become a synonym for volunteer mapping, as well as an alternative to the products of national mapping organizations (NMOs). Discussions on the quality of volunteer mapping versus official map products from NMOs remain ubiquitous [
4,
5,
6,
7,
8]. Volunteer crowdsourcing [
9,
10] has also become a possible (yet still underutilized) source of data. Spatial data produced by volunteers are referred to as volunteered geographic information (VGI) [
11].
The Humanitarian OpenStreetMap Team (HOT) [
12] is an international team dedicated to humanitarian action and community development through open mapping. It provides map data for disaster management that reduce risks and contribute to the achievement of Sustainable Development Goals [
13]. Beyond the context of open data, it is a broad community partnership to collaboratively create a critical data resource for monitoring and meeting SDGs by making available fundamental, detailed, and timely information on where things are in our world [
14].
There are many ways in which crowdsourced mapping using OSM can help to achieve SDGs. For most SDGs, developing basemaps of buildings and road data and place names (i.e., villages, towns, cities) is the starting point. Several examples of relevant demonstrations have been presented in [
15]. A brief selection is presented as follows:
Goal 1—No Poverty—Putting villages and household footprints on a map is often the first step in giving communities a voice in land rights. Geospatial information is critical in helping people claim their property rights. Kenya’s Map Kibera project (begun in 2009) collects citizen-generated data and other kinds of relevant open data in one of the region’s biggest slums-turned-informal-cities to enhance citizen accountability, development planning, and government use.
Goal 3—Good Health and Wellbeing—Public health data collection projects provide local governments and organizations with information to improve their response to health-related issues, such as malaria prevention. In 2018, the HOT supported malaria elimination projects on the ground in Guatemala and Botswana by providing geographical data and training. Data were used for logistics and indoor residual spraying campaigns, for bed net distribution, and for improved monitoring and evaluation to measure intervention impacts.
Goal 4—Quality Education—Crowdsourced mapping provides a two-fold benefit towards reaching the SDG for education: assisting partners, governments, and local communities in recognizing gaps in services and the distribution of educational facilities, as well as providing an opportunity for individuals in these groups to gain technical and vocational skills such as GIS and surveying.
Goal 5—Gender Equality—Since 2015, the Crowd2Map project has been mapping rural Tanzania. These maps are used by community activists to locate and protect girls at risk of female genital mutilation, as well as to provide local officials with data needed to plan for the development of services.
Goal 7—Affordable and Clean Energy—HOT completed the large-scale digitization of rural Tanzania using mapping and household surveys, identifying millions of buildings and more than a thousand villages. By collecting this highly detailed data on settlements, HOT enabled the government and private electricity and renewable energy providers to predict demand and determine where grid and off-grid connections can be made.
Goal 9—Industry, Innovation, and Infrastructure—With OSM, roads and buildings can be mapped remotely while teams on the ground add important information such as building conditions and road surface quality.
Goal 16—Peace, Justice, and Strong Institutions—Crowdsourced mapping promotes participatory action that increases the representation of communities. OSM is used by humanitarian agencies in decision-making.
Solís et al. [
16] describe other examples of how campaigns of volunteered geographic information and participatory GIS driven by the YouthMappers initiative [
17] relate to various SDGs. Our focus here is on Goal 3—Good Health and Wellbeing—providing building and road infrastructure information for an insecticide spray campaign to prevent malaria and protect public health in Mozambique and Kenya. The author notes that “Participatory mapping can support greater understanding of connections among places, the people living in them, and the phenomenon arising from global change, in ways that people ranging from scholars to youth to policymakers can quickly grasp”. The remote cooperation between students from George Washington University and students from the University of Kathmandu on the mapping of infrastructure in Kathmandu is an example of cooperation between remote and local participants and the engagement of young people from different parts of the world [
16].
Another work by Solís et al. [
18] provides a global survey of 205 students participating in the YouthMappers initiative, focusing on how they understand the significance of their work for SDGs. They detected differences by gender and world region. Participants from the Global South perceive themselves to be more engaged with SDGs than those from the Global North. This study suggests that humanitarian mapping can help motivate students to be socially responsible. Leveraging student-led movements on connected campuses offers one possible way of creating a sense of global citizenship, a critical component in achieving SDGs [
18].
SDGs are also strongly connected with disaster risk management (DRM). It is impossible to build wellbeing, infrastructure, economic growth, or sustainable cities if our efforts are regularly undermined by natural or man-made disasters. Geospatial data is a necessary part of DRM. Crowdsourced mapping is still underestimated but is a potential source of geospatial data for DRM.
The experience of the OSM response to the 2010 Haiti earthquake demonstrated that volunteers who collaborated around open data could quickly create accurate information after a disaster. Nevertheless, it is better to prepare data in advance of a disaster to allow disaster preparedness. In [
19,
20,
21] we can see other examples of how to create and use prepared crowdsourced geospatial OSM data for DRM:
OSM project Community Mapping for Exposure, Indonesia (2011)—the project worked with local governments, university students, and civil society groups. The mapping work focused primarily on critical infrastructure in the capital region of Jakarta, including schools, hospitals, community centers, and places of worship. The resulting data were combined with hazard information from a variety of sources to produce realistic impact scenarios [
19].
Open Cities project Batticaloa (2012)—Batticaloa, a major city in Sri Lanka’s Eastern Province severely affected by the 2004 Indian Ocean tsunami, is located in a hazard-prone area that has suffered near-annual droughts, floods, and cyclones. Footprints and basic building characteristics, including the number of floors, usage, and the construction materials used for walls and roofs were collected for all buildings in the area [
19].
Open Cities Kathmandu (2012)—Kathmandu, the capital city of Nepal, is the most seismically at-risk city in the world in terms of the potential for loss of human life during a major event. Open Cities Kathmandu surveyed 2256 schools and 350 health facilities in the Kathmandu Valley [
19].
One Map Myanmar (2018)—The American Red Cross has been working alongside the Myanmar Red Cross to better understand the locations of critical infrastructure and roads in order to allow decision-making during major disasters such as floods and cyclones [
20].
Burundi anti-malaria campaign (2020)—Médecins Sans Frontières/Doctors Without Borders (MSF) has prevented the disease from spreading in eastern Burundi with an indoor residual spraying campaign. As large parts of the area were not mapped, Missing Maps volunteers traced nearly 90,000 buildings in the rural region of Ruyigi in Burundi. Over the following month, teams on the ground managed to spray 97% of these households [
21].
The latter two campaigns were part of the Missing Maps project. Missing Maps [
22] is a humanitarian mapping project that aims to map the most vulnerable places in the developing world using OSM—in advance of an eventual disaster. International and local non-governmental organizations, national and local governments, communities, and individuals use the created OSM data to better respond to crises, achieve SDGs, and monitor their progress. It is essential to have a large pool of trained volunteers ready to assist when a disaster occurs [
23]. Hence, there is a motivation to expand the community of voluntary mappers and motivate them to contribute actively.
A mapathon (or mapping party) is an organized collaborative event in which a group of volunteers collectively map a chosen location in places where OSM data is scarce or non-existent [
24]. The purpose of mapping parties is to map and socialize [
25]. Organizers pursue several aims focused on newcomers: to initiate them into the practice, to have them produce maps throughout the event, and then to retain these new contributors for future activities [
26,
27]. Classic mapathons are held at an agreed place where mappers from a regional community group and come together in person. However, more and more mapathons are currently organized online due to the pandemic as a substitute for classic mapathons.
Humanitarian mappers do not have to go to mapathons; many of them work online from home. Nevertheless, mapathons can empower users to gain new skills and experience. Users actively producing content in OSM are mostly made up of people who attend mapping parties [
25]. One of the key goals of organizing mapathons is to attract recurring participants. They can help to tutor beginner mappers and produce more and better-quality data [
28].
The authors of the paper are members of the Czech Missing Maps community and the team that organizes mapathons in the city of Brno, Czechia. The motivation behind this study was to expand the active Czech and Slovak humanitarian mapping community of the Missing Maps project. This means attracting new mappers and ensuring greater attendance at mapathons. To achieve this, it is necessary to discover what attracts contributors from Czechia and Slovakia to participate in humanitarian mapping and to attend mapathons and to discover the reasons why former contributors sometimes cease to contribute. This should reduce the departure of experienced mappers and increase the chances of creating more and better data. This paper communicates our preliminary results after the first round of data collection from the questionnaire. Analyses with an identical scope are planned for subsequent years and forthcoming mapathons.
An additional aim of our study was to examine the respective humanitarian mappers’ self-assessment of their contributions in order to learn more about the contributors’ perspective on humanitarian mapping and mapathons and their level of satisfaction with their mapping efforts.
We attempted to answer the following research questions:
(A) What are the motivations of different contributors in the Missing Maps community in Czechia and Slovakia?
(B) How can a mapathon be set up to attract as many participants as possible?
(C) How do contributors to humanitarian mapping subjectively evaluate their contributions? Do they underestimate or overestimate the importance of their results?
1.1. Citizen Science as an Umbrella for Humanitarian Mapping
The practices of volunteer-based data gathering have a theoretical framework within the concept of citizen science [
29]. Citizen science—a new term but an old practice—is related to the opening up of science. Scenarios in which parts of research are in the general public’s hands [
30] relate to scientific approaches, tools, and data sets that were formerly used exclusively by researchers. The term “neo-geography” (see Turner [
31], who championed the term in 2006) has also been employed [
32], though the citizen science approach can be used in any scientific field, not only in geography. For example, West et al. [
33] used volunteers to monitor air pollution, while Alender [
34] wrote about volunteers monitoring water quality. Citizen science incorporates diverse forms of interaction and cooperation among public volunteers to benefit society and the environment [
35,
36,
37]; these interactions are significantly supported by machine learning and artificial intelligence [
38].
The closely-related term citizen management is used by [
39,
40]. In citizen science, properly trained citizens can participate in a widespread and fine-grained process of knowledge acquisition. In citizen management, citizens adequately trained in problem-solving can change the state of an environmental system with positive effects on the system and themselves [
39]. Study [
40] describes this concept using the example of beach litter clean-up campaigns. Here, it can be understood that ‘citizen science’ is used in a nature conservation project.
The concept of humanitarian mapping is often referred to in connection with the earthquake in Haiti in 2010, as mentioned in [
41,
42,
43]. This suggests that citizen science activities in humanitarian mapping came later than other citizen science activities, the latter utilized mainly in the natural (environmental) sciences; however, the utilization of community-based mapping in social sciences can also be found (see [
44] with the example of socio-economic variables). In the case of humanitarian mapping, where data are needed as quickly as possible, citizen science as an umbrella term for many activities often appears in the form of crowdsourcing [
45,
46].
Hackley [
47] describes crowdsourcing as one of the various levels of public engagement. Crowdsourcing is understood as “the lowest level” of activities linked to data collection. However, the importance of crowdsourcing is enormous (as previously documented, e.g., by Goodchild [
11]). We should not see levels of participation as a hierarchically determined sequence, with level 1 (in Haklay’s scale, equal to crowdsourcing) being “worse” than level 4 (equivalent to extreme citizen science, according to Haklay). Indeed, deep research conducted among Czech citizen science projects (see Duží et al. [
48]) shows that crowdsourcing is a feature of the majority of such projects. As we focus on spatial data collection, we often use the term volunteered geographic information (VGI), defined by Goodchild [
11] and further elaborated, for example, by Sui et al. [
45]. In this respect, VGI is used as a synonym for crowdsourcing in the field of cartography and geography [
32,
45]. Mapathons, conducted as part of humanitarian mapping to expand geospatial knowledge within the OSM project framework, engage the public in an organized way to obtain volunteered geographic information to [
49]. A combination of the citizen science approach and the need to contribute to the resolution of socially pressing issues could also serve as a good motivation for participants to be engaged long-term in such voluntary activities [
50,
51].
Citizen science also has a strong connection to SDGs, an idea that was discussed by Fritz et al. [
52] and supported by key policymakers, e.g., during the conference “Knowledge for Change: A Decade of Citizen Science (2020–2030) in support of the SDGs” [
53] organized as an official event of Germany’s 2020 EU Council presidency. Fraisl et al. [
54] discuss the potential of citizen science to contribute to many more than 76 SDG indicators. The direct connection between humanitarian mapping and SDGs is described in the Introduction.
1.2. The Humanitarian OpenStreetMap Team and the Missing Maps Project
The history of humanitarian mapping is well described [
9,
55,
56,
57,
58]. The Humanitarian OpenStreetMap Team (HOT) [
12] was established in August 2010 to produce maps in OSM for humanitarian work in areas affected by a disaster. It is an example of mapping for disaster management after a crisis has hit.
A very active part of HOT is the YouthMappers initiative [
17]. It is an academic network of university-based, student-led, and faculty-mentored local chapters, currently with members from many university campuses in many countries around the world [
16]. It is designed to encourage students and their faculty mentors to participate in creating open, free spatial data for humanitarian efforts [
24,
58]. Participating groups can apply for grants, research fellowships, and other benefits. Studies by Solís et al. [
16,
18] explain how YouthMappers contribute to various SDGs. This is described in the Introduction.
The Missing Maps project [
22] was founded in 2014 as a joint venture of the British and American Red Cross, Médecins Sans Frontières/Doctors Without Borders (MSF), and the Humanitarian OpenStreetMap Team mentioned above [
58]. Many other organizations, universities, and entities have joined the project since that time. The goal of the Missing Maps project is to map the most vulnerable places in the developing world where MSF or other humanitarian organizations plan to work. It is an example of mapping as a form of prevention [
57].
The Czech and Slovak community is a viable part of the Missing Maps project. The first mapathon in Czechia was held in Prague in June 2016. Over a period of two years (June 2016–June 2018), 840 members of the Czech community participated and mapped more than 400,000 buildings and 13,000 km of roads [
59]. In November 2016, Brno became the second Czech city to host a mapathon. After the event, an organizing team in Brno was established and has since organized another 18 mapathons; the first was held in December 2016. Masaryk University hosted most of these events. Others were co-organized by private companies (Red Hat, Kiwi.com (Brno, Czech Republic), CleverMaps (Brno, Czech Republic), and the rest of the mapathons took place as part of various events hosted by non-profit organizations. The attendance statistics from organized mapathons are one of the data inputs of this article.
1.3. (Dis)Connections and Engagements between Stakeholders Related to Humanitarian Mapping
We may identify several kinds of (dis)connections and relationships between various stakeholders related to humanitarian mapping and citizen science. The following statements are based on a review of scientific papers concerning the state-of-the-art, other reference materials, and the experience of the authors of this paper.
Humanitarian mapping, including the use of mapathons, represents one source of newcomers to citizen science. However, as stated for example by Béland [
60], humanitarian mapping and mapathons often bring insufficiently skilled or engaged newcomers to the OSM project. Various authors declare that new participants in humanitarian mapping and mapathons exhibit three major weaknesses:
their contribution to OSM is low; we speak of ‘hit-and-run’ contributors [
60],
the average number of mistakes in mappings performed by new participants in humanitarian mapping activities is higher than the average number produced by other more experienced participants [
56],
most new participants do not become regular participants [
61].
We can witness significant tensions between some highly experienced OSM contributors and humanitarian mappers, as stated, for example, by [
61,
62,
63,
64]. Experienced OSM contributors claim that the OSM project is being used for a different purpose than that primarily envisaged for OSM, i.e., mapping based on local knowledge [
64]. Sometimes, highly experienced OSM contributors are disappointed by the strong public response that humanitarian mapping enjoys throughout society. That is, by the general impression that the OSM project serves a primarily humanitarian purpose [
63].
Further tension arises between highly experienced OSM contributors and humanitarian mappers/humanitarian mapping organizers due to their different points of view with respect to initial training [
62,
64]. Highly experienced OSM contributors support initial training that lasts several hours and comprises a wide variety of examples of mapped spatial objects (in order “to map everything in relation to each other”). In contrast, initial training in humanitarian mapping (e.g., at mapathons) typically lasts about one hour (during a three-hour mapathon) since only three kinds of spatial objects are mapped: buildings, residential areas, and roads. Conceptually, therefore, the demands of these two stakeholder groups are different: highly experienced OSM contributors desire mapping in its full complexity, while humanitarian mappers adopt a more limited, application-driven approach. Generally speaking, however, both stakeholder groups collaborate intensively despite these differences, driven by a shared passion and a common goal: to prepare a free and editable map of the world.
The following conceptual steps would bring the various stakeholder groups of highly experienced OSM contributors and humanitarian mappers closer together:
Humanitarian mappings should be organized with as many local contributors as is feasible. Such a step is crucial for synergy between both stakeholder groups [
63]. The participation of local contributors from the mapped countries adds value to the remote action, as described by Solís et al. [
16,
18] regarding the case study of Kathmandu Living Labs. It allows for the creation of both local and remote open data.
The number of repeat participants should be increased. This is also one of the primary goals of the efforts described in our paper. Increasing the number of repeat participants would lead to an improvement in the overall quality of mapping thanks to (1) the further training received by less-experienced mappers and (2) the greater input received from highly experienced contributors [
62].
Unlike classical contributions to OSM, humanitarian mapping allows for the secondary revision of created data by more experienced users, regarded as “validators” [
16]. The shorter initial training of humanitarian mappers should be compensated by the more complex training of validators and organizers of mapathons [
64] as well as the development of data validation tools, even during the mapping process [
61]. The role of humanitarian mapping validators is essential for maintaining the high quality of all contributions made during humanitarian mapping—in particular, at mapathons.
1.4. Looking for the Motivations of VGI Contributors
Humanitarian projects based on OSM (HOT OSM, Missing Maps) have many volunteers. In general, the participants’ motivations may range from enjoying helping vulnerable people to spending free time doing “good things”. Motivations can also be influenced by many other aspects, as recently described in [
65]. Furthermore, using gamification approaches to mapping (e.g., getting ‘points’ for every changeset in the map) can help maintain participation by, for example, creating a sense of competitiveness amongst the players and making them feel they are part of a community when playing as a team [
61].
Detailed analysis of the motivations of mapathon participants is described, for example, by Dittus, Quattrone, and Capra [
26]. They investigated whether first-time participants (beginners) with little experience continue mapping at home in the week after the mapathon. On average, 50% of monthly mapathon attendees were recurring visitors. Around 10% of first-time attendees subsequently mapped at home in the first week, and a similar proportion returned to a future mapping party event. The number was significantly lower in irregular mapathons organized mainly by private companies. It seems that the regularity of mapathons is essential to maintain motivation among newcomers. Online participants of mapathons were approximately three times less likely to be retained for future work.
Dittus, Quattrone, and Capra [
26] also looked at what influenced the retention of beginner participants. Technical problems during the mapathon could negatively affect the work of newcomers. However, they did not influence the number of newcomers that continued mapping after the mapathon. Having a mix of attendees in terms of prior experience, from newcomers to highly experienced mappers, also had a positive effect. The enthusiasm of others can inspire newcomers.
Loftian et al. [
66] and Hristova et al. [
25] note that mapathons result in a significant increase in OSM contributions, though, in contrast to experienced users, newcomers typically stop participating after the event is over. Hristova et al. [
25] measured user participation in mapping parties organized regularly in the Greater London area. Most mappers (69%) participated in one event only, while the remaining 31% took part repeatedly. Mapping party attendance appears to be seasonal, with decreased attendance in the first and last quarters of each year.
Green et al. [
28] organized four mapathons in which only students of geoinformatics participated. A total of 60% of mappers participated in more than one mapathon. However, extra credit was offered to the students as an incentive. They also measured productivity and found that more experienced participants were generally more productive.
Questionnaires to determine the motivations of OSM contributors were used by Schmidt and Klettner [
67], Budhathoki and Haythornthwaite [
68], and Alender [
34]. Schmidt and Klettner [
67] asked inactive OSM participants what could motivate them to become active again. The answers differed according to the participants’ previous experience. Less experienced contributors specified tutorials for beginners, while more experienced contributors identified mapping for a specific purpose, e.g., disaster mapping, as a potential motivation. Many inactive participants mentioned “lack of time” as the reason for their inactivity.
Budhathoki and Haythornthwaite [
68] explored differences in motivation between serious and casual OSM contributors. Both groups emphasized the importance of the community, the goals of the project (a free detailed map of the world), and the importance of helping others. Differences between groups were also described. Serious mappers were more oriented towards the community (the goal of OSM cannot be achieved without a community) than casual mappers. Casual mappers were more oriented towards the overall goals of free and open-source projects (maps should be available for free).
Alender [
34] describes similar results. The strongest motivators for participants are helping enhance the environment, helping the community, connecting with nature, and contributing to scientific knowledge. The weakest motivators are enhancing reputation in the community and advancing one’s career. No variation by gender was found, but younger volunteers rated “career” motivation much more highly than the other age groups. The study also recommends grouping more experienced volunteers with less experienced volunteers.
The aforementioned papers seem to indicate that motivation depends on the experience of the contributors and that the desire to help others is a strong motivator not only for humanitarian mappers. An interest in geography and a love of maps are, of course, communitywide motivators. Both casual and serious mappers are well motivated by orientation and interest in mapping and geography and particularly by the possibility of contributing to local geography [
68].
The creation and use of maps are topics also researched by means of psychological methods. Gómez-Barrón, Manso-Callejo, and Alcarria [
69] offer a psychological view of the motivation of VGI producers. Another type of interdisciplinary research in psychology, geography, and cartography using psychological methods is presented by [
70]. Volunteerism, however, is probably as old as humankind and is not related specifically to VGI or OSM. An example of a study about the motivation of volunteers not focused only on VGI is that by Clary and Snyder [
71].
1.5. Experiences with Mapathons—How to Make Them Successful
The abovementioned work [
26] looked at how some aspects of the organization of mapathons influence their success. They discussed, among others, the following measures:
Mapathons should include a mix of less and more experienced participants so that attendees who are experienced in mapping can provide necessary peer support.
Refreshments should be served in a separate area—food served in a separate room may disrupt work, but it also encourages communication between participants.
Technical issues at mapathons (especially a weak internet connection or too few electrical outlets) should be kept to a minimum, as they diminish the participants’ overall experience.
A comparison of mapathon organization experiences from three different universities in three different countries (Italy, USA, South Africa) is offered in [
24]. Various strategies are discernible. The following is a list of examples that could serve as inspiration:
Some universities accept mapathons as part of the curriculum [
24]. Another possibility is to incorporate the teaching of open imagery and open mapping tools in other programs and courses [
16].
Some universities give additional credit to students who participate in mapathons [
24,
28]. Students use it to improve their grades, so this gesture boosts attendance. On the other hand, some studies cast doubt on this approach. Clary and Snyder found that there was a slightly negative relationship between prior experience and future intentions to volunteer for students who felt under external pressure to volunteer [
71].
Students participating in Youth Mappers are involved voluntarily and regularly organize mapathons for their members [
24].
Sometimes, finding a date for a mapathon suitable for most students is challenging (e.g., during exam periods). A humanitarian mapping project could be selected on the HOT Tasking Manager, which would allow contributors to contribute for a whole week [
24].
A mapathon could include a Skype call with a practitioner from the agency requesting the data in order to provide context [
24].
The website “Show Me The Way” [
72], which displays the real-time mapping of OSM users, is visible on a large screen during the mapathon [
24].
The most comprehensive recommendations for organizers of mapathons can be found on the official website of Missing Maps [
23,
27]. Here is a summary:
Find a space that fits your group—a library, community center, university, private company, etc.
Publicize your event on social media, on websites, in the local OSM community, etc.
A strong Internet connection (typically wifi) is necessary. Slow wifi is the worst threat to the success of a mapathon.
Recruit organizers/helpers. One helper is recommended for every 10 mappers at in-person events and for every 2 or 3 mappers online, depending on the group size.
There must be a sufficient number of extension cords for everyone to power a laptop.
Extra laptops/computers for people that may not bring their own are a good idea.
Print training and publicity materials—available on MissingMaps.org.
Arrange refreshments for the mappers. They will stay longer, and they will map longer. “Pizza fills the Map!”
Invite a special guest who can present his experience from the field (e.g., MSF, HOT, OSM, etc.).
Inform people about the mapping task and the locality; speak with them about what they see on the map.
Use a group hashtag during mapping. It allows the results of your group to be summarized after more mapathons or at the end of the year.
Show the mapathon results—the number of mapped buildings and paths; use a leaderboard to show the best mapper of the mapathon.
At the end of the mapathon, go to the pub with the mappers. It is a way of recruiting new organizers to your team.
Organizers of mapathons from the Czech and Slovak Missing Maps community added some further tips based on their experiences (shared on the Trello platform of the Czech and Slovak community [
73]):
Search for and try new locations for mapathons. Try to reach companies.
Allow participants to choose from more groups with different levels of experience—e.g., beginners, advanced mappers, experts/validators. Each group can have its own experienced trainer who explains tips appropriate to the level of his group.
Some experienced mappers should be with a group of beginners to be available to help or to answer questions [
28,
73].
There should also be a group for participants who want to map without training and without being disturbed. Usually, this is the case with experienced mappers.
Most of the above-mentioned recommendations for setting up mapathons are employed for mapathons organized in Brno. In the literature and manuals, however, there is a lack of statistical evidence about the influence of these recommendations—e.g., the possibility of using a borrowed computer. Mapathons held at the Department of Geography offer computers to participants who do not have their own laptops.
In addition, some aspects are not covered in manuals for organizers—e.g., the choice of a weekday for a mapathon. We tried to explore the influence of selected characteristics of mapathons on attendance.
2. Materials and Methods
Two types of data were collected:
Questionnaire answers about the motivations of contributors from the Czech and Slovak Missing Maps community for humanitarian mapping.
Attendance statistics concerning the previous 18 mapathons organized in Brno city.
Questionnaire data were collected from February 2020 to April 2020. The questionnaire was prepared in web form. It was focused on anyone interested in the Missing Maps project in Czechia and Slovakia. The questionnaire was disseminated through many electronic communication channels, either by e-mail to former participants of mapathons or through sharing in the official Facebook group of the project “Missing Maps Czechia & Slovakia.” We also planned to offer questionnaires to participants during various mapathons in Czechia; however, in-person mapathons were canceled because of the COVID-19 pandemic and switched to online events. Despite all the dissemination methods used, only 44 completed questionnaires were obtained—see
Table 1. We see this paper as a communication of our preliminary but significant results. Analyses with an identical scope are planned for upcoming years and upcoming mapathons.
The questionnaire consisted of several sections. The first section collected the anonymous personal details of the participants—age, gender, education, the field of employment or study, and status of employment. These are presented in
Table 1. The main section of the questionnaire concerned the evaluation of motivation. Motivation, in this case, was defined on the basis of 21 statements that represent possible motivators (
Table 2). The motivators and statements offered in the questionnaire were based on the studies by Budhathoki and Haythornthwaite [
68] and by Clary and Snyder [
71]. All statements were measured using a five-point Likert-type scale with 1 as strongly disagree and 5 as strongly agree.
In the last section, participants were asked to fill in the number of his/her total edits from their profile on the Missing Maps page [
74]. They were also asked to evaluate their overall contribution to the OSM project, this time on a scale from 1 (minimal contribution) to 10 (maximal contribution). This section of the questionnaire also asked “When was the last time you contributed to humanitarian mapping?” If a participant selected the answer “more than one year ago”, additional questions appeared, such as “Why did you stop contributing?” and “Do you plan to continue?”
The responses from the questionnaires were analyzed using methods of descriptive statistics. Simple statistical measures were used, including means, medians, and standard deviations. The assumption of normal distribution was tested by the Shapiro–Wilk test. Because the distribution did not assume a normal distribution, we conducted the Mann–Whitney U test to identify differences in motivation between identified groups of humanitarian mapping contributors (based on age, gender, education, mapping experience, field of employment or study, and status of employment). For the same reason, Spearman’s coefficient was used to calculate the correlation between the number of edits made by a participant and the participant’s evaluation of his/her contribution to OSM. Results are displayed using a boxplot graph.
We also analyzed attendance statistics relating to public mapathons in Brno that were organized by our group. These comprised 18 public mapathons held between December 2016 and February 2020 with 183 individual participants. We correlated the characteristics of mapathons in Brno with their attendance and tried to find positive and negative factors influencing the attendance rate. We analyzed the impact of:
The number of participants was also analyzed using methods of descriptive statistics (mean, median) and common types of graphs (line graph, bar chart). Because the distribution did not assume a normal distribution (verified by the Shapiro–Wilk test), we conducted the Mann–Whitney U test and Kruskal–Wallis H test to identify differences in attendance. Results were displayed using common types of boxplot graphs, stacked column graphs, bar graphs, and line graphs.
We were also interested in the portion of recurring participants in mapathons. One of the key goals of organizing mapathons is to motivate contributors to attend mapathons repeatedly.
3. Results
The results are presented in line with the three research questions defined in this study. Answers to each research question are then presented in sub-sections dealing with specific aspects in detail.
3.1. The Motivation for Contributing to Humanitarian Mapping
Identifying the motivations of different humanitarian mappers was the primary goal of the questionnaires. Respondents evaluated 21 statements that represented possible motivators. We analyzed both the general motivations of all participants and differences in motivation between various groups of participants.
3.1.1. The General Motivation for Contributing without Division into Groups
The mean and median values for each statement are presented in
Table 2. A high score (a value between 4 and 5) indicates that individuals considered the item to be a highly significant motivator behind their contribution to humanitarian mapping projects.
The results in
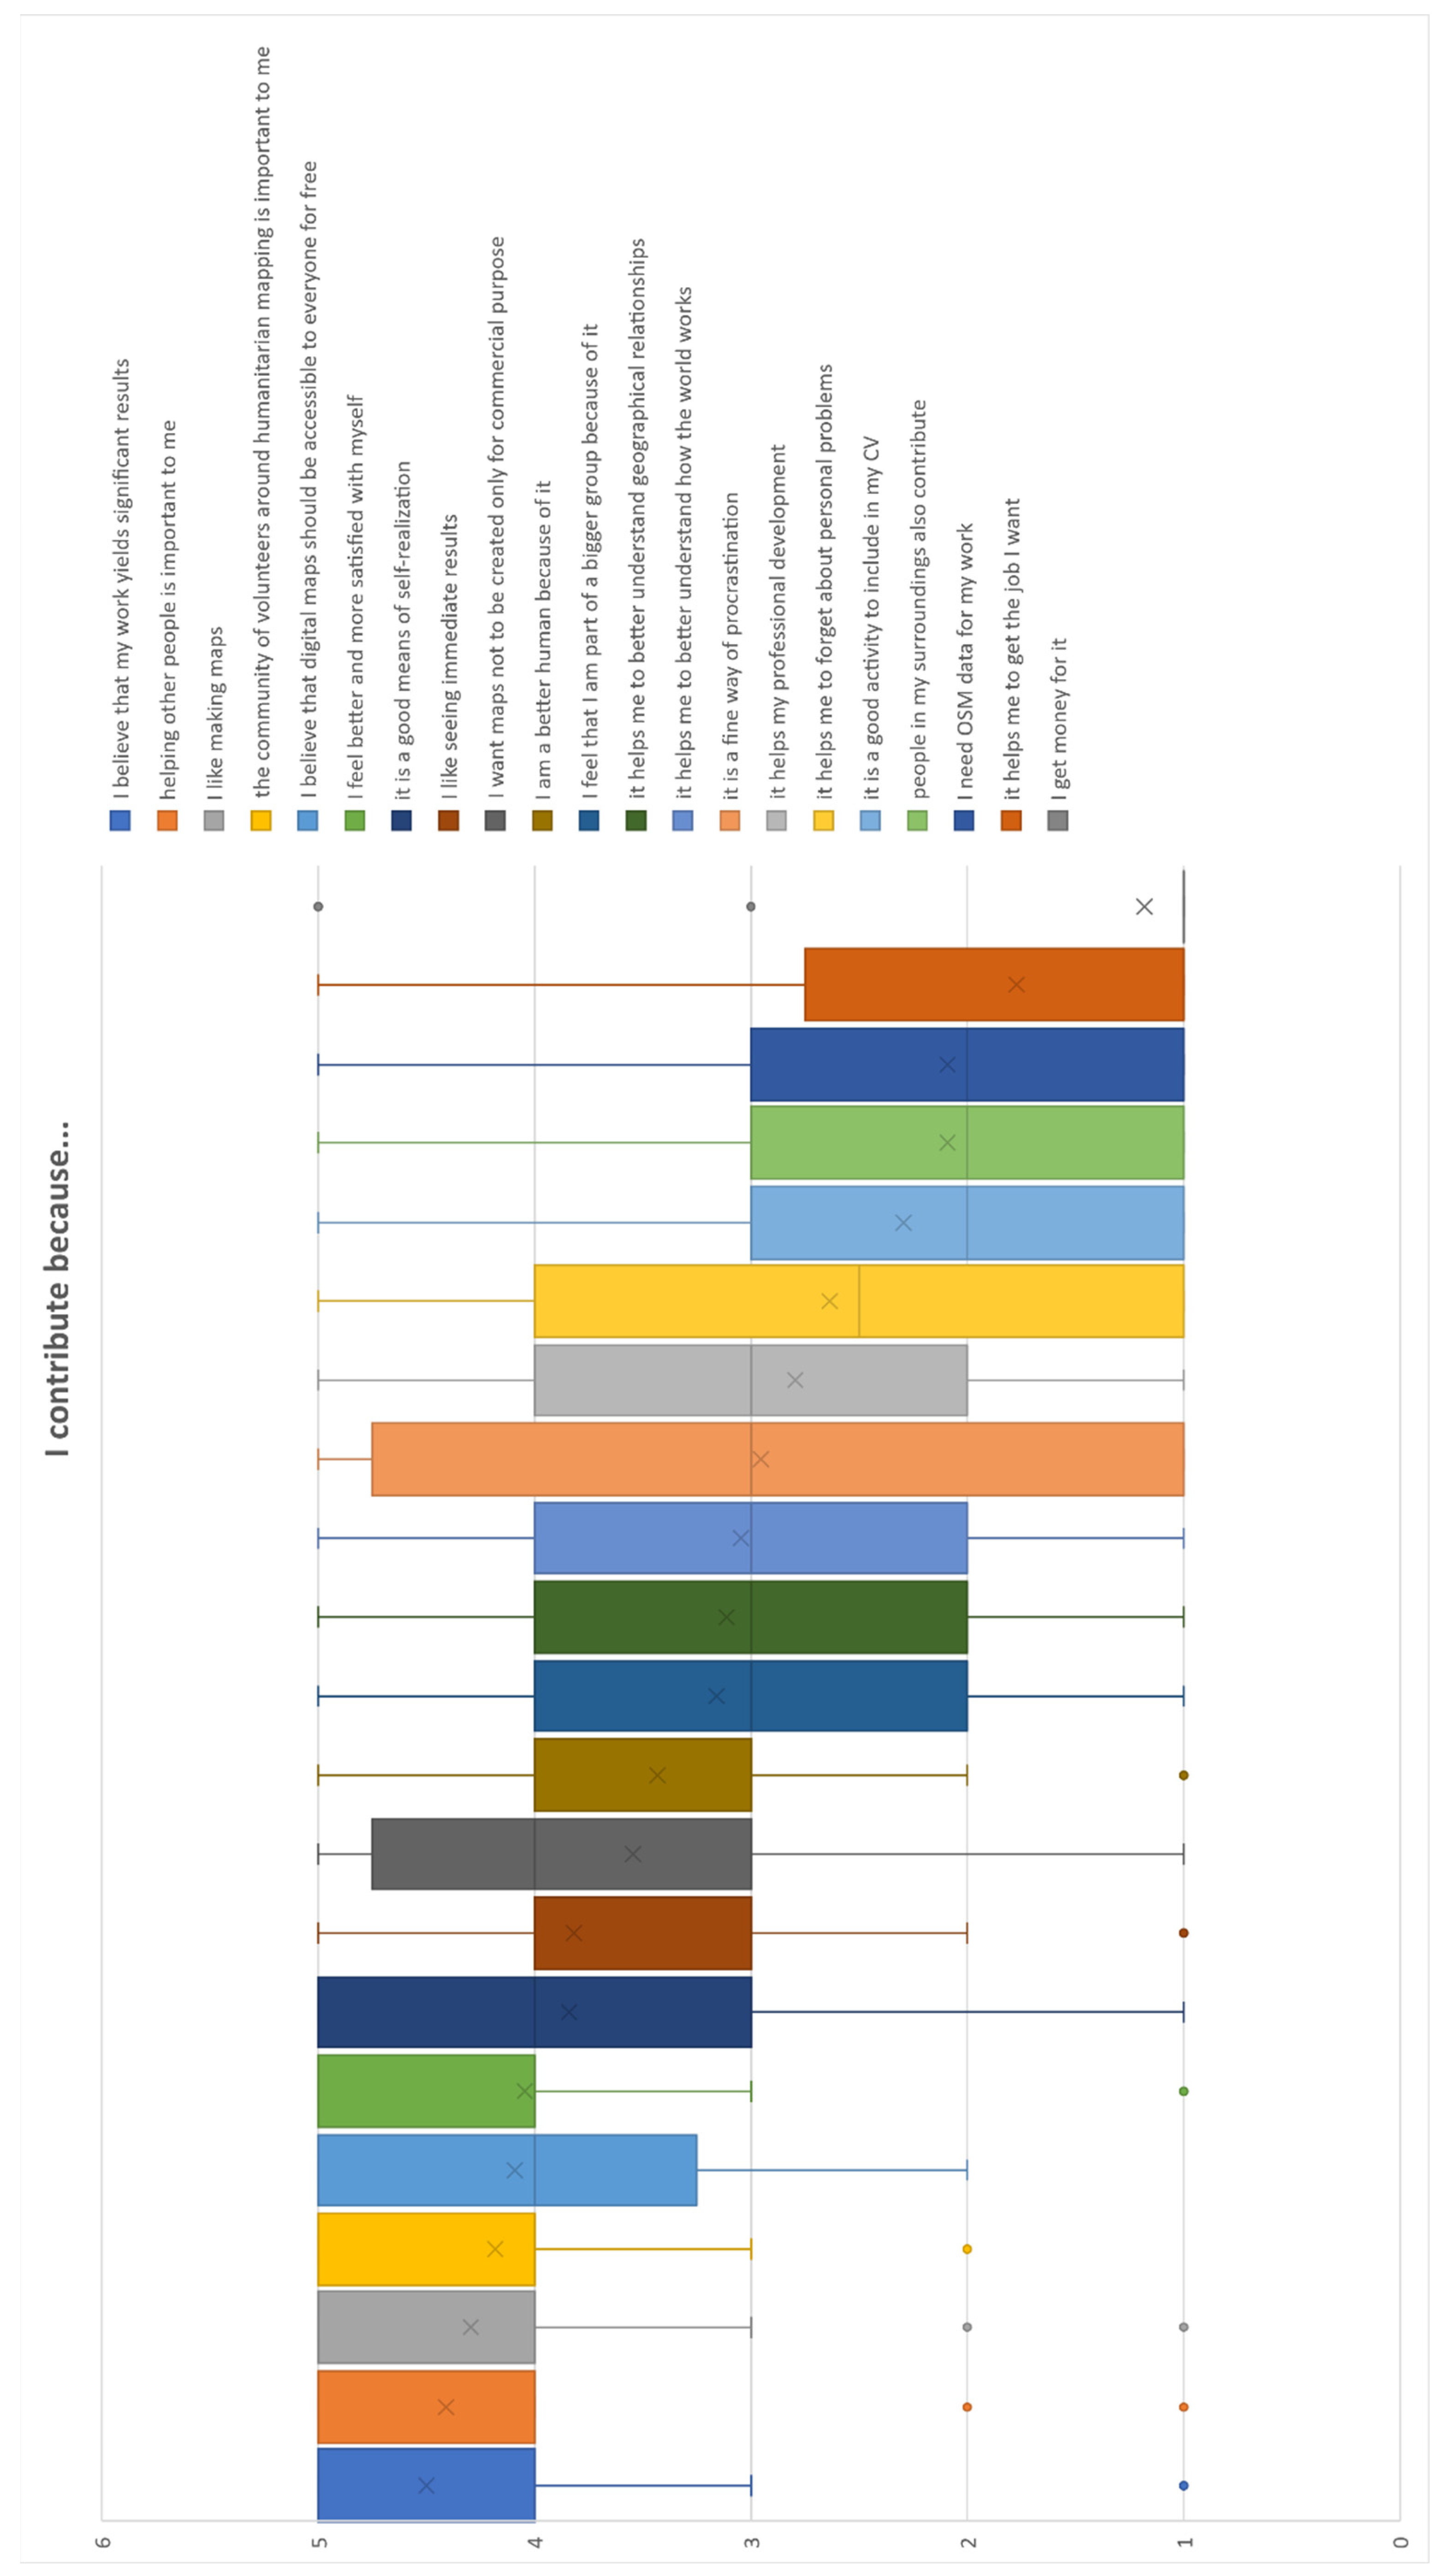
Table 2 and
Figure 1 can be partially summarized as follows. The three most important motivations are:
to produce beneficial results (“I believe that my work yields significant results”),
to feel a sense of solidarity with other people (“helping other people is important for me”),
to achieve personal satisfaction (“I like making maps”).
In general, most of the primary motivations are those related to creating a greater good. In contrast, self-rewarding aspects were considered the least important (“it helps me to get the job I want,” or “I get money for it”).
Figure 1.
Motivations for contributing—answers of all participants to the questionnaire.
Figure 1.
Motivations for contributing—answers of all participants to the questionnaire.
3.1.2. Differences in Motivation between Various Groups of Participants
Participants were divided into groups according to their characteristics—age, gender, education, mapping experience, field of employment or study, and status of employment. Differences in the responses to the 21 given statements between these groups were statistically analyzed. The differences in responses between groups based on age, gender, education, and mapping experience were not statistically significant, as shown by the conducted Mann–Whitney U tests. In contrast, statistically significant differences were found in the case of groups based on the status and field of employment or study.
For status of employment, participants were divided into two groups: students and non-students (employed, retired, children, and others). A difference between these groups was found for the motivator “
I like making maps” (
Table 3,
Figure 2). It was more important for non-students (a median value of 5) than for students (a median value of 4).
For the field of employment or study, participants were divided into two groups: geosciences (cartography, geoinformatics, geodesy, physical geography, human geography, geology) and other fields. Significant differences were found for the motivators: “
people in my surroundings also contribute”, “
it helps my professional development”, and “
I need OSM data for my work” (
Table 4,
Figure 3). All of these motivators were stronger for participants connected to geosciences.
3.1.3. Reasons for Former Contributors to Have Ceased Participation
Our study aimed to identify the motivations of humanitarian mappers from the Czech and Slovak Missing Maps community to participate in mapathons. On the other hand, we also tried to discover the reasons why former contributors ceased their participation. In the questionnaire, 5 of the 44 participants answered that their previous contribution had been more than one year ago. They mentioned two reasons for this—a lack of time (3) and the relatively large distance to the city where mapathons are held (2)—as indicated in their answers below:
“I have a small child (already the third). I have not contributed since its birth. When I have time, I want to continue.”
“Lack of time, but I would like to continue again.”
“I rapidly reduced my mapping activities due to a higher workload.”
“I moved outside Prague. I cannot go to mapathons.”
“I live outside Prague. Maybe I will continue.”
3.2. Characteristics of Mapathons and Recurring Participants
The second research question concerned the issue of how to attract as many participants as possible. The attendance statistics of contributors to 18 mapathons organized in Brno were used for this purpose.
The characteristics of the mapathons (month, day of the week, location, possibility to come without a laptop and use a borrowed computer) and their respective attendance statistics are presented in
Table 5.
Figure 4 shows changes in attendance as a line chart. The influence of the mentioned characteristics was tested statistically.
The numbers of participants were highest at two mapathons organized by private companies (e.g., Kiwi.com (Brno, Czech Republic), CleverMaps (Brno, Czech Republic)). The third-highest number was for participants who attended one of the mapathons held at the Masaryk University. However, it was only the second mapathon in Brno, so it was a new experience for most participants. Our hypothesis was that new or non-traditional locations of mapathons are the best attractors.
However, no significant statistical difference was found between individual types of locations according to the results of the Kruskal–Wallis H test (H(2)) = 5.176, p-value = 0.075). Similarly, the influence of day of the week was found to be non-significant (H(4) = 3.720, p-value = 0.445).
On the other hand, we found statistically significant differences between the months of the year (H(6) = 15.307;
p-value = 0.018). A comparison of the average numbers of participants in mapathons in individual months is shown in
Table 6 and
Figure 5. The lowest numbers are clearly in June and November.
The effect of the possibility of participants to come without their own laptop was analyzed using the Mann–Whitney U test, but a statistically significant difference was not found (computer borrow: U = 37.0, p-value = 0.928).
The number of recurring participants was another focus of this particular research sub-question. The total number of registered participants that attended at least one mapathon in Brno was 181.
Figure 6 shows the breakdown of how many mapathons the 181 registered participants visited in Brno. A total of 121 contributors came to only one mapathon, while 60 participants (32.8%) attended at least two. Only five mappers came to more than five mapathons.
3.3. Self-Assessment of Humanitarian Mappers
The last research question of the conducted study elicited the self-assessment of contributors to humanitarian mapping. A particular sub-question concerned the subjective evaluation of their contributions (underestimations or overestimations).
Data were obtained from the conducted questionnaire. The total number of each respondent’s edits from their profile on the Missing Maps page and their evaluation of their overall contribution to the OSM project were relativized on a scale from 1 (minimal contribution) to 10 (maximal contribution). Spearman’s coefficient was used to calculate the correlation between the number of a participant’s edits and the participant’s evaluation of his/her contribution to OSM. Statistical analysis showed a significant correlation (r = 0.754, p = 0.000) between the number of edits and self-assessment. That is, the self-assessment of participants was generally very accurate.
5. Conclusions and Future Plans
Missing Maps is a humanitarian mapping project that aims to map the most vulnerable places in the developing world using OSM. Created data are used to better respond to crises, achieve SDGs, and monitor their progress.
The main motivation behind the presented research is to expand the active Czech and Slovak community of the humanitarian mapping Missing Map project, to attract new mappers, and to ensure greater attendance at mapathons. We want to discover what attracts contributors from Czechia and Slovakia to participate in humanitarian mapping and to attend mapathons and to discover the reasons why former contributors sometimes cease to contribute. Subsumed in this is the additional goal of reducing the departure of experienced mappers. Overall, these motivations and goals should increase the chances of creating more and better data. Data from a questionnaire and attendance statistics were analyzed to answer the three defined research questions. The following statements can be made:
(A) What are the motivations of different contributors in the Missing Maps community in Czechia and Slovakia?
The importance of community and general altruism are the strongest motivators for all mappers. They are the keys to the success of the (mapping) project, irrespective of differences in gender, age, level of education, or mapping experience. Students are the only exception in that they mention the strong motivator “I like making maps” less often in comparison to other groups. The only other significant differences in motivation were found for contributors connected to the geosciences, but they were related to less important motivators.
Lack of time and long distances to the cities with mapathons were two mentioned reasons why some contributors ended their participation. Expanding the group of cities where mapathons take place could significantly retain experienced contributors and expand the community.
(B) How can a mapathon be set up to attract as many participants as possible?
Statistical analysis found no significant influence of location, day of the week, or possibility to come without a laptop. Only the month of the mapathon had a significant influence, with the weakest attendance in June (due to the end of the university year) and November (due to the organization of a mapathon within the IT conference).
(C) How do contributors to humanitarian mapping subjectively evaluate their contributions? Do they underestimate or overestimate the importance of their results?
Humanitarian mappers evaluate their overall contribution to OSM very realistically. In general, self-assessments were neither over-optimistic nor over-pessimistic.
This paper communicates our preliminary results after the first attempt at data collection from a questionnaire. The number of collected questionnaires was too low for representative results; however, analyses with an identical scope are planned for the upcoming years. We would like to collect new data using the same questionnaire every year to observe changes over time. Searching for the characteristics of the “ideal” mapathon will be repeated after collecting data from a larger number of mapathons from Czechia and Slovakia.
Like most human activity, humanitarian mapping and the organization of mapathons were severely hit by the COVID-19 pandemic in 2020 and 2021. Most of the collective events, including mapathons, moved to online environments. Accordingly, the organization and specificities of online mapathons have become a new object of research in the humanitarian mapping community. We plan to follow this direction and compare the characteristics, attendance, and results of classic and online mapathons organized by Czech and Slovak humanitarian mapping communities in the future.


