Abstract
Aquatic habitats are home to large animals such as marine mammals. Toothed whales have special fat deposits in the forehead region (called the melon) of their heads that are associated with echolocation underwater. This fat is also important industrially for human use. Due to the lack of gene expression information on the melon fat of toothed whales, we investigated the melon morphology via the transcriptomic approach. Four parts of the melons of three individual Risso’s dolphins were used for total RNA extraction, cDNA library preparation, and sequencing via next-generation sequencing (NGS) technologies. After the downstream analysis of raw sequence data, we determined that the outer layer of the melon’s ML4 region played multifunctional roles. The 36 differentially expressed genes of outer melon included ASB5, MYH13, MYOM2, and MYOM3. These genes are associated with muscle function and energy metabolism. Gene clustering and functional enrichment analyses also represented enrichments, such as the pentose phosphate pathway and morphogenesis related to lipid metabolism and muscle functions. This study will be crucial for muscle and fat functional-related molecular studies on aquatic mammals. Additionally, the study presents potential pathways, such as melon fat biosynthesis, for sustainable future developments.
1. Introduction
Marine mammals represent a large group of animals that have diverged to an aquatic lifestyle, exploring the entirety of the oceans. They include whales, dolphins, and porpoises in the order Cetacea and have more aquatic adaptations (e.g., echolocation) compared to the other two orders: Sirenia and Carnivora [1]. The earliest whale-like mammal was estimated to have lived roughly 52 million years ago in the Indo-Pakistan region [2]. The crown cetacean group consists of two suborders Mysticeti and Odontoceti [3]. The largest animal in the world, the blue whale, is a filter-feeding baleen whale; notably, all baleen whales are included in the Mysticeti suborder. The Odontoceti suborder is also called toothed whales, which possess predator teeth to fulfill their feeding habits. Toothed whales, which consist of approximately 70 species, have various adaptations to successfully dominate as top predators in the marine environment [4]. Echolocation is one of these adaptations and plays a vital role in their aquatic life. The fats deposited in their head region (called acoustic fats) contribute to the echolocation abilities of toothed whales [5]. These fats are distributed in two regions: the melon (i.e., the forehead region) and the lower jaw/mandible (i.e., the inner and outer regions of the lower jawbone). The echolocation sound produced by toothed whales is generated from the nasal system, at the monkey lip and then transmitted to outside environment via the melon [6].
The distribution of fats and muscle/connective tissue fibers in the melon of toothed whales may be related to echolocation function [6,7,8]. Previous studies have identified the melon morphologies of different toothed whales [6], and specifically in the sperm whales, three parts were described: the outer melon, inner melon, and spermaceti organ [9]. Hence, melon morphology is an important topic of study to understand the molecular mechanisms and pathways related to the metabolism of special lipids in these top aquatic predators. The melons of toothed whales contain unusual fatty acids, such as branched short-chain fatty acids (SCFA; isovaleric acid), derived triacylglycerols (TAGs), and wax esters (WEs) [10,11,12,13]. The metabolism of these unique fats derived from SCFA has been reported as modifications in the valine, leucine, and isoleucine pathways [13]. Natural WEs are seldom found on earth, and toothed whales’ WEs have become a major concern. However, very little is currently known about the biosynthesis of animal WEs. These fats have important characteristics, including a low density and low molecular weight; as such, whale fats have been utilized as rich lubricants in various industries [14]. Historically these whale fats have been concerned for biosynthesis [15]. The biosynthesis of these WEs is of concern; accordingly, understanding the gene expression in melon fat is of high priority.
Gene expressions in different tissues give insights into tissue morphology [16,17]. Identifying transcriptomes in different parts of tissues can help visualize the specific functional roles of these tissues [18,19]. One study identified the relationship between muscle and fatty acid synthesis in pigs by analyzing adipose tissue transcriptomics [20]. Moreover, they identified the molecular pathways for de novo lipogenesis in pig adipose tissues. Another study expounded on the activation of the acute stress axis in marine mammals via blubber transcriptomics [21]. Therefore, we can predict that the identification of melon fat transcriptomics will be useful in marine mammal research and fat-product development sustainability. Sustainable animal product productions have recently received attention for several reasons. A recent review described meat extender production in a sustainable manner [22]. Another article mentioned the success and sustainability of future developments of food-grade omega-3 oil using aquatic protists [23].
The melon’s natural fat can act as TAG and WEs sources for various purposes. However, nowadays, there are very few possibilities to find these fats due to restrictions to reduce the declining of wild populations; therefore, studying the gene expression of these fats will support their sustainably industrial biosynthesis in the future. Mouse glycerol-3-phosphate acyltransferase (GPAT1) and diacylglycerol acyltransferase (DAGT) have been identified as TAG synthesis enzymes [24]. However, mammalian WEs synthesis genes have been rarely studied. Alternatively, knowing the gene expression patterns of adipose tissue containing muscle fibers in mammals will be important in the food industry in order to improve the quality of farmed livestock [25] and medicine for fat-related diseases in humans [26]. Several genes, including fatty acid binding protein 3 (FABP3), CCAAT enhancer binding protein delta (CEBPD), CCAAT enhancer binding protein gamma (CEBPG), peroxisome proliferator-activated receptor alpha (PPARA), and peroxisome proliferator activated receptor gamma (PPARG), may be involved in the fat-muscle relationship [27].
In this study, we initially identified four morphologies (ML1-ML4) of Grampus griseus (Risso’s dolphin, a species of toothed whales) melon (Figure 1). The selected melon regions displayed patterns of muscle fiber and fat distributions throughout the melon. The aim of the study is to identify gene expression of different morphologies of the melon of toothed whales. Appropriately, we applied transcriptomic technologies to gain molecular perception into the melon morphology of toothed whales. The outer melon region (ML4) contained more differentially expressed genes compared to the inner melon regions. The expressed genes were involved in muscle function, fat metabolism, and morphogenesis.
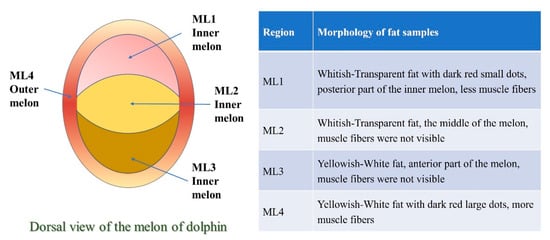
Figure 1.
Morphology of melon of toothed whale, Grampus griseus.
2. Materials and Methods
2.1. Sample Preparation
Four parts of melon fat of Grampus griseus of three male individuals were received from the fishing community in Taiji, Wakayama prefecture, Japan, during March 2019. All the samples were quickly preserved in RNA-later and stored at −80 °C for total RNA extraction. Each fat tissue sample was around 100 mg and collected at the same time.
2.2. RNA Isolation, Library Preparation, and Sequencing
The total RNA was extracted from the frozen samples using RNAiso Plus (Code—9108, Takara Bio Inc., Shiga, Japan) following the manufacturer’s instructions. RNA clean-up was also conducted using the manufactured protocol of NucleoSpin RNA Clean-up XS (Macherey-Nagel, Düren, Germany). The purity, concentration, and integrity of the extracted RNAs were determined using the Qubit® RNA Assay Kit in Qubit® 2.0 Fluorometer (Life Technologies, Carlsbad, CA, USA) and Agilent Tape Station 2200 system (Agilent Technologies, Santa Clara, CA, USA). cDNA library sequences were generated using low sample protocol of TruSeq Stranded mRNA sample preparation guide for Illumina® HiSeq (Illumina, San Diego, CA, USA) following the manufacturer’s recommendations. Then, the cDNA libraries were used for quality control analysis and quantification via the Agilent Tape Station 2200 system (Agilent Technologies, Santa Clara, CA, USA) and sent for sequencing by Illumina HiSeqX platform (Illumina, San Diego, CA, USA). Finally, paired-end raw reads were generated with a 2 × 150 bp run (Macrogen NGS service, Tokyo, Japan).
2.3. Bioinformatic Analysis
High-quality clean reads were generated by trimming adapters and filtered by removing the poly-N sequences containing more than five bases at the 3′ end and whose Q (Phred quality) scores ≤20. The clean reads were mapped to the reference common bottlenose dolphin (Tursiops truncates) genome sequence (GCF_001922835.1_NIST_Tur_tru_v1, downloaded from NCBI) [28], filtered by PRINSEQ 0.20.4 [29], aligned and mapped by HISAT2 2.1.0 [30], and annotated to the GTF of the same genome using StringTie 1.3.4 [31] to obtain the count data of expressed genes in the RNA-seq analysis by Open Portable Pipeline-win-v0.9c 2019 (https://github.com/c2997108/OpenPortablePipeline, accessed on 10 December 2019). Cufflink was used for mapped read splicing; the reads were subsequently compared with genomic annotation information to explore new genes [32]. Furthermore, the number of reads mapped to a particular gene was calculated using the Ballgown algorithm [33] (https://www.bioconductor.org/packages/release/bioc/vignettes/ballgown/inst/doc/ballgown.html, accessed on 17 June 2021). The count data were analyzed in the iDEP online platform (http://bioinformatics.sdstate.edu/idep/, accessed on 10 August 2021 [34]) to identify gene expression variations by producing heat maps, differentially expressed genes (DEGs) by DEseq2, and functional enrichments (K-means clustering and PCA rotation) with default settings. The DEGs were identified by pair-wise comparison of different melon regions. Further, the DEGs were also used to identify functional enrichments in the online version of Enrichr (https://maayanlab.cloud/Enrichr/, accessed on 15 August 2021) and by ShinyGO v0.66 (http://bioinformatics.sdstate.edu/go/, accessed on 15 August 2021).
3. Results
After bioinformatics analysis, the average clean reads of the four samples were in the range between 1,021,970 and 7,541,143. The average uniquely mapping rates were 16.50% (ML1), 11.93% (ML2), 21.5% (ML3), and 36.77% (ML4). We assumed that the available dolphin reference genome in the NCBI GenBank and Ensembl was closely related to the genome of Risso’s dolphin; however, the mapping rate was relatively low. Finally, 25,090 genes in the four samples (three replicates in each) were identified, 9751 genes passed filtering, and 3952 genes were converted to Ensembl gene IDs in the iDEP database. The remaining 5799 genes were kept in the data using original gene IDs. All processed gene count data are available in Table S1.
In the preprocessing of the gene set with count data, genes with less than 0.5 CPM (counts per million) were removed and not considered in further analysis. The CPMs are usually calculated by normalizing the read counts by the total counts per sample. The correlation matrix represents linear relationship by Pearson’s correlation coefficient between individual samples (Figure 2A). It indicates that the ML4 sample has more distance from other samples. Multidimensional scaling (MDS) highlights data points in low-dimensional 2D surfaces while maintaining the distances among samples (Figure 2B). It also identified that each ML4 shows little difference and shows differences from ML1, ML2, and ML3. Therefore, in the downstream analysis, we decided to identify highly variable genes in inner melon samples (ML1, ML2, and ML3) compared to the ML4 outer melon sample.
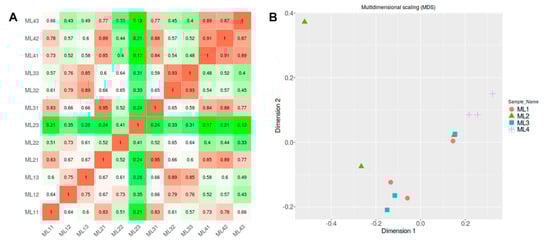
Figure 2.
Preprocessing of data and sample distances. (A): Correlation matrix using top 75% genes. (B): Multidimensional scaling plot representing sample distance. Each sample with replicates, ML1 (ML11, ML12, ML13), ML2 (ML21, ML22, ML23), ML3 (ML31, ML32, ML33), and ML4 (ML41, ML42, ML43).
3.1. Gene Clustering and Functional Enrichments
The iDEP first ranked all genes by the standard deviation across all samples. The heatmap gave us a holistic view of the data with highly variable genes, and the most variable 1000 genes were highlighted among samples (Figure 3A). The most variable 50 genes among the samples are indicated with gene IDs in Figure 3B. The red color signifies high expression, and the green color represents a low expression of genes. In the ML4 sample, the TITIN gene was highly expressed compared to others. The MYOME and COX2 genes were well expressed in both of ML4 and ML2. The NU4M gene was expressed in the ML2. The RS29 gene was highly expressed in both of ML1 and ML2. The PGS2 and CN165 genes were highly expressed in both of ML1 and ML3. The k-Means clustering is an unsupervised method for grouping genes into clusters; in this experiment, four clusters were identified (Figure 3C). Cluster D represents most of the gene expression from the entire melon.
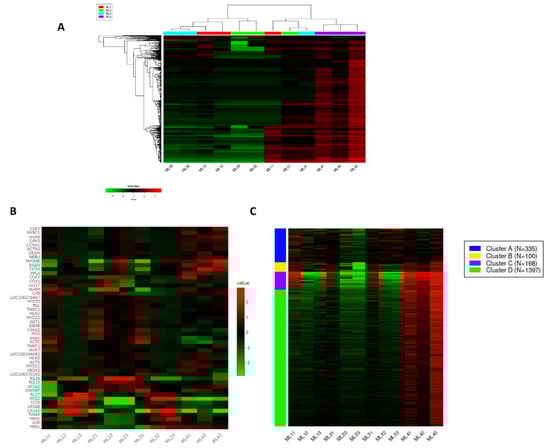
Figure 3.
Gene distribution and clustering in different samples. The red color indicates high gene expression, and the green color indicates low gene expression. (A): Hierarchical clustering of most variable 1000 genes among the samples. (B): Interactive map of most variable 50 genes in the samples. (C): k-Means clustering of most variable 2000 genes into four groups.
The k-Means clustering-dependent genes were analyzed to identify functional enrichment pathways (Figure 4A). They identified significant enrichment pathways [gene ontology (GO) biological process, GO cellular process, GO molecular process, and KEGG pathways] in each cluster; for example, cluster A—11 enrichment pathways, cluster B—7 enrichment pathways, cluster C—12 enrichment pathways, and cluster D—14 enrichment pathways. Notably, the cellular biosynthesis process, amide biosynthesis process, and various mitochondrial activities were enriched that signify the energy metabolism and biosynthetic abilities of the melon of toothed whales. The functional enrichment pathways were also analyzed by PCA data using the PGSEA R package (https://bioconductor.riken.jp/packages/3.0/bioc/html/PGSEA.html, 10 August 2021) in the iDEP pipeline. The enrichment pathways of the PCA rotation analysis are represented in Figure 4B. Interestingly, the PC1 data are involved in actin-filament-based movements, the proteoglycan biosynthesis process, and other signaling pathways.
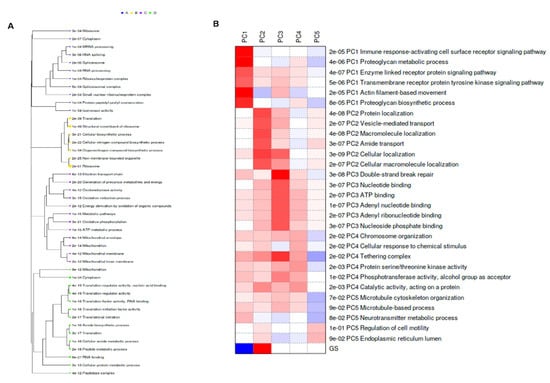
Figure 4.
Functional enrichment analysis concerning highly expressed genes. (A): Enriched pathways for each cluster of k-Means. Gene sets closer on the tree share more genes. Sizes of dot correspond to adjusted p-values. (B): Pathway analysis of PCA rotation.
3.2. Differentially Expressed Genes (DEGs) and Functional Enrichments
We also analyzed DEGs for sample comparisons using the DESeq2 method, 0.1 FDR cut off, and at minimum fold change 2 (Figure 5A). In this method, 36 DEGs were identified for ML4-ML1 up-regulation, but the others were very few (Table 1). Due to the presence of more DEGs in the ML4 region, we only used these DEGs for the functional enrichment Enrichr analysis [35]. It identified functional enrichments of KEGG (Figure 5B), GO biological processes (Figure 5C), GO cellular processes (Figure 5D), and GO molecular functions (Figure 5E). Some lipid metabolism is related to the KEGG pathways, such as the pentose phosphate pathway (PPP), galactose metabolism, starch and sucrose metabolism, and glycolysis/gluconeogenesis pathways were highly enriched. Several DEGs were involved in the PPP (Figure S1A), and the DEGs in the ML4 region showed very high interactions among pathway enrichments (Figure S1B). Further, enrichment analysis by ShinyGO identified six genes related to cellular component assembly and morphogenesis (Table S2).
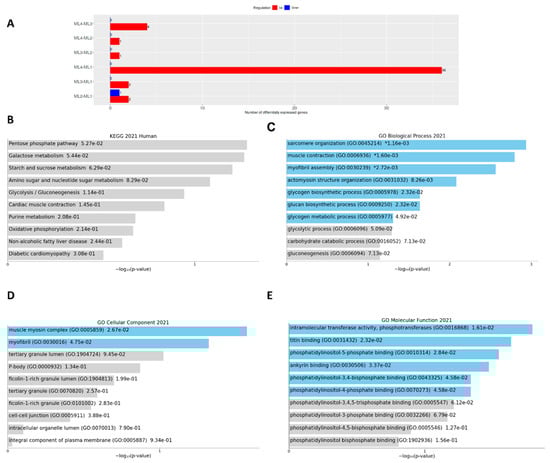
Figure 5.
Distribution of DEGs in different parts of melon and their functional enrichments. (A): Identifying DEGs by DESeq2 method. (B): Enriched KEGG pathways for ML4 up—ML1 down. (C): Enriched Gene Ontology (GO) biological processes for ML4 up—ML1 down. (D): Enriched GO cellular components ML4 up—ML1 down. (E): Enriched GO molecular functions for ML4 up—ML1 down. Blue bars indicate significant enrichment at p-value (< 0.05).

Table 1.
DEGs found in the pair-wise comparisons of samples from the four melon regions.
4. Discussion
This study presents a novel transcriptome analysis of melon fat in toothed whales; accordingly, these data will be significant for various molecular studies on aquatic mammals such as lipid-signaling and biosynthesis. The inner melon regions showed lower mapping percentages compared to the outer melon. This may be caused by insufficient rRNA removal during sample preparation, but the difficulty of RNA extraction from adipose tissue such as melon fat of toothed whales [36] may affect the quality of the library. We used the T. truncatus genome as the reference genome because it is the oldest and nearly 100% complete dolphin genome is available in the NCBI GenBank and Ensembl Genome Browser, which is appropriate for more gene predictions. The Delphininae (T. truncatus) and Globicephalinae (G. grampus) are phylogenetically closer subfamilies in the family Delphinidae [37,38], therefore we believe that the gene prediction using the standard T. truncatus dolphin reference genome of GenBank is more relevant. There is no comprehensive genomics study on melon of any toothed whales and its gene functions are crucial to identifying melon morphology, lipid synthesis and storage, lipid-muscle relationship, and biomarkers. Knowing genes and their functions in special tissues leads to genetic engineering (GE) applications. Sustainable developments in the food and agriculture sectors largely use GE approaches. GE provides benefits for sustainable agriculture developments, such as disease-resistant [39], and food, industry, and medicine [40]. Genomics also essentially contribute to sustainable animal domestication, behavior, and breeding techniques [41].
Only toothed whales have the melon, and we could not find melon-like structures in other animals. Hence, we tried to understand functions of genes comparing other mammalian studies. In this study, DEGs of pairwise comparisons, CN165 (Tursiops truncates protein GVQW1-like, LOC109548114) was highly expressed in the melon, but its function in toothed whales is unknown. The CN165_Human is a long intergenic non-protein coding RNA 596 (LINC00596 gene, chromosome 14, Human) [42]. There were 06 DEGs in the ML4 sample (i.e., outer region of the melon) involved in cellular component morphogenesis (NRAP, EIF4G2, LDB3, PDLIM5, MYOM2, and OBSCN), that is, one of the anatomical structure morphogenesis of GO biological processes. This process involves cellular structure generation, assembly, and organization. The morphogenesis combines cell populations for interactions and building complex, 3D structures in animal bodies [43]. Hence, we believe the melon morphology of toothed whales can be regulated by the outer layer of the melon. Moreover, muscle function-related GO biological processes were significantly enriched in the outer melon region. Several DEGs of outer melon were robustly associated with enriching muscle function-related GO biological processes. CAP2 (cyclase-associated protein 2), MYH13 (myosin heavy chain 13), MYOM2 (myomesin 2), and MYOM3 (myomesin 3), are major proteins involved with myofibril activity in muscle function [44,45,46,47]. The MYOME (myomegalin/phosphodiesterase 4D interacting protein variant 8) gene is a multifunctional protein related to muscle function [48]. Moreover, DWORF is a muscle-specific noncoding RNA involved with sarco-/endo-plasmic reticulum Ca2+-ATPase (SERCA) activity and Ca2+ release during muscle contraction [49]. The ASB5 (ankyrin repeat and SOCS box containing 5) gene is involved in muscle cell proliferation and differentiation [50]. The AMPD1 (adenosine monophosphate deaminase 1) gene catalyzes the deamination of adenosine monophosphate to inosine monophosphate in skeletal muscle [51]. Further, some of the DEGs in the outer melon were related to lipid metabolism. Glucan and glycogen biosynthesis processes were higher in the outer part of the melon. Fats and glycogen are stored in tissues as nutrients or energy sources [52]. Glycogen is also involved in lipid metabolism in animals [53,54]. The OBSCN (obscurin, cytoskeletal calmodulin, and the titin-interacting RhoGEF) gene is associated with intramuscular fat content in pigs [55]. Associations between myofibrils and fats have been identified in previous research [56]. Hence, these DEGs may represent the strong functional relationships between muscle- and fat-metabolism-related activities in the melon of toothed whales. More studies on these DEGs could reveal important lipid-related metabolic actions in toothed whales, marine mammals, and other mammals.
The critical, enriched KEGG pathway of the outer melon region was the PPP. The PPP has been identified as the NADPH provider for fatty acid biosynthesis [57,58]. Additionally, the PPP is an initial part of glycolysis for glucose metabolism, assists in synthesizing ribonucleotides and is also a major source of NADPH. NADPH is required for fatty acid biosynthesis and searches for reactive oxygen species [59]. The other enriched pathways may be involved in lipid and carbohydrate metabolism and the storage of lipids in the melon [60]. Muscle fibers can also be associated with extracellular fat deposition [26]. Compared to the outer melon, we could not identify many DEGs in the inner melon regions. Therefore, we predicted that the inner melon region has a rich deposition of extracellular fats that may regulate by the metabolic functions of the outer melon region. Fatty acid mobilization and muscle metabolism are also associated [61]. Muscle-derived myokines’ (e.g., interleukin-15) regulations of fat metabolism have been discussed in previous studies [62]; we also predict a strong muscle-melon relationship in toothed whales. This relationship may involve changing the melon structure for accumulating and transmitting echolocating sound waves. Fat deposition in the melon region may also correlate with the physical and mental performance of toothed whales like dolphins beyond echolocation [63]. This provides the medicinal importance of melon fat for future investigations. Hence, knowing functional enrichment pathways and related genes in the melon of toothed whales will be useful in aquatic molecular developments as well as to identify the value of animals for suitable management practices.
Based on the transcriptomic data found in this study, we identified the significant role of melon as a multifunctional fatty organ in toothed whales. The muscle fiber distribution in the melon was unequal, and more muscle function and energy metabolism-related genes were found in the outer melon region. Moreover, the identification of these metabolic genes is important for the food industry and biosynthesis of natural products. Biosynthesis of animal products by in vivo or in vitro methods used in synthetic biology currently gets more attention as a conservational, and sustainable industrial approach [64]. Sustainable food development for human consumption is the main goal of the United Nations sustainable development goals by 2030. Therefore, the use of synthetic biology in vitro green application for animal oil production will be important. The use of mechanistic models for sustainable food production has several advantages; however, these models require basic biological data (e.g., amino-acid transport, mass balance, whole-tissue metabolism, and nutrient excretion) [65]. As such, animal molecular studies of the tissues or nutrients of interest require improvements. Structural fatty acids can be produced chemically, enzymatically, and genetically [66]; therefore, the sustainable biosynthesis of toothed whales’ melon fat will be possible in the future.
5. Conclusions
Toothed whales are notable but threatened aquatic megafauna which contains special fat deposits, melon in the head region. This study identifies the major genes and functional enrichments responsible for the function of melon fat of a toothed whale, Risso’s dolphins via the transcriptome approach. Gene clustering and functional enrichments represented the genes related to fat metabolism and muscle function in the melon. The outer layer of the melon represented a higher number of DEGs compared to the inner melon region. These DEGs were mainly associated with muscle function and energy metabolism. Glycogen and glucan biosynthesis pathways were also enriched in the outer melon region. The pentose phosphate KEGG pathway was highly enriched in the outer melon. Finally, we concluded that the outer melon acts as the multifunctional regulating region of the melon, and the inner melon regions are largely depositions of extracellular fats that may regulate by the muscle fiber distribution from the outer melon. Therefore, this study provides useful gene expression information for the biosynthesis of melon fat derivatives sustainably. Findings of this study further safeguards fishery product development, value addition, and food security as aligning with sustainable development goals.
Supplementary Materials
The following are available online at https://www.mdpi.com/article/10.3390/su132413997/s1. Table S1: Count data for gene expression in all the melon tissue types. Table S2: Differential expressed genes and functional enrichments of outer melon, ML4. Figure S1: Metabolic actions of DEGs in the ML4, outer melon.
Author Contributions
Conceptualization—J.D.M.S., Y.I., N.F., K.Y. and S.A.; methodology—J.D.M.S., R.Y., T.S., N.F. and Y.I.; software—K.Y.; validation—J.D.M.S., Y.I., N.F., K.Y., S.K. and S.A.; formal analysis—J.D.M.S. and K.Y; investigation—J.D.M.S. and S.A.; resources—K.Y., S.K. and S.A.; data curation—J.D.M.S. and K.Y.; writing—original draft preparation—J.D.M.S.; writing—review and editing—J.D.M.S., K.Y. and S.A.; visualization—J.D.M.S. and K.Y.; supervision—S.A.; project administration—S.A. All authors have read and agreed to the published version of the manuscript.
Funding
This publication is based upon work supported by the King Abdullah University of Science and Technology (KAUST) Office of Sponsored Research (OSR) under Award No. OSR-2020-CCF-1976.
Institutional Review Board Statement
Ethical review and approval were waived for this study, due to the used samples were considered as small-scale commercial fisheries catch in Japan, therefore we were not required to get any ethical approval from our institute.
Informed Consent Statement
Not applicable.
Data Availability Statement
Selected transcriptomic data has been deposited into the DDBJ (DNA Data Bank of Japan) under the BioProject Accession, PRJDB11720, DRA013103 and will be also available on request from the corresponding authors.
Acknowledgments
We would like to thank the Taiji Fishery Association and researchers at the National Research Institute of Far Seas Fisheries, and Japan Fisheries Research and Education Agency for their help with this research.
Conflicts of Interest
The authors declare no conflict of interest.
References
- Reidenberg, J.S. Anatomical adaptations of aquatic mammals. Anat. Rec. 2007, 290, 507–513. [Google Scholar] [CrossRef]
- Uhen, M.D. The Origin(s) of Whales. Annu. Rev. Earth Planet. Sci. 2010, 38, 189–219. [Google Scholar] [CrossRef]
- Geisler, J.H.; McGowen, M.R.; Yang, G.; Gatesy, J. A supermatrix analysis of genomic, morphological, and paleontological data from crown Cetacea. BMC Evol. Biol. 2011, 11, 112. [Google Scholar] [CrossRef] [PubMed]
- Hooker, S.K. Toothed Whales, Overview. In Encyclopedia of Marine Mammals; Academic Press 30 Corporate Drive: Burlington, MA, USA, 2009; ISBN 9780123735539. [Google Scholar]
- Lonati, G.L.; Westgate, A.J.; Pabst, D.A.; Koopman, H.N. Nitrogen solubility in odontocete blubber and mandibular fats in relation to lipid composition. J. Exp. Biol. 2015, 218, 2620–2630. [Google Scholar] [CrossRef]
- Harper, C.J.; McLellan, W.A.; Rommel, S.A.; Gay, D.M.; Dillaman, R.M.; Pabst, D.A. Morphology of the melon and its tendinous connections to the facial muscles in bottlenose dolphins (Tursiops truncatus). J. Morphol. 2008, 269, 820–839. [Google Scholar] [CrossRef]
- Harper, C. Morphology of the Melon and Its Tendinous Connections to the Facial Muscles in Bottlenose Dolphins (Tursiops Truncatus). Master’s Thesis, University of North Carolina Wilmington, Wilmington, NC, USA, 2007. Available online: https://core.ac.uk/download/pdf/149230312.pdf (accessed on 1 December 2021).
- Mckenna, M.F.; Cranford, T.W.; Berta, A.; Pyenson, N.D. Morphology of the odontocete melon and its implications for acoustic function. Mar. Mammal Sci. 2012, 28, 690–713. [Google Scholar] [CrossRef]
- Karol, R.; Litchfield, C.; Caldwell, D.K.; Caldwell, M.C. Compositional topography of melon and spermaceti organ lipids in the pygmy sperm whale Kogia breviceps: Implications for echolocation. Mar. Biol. 1978, 47, 115–123. [Google Scholar] [CrossRef]
- Litchfield, C.; Ackman, R.G.; Sipos, J.C.; Eaton, C.A. Isovaleroyl triglycerides from the blubber and melon oils of the beluga whale (Delphinapterus leucas). Lipids 1971, 6, 674–681. [Google Scholar] [CrossRef] [PubMed]
- Duggan, Z.P.Z.; Koopman, H.N.; Budge, S.M. Distribution and development of the highly specialized lipids in the sound reception systems of dolphins. J. Comp. Physiol. B Biochem. Syst. Environ. Physiol. 2009, 179, 783–798. [Google Scholar] [CrossRef]
- Jung, J.L.; Simon, G.; Alfonsi, E.; Thoraval, D.; Kervarec, N.; Ben Salem, D.; Hassani, S.; Domergue, F. Qualitative and quantitative study of the highly specialized lipid tissues of cetaceans using HR-MAS NMR and classical GC. PLoS ONE 2017, 12, e0180597. [Google Scholar] [CrossRef] [PubMed]
- Koopman, H.N. Function and evolution of specialized endogenous lipids in toothed whales. J. Exp. Biol. 2018, 221, jeb161471. [Google Scholar] [CrossRef] [PubMed]
- Ivarson, E.; Iven, T.; Sturtevant, D.; Ahlman, A.; Cai, Y.; Chapman, K.; Feussner, I.; Zhu, L.H. Production of wax esters in the wild oil species Lepidium campestre. Ind. Crops Prod. 2017, 108, 535–542. [Google Scholar] [CrossRef]
- Morii, H.; Kaneda, T. Biosynthesis of branched-chain fatty acids from branched-chain amino acids in subcutaneous tissue of the marine little toothed whale, Stenella caeruleo-alba. Comp. Biochem. Physiol.—Part B Biochem. 1982, 71, 357–365. [Google Scholar] [CrossRef]
- Tandon, P.; Wafer, R.; Minchin, J.E.N. Adipose morphology and metabolic disease. J. Exp. Biol. 2018, 221, jeb164970. [Google Scholar] [CrossRef] [PubMed]
- Uslu, V.V.; Petretich, M.; Ruf, S.; Langenfeld, K.; Fonseca, N.A.; Marioni, J.C.; Spitz, F. Long-range enhancers regulating Myc expression are required for normal facial morphogenesis. Nat. Genet. 2014, 46, 753–758. [Google Scholar] [CrossRef] [PubMed]
- Viguerie, N.; Montastier, E.; Maoret, J.J.; Roussel, B.; Combes, M.; Valle, C.; Villa-Vialaneix, N.; Iacovoni, J.S.; Martinez, J.A.; Holst, C.; et al. Determinants of Human Adipose Tissue Gene Expression: Impact of Diet, Sex, Metabolic Status, and Cis Genetic Regulation. PLoS Genet. 2012, 8, e1002959. [Google Scholar] [CrossRef] [PubMed]
- Chandler, J.C.; Aizen, J.; Fitzgibbon, Q.P.; Elizur, A.; Ventura, T. Applying the power of transcriptomics: Understanding male sexual development in decapod crustacea. Integr. Comp. Biol. 2016, 56, 1144–1156. [Google Scholar] [CrossRef] [PubMed]
- Dodson, M.V.; Ramayo-Caldas, Y.; Puig-Oliveras, A.; Estellé, J.; Castelló, A.; Alves, E.; Pena, R.N.; Ballester, M.; Folch, J.M.; Dodson, M.; et al. Lipid metabolism, adipocyte depot physiology and utilization of meat animals as experimental models for metabolic research. Int. J. Biol. Sci. 2010, 14, 691–699. [Google Scholar] [CrossRef] [PubMed]
- Khudyakov, J.I.; Champagne, C.D.; Meneghetti, L.M.; Crocker, D.E. Blubber transcriptome response to acute stress axis activation involves transient changes in adipogenesis and lipolysis in a fasting-adapted marine mammal. Sci. Rep. 2017, 7, 1–12. [Google Scholar] [CrossRef]
- Pintado, T.; Delgado-Pando, G. Towards more sustainable meat products: Extenders as a way of reducing meat content. Foods 2020, 9, 1044. [Google Scholar] [CrossRef]
- Russo, G.L.; Langellotti, A.L.; Oliviero, M.; Sacchi, R.; Masi, P. Sustainable production of food grade omega-3 oil using aquatic protists: Reliability and future horizons. New Biotechnol. 2021, 62, 32–39. [Google Scholar] [CrossRef] [PubMed]
- Wendel, A.A.; Lewin, T.M.; Coleman, R.A. GPATs: Rate limiting enzymes of TAG biosynthesis. North 2010, 1791, 501–506. [Google Scholar] [CrossRef]
- Wu, W.; Zhang, D.; Yin, Y.; Ji, M.; Xu, K.; Huang, X.; Peng, Y.; Zhang, J. Comprehensive transcriptomic view of the role of the LGALS12 gene in porcine subcutaneous and intramuscular adipocytes. BMC Genom. 2019, 20, 1–13. [Google Scholar] [CrossRef] [PubMed]
- Hua, N.; Takahashi, H.; Yee, G.M.; Kitajima, Y.; Katagiri, S.; Kojima, M.; Anzai, K.; Eguchi, Y.; Hamilton, J.A. Influence of muscle fiber type composition on early fat accumulation under high-fat diet challenge. PLoS ONE 2017, 12, e0182430. [Google Scholar] [CrossRef]
- Zhao, X.; Mo, D.; Li, A.; Gong, W.; Xiao, S.; Zhang, Y.; Qin, L.; Niu, Y.; Guo, Y.; Liu, X.; et al. Comparative analyses by sequencing of transcriptomes during skeletal muscle development between pig breeds differing in muscle growth rate and fatness. PLoS ONE 2011, 6, e19774. [Google Scholar] [CrossRef]
- Martinez-Viaud, K.A.; Lawley, C.T.; Vergara, M.M.; Ben-Zvi, G.; Biniashvili, T.; Baruch, K.; St Leger, J.; Le, J.; Natarajan, A.; Rivera, M.; et al. New de novo assembly of the Atlantic bottlenose dolphin (Tursiops truncatus) improves genome completeness and provides haplotype phasing. Gigascience 2019, 8, 1–9. [Google Scholar] [CrossRef]
- Schmieder, R.; Edwards, R. Quality control and preprocessing of metagenomic datasets. Bioinformatics 2011, 27, 863–864. [Google Scholar] [CrossRef] [PubMed]
- Kim, D.; Paggi, J.M.; Park, C.; Bennett, C.; Salzberg, S.L. Graph-based genome alignment and genotyping with HISAT2 and HISAT-genotype. Nat. Biotechnol. 2019, 37, 907–915. [Google Scholar] [CrossRef] [PubMed]
- Pertea, M.; Pertea, G.M.; Antonescu, C.M.; Chang, T.C.; Mendell, J.T.; Salzberg, S.L. StringTie enables improved reconstruction of a transcriptome from RNA-seq reads. Nat. Biotechnol. 2015, 33, 290–295. [Google Scholar] [CrossRef]
- Trapnell, C.; Williams, B.A.; Pertea, G.; Mortazavi, A.; Kwan, G.; Van Baren, M.J.; Salzberg, S.L.; Wold, B.J.; Pachter, L. Transcript assembly and quantification by RNA-Seq reveals unannotated transcripts and isoform switching during cell differentiation. Nat. Biotechnol. 2010, 28, 511–515. [Google Scholar] [CrossRef] [PubMed]
- Frazee, A.C.; Pertea, G.; Jaffe, A.E.; Langmead, B.; Salzberg, S.L.; Leek, J.T. Ballgown bridges the gap between transcriptome assembly and expression analysis. Nat. Biotechnol. 2015, 33, 243–246. [Google Scholar] [CrossRef] [PubMed]
- Ge, S.X.; Son, E.W.; Yao, R. iDEP: An integrated web application for differential expression and pathway analysis of RNA-Seq data. BMC Bioinformatics 2018, 19, 1–24. [Google Scholar] [CrossRef]
- Kuleshov, M.V.; Jones, M.R.; Rouillard, A.D.; Fernandez, N.F.; Duan, Q.; Wang, Z.; Koplev, S.; Jenkins, S.L.; Jagodnik, K.M.; Lachmann, A.; et al. Enrichr: A comprehensive gene set enrichment analysis web server 2016 update. Nucleic Acids Res. 2016, 44, W90–W97. [Google Scholar] [CrossRef] [PubMed]
- Hemmrich, K.; Denecke, B.; Paul, N.E.; Hoffmeister, D.; Pallua, N. RNA isolation from adipose tissue: An optimized procedure for high RNA yield and integrity. Lab. Med. 2010, 41, 104–106. [Google Scholar] [CrossRef]
- McGowen, M.R. Toward the resolution of an explosive radiation--A multilocus phylogeny of oceanic dolphins (Delphinidae). Mol. Phylogenet. Evol. 2011, 60, 345–357. [Google Scholar] [CrossRef] [PubMed]
- Senevirathna, J.D.M.; Yonezawa, R.; Saka, T.; Igarashi, Y.; Yoshitake, K.; Kinoshita, S.; Funasaka, N.; Asakawa, S. Another polymorphic mitochondrial genome of Grampus griseus and phylogeny of family Delphinidae. Mitochondrial DNA Part B 2021, 6, 2569–2571. [Google Scholar] [CrossRef]
- Vincelli, P. Genetic engineering and sustainable crop disease management: Opportunities for case-by-case decision-making. Sustain. 2016, 8, 495. [Google Scholar] [CrossRef]
- Small, B. Sustainable development and technology: Genetic engineering, social sustainability and empirical ethics. Int. J. Sustain. Dev. 2007, 10, 402–435. [Google Scholar] [CrossRef]
- Jensen, P.; Andersson, L. Genomics meets ethology: A new route to understanding domestication, behavior, and sustainability in animal breeding. Ambio 2005, 34, 320–324. [Google Scholar] [CrossRef] [PubMed]
- Rouillard, A.D.; Gundersen, G.W.; Fernandez, N.F.; Wang, Z.; Monteiro, C.D.; McDermott, M.G.; Ma’ayan, A. The harmonizome: A collection of processed datasets gathered to serve and mine knowledge about genes and proteins. Database (Oxford) 2016, 2016, 1–16. [Google Scholar] [CrossRef] [PubMed]
- Hogan, B.L.M. Morphogenesis. Cell 1999, 96, 225–233. [Google Scholar] [CrossRef]
- Wiesen, M.H.J.; Bogdanovich, S.; Agarkova, I.; Perriard, J.C.; Khurana, T.S. Identification and characterization of layer-specific differences in extraocular muscle M-bands. Investig. Ophthalmol. Vis. Sci. 2007, 48, 1119–1127. [Google Scholar] [CrossRef] [PubMed][Green Version]
- Bottje, W.; Kong, B.W.; Reverter, A.; Waardenberg, A.J.; Lassiter, K.; Hudson, N.J. Progesterone signalling in broiler skeletal muscle is associated with divergent feed efficiency. BMC Syst. Biol. 2017, 11, 1–16. [Google Scholar] [CrossRef] [PubMed]
- Kepser, L.J.; Damar, F.; De Cicco, T.; Chaponnier, C.; Prószynski, T.J.; Pagenstecher, A.; Rust, M.B. CAP2 deficiency delays myofibril actin cytoskeleton differentiation and disturbs skeletal muscle architecture and function. Proc. Natl. Acad. Sci. USA 2019, 116, 8397–8402. [Google Scholar] [CrossRef] [PubMed]
- Wu, L.; Zhang, S.; Li, X.; Yao, J.; Ling, L.; Huang, X.; Hu, C.; Zhang, Y.; Sun, X.; Qin, B.; et al. Integrative transcriptomics and proteomic analysis of extraocular muscles from patients with thyroid-associated ophthalmopathy. Exp. Eye Res. 2020, 193, 107962. [Google Scholar] [CrossRef] [PubMed]
- Shapshak, P. Molecule of the month. Drug News Perspect. 2005, 18, 523. [Google Scholar] [CrossRef]
- Nelson, B.R.; Makarewich, C.A.; Anderson, D.M.; Winders, B.R.; Troupes, C.D.; Wu, F.; Reese, A.L.; McAnally, J.R.; Chen, X.; Kavalali, E.T.; et al. A peptide encoded by a transcript annotated as long noncoding RNA enhances SERCA activity in muscle. Science 2016, 351, 271–275. [Google Scholar] [CrossRef]
- Jensen, J.H.; Conley, L.N.; Hedegaard, J.; Nielsen, M.; Young, J.F.; Oksbjerg, N.; Hornshøj, H.; Bendixen, C.; Thomsen, B. Gene expression profiling of porcine skeletal muscle in the early recovery phase following acute physical activity. Exp. Physiol. 2012, 97, 833–848. [Google Scholar] [CrossRef] [PubMed]
- Yu, S.; Wang, G.; Liao, J.; Chen, X. A functional mutation in the AMPD1 promoter region affects promoter activity and breast meat freshness in chicken. Anim. Genet. 2021, 52, 121–125. [Google Scholar] [CrossRef]
- Azeez, O.I.; Meintjes, R.; Chamunorwa, J.P. Fat body, fat pad and adipose tissues in invertebrates and vertebrates: The nexus. Lipids Health Dis. 2014, 13, 1–13. [Google Scholar] [CrossRef]
- Miettinen, S.; Sarkanen, J.R.; Ashammakhi, N. Adipose Tissue and Adipocyte Differentiation: Molecular and Cellular Aspects and Tissue Engineering Applications. Top. Tissue Eng. 2008, 4, 1–26. [Google Scholar]
- Luo, L.; Liu, M. Adipose tissue in control of metabolism. J. Endocrinol. 2016, 231, R77–R99. [Google Scholar] [CrossRef] [PubMed]
- Serão, N.V.L.; Veroneze, R.; Ribeiro, A.M.F.; Verardo, L.L.; Braccini Neto, J.; Gasparino, E.; Campos, C.F.; Lopes, P.S.; Guimarães, S.E.F. Candidate gene expression and intramuscular fat content in pigs. J. Anim. Breed. Genet. 2011, 128, 28–34. [Google Scholar] [CrossRef] [PubMed]
- Qi, K.; Men, X.; Wu, J.; Xu, Z. Rearing pattern alters porcine myofiber type, fat deposition, associated microbial communities and functional capacity. BMC Microbiol. 2019, 19, 1–12. [Google Scholar] [CrossRef]
- Wasylenko, T.M.; Ahn, W.S.; Stephanopoulos, G. The oxidative pentose phosphate pathway is the primary source of NADPH for lipid overproduction from glucose in Yarrowia lipolytica. Metab. Eng. 2015, 30, 27–39. [Google Scholar] [CrossRef] [PubMed]
- Zhao, L.; Tang, X.; Luan, X.; Chen, H.; Chen, Y.Q.; Chen, W.; Song, Y.; Ratledge, C. Role of pentose phosphate pathway in lipid accumulation of oleaginous fungus Mucor circinelloides. RSC Adv. 2015, 5, 97658–97664. [Google Scholar] [CrossRef]
- Patra, K.C.; Hay, N. The pentose phosphate pathway and cancer. Trends Biochem. Sci. 2014, 39, 347–354. [Google Scholar] [CrossRef] [PubMed]
- Watts, J.L.; Ristow, M. Lipid and carbohydrate metabolism in Caenorhabditis elegans. Genetics 2017, 207, 413–446. [Google Scholar] [CrossRef] [PubMed]
- Jeukendrup, A.E.; Saris, W.H.M.; Wagenmakers, A.J.M. Fat Metabolism During Exercise: A Review. Part I: Fatty Acid Mobilization and Muscle Metabolism. Int. J. Sports Med. 2007, 19, 231–244. [Google Scholar] [CrossRef] [PubMed]
- Quinn, L.S. Interleukin-15: A muscle-derived cytokine regulating fat-to-lean body composition. J. Anim. Sci. 2008, 86, 75–83. [Google Scholar] [CrossRef]
- Volek, J.S.; Noakes, T.; Phinney, S.D. Rethinking fat as a fuel for endurance exercise. Eur. J. Sport Sci. 2015, 15, 13–20. [Google Scholar] [CrossRef] [PubMed]
- Slomovic, S.; Pardee, K.; Collins, J.J. Synthetic biology devices for in vitro and in vivo diagnostics. Proc. Natl. Acad. Sci. USA 2015, 112, 14429–14435. [Google Scholar] [CrossRef]
- Hanigan, M.D.; Daley, V.L. Use of Mechanistic Nutrition Models to Identify Sustainable Food Animal Production. Annu. Rev. Anim. Biosci. 2020, 8, 355–376. [Google Scholar] [CrossRef] [PubMed]
- Guo, Y.; Cai, Z.; Xie, Y.; Ma, A.; Zhang, H.; Rao, P.; Wang, Q. Synthesis, physicochemical properties, and health aspects of structured lipids: A review. Compr. Rev. Food Sci. Food Saf. 2020, 19, 759–800. [Google Scholar] [CrossRef] [PubMed]
Publisher’s Note: MDPI stays neutral with regard to jurisdictional claims in published maps and institutional affiliations. |
© 2021 by the authors. Licensee MDPI, Basel, Switzerland. This article is an open access article distributed under the terms and conditions of the Creative Commons Attribution (CC BY) license (https://creativecommons.org/licenses/by/4.0/).