
The Structural Relationship between Service Quality and Sustainable Use Intention of Voice Search Technology in Korea


Abstract
:1. Introduction
2. Theoretical Background
2.1. Perceived Quality
2.2. Interactivity
2.3. Sustainable Use Intention
3. Study Design
3.1. Study Model and Hypotheses
3.1.1. Study Model
3.1.2. Research Hypotheses
3.2. Operational Definition of Variables
3.2.1. Perceived Quality of Voice Bots
3.2.2. Interactivity with Voice Bots
3.2.3. Sustainable Use Intention
4. Study Results
4.1. Demographic Characteristics of Survey Subjects
4.2. Verification of the Validity and Reliability of Measurement Tools
4.2.1. Exploratory Factor Analysis and Reliability Verification
4.2.2. Confirmatory Factor Analysis
4.3. Study Hypothesis Testing
5. Discussion
6. Conclusions
Funding
Institutional Review Board Statement
Informed Consent Statement
Data Availability Statement
Conflicts of Interest
References
- Hwang, S.H.; Ju, D.Y. Usability Evaluation of Artificial Intelligence Search Services Using the Naver App. Korean Soc. Emot. Sensib. 2019, 22, 49–58. [Google Scholar] [CrossRef]
- Manikonda, L.; Deotale, A.; Kambhampati, S. What’s up with privacy?: User preferences and privacy concerns in intelligent personal assistants. In Proceedings of the 2018 AAAI/ACM Conference on AI, Ethics, and Society, New Orleans, LA, USA, 2–3 February 2018; pp. 229–235. [Google Scholar] [CrossRef]
- Kim, M.; Kim, Y.; Yoon, Y.; Kim, H. Implementation of IoT Smart Blackout Curtain Including Voice Recognition Function. Int. J. Internet Things Appl. 2020, 4, 1–6. [Google Scholar] [CrossRef]
- Kim, E.Y. A Study on the Relationship Between Perceived Quality, Perceived Personalization and Consumer Attitude of the Voicebot for Voice Search: Focusing on the Dual Mediation Effect of Perceived Anthropomorphism and Interactivity. Master’s Thesis, Hongik University, Seoul, Korea, 2020. [Google Scholar] [CrossRef]
- Sung, H.; Jeon, H. Untact: Customer’s Acceptance Intention toward Robot Barista in Coffee Shop. Sustainability 2020, 12, 8598. [Google Scholar] [CrossRef]
- Sa, N.; Yuan, X. Examining User Perception and Usage of Voice Search. Data Inf. Manag. 2021, 5, 40–47. [Google Scholar] [CrossRef]
- Yeon, D.; Park, G.; Kim, H.-W. User Experience Analysis and Management Based on Text Mining: A Smart Speaker Case. Inf. Syst. Rev. 2020, 22, 77–99. [Google Scholar] [CrossRef]
- Nahavandi, S. Industry 5.0—A Human-Centric Solution. Sustainability 2019, 11, 4371. [Google Scholar] [CrossRef] [Green Version]
- McMillan, S.; Hwang, J.-S. Measures of Perceived Interactivity: An Exploration of the Role of Direction of Communication, User Control, and Time in Shaping Perceptions of Interactivity. J. Advert. 2013, 31, 29–42. [Google Scholar] [CrossRef]
- Garbarino, E.; Johnson, M.S. The Different Roles of Satisfaction, Trust, and Commitment in Customer Relationships. J. Mark. 1999, 63, 70–87. [Google Scholar] [CrossRef]
- Bhattacherjee, A. An empirical analysis of the antecedents of electronic commerce service continuance. Decis. Support Syst. 2001, 32, 201–214. [Google Scholar] [CrossRef]
- Dorsch, M.J.; Grove, S.J.; Darden, W.R. Consumer intentions to use a service category. J. Serv. Mark. 2000, 14, 92–117. [Google Scholar] [CrossRef]
- Suh, M.W. A Study on the Sustainability of Wood Product Through Consumer Participatio. Art. Des. 2021, 24, 69–83. [Google Scholar]
- Bloemer, J.; Kasper, H.D. The complex relationship between consumer satisfaction and brand loyalty. J. Econ. Psychol. 1995, 16, 311–329. [Google Scholar] [CrossRef]
- Han, S.I.; Chang, S.J. A Study on User Satisfaction and Continuity Usage Intention in the Automotive Industry: Focusing on the Expectation Confirmation Model. Asia-Pac. J. Bus. Ventur. Entrep. 2021, 16, 189–203. [Google Scholar] [CrossRef]
- Na, Y.K.; Kang, S.; Jeong, H.Y. The Effect of Market Orientation on Performance of Sharing Economy Business: Focusing on Marketing Innovation and Sustainable Competitive Advantage. Sustainability 2019, 11, 729. [Google Scholar] [CrossRef] [Green Version]
- Parasuraman, A.; Zeithaml, V.A.; Berry, L. SERVQUAL: A multiple-item scale for measuring consumer perceptions of service quality. J. Ret. 1988, 64, 12–40. [Google Scholar]
- Kang, C.M.; Lee, G.C. Analysis of Effects of Rational and Emotional Advertising Appeals on Products from a View of Psy-chological Distance: Focusing on the Eye-Tracking Method. J. Dig. Con. 2019, 17, 97–104. [Google Scholar] [CrossRef]
- Szybillo, G.J.; Jacoby, J. Intrinsic versus extrinsic cues as determinants of perceived product quality. J. Appl. Psychol. 1974, 59, 74–78. [Google Scholar] [CrossRef]
- Beneke, J.; Flynn, R.; Greig, T.; Mukaiwa, M. The influence of perceived product quality, relative price and risk on customer value and willingness to buy: A study of private label merchandise. J. Prod. Brand Manag. 2013, 22, 218–228. [Google Scholar] [CrossRef]
- Zeithaml, V.A.; Berry, L.L.; Parasuraman, A. Communication and Control Processes in the Delivery of Service Quality. J. Mark. 1988, 52, 35–48. [Google Scholar] [CrossRef]
- Tsang, N.K.F.; Lee, L.Y.S.; Wong, A.; Chong, R. THEMEQUAL—Adapting the SERVQUAL Scale to Theme Park Services: A Case of Hong Kong Disneyland. J. Travel Tour. Mark. 2012, 29, 416–429. [Google Scholar] [CrossRef]
- Kwak, W.J.; Kim, H.-K. Servant Leadership and Customer Service Quality at Korean Hotels: Multilevel Organizational Citizenship Behavior as a Mediator. Soc. Behav. Pers. Int. J. 2015, 43, 1287–1298. [Google Scholar] [CrossRef]
- Lim, S.; Son, D.; Kim, J.; Lee, Y.B.; Song, J.-K.; Choi, S.; Lee, D.J.; Kim, J.H.; Lee, M.; Hyeon, T.; et al. Transparent and Stretchable Interactive Human Machine Interface Based on Patterned Graphene Heterostructures. Adv. Funct. Mater. 2014, 25, 375–383. [Google Scholar] [CrossRef]
- Lee, Y.-H.; Wu, J.-Y. The effect of individual differences in the inner and outer states of ICT on engagement in online reading activities and PISA 2009 reading literacy: Exploring the relationship between the old and new reading literacy. Learn. Individ. Differ. 2012, 22, 336–342. [Google Scholar] [CrossRef]
- Lee, S.-J.; Lee, W.-N.; Kim, H.; Stout, P.A. A Comparison of Objective Characteristics and User Perception of Web Sites. J. Interact. Advert. 2013, 4, 61–75. [Google Scholar] [CrossRef]
- Hoffmann, A.O.; Franken, H.; Broekhuizen, T.L. Customer intention to adopt a fee-based advisory model: An empirical study. In retail banking. Int. J. Bank Mark. 2012, 30, 102–127. [Google Scholar] [CrossRef] [Green Version]
- Liu, Y.; Shrum, L.J. What is Interactivity and is it Always Such a Good Thing? Implications of Definition, Person, and Situation for the Influence of Interactivity on Advertising Influences. J. Advert. 2002, 31, 53–64. [Google Scholar] [CrossRef]
- Dick, A.S.; Basu, K. Customer Loyalty: Toward an Integrated Conceptual Framework. J. Acad. Mark. Sci. 1994, 22, 99–113. [Google Scholar] [CrossRef]
- Fan, L.; Gao, L.; Lou, F.; Liu, X.; Zhao, S.; Mu, H.; Li, Z.; Shi, L.; Wang, L.; Jia, X.; et al. Patients’ perceptions of service quality in China: An investigation using the SERVQUAL model. PLoS ONE 2017, 12, e0190123. [Google Scholar] [CrossRef] [PubMed]
- Lee, S.M.; Koo, Y.R. A Study on the Key Design Trends of the Company Campuses for Organizational Innovation in a New Era of Sustainability - Focusing on the Recent Cases of Global IT Organizations. J. Korean Soc. Des. Cult. 2017, 23, 427–443. [Google Scholar] [CrossRef]
- Lee, H.J.; Lee, U.H.; Lee, G.H. The Impact of University Students’ Perceived Service Quality of Mobile Social Commerce on Their Satisfaction and Continued Usage Intentions. J. Consum. Cult. 2017, 20, 234–254. [Google Scholar] [CrossRef]
- No, J.H.; Son, J.H.; Kim, J.H. Action Research to Improve Experimental Activities and Interactions in Online Science Class. J. Korean Soc. 2021, 14, 159–172. [Google Scholar]
- Hong, E.; Cho, K.; Choi, J. Effects of Anthropomorphic Conversational Interface for Smart Home: An Experimental Study on the Voice and Chatting Interactions. J. HCI Soc. Korea 2017, 12, 15–23. [Google Scholar] [CrossRef]
- Aaker, D.A. Managing Brand Equity; The Free Press: New York, NY, USA, 1991. [Google Scholar]
- Jacoby, J.; Kyner, D.B. Brand Loyalty Vs. Repeat Purchasing Behavior. J. Mark. Res. 1973, 10, 1–9. [Google Scholar] [CrossRef]
- Lee, M.; Ulgado, F.M. Consumer evaluations of fast-food services: A cross-national comparison. J. Serv. Mark. 1997, 11, 39–52. [Google Scholar] [CrossRef]
- Venkatesh, V.; Morris, M.G.; Davis, G.B.; Davis, F.D. User Acceptance of Information Technology: Toward a Unified View. MIS Q. 2003, 27, 425–478. [Google Scholar] [CrossRef] [Green Version]
- Dautenhahn, K.; Ogden, B.; Quick, T. From embodied to socially embedded agents—Implications for interaction-aware robots. Cogn. Syst. Res. 2001, 3, 397–428. [Google Scholar] [CrossRef]
- Cho, R.; Im, S.H. AI Chatbot Users’ Satisfaction and Intention for Continued Use: Moderating Effects of Chatbot Type and Motivations. Kor. Con. Ass. 2020, 20, 630–640. [Google Scholar] [CrossRef]
- Hu, L.T.; Bentler, P.M. Cutoff criteria for fit indexes in covariance structure analysis: Conventional criteria versus new alternatives. Struct. Equ. Model. Multidiscip. J. 1999, 6, 1–55. [Google Scholar] [CrossRef]
- Browne, M.W.; Cudeck, R. Alternative ways of assessing model fit. Sociol. Methods Res. 1992, 21, 230–258. [Google Scholar] [CrossRef]
- Kim, M.S.; Boo, K.M.; Im, K.D.; Ko, S.B.; Kim, S.B. An Interactive UCC Creation and the Effect Analysis. Sci. Emot. Sensib. 2010, 13, 459–466. [Google Scholar]
- Song, M.K.; Yun, H.H. The Effects of Interpersonal Justice and Authenticity on Forgiveness, Sympathy and Revisit Intention in Restaurant’s Service Recovery. Culin. Sci. Hosp. Res. 2020, 26, 133–413. [Google Scholar] [CrossRef]
- Lee, H.J.; Cho, C.H.; Lee, S.Y.; Keel, Y.H. A Study on Consumers’ Perception of and Use Motivation of Artificial Intelligence(AI) Speaker. Korean Con. 2019, 19, 138–154. [Google Scholar] [CrossRef]
- Chen, S.-C.; Lin, C.-P. The impact of customer experience and perceived value on sustainable social relationship in blogs: An empirical study. Technol. Forecast. Soc. Chang. 2015, 96, 40–50. [Google Scholar] [CrossRef]
- Turel, O.; Serenko, A.; Bontis, N. User acceptance of hedonic digital artifacts: A theory of consumption values perspective. Inf. Manag. 2010, 47, 53–59. [Google Scholar] [CrossRef]


| Division | Device | Characteristics (Release Year) |
|---|---|---|
| Apple Siri |  | It is installed on the iPhone 4S and is the first voice AI assistant platform. The disadvantage is applicable only to Apple machines (2011) |
| LG Q Voice |  | It was first installed on a smartphone and later applied to a smart TV (2012) |
| Amazon Alexa |  | It has the advantage of being able to apply the services of third-party companies (2014) |
| MS Cortana |  | It started as a voice AI assistant service for PC (2015) |
| Google Assistant |  | By securing vast amounts of user data, excellent response services are possible compared to competitors (2016) |
| Samsung Bixby |  | It is based on big data and deep learning and is applicable to all machines of Samsung Electronics (2017) |
| Baidu Duer |  | It is a machine that combines artificial intelligence-based voice recognition and search technology, and shows an accuracy of about 98% or more (2017) |
| Division | N | % | |
|---|---|---|---|
| Gender | Male | 161 | 59.4 |
| Female | 110 | 40.6 | |
| Age | 20s | 75 | 27.7 |
| 30s | 148 | 54.6 | |
| 40s | 20 | 7.4 | |
| 50s or older | 28 | 10.3 | |
| Occupation | Office workers (including professionals) | 197 | 72.7 |
| Self-employment/Business-employment | 31 | 11.4 | |
| Student | 38 | 14.0 | |
| Homemakers | 5 | 1.8 | |
| Total | 271 | 100.0 | |
| Factor | Item | Factor Loading | Cronbach’s α | ||
|---|---|---|---|---|---|
| Factor 1 | Factor 2 | Factor 3 | |||
| Playfulness | I feel pleasure when I use a voice bot (PQ 2) | 0.838 | 0.114 | 0.081 | 0.833 |
| The voice bot service is sufficient to stimulate my curiosity (PQ 3) | 0.822 | 0.144 | 0.096 | ||
| Using the voice bot is novel and I feel interesting (PQ 4) | 0.803 | 0.084 | 0.149 | ||
| When I use a voice bot, I feel happy (PQ 1) | 0.750 | 0.058 | 0.067 | ||
| Assurance | Voice bots provide information accurately (PQ 6) | 0.034 | 0.847 | 0.085 | 0.818 |
| Voice bots definitely deliver results (PQ 7) | 0.107 | 0.839 | −0.014 | ||
| Voice bots are reliable (PQ 5) | 0.151 | 0.741 | 0.160 | ||
| Voice bots provide services within the promised time (PQ 8) | 0.107 | 0.734 | 0.200 | ||
| Empathy | Voice bots try to empathize with me (PQ 11) | 0.136 | 0.144 | 0.859 | 0.815 |
| Voice bots try to understand what I am asking for (PQ 10) | 0.108 | 0.061 | 0.836 | ||
| The voice bot tries to understand matters of my interest (PQ 12) | 0.095 | 0.158 | 0.816 | ||
| Eigenvalue | 2.671 | 2.603 | 2.217 | ||
| Variance % | 24.285 | 23.661 | 20.159 | ||
| Cumulative variance % | 24.285 | 47.945 | 68.104 | ||
| Factor | Item | Factor Loading | Cronbach’s α | |
|---|---|---|---|---|
| Factor 1 | Factor 2 | |||
| Sustainable use intention | I plan to continue using the voice bots hereafter too (CU 2). | 0.903 | 0.156 | 0.802 |
| I hope I can continue using voice bots hereafter too (CU 3). | 0.842 | 0.092 | ||
| I plan to use voice bots frequently hereafter too (CU 1). | 0.706 | 0.418 | ||
| Interactivity | I feel that interactive communication with voice bots is being made (Inter 2). | 0.155 | 0.852 | 0.762 |
| I feel that I interact with voice bots (Inter 1). | 0.084 | 0.803 | ||
| I think I conversate with voice bots in real time (Inter 3). | 0.337 | 0.736 | ||
| Eigenvalue | 2.166 | 2.118 | ||
| Variance % | 36.106 | 35.304 | ||
| Cumulative variance % | 36.106 | 71.410 | ||
| Division | Unstandardized Factor Loading | Standard Error | Standardized Factor Loading | Error Variance | t | Construct Reliability (CR) | Average Variance Extracted (AVE) | ||
|---|---|---|---|---|---|---|---|---|---|
| Playfulness | → | PQ 1 | 1.000 | - | 0.626 | 0.499 | - | 0.842 | 0.574 |
| → | PQ 2 | 1.338 | 0.136 | 0.777 | 0.378 | 9.868 *** | |||
| → | PQ 3 | 1.416 | 0.140 | 0.811 | 0.336 | 10.105 *** | |||
| → | PQ 4 | 1.395 | 0.143 | 0.764 | 0.448 | 9.762 *** | |||
| Assurance | → | PQ 5 | 1.000 | - | 0.687 | 0.442 | - | 0.849 | 0.585 |
| → | PQ 6 | 1.138 | 0.107 | 0.790 | 0.308 | 10.651 *** | |||
| → | PQ 7 | 1.068 | 0.102 | 0.766 | 0.317 | 10.456 *** | |||
| → | PQ 8 | 0.979 | 0.103 | 0.676 | 0.450 | 9.493 *** | |||
| Empathy | → | PQ 10 | 1.000 | - | 0.739 | 0.436 | - | 0.829 | 0.618 |
| → | PQ 11 | 1.142 | 0.100 | 0.852 | 0.259 | 11.441 *** | |||
| → | PQ 12 | 0.955 | 0.088 | 0.730 | 0.420 | 10.841 *** | |||
| Interactivity | → | Inter 1 | 1.000 | - | 0.660 | 0.540 | - | 0.789 | 0.542 |
| → | Inter 2 | 1.036 | 0.112 | 0.743 | 0.365 | 9.228 *** | |||
| → | Inter 3 | 1.161 | 0.125 | 0.759 | 0.414 | 9.305 *** | |||
| Sustainable use | → | CU 1 | 1.000 | - | 0.734 | 0.366 | - | 0.844 | 0.645 |
| → | CU 2 | 1.129 | 0.093 | 0.876 | 0.165 | 12.147 *** | |||
| → | CU 3 | 1.081 | 0.099 | 0.718 | 0.471 | 10.925 *** | |||
| Division | Perceived Quality | Interactivity | Sustainable Use Intention | ||
|---|---|---|---|---|---|
| Playfulness | Assurance | Empathy | |||
| Playfulness | 0.574 | ||||
| Assurance | 0.302 *** (0.091) | 0.585 | |||
| Empathy | 0.321 *** (0.103) | 0.327 *** (0.107) | 0.618 | ||
| Interactivity | 0.461 *** (0.213) | 0.347 *** (0.120) | 0.405 *** (0.164) | 0.542 | |
| Sustainable use intention | 0.455 *** (0.207) | 0.429 *** (0.184) | 0.309 *** (0.095) | 0.558 *** (0.311) | 0.645 |
| χ2 | df | p | SRMR | TLI | CFI | RMSEA (90% CI) |
|---|---|---|---|---|---|---|
| 251.824 | 109 | 0.000 | 0.053 | 0.905 | 0.924 | 0.070 (0.058-0.081) |
| Path | Unstandardized Path Coefficient | Standard Error | Standardized Path Coefficient | t(C.R) | p |
|---|---|---|---|---|---|
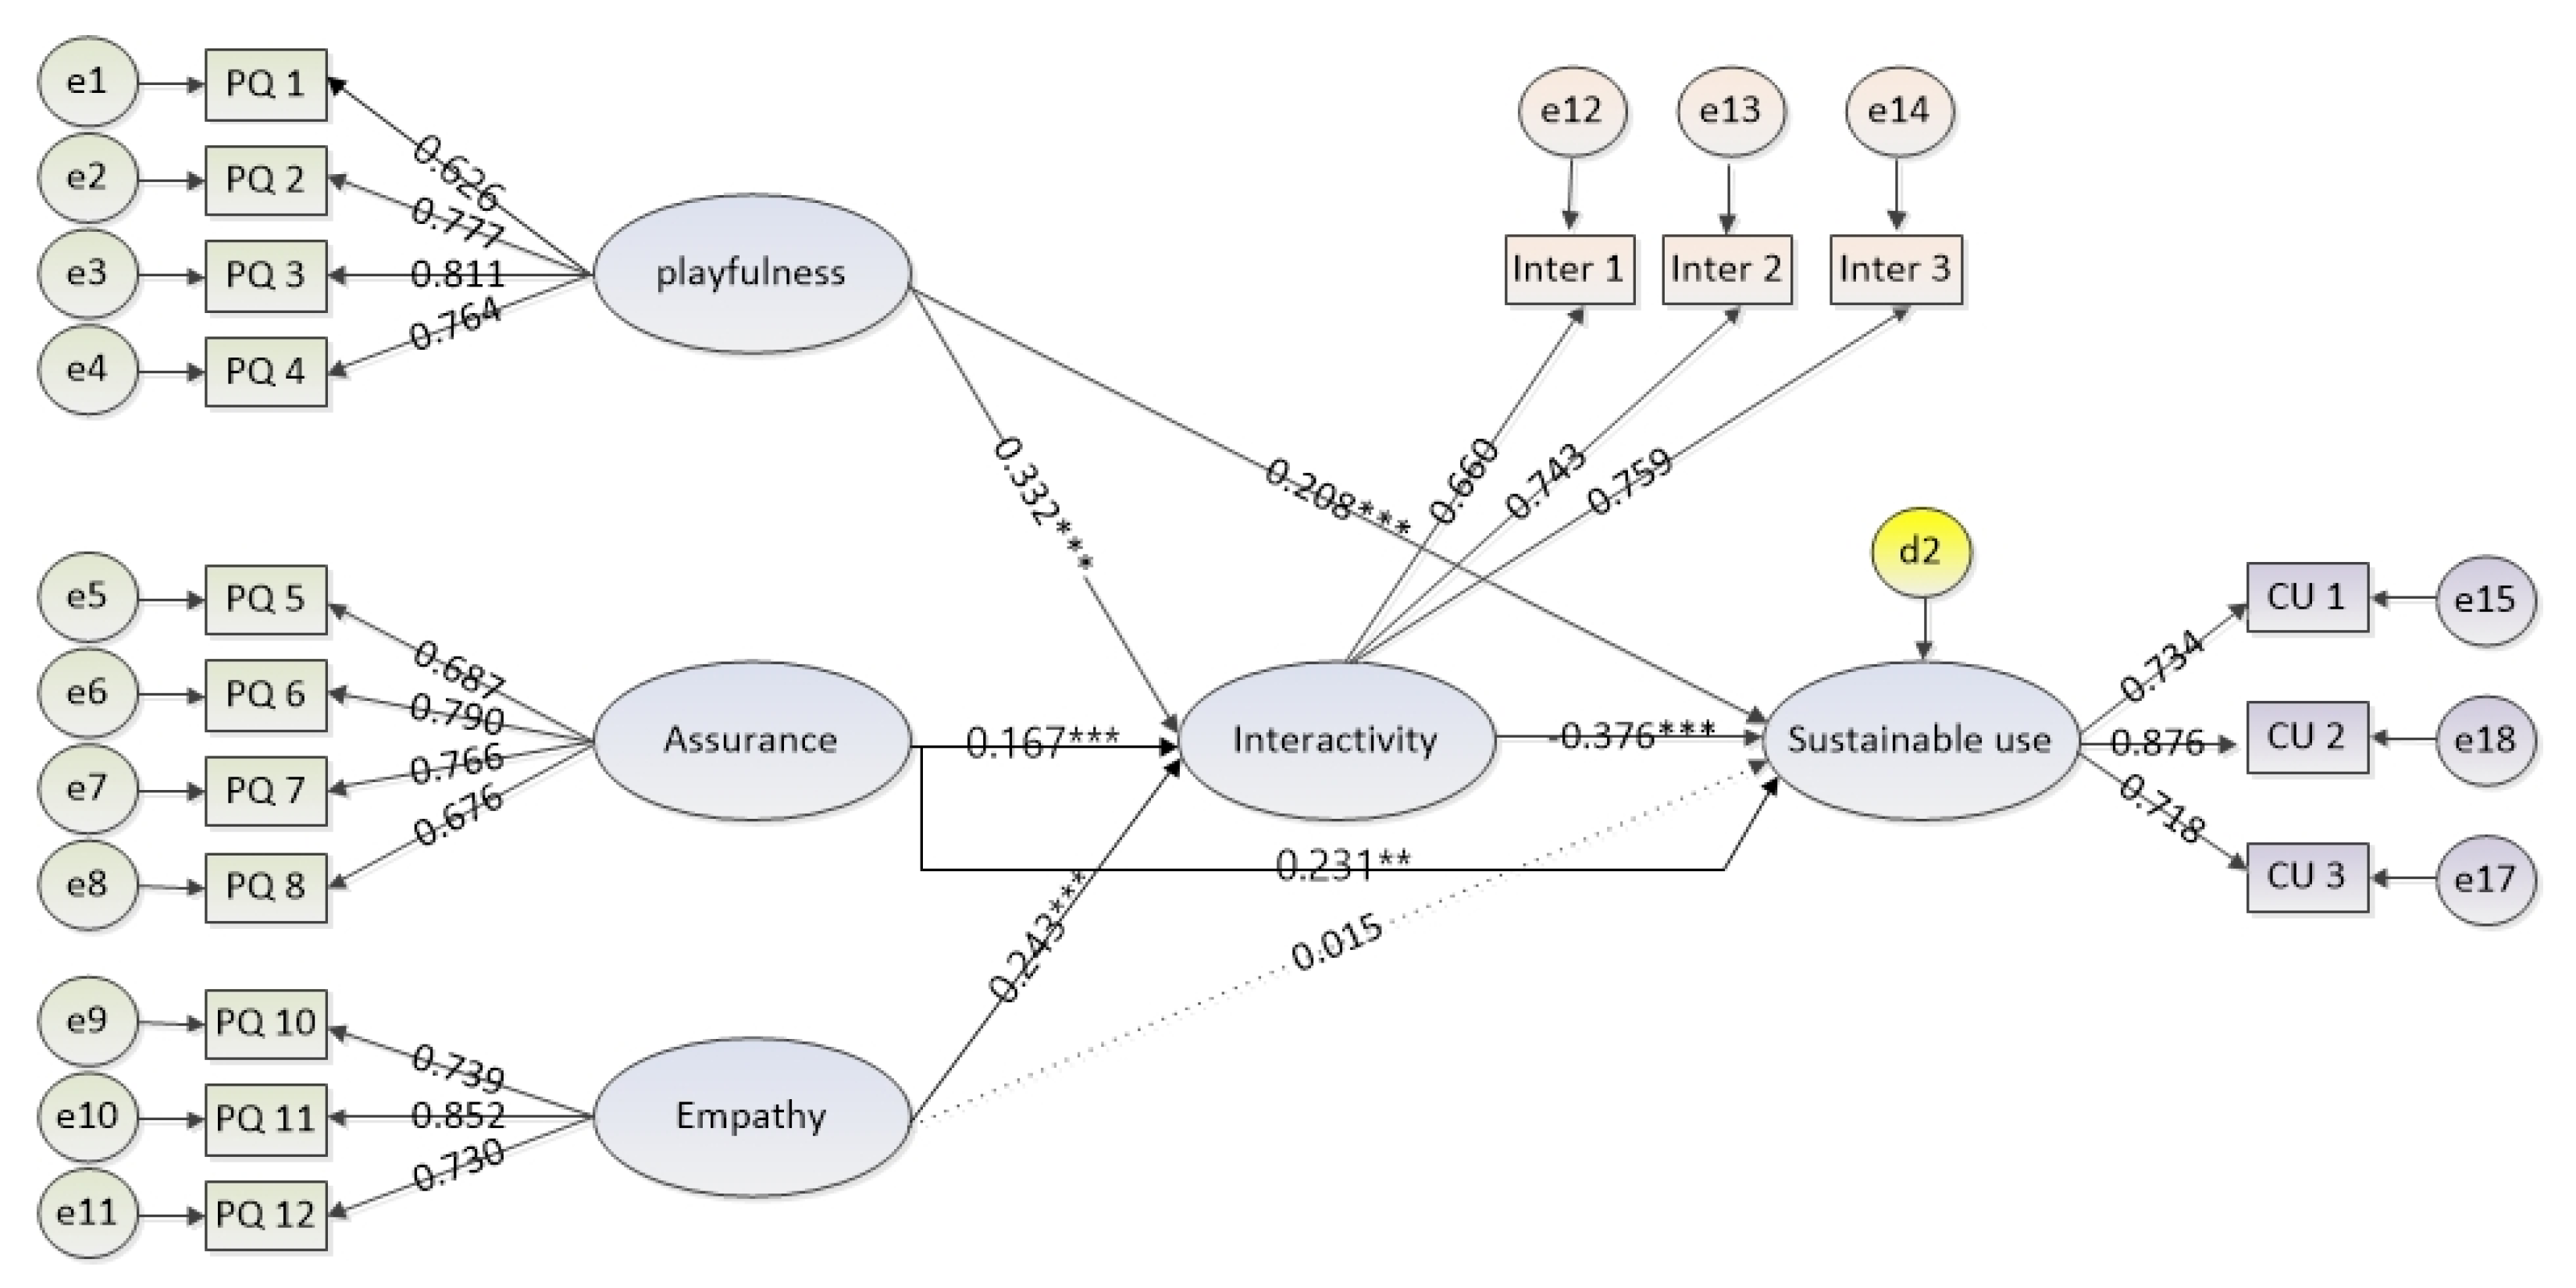
| Playfulness → Interactivity | 0.378 | 0.094 | 0.332 | 4.022 | 0.000 |
| Assurance → Interactivity | 0.172 | 0.079 | 0.167 | 2.167 | 0.030 |
| Empathy → Interactivity | 0.217 | 0.071 | 0.243 | 3.076 | 0.002 |
| Interactivity → Sustainable use intention | 0.381 | 0.091 | 0.376 | 4.202 | 0.000 |
| Playfulness → Sustainable use intention | 0.239 | 0.088 | 0.208 | 2.726 | 0.006 |
| Assurance → Sustainable use intention | 0.24 | 0.075 | 0.231 | 3.186 | 0.001 |
| Empathy → Sustainable use intention | 0.013 | 0.065 | 0.015 | 0.206 | 0.837 |
| Path | Indirect Effect (Bootstrap) | ||||
|---|---|---|---|---|---|
| Unstandardized Path Coefficient | Standard Error | Standardized Path Coefficient | 95% CI | p | |
| Playfulness → Interactivity → Sustainable use intention | 0.144 | 0.061 | 0.125 | (0.060-0.309) | 0.001 |
| Assurance → Interactivity → Sustainable use intention | 0.066 | 0.037 | 0.063 | (0.011-0.162) | 0.018 |
| Empathy → Interactivity → Sustainable use intention | 0.083 | 0.043 | 0.092 | (0.020-0.192) | 0.009 |
| Hypothesis | Results of Test of Hypothesis | |
|---|---|---|
| Hypothesis 1 (H1) | The perceived quality of voice bots has a positive (+) effect on the interactivity with the voice bots. | Adopted |
| Hypothesis 1 (H1a) | The playfulness of voice bots has a positive (+) effect on the interactivity with the voice bots. | Adopted |
| Hypothesis 1 (H1b) | The assurance of voice bots has a positive (+) effect on the interactivity with the voice bots. | Adopted |
| Hypothesis 1 (H1c) | The empathy of voice bots has a positive (+) effect on the interactivity with the voice bots. | Adopted |
| Hypothesis 2 (H1) | Interactivity with voice bots has positive (+) effects on sustainable use intention. | Adopted |
| Hypothesis 3 (H1) | The perceived quality of voice bots has a positive (+) effect on sustainable use intention. | Adopted |
| Hypothesis 3 (H1a) | The playfulness of voice bots has a positive (+) effect on sustainable use intention. | Adopted |
| Hypothesis 3 (H1b) | The assurance of voice bots has a positive (+) effect on sustainable use intention. | Adopted |
| Hypothesis 3 (H1c) | The empathy of voice bots has a positive (+) effect on sustainable use intention. | Rejected |
| Hypothesis 4 (H1) | Interactivity has mediating effects on the relationship between the perceived quality of voice bots and the sustainable use intention of consumers. | Adopted |
| Hypothesis 4 (H1a) | Interactivity has mediating effects on the relationship between the playfulness of voice bots and the sustainable use intention of consumers. | Adopted |
| Hypothesis 4 (H1b) | Interactivity has mediating effects on the relationship between the assurance of voice bots and the sustainable use intention of consumers. | Adopted |
| Hypothesis 4 (H1c) | Interactivity has mediating effects on the relationship between the empathy of voice bots and the sustainable use intention of consumers. | Adopted |
Publisher’s Note: MDPI stays neutral with regard to jurisdictional claims in published maps and institutional affiliations. |
© 2021 by the author. Licensee MDPI, Basel, Switzerland. This article is an open access article distributed under the terms and conditions of the Creative Commons Attribution (CC BY) license (https://creativecommons.org/licenses/by/4.0/).
Share and Cite
Yoo, J. The Structural Relationship between Service Quality and Sustainable Use Intention of Voice Search Technology in Korea. Sustainability 2021, 13, 14026. https://doi.org/10.3390/su132414026
Yoo J. The Structural Relationship between Service Quality and Sustainable Use Intention of Voice Search Technology in Korea. Sustainability. 2021; 13(24):14026. https://doi.org/10.3390/su132414026
Chicago/Turabian StyleYoo, Jaepil. 2021. "The Structural Relationship between Service Quality and Sustainable Use Intention of Voice Search Technology in Korea" Sustainability 13, no. 24: 14026. https://doi.org/10.3390/su132414026
APA StyleYoo, J. (2021). The Structural Relationship between Service Quality and Sustainable Use Intention of Voice Search Technology in Korea. Sustainability, 13(24), 14026. https://doi.org/10.3390/su132414026