Article

Role of Augmented Reality in Changing Consumer Behavior and Decision Making: Case of Pakistan

by
Syed Hasnain Alam Kazmi
1,
Rizwan Raheem Ahmed
2,*,
Kamran Ahmed Soomro
1,
Alharthi Rami Hashem E
3,*,
Hameed Akhtar
1 and
Vishnu Parmar
4
1
Faculty of Management Sciences, Shaheed Zulfikar Ali Bhutto Institute of Science and Technology (SZABIST), Clifton-5, Karachi 75600, Pakistan
2
Faculty of Management Sciences, Indus University, Gulshan-17, Karachi 75300, Pakistan
3
Department of Financial and Administrative Sciences, Ranyah University College, Taif University, P.O. Box 11099, Taif 21944, Saudi Arabia
4
Institute of Business Administration, University of Sindh, Jamshoro 76080, Pakistan
*
Authors to whom correspondence should be addressed.
Sustainability 2021, 13(24), 14064; https://doi.org/10.3390/su132414064
Submission received: 15 November 2021 / Revised: 10 December 2021 / Accepted: 13 December 2021 / Published: 20 December 2021
(This article belongs to the Special Issue Marketing of Innovation, Science and Technological Change)

Abstract

:
Marketers and advertisers ignore new technology and diverse marketing tactics when attempting to increase product exposure, customer engagement, customer behavior and buying intention in fashion accessory marketplaces in developing countries. This research sought to discover how the Augmented Reality (AR) experience influenced consumer behavior, buying intention and pleasure when purchasing a fashion item in developing countries. This study employs positivist ideas to investigate the connections between various factors, believing that reality is unwavering, stable, and static. Experiential marketing following stimulus exposure will gather cross-sectional data. The undertaken study has developed proper experimental design (within group) from business innovation models, for instance, uses and gratification and user experience models. User experience is disclosed by its four defining characteristics: hedonic quality (identification and simulation), aesthetic quality, and pragmatic quality. After encountering an enhanced user experience, users have a more favorable attitude about purchasing; in contrast, pleasure from using the application directly impacts buying intention. It was also shown that knowledge of AR apps impacts user experience and attitude. The novelty of this research is multifarious, for instance, the smart lab was used as a marketing technology to explore a virtual mirror of the Ray-Ban products. Secondly, the augmented reality experiential marketing activities have been developed by the developers as bearing in mind the four different aspects of the user experience—haptic, hedonic, aesthetic, and pragmatic. It should be functional, simple to learn and use, symmetrical, pleasant, and appealing, while fulfilling the unconscious emotional elements of a customer’s purchase. The research is the first known study in Pakistan to evaluate the influence of augmented reality on consumer proficiency and its consequent effects on attitude and satisfaction for fashion accessory brands. The research also advances the notion that application familiarity is the most important moderator between attitude and an augmented reality-enriched user experience, contradicting the prior studies, which focus on gender and age. This research has important theoretical implications for future researchers, who may wish to replicate the proposed final model in developed and developing countries’ fashion brands. This research also has imperative managerial implications for brand managers and marketing managers, who could include the recommendations of this study in their marketing strategies.

1. Introduction

The world is transforming due to ever-changing marketing innovation technologies. Customers’ needs are also being reshaped due to augmented demand, i.e., demanding more than just the core product/service. Customers do not only demand the primary service or product they are paying for; instead, they look forward to a valuable experience while making purchases, and demand to be enchanted [1]. This enchantment enhances the perceived value of the product or service they have purchased [2]. Among all the sophisticated advancements in marketing technology, the most recent additions to gain scholarly attention are virtual reality (VR) and augmented reality (AR), both of which enrich user experience through innovative marketing and advertising efforts [3]. AR creates a captivating and fascinating experience for its customers and targets the audience. It visually alters the physical world’s reality by superimposing elements of virtual nature on a real-time environment through different sources of projections and screens [4].
Globally the use of AR technology is on the rise in the fields of education, health, medicine, and marketing [5]. The marketers and advertisers are introducing new manners and ways of making their products visually more appealing and eye-catching in order to disburse information regarding their offerings and enhance the user experience in real-time [6]. The different ways in which AR is a part of marketing initiatives could be viewed as one of the forms of marketing experientially because the primary focus is not only on the service; instead, it creates a holistic experience for the consumers [7,8]. Rauschnabel et al. [9] reinforce the idea that augmented reality has an ability to enchant consumers with the whole experience they demand and will boast about. According to Carmingniani et al. [10], the use of the first AR experiential marketing application surfaced in 2008, when an automobile brand MINI simulated a 3D model of their car, which would be displayed on a screen a white paper was placed before the camera of the user. Since 2008, numerous applications and activities regarding AR business innovation models have arisen [11]. Even though marketers are inclined towards augmented reality experiential marketing, the scholarly work in this specific domain of knowledge is not ample to complement this topic’s expected importance and relevance. Therefore, a prompt and speedy investigation of the antecedents and descendants of AR experiential marketing is necessary.
Augmented reality is an essential immersive innovation in the advertising world, and is rapidly being used in consumer environments, often in built-in smart-device formats. Its capacity to combine the material environment with the digital world in real-time, such as with images, opens new doors for content delivery to an audience [12]. With its ever increasing use, it has become necessary to understand the massive impact that this type of reality has on consumer activities in order to better influence it in their favor [13]. This paper introduces a research plan to investigate consumer behavior regarding the use of an AR innovative business model in the digital world, building on past knowledge of this kind of immersive technology and its effect on user traffic. It has changed the way of consumers towards the shopping [13,14]. Activities that online customers take part in [15], B2C & C2C experiences via social media [16], expanded usage of smart devices and software apps [17,18], digital signatures [19], and a dedication to integrated virtual reality are some of the most significant developments since the emergence of Web 2.0 and Web 3.0 [20]. Although feedback from customers concerning more advanced digital innovative technologies has led to an abundance of studies [21], the potential influence of a novel AR knowledge on consumers has been an object of focus only in rare cases [22], and nothing approaching a proper study has so far been suggested the real potential. It had been estimated that the potential of the AR market could rise to $56.8 billion by 2020 [23], however, Fortune estimated the actual sales of $120 billion in 2020 [24]. The actual market for augmented reality has grown to $150 billion by 2021. However, the augmented reality market might be forecasted for the period 2021–2028 to reach around $340.16 billion [25]. With its growth, researching how an AR business model influences customer responses becomes increasingly relevant. With this information, advertisers will better understand how to use AR as a platform for specific purposes across diverse shopping channels [26]. Professionals and researchers have described the phenomena behind AR/VR in numerous ways. However, all have agreed that it encompasses a sequence of innovations that enable a combination of the actual world and layer upon layer of real-time, digitally created information and illustrations that enhance this particular reality type [27]. In the last two years, the application of augmented reality (AR) as a means of experiential marketing has been creating multiple concerns over its benefits in the long run, ranging from it being just another marketing platform to its activities leading towards a successful brand-consumer partnership [13] and consumer experience by generating perceived quality of experience [28]. The manner through which this type of reality is used in advertising schemes might be observed as a kind of experiential marketing, as it reflects not only on the service and the product but also on an entire experience of a user [28]. This is further endorsed by Rauschnabel et al. [9], who believe that “AR has the potential to give customers the interaction they want and tell their friends about it.”
While many advertisers and marketers are eager to see AR marketing as a potential path for the future of their products, the lack of case studies accompanied by the wide adoption of this phenomenon, and the anticipated increase in the importance of its industry [23], urges a swift validation of all the results of this kind of heuristic marketing. According to Sushereba et al. [29], during the start of initial experimental advertising initiatives using augmented technologies, companies and marketers were racing to pursue AR possibilities to lure customers’ attention. Large international corporations have used this innovation to market their products, [13], such as Walmart and Procter & Gamble. Moreover, this development is expected to continue—the AR market for advertising apps is expected to flourish, growing from $6 million to $350 million in the period 2008 through 2014, according to ABI Research [23]. Furthermore, due to the scarcity of metrics, observable components [30], and research case studies, there has been little attentiveness to the impact of AR advertising in the long run. Based on these results, this report examines how AREM contributes to interpreted experiential value creation and thus contributes to client-satisfaction growth [29,31].
Even though there is an ever-growing consumer base in Pakistan, marketers and advertisers are not fully utilizing the potential of technology to enhance product visibility or perceived value. The reason behind the failure of these marketers is the absence of scholarly work and research data that can assist marketers in embarking upon the new methods and technologies to boost their user satisfaction and purchase intention [32]. Thus, the current study provides important practical implications and guidelines for brand managers and marketers, helping them to take optimal advantage of augmented reality and allied technologies in their businesses. The undertaken research aims to understand and investigate the influences of augmented reality on customers’ experience, their satisfaction and their perceived intention to buy [33]. The study borrows its concepts from two different innovative business models or theories: the theory of uses and gratification [34,35] and the user experience model [36]. According to gratification theory, U&GT [31,34], audiences seek and select the media that satisfy consumers particular goal-oriented needs. The needs of individuals can vary on a continuum of five personal characteristics/categories. These categories are integrative needs, tension release needs, cognitive needs, integrative social needs, and affective needs, making it essential to evaluate the consumers’ behavior and intention to purchase associated with their experience [33,37].
Similarly, according to Poushneh and Vasquez-Parraga [36], the customer’s experience of an innovative augmented reality model influenced individual’s inclinations towards satisfaction and intention to purchase. The undertaken study focused on customer-centric design that fascinates consumers in its design and embraces affective and cognitive domains linked to the user’s experience, which is a more appropriate measure [32,37]. The relation between augmented reality, experiential marketing activity, and user experience may vary due to the gender of the user, the age group, or their level of familiarity with the innovative marketing technology itself [26]. The current study provides a novel conceptual framework for future researchers; thus, they can replicate this model in their studies for the developing and developed worlds.

2. Theoretical Framework and Hypotheses Development

Augmented reality (AR) signifies the incorporation of software-engendered 3D simulated objects into objective realitty to empower computer-generated entities to exist alongside existent situations, to improve the insight into and interface between users and their actual world [38]. AR includes three features: a mixture of virtual objects and the physical world, instant engagement, and 3D authentication, which correctly brings into line the facts of simulated substances and factual atmospheres to allow artifacts to emerge in atmospheres suitably, or to imitate computer-generated imagery in physical environments [29]. Rauschnabel et al. [35] suggested that there is a digital dimension termed a hybrid environment between the virtual and real realms, where the real world is placed towards the extreme left and the simulated (virtual) world is situated to the extreme right, with augmented reality (AR) located at the epicenter [21]. AR fuses the physical and virtual worlds; however, virtual reality depends on viewing and communicating with computer-generated environs [23]. At the same time, AR is constructed using virtual reality technologies, implemented to supplement what is missing in the actual world rather than to construct an entirely artificial reality. Substantial dashes of realism are therefore critical in AR, as AR reconstructs reality to incorporate the real or digital, and fade boundary between them. More explicitly, users use a web camera or other device (e.g., a mobile phone) to combine virtual 3D images with the world of reality. It allows users to simultaneously remain in the physical realm and engage with virtual entities, blurring the virtual/non-virtual distinction and producing an immersive experience [12,39]. This paper explored the use of an AR approach in tourist destination advertisement. Attractions can be advertised as customers search brochures online to see different tourists’ self-made videos of the destinations [26]. Additionally, this paper re-examined the various attributes of fashion brands in a comprehensive manner. The previous literature demonstrated ample detail in the context of measuring buying behavior regarding the various attributes of luxury fashion accessories. Commonly wearable fashion accessories include wallets, watches, glasses, purses, scarves, mobile covers, etc. The literature discussed the important features within and consumption of fashion brands, for instance, hedonic quality by identification, hedonic quality stimulation, aesthetic quality of brand, pragmatic quality of a brand, user satisfaction, attitude, and intention to purchase a fashion brand [40,41,42].

2.1. Augmented Reality vs. Virtual Reality

Augmented reality, or AR, is a digital channel in which data is overlapped in both temporal and spatial forms in real-time, within the real world [39]. Thus, the user of augmented reality experiences virtual or simulated objects laid over the physical world [43]. For example, an application that allows AR users to scan a prominent building through their smartphones is a form of AR reality. It then automatically includes adequate and relevant information from Wikipedia on the screen. Conversely, VR changes the attitude by amplifying the user experience, significantly leading to enjoyment [44]. Compared to VR, AR does not separate from reality but combines both the virtual and the real worlds together [11,21].
Social media marketing is a similar example, where social networks as a medium or forum are distinguished from social media advertising [26]. We precisely discriminate between AR marketing and VR marketing as well. AR defines graphical integration between electronic material with real-world environments, having been described as a “space where digital information overlays the physical world, both physical and contextual, and is engaging in time” [26]. It is possible to distinguish AR distinctly from VR. Whereas VR distances the user entirely from reality, usually by using special glasses, therefore situating the user in a genuinely different virtual world [45], AR consumers are not detached from their reality; in a sense, their perceived truth is enhanced by visual knowledge [35]. Usually, AR systems are mounted on fixed (such as shop mirrors), handheld (such as smartphones), or wearable (such as smart glasses) apps [39]. As discussed above, researchers deduce that it is pertinent to distinguish AR as a separate program from AR-centric advertising arrangements in which business operations are run through organizations. However, certain companies (including Porsche, VW, Toyota, Lego, and IKEA, among others) are incorporating AR in their advertising campaigns [46], and earlier research work illustrated that researchers regarding the AR’s commercial potential [47] are still creating a definition for AR branding. They describe AR advertising as a tactical approach, incorporating artifacts or digital information within the somatic world of consumers, commonly adjoining with other media to illustrate, express, or expose brand recompences to attain companies’ goals. However, this novel definition contains four significant conceptions [48]. Firstly, it designates that AR advertising is a tactical business capacity that needs good scheduling and financial and operational capital, including a thorough knowledge of how customers behave from various disciplines and perspectives. Furthermore, while stressing a combination of various good sorts of physical and digital material, apart from defining interactivity, the concept of how customers behave remains relatively open and susceptible to supporting a huge range of AR-related strategies and technologies [49]. We can extend AR-centric marketing to corporate, driven-by-profit practices, non-profit advertisements, political strategies, or a much larger general promotion of ideas by identifying the objectives of AR marketing as facilitating an accomplishment of their organizations’ objectives. Eventually, AR-centric Marketing will draw on and broaden existing marketing strategies, spanning from ads to storytelling [50].
Similarly, businesses can implement AR ads in the applications offered (such as in-store digital mirrors) or via the consumers (through mobile devices such as tablets and smart glasses). This form of marketing should tackle multiple goals along the product path (e.g., labeling, stimulating orders, and optimizing after-sales service) [39]. Many currently advertised AR applications, for instance, are connected to before-purchasing experiences (such as scheduling furniture sales), while others offer functionality following purchasing (such as interacting with Legos devices, which are augmented with AR characteristics) [26]. Several firms’ advertising campaigns use AR in isolation, for example, a digital mirror. However, numerous organizations use it to combine many other forms of technology [35]. For instance, Vespa, the Italian scooter manufacturer, has developed a device where consumers can search Vespa advertisements and get added substance using AR [46,50]. Companies may use this form of advertising to provide consumers with added benefits that depend on their product experience phase [35]. It depends on specific processes in decision making, for instance, pre-purchase purchasing scheduling and post-purchase service delivery. Eventually, augmented reality (AR) advertisements could reach various audiences, including customers, workers, and the community [32].

2.2. Uses and Gratification Theory (U&GT)

With its ability to relate to communication science on a deep level, the U&GT explains the basic questions, for example, why people utilize a specific media. According to Katz et al. [34], the U&GT suggests that viewers are generally goal-oriented, and they explore the media that fulfill their specific requirements. According to Katz et al. [34], these requirements are different for different people and depend on individual abilities. These needs could be categorized into five kinds, which belong to social and personal needs. The first type is cognitive needs, such as increasing or gathering an individual’s comprehension of a specific issue. [29] For example, people watch television news or read newspapers and gather information from commercials that satisfy their personal need for inquiry. The second category is integrative social needs, an idea in which consumers generate or sustain new or prevailing associations respectively using social media [33]. In the third place, tension-releasing needs include multiple facets, for instance, escaping reality or diverting from it. For example, several people watch movies or play video games to take a break from routine life, which fulfils the personal needs of the individuals related to the entertainment. However, the fourth category is the affective needs encompassing all methods and types of emotions, pleasures, and attitudes that people retain and obtain. This kind of category fulfils the social needs for love, belonging, and affection. Last but not least, the fifth category is regarded as personal needs, which include the idea that several people are involved in specific forms of media to help themselves to gain credibility or social status amongst and others [50,51]. For instance, many people portray themselves in a specific favorite fashion, i.e., successful or intense, using social media platforms, also known as image management [51,52].
According to Karapanos, Teixeira, and Gouveia [53], the U&GT has several criticisms; however, this theory is still valid, widely applied, and used in research issues related to human communication (Rubin, 2002). Similarly, research studies have incorporated U&GT in numerous other perspectives, for instance, sharing digital pictures on social media [54] or mobile social games [55]. However, only some research has concentrated on the AR context and, more specifically, AR-based marketing. An increasing range of mass media outlets in e-shopping environments has enhanced consumer-product interactivity [56]. Finally, to increase the efficacy of retail training, investigators need mechanisms to evaluate customers’ opinions about these formats and their reactions. Scholars introduced the U&GT concept to investigate customer needs, behaviors, and desires when engaging with different e-shopping platforms and exerting influences on purchasing intentions [50,53]. U&GT theory suggests that shoppers are affected by psychological needs beyond those directly linked to brand acquisition, and shoppers with software or contact channel preferences will use specific forms that satisfy their specific needs. Finally, shoppers with fulfilled needs are more inclined to choose to replicate their encounters [57,58].
Hypothesis 1 (H1).
An augmented reality enhanced user experience that influences the user’s attitude.
Hypothesis 2 (H2).
The attitude of consumer influences the user’s intention to purchase.

2.3. User Experience Model

User Satisfaction and Experiential Marketing

Economists say that the contemporary world finds itself in the “experience economy” [59] where it says that consumers do not understand constant emphasis on the brand but also take into account the experiential utilization it offers—“where functional utility is either taken for granted or seen as irrelevant” [28,60]. Similarly, experiential marketing also refers to consumer psychology, which affects the behavior of users, which in turn triggers the emotional and rational drives of the consumers [61,62].
According to Pacsi and Szabó [63], experiential marketing derives forward as handling utilization as a whole exposure, while distinguishing the emotional and rational drivers of utilization. The primary significance of experiential marketing lies in adding value in consumers’ minds [63], which would entail an aggressive and competitive advantage for organizations [64] in the future. According to Lee [65], it will not only encourage consumers to choose quicker, but it will also result in additional affirmative buying intentions, however, though this innovatively novel marketing method is extensively established to signify the world of future marketing [63,64,66], it is still not wholly understood and warrants a widely varied choice of research studies and methods in order to understand consumers better [60]. The experiential value that this creates, referring to the perception of customers of products and services through either their direct or indirect use and observation [27], has recently been illustrated by two quantitative research studies [48] that are focused on American companies and the perception of their consumers in Taiwan’s marketplace. According to Yuan and Wu [28] and Pacsi and Szabó [63], the experiential value generates determination that increases consumers satisfaction.
Nonetheless, an intensive investigation is required to replicate these results in diverse media and cultures to examine further and work on the association through qualitative research. The association shaped between consumer satisfaction and brand values is supplemented by several research studies [67,68,69], suggesting that experiential marketing should provide broader heuristic value—mutually functional and emotional, along with positive user satisfaction. Despite having a well-defined understanding linked to the direct association between value addition and its consumers’ satisfaction [26,70], still there is no agreement relating to factors that have created the perceived value on the customers’ end; every one of the studies mentioned earlier are built on the utterly unusual model of the user fulfillment indicator [66,71]. On the other hand, many scholars believe that user satisfaction plays a crucial role in the obtainment of any success by any organization, and is crucial in enhancing overall profitability. If consumers are satisfied with a specific brand, they will generally make repeat purchases, and will promote that brand to other people, discounting other brands’ advertisements [69,72]. Although the field of user satisfaction might never be taken for granted, it should continually be strengthened [35]; a splendid method of achieving this would be through analyzing valuable experiences provided throughout experiential marketing [73,74].
Hypothesis 3 (H3).
Augmented reality enhanced user experience, which affects user satisfaction.
According to Poushneh & Vasquez-Parraga [36], the user’s experience involves pragmatic quality (PQ), aesthetic quality (AQ), hedonic quality of simulation (HQ-S), and hedonic quality of identification (HQ-I). Thus, we have formulated following four direct hypotheses:
Hypothesis 4a (H4a).
Aesthetic quality (AQ) has a positive and significant association with user’s experience.
Hypothesis 4b (H4b).
Pragmatic quality (PQ) has a positive and significant association with user’s experience.
Hypothesis 4c (H4c).
Hedonic quality of identification (HQ-I) has a positive and significant association with user’s experience.
Hypothesis 4d (H4d).
Hedonic quality of simulation (HQ-S) has a positive and significant association with user’s experience.

2.4. Different Levels of Familiarity with Augmented Reality

AR serves as an inducement in the undertaken study, and its interactivity level was reviewed to mirror AR. In this case, interactivity denotes the degree that consumers could be involved in and contribute to altering the substance and shape of an intermediated atmosphere in an instantaneous period [73]. Interaction treats the users and offers them an opportunity to grasp personal information through a 3D virtual model [75], enabling them to experience intermingling with computer-generated substances. The study demonstrates two specific levels of interaction, i.e., high to middle and low interaction. It is based on the assumption that high to mid-level interaction and familiarity always create more user experience (UX), and, consequently, greater consumer satisfaction and willingness to purchase [26]. On the opposite side, lower levels of interactivity are assumed to produce a frailer UX and consequently a frailer degree of consumer fulfillment and inclination to purchase [35]. User experience (UX) is a subjective and holistic experience, which varies along with time [76]. It is also defined as: “All the aspects of how people use an interactive product: the way it feels in their hands, how well they understand how it works, how they feel about it while using it, how well it serves their purposes, and how well it fits into the entire context in which they are using it.” The UX is primarily a complicated construction that encapsulates a brand, consumer’s inner state, characteristics, age and gender of the user, and the context of the product’s use [77]. Several previous studies have demonstrated that age and gender are the potential moderating variables [78,79,80,81].
Hypothesis 5a (H5a).
Familiarity with AR applications moderates relation between user experience and attitude of the user.
Hypothesis 5b (H5b).
Age moderates the relationship between the user’s experience and the attitude of the user.
Hypothesis 5c (H5c).
Gender moderates the relationship between the user’s experience and the attitude of the user.

2.5. Mediation of Attitude between User’s Experience and Purchase Intention

The philosophy of U&G is more concerned with how audiences respond to the demands of the press than with the material or advertisement [26,34]. Of particular note in this analysis are three concepts within U&G theory: entertainment value, informativeness, and internet annoyance [55]. Entertainment relates to the degree to which an entertainment medium becomes enjoyable for consumers [53], catering to customers’ need for entertainment, artistic enjoyment, materialistic pleasure, and/or emotional relief [56]. The entertainment factor was related to users’ attitudes towards websites [49,55], whereas satisfaction and participation are connected to the mood of users and expectations of positive impact [57,58]. The presentation of valuable information about online media is measured by informativeness [53,71]. Users require online material to be reliable, timely, and helpful [58], and websites that satisfy information needs build favorable attitudes [59]. Therefore, the quality of the data on a website directly affects the shoppers’ views of both the business and its products, thereby influencing the attitude of consumers [33].
Hypothesis 6 (H6).
The user’s attitude mediates between user’s experience and intention to purchase.

2.6. The Effect AR Has on UX Which Is Mirrored in Brand Pragmatic Quality (PQ)

Pragmatic quality is also useable, which links to efficiency, effectiveness, and overall user satisfaction (UX). As the usability features of UX case is a small scope in the vast UX, it is generally not evaluated as an eligibility criterion in evaluating UX [82]. Many of the characters of a brand, for instance, function, usability, usefulness, symbol, aesthetic, weight, and size, may impact UX. It involves a segment of such interactions that emphasize the usability and utility of the brand related to its possible difficulties [83]. Augmented reality enhances the UX by displaying more positive information about a brand than the brand which has fewer features of AR, resulting in a higher and better UX at the time of buying [46]. Thus, according to Park and Yoo [49] and Huang and Hsu-Liu [22], reducing users’ anxiety levels facilitates decision-making.
Hypothesis 7a (H7a).
Augmented reality has a significant and positive influence on user experience as reflected in the pragmatic quality of brand hallmarks.

2.7. AR-Based Impact on UX Mirrored in Hedonic Quality (HQ)

Hedonic quality is also imperative; however, it does not consume UX, as the UX includes emotional responses as well [48]. On the other hand, AR influences UX by influencing HQ, facilitating numerous other emotional paybacks. AR enables consumer participation and augments the hedonistic value of consumer proficiency and fulfillment [65], providing consumers with the increased capability to share their tailored experience on social networking platforms. Hence, according to Huang and Hsu-Liu [22], increasing the liveliness of the whole experience. However, AR-based influences on HQ that can vary depending on whether the entire experience is referred to as pleasure or not. According to Hassenzahl and Tractinsky [82], there are three kinds of impacts on HQ: (HQ-S) which influences by motivation, (HQ-E), which influences by reactions, and (HQ-I), which influences by identification. HQ-S relates to the satisfaction of human needs and wants in multiple and novel challenges. However, HQ-E denotes personal needs for figurative values of an entity that needs fulfillment. Finally, HQ-I indicates the satisfaction of human needs for self-expression [83].
Hypothesis 7b (H7b).
Augmented reality positively and significantly impacts user experience as reflected in hedonic quality by simulation of brand characteristics.
Hypothesis 7c (H7c).
Augmented reality positively and significantly impacts user experience as reflected in hedonic quality by identification of brand characteristics.

2.8. AR-Based Influence on UX as Mirrored in Brand Aesthetic Quality (AQ)

The AQ segment of UX includes proficiencies that are pleasurable. According to Jordan [84], there are four kinds of hedonism (pleasure). One is physiological hedonism, which is linked to the physical element of UX (for example, taste, smell, and touch). Sociological pleasure is linked to the association of other elements with the user (for example, status and connection). Psychological pleasures are related to emotional and cognitive reaction (such as the fulfillment of subservient needs) [76,77]. Ideological hedonism is linked to human values (for example, taste and the personal aspirations). It is probable that all kinds of hedonism are not required at once, although certainly can be. Hence, augmented reality drastically influences the users’ overall experience as mirrored in the aforementioned four brand features, such as the aesthetic quality, the hedonic quality, the hedonic quality by identification, and the pragmatic quality [85,86,87].
Hypothesis 7d (H7d).
Augmented reality has a significant and positive impact on user experience as reflected in the aesthetic quality of brand hallmarks.
Thus, we have developed the proposed conceptual model, which is presented in Figure 1, and then we have developed the final conceptual framework of the study on the basis of previous literature and theories, which is presented in Figure 2.

3. Methodology

3.1. Research Design

This study borrows philosophical groundings from the positivists, as theories have been used to test relationships among different variables following the belief system that reality is unwavering, stable, and static, which can be directly observed through the viewpoint of an objectivist [36]. The data was collected using a questionnaire after being exposed to a stimulus AR experiential marketing.

3.2. Procedure

The study is an authentic, within-group experimental design because the experiment details were shared with three domain experts to ensure the experiment’s validity and establish the trustworthiness of the collection from the experiment. A set of qualifier questions were presented to volunteering participants to determine their level of engagement and interactivity. Based on their level of familiarity (low to high), they were randomly assigned to a group of two and exposed to the AR stimulus. The experiment was carried out with 100 randomly selected participating volunteers belonging to different age groups and genders. For the experiment, an AR treatment of Ray-Ban sunglasses was employed. The study employed structural equation modeling due to multiple dependent, independent, mediating, and moderating variables that required testing simultaneously.

3.3. Sampling Frame and Sampling Method

The sampling frame for the study is fashion consumers in Karachi belonging to socio-economic classes A and B. Familiarity with AR technology is a crucial qualifier. The targeted city of this study is Karachi city. The experiment was conducted with 100 volunteers with an acceptable margin of error of 5% and a 95% confidence interval, who were arbitrarily allocated to two distinct clusters/treatments. The sampling method for the selection of samples was purposive and non-probabilistic. However, the qualified units of samples were randomly assigned to two distinct clusters for the treatment based on their level of interactivity.

3.4. Data Collection

Data were collected by employing a 34-item questionnaire designed on a 7 point Likert Scale (See Appendix A). The method is consistent with several empirical pieces of research in the past [35,36,73]. The questionnaire was administered personally after respondents were exposed to the stimulus. The stimulus is the Ray Ban virtual mirror, available on the official website (publicly available) (See Appendix B). The respondents were divided into two clusters, established on their level of familiarity with the AR application. After being exposed to the stimulus, respondents were requested to complete the survey questionnaire. Non-probability purposive sampling methods were employed to collect the data based on the convenience of the researcher. The samples primarily belonged to the society’s SEC A and B classes and were homogenous, except for age. The survey questionnaire was allocated into two portions. The first portion contained an informed consent form and demographical questions, along with three qualifier questions (See Appendix A) asking the respondent whether they are eyeglasses/sunglasses consumers, their preferred brands, and whether they like to make online purchases for sunglasses/eyeglasses (See Appendix A). The frequency of their online purchases or their searches for sunglasses/eyeglasses was a qualifier question that determined their respondent group. The survey tools were administered. After being exposed to the stimulus, the AR camera tool was carried out in the SMART laboratory of a Karachi business school (SZABIST). After the exposing of the subjects to the stimulus, the primary data was collected using a summative differential scale of 7 points on a Likert survey questionnaire (See Appendix A). Secondary data collection was carried out using published papers, books, articles, and other scholarly tools.

3.5. Pilot Testing

A chief set of items were adopted and measured with 30 respondents to measure the reliability and validity of the scale. To measure the internal consistency of the Composite, reliability (CR) > 0.70, and Cronbach alpha (CA) > 0.70 were considered the threshold values. According to Hair et al. [88], indicator reliability of a factor is called outer loading should be higher than 0.60. Factor loadings falling between the range of 0.50 and 0.60 were considered for removal. For convergent validity, the AVE value > 0.50 was considered as the threshold value. Discriminant validity was verified using the Fornell and Larcker [89] criterion. This study employed SEM, since several dependent and independent interactions should be tested concurrently with SEM. SEM was utilized to validate the hypotheses and research framework using SMART PLS 3.2 software [90]. The magnitude and significance of the direct, indirect, and total coefficients were observed for path analysis at p < 0.05. R square, that is, the value of the coefficient of determination, was observed to measure the variance explained by independent variables on dependent variables [91]. Q square values greater than zero were the benchmark to examine the predictive relevance [92,93].

3.6. Research Setting

The experiment was carried out in a laboratory environment at the Business School of SZABIST, Karachi. The study employed an accurate experimental method, where participants were randomly consigned to two treatments [94]. The augmented reality experiential marketing (AREM) exercise was considered the stimulus, where participants were involved in an interactive session using Ray-Ban sunglasses’ official virtual mirror. The participants were apportioned into two experimental clusters, which were generated based on participants’ level of familiarity with online (digital) purchasing and their online purchasing behavior. In order to administer the stimulus, the AR treatment of the Ray-Ban sunglasses virtual mirror was used. Prior to experimenting, participants were informed that the research was attempting to assess the influence of AREM on the user experience and its results. The participants answered the prescreening questions before being exposed to the treatment. The prescreening questions were regarding their online purchase habits and familiarity with online applications and forums [94]. The Mean (M) and standard deviations (SD) of the prescreening questions were, “Do you use online websites or forums to purchase eyeglasses/sunglasses” (M = 1.55; SD = 0.520) and “How frequently you use online applications/social forums or websites for purchasing or searching eyeglasses/sunglasses,” (M = 2.35; SD = 0.539). The participants had the liberty to personalize their glasses based on their sizes and aesthetic sense and try them virtually or take photos and share them on their social networks. After 10 min of the experience, the participants completed the survey questionnaire, after taking augmented pictures.

4. Findings and Data Analyses

4.1. Descriptive Analysis

SPSS tool was utilized to acquire the descriptive statistics, as reflected in Table 1. The respondents of the study were divided into two groups based on their familiarity with online purchasing. The total number of participants was 100, of which 55% were male and 45% were female. The majority of the respondents were graduates and postgraduates (96%). Respondents mostly belonged to the socio-economic class (SEC) B, which made up a cumulative 46% of the respondent representation. Almost 27% of the population belonged to SEC A, whereas 27% belonged to SEC C. The population division of the samples was as follows: 22% of the respondents belonged to age group 18–23 whereas respondents belonging to age group 24–35 consisted of the majority of the respondents, that is, 67%. Respondents ranging from age 36–45 comprised 11% of the total sample. Descriptive data analysis also revealed that 43% of the sample used online purchasing modes to purchase sunglasses or eyewear, whereas 56% preferred buying through brick and mortar stores (M = 1.55; SD = 0.520). Descriptive data also revealed that 62% of the samples often use online buying portals/forums and websites to make their purchases, whereas 37% do not use any digital or online forum.

4.2. Instrument Face and Content Validity

The study of augmented reality and user experience is a scarce topic in the Pakistani context. Therefore, three marketing experts and two domain experts were carefully selected for their sound knowledge about the user experience model and uses of gratification model. The three academics shared their reservations and recommended corrections in framing the items, their order, and their vocabulary. The industry experts also recommended removing redundant items. The survey questionnaire was reduced from 42 items to 34 items. The survey questionnaire after corrections and changes contained six items measuring hedonic quality by identification. For gauging hedonic quality by simulation, six items were used, whereas nine items were used to gauge the aesthetic excellence of user experience. The pragmatic quality of user experience was measured by using four items. The user satisfaction, which is directly related to user experience, was measured using three items. Attitude and intention to purchase were measured using three items, respectively.

4.3. Manipulation Check

In order to determine the inter-item reliability, 35 individuals were exposed to the stimulus, followed by the survey questionnaire as elucidated in Table 2. The administered tool was tested for its reliability using Cronbach’s Alpha at SPSS. The inter-item reliability of all the constructs was satisfactory, with a Cronbach’s alpha ranging from 0.642 to 0.923 and a cumulative alpha value of 0.772 for all 34 items. The results of the Cronbach’s alpha were satisfactory, thus demonstrating internal consistencies among the constructs and allowing the primary data collection to proceed [88].

4.4. Exploratory Factor Analysis—CFA

The findings of principal component analysis (PCA) carried out on software SPSS 23 revealed the suitability and appropriateness of the data prior to performing tests (Table 3). The correlational matrix with Varimax rotation showed that the coefficients were above 0.3, and the KMO (Kaiser-Meyer-Oklin) values were also found to be above the threshold value of 0.6 [95]. Bartlett’s test of sphericity values was also significant (p < 0.05), statistically suggesting and supporting the factorability of the correlational matrix. Principal component analysis (PCA) outcomes demonstrated that there were three elements with eigenvalues above the level 1 (threshold), explaining 35% (percent), 16% (percent), and 15% (percent) variance with a collective of 67.2% (percent) [26]. The scree plot inspection also reveals a break after the third component, suggesting the factorability of the data.

4.5. The Measurement Model

The undertaken research was within a group experimental design study. The study’s measurement model comprised five exogenous variables: hedonic quality by identification, hedonic quality by simulation, aesthetic quality, pragmatic quality, and user experience (formative construct). The hedonic quality by identification of user experience consisted of six items, the hedonic quality by simulation was measured using six items, and the aesthetic quality of user experience was gauged using nine items. In contrast, the pragmatic quality of user experience was measured using four items. The user experience is a formative construct. The indicators in a formative construct are not interchangeable, as it is valid within the reflective construct. The total number of items that were loaded on the formative construct was 25. There were six endogenous variables; attitude (mediating), age (moderating), gender (moderating), familiarity with AR applications (moderating), intention to purchase, and user satisfaction were the dependent variables. Three items were used to measure attitude and to measure purchase intention. Three items were used to measure user satisfaction. The model was developed by loading all the indicators to their respective constructs. Items with low or weak path coefficients were eliminated (below the threshold of 0.7). Items with low factor loading and low regression weights, that is, below 0.5 (4, 5, 6, 7, 9, 10, 13, 16, 17, 18, 30) were considered for deletion.

4.6. Convergent Validity

The results of the survey questionnaire were tested for convergent validity using Hair et al., [88] threshold values. The standardized factor loading values should be higher than 0.70. Similarly, the composite reliability (CR) should also be higher than 0.70 [88]; however, the average variance extracted (AVE) should be higher than 0.50. [89]. The findings of Table 4 reveal scores after the deletion of numerous low-scoring items. The Cronbach’s Alpha (CA) values to test the inter-item reliability were well above 0.5, as recommended and acclaimed by Ahmed et al. [26]. At the same time, the CR of fundamental factors was also greater than 0.70., thus showing construct reliability [96]. The AVE values were also discovered to be significant and over the threshold readings.

4.7. Discriminant Validity

There are different ways of measuring the discriminant validity of the constructs, but according to Fornell and Larcker’s [89] criterion, the generally accepted and widely used method to gauge the constructs’ exclusivity was the level of their distinction from other constructs. The inter-item factor loading of constructs must be significantly more significant than the cross-loading of items [89]. The findings of Table 5 reveal that the constructs that should be mutually exclusive have factor loadings more significant than their cross-loadings [89].

4.8. Structural Model

The proposed structural model consisted of five exogenous variables, out of which four were latent variables, and one was a formative construct. The structural model also encompassed six endogenous variables, out of which one was a mediating variable, three were moderating variables, and two were dependent variables. Model estimations were carried out on SMART-PLS version 3.2. Structural model estimations were HQI (0.267&p < 0.05), HQS (0.209&p < 0.05), AQ (0.301&p < 0.05), PQ (0.371&p < 0.05); therefore, we can conclude that augmented reality (AR) significantly and positively influences the user experience as reflected in four brand hallmarks (hedonic quality by identification, hedonic quality by simulation, aesthetic quality, and pragmatic quality). Similarly, the attitude of the user (0.210&p < 0.05), intention to purchase (0.846&p < 0.05), and users’ satisfaction (0.795&p < 0.05) were found to be positively affected by the augmented reality-enriched user experience. Hence, H1, H2, H3, H4a, H4b, H4c and H4d were supported. Table 6 reveals that hedonic quality by identification, hedonic quality by simulation, aesthetic quality, and pragmatic quality directly affect user experience. The formative construct (user experience) can possess more explanatory exogenous variables, and the list tested in this experiment is not exhaustive. The results of the user experience dimension are directly in line with previous studies. According to Huang and Hsu-Liu [22], augmented reality experiential marketing influences user experience (UX) by affecting hedonic quality, thus aiding several emotional benefits triggered through identification and simulation. According to Jordan [84] and Rauschnabel et al. [35], aesthetic quality is crucial in enhancing user experience by providing a pleasurable experience. The results of a pragmatic quality in user experience are consistent with the previous study of Huang and Hsu-Liu [22]. The results of total direct effects also reveal that the augmented user experience is positively and significantly related to attitude (p < 0.05).
Similarly, the study results show that attitude is directly and significantly related to intention to purchase. These results are consistent with the study of Poushneh and Vasquez-Parraga [36]. According to Ahmed et al. [26], consumers/users primarily focus on experiential consumption, which has a direct and significant relation with user satisfaction. By enhancing the experience, marketers can also enhance user satisfaction. The findings of Table 6 showed that the moderating impact of Age & Gender between user’s experience and attitude of user is insignificant, at (0.037&p > 0.05) and (−0.057&p > 0.05), respectively; thus, H5b and H5c are rejected. However, familiarity with AR Apps has a significant positive impact as a moderating variable between user’s experience and the attitude of the user (0.209&p < 0.05); thus, H5a is accepted. The results are consistent with the previous literature, such as Song et al. [80] and Morisada et al. [81].
Similarly, results extracted from SMART-PLS 3.2 and shown in Table 7 also reveal that the user’s attitude has a significant mediating role (0.221&p < 0.05) between user experience and intention to purchase, which is full and indirect mediation, that is, user experience was found to have no direct effect on the user experience. Hence, H6 was supported. Similarly, the components/characteristics of user experience (HQI, HQS, AQ, PQ) were found to have a positive indirect effect on user satisfaction. Thus, the hypotheses H7a, H7b, H7c, and H7d are accepted.
The coefficient of determination (R squared) value [96,97] elucidates the percentage of variance in an endogenous variable as elucidated by the exogenous variables. According to Henseler’s [90] rule of thumb, acceptable threshold values of R2 in Table 8 showed a moderate variance of 0.706 and 0.619 in intention to purchase and user satisfaction by attitude and augmented user experience, respectively.
In an attempt to measure the statistical strength of the relationships between user experience and attitude, attitude and purchase, and user experience and user satisfaction, Cohens et al. [98] F2 had carried out using SMART-PLS as presented in Table 9. The effect size [96,98] of attitude and intention to purchase is substantially large (f2 > 2), whereas the effect size of the relationship between the moderating variable (familiarity with AR) and attitude was found to be moderate (f2 > 0.15). The effect size of the relationship between attitude and user experience was small (f2 >0.025), though between user experience and user satisfaction it was found to be substantially strong (f2 > 2).
The blindfolding method has measured the predictive relevance of the model where the Q square value [91,92] should be greater than zero. The Q2 value of the model, as elucidated in Table 10, was 44.3 percent concerning the intention to purchase and user satisfaction.

5. Conclusions

The importance of the use of augmented reality (AR) technology is on the rise in the fields of education, health, medicine, and marketing [4,5]. Marketers and advertisers are introducing new methods and ways of making their products visually more appealing and eye-catching to disburse information regarding their offerings and enhance their user experience in real-time [6,8]. The different ways that AR is a part of marketing initiatives could be viewed as one of the forms of marketing experientially because the primary focus is not only on the service; instead, it creates a holistic experience for the consumers [7,8]. Augmented reality is an essential immersive innovation in the advertising world, and is rapidly being used in consumer environments, often through built-in smart-device formats. Its capacity to combine the material environment with the digital world in real-time, using such digital material as images, opens new doors for content delivery to the audience [12]. With its ever-increasing use, it becomes necessary for companies to understand the massive impact that this type of reality has on consumer activities, to better influence it in their favor [13]. This paper introduces a research plan to investigate consumer behavior relevant to the use of AR innovative business models in the digital world, building on past knowledge of this sort of immersive technology and its effect on user traffic. It has changed the way consumers indulge in shopping [13,14,21]. AR is a digital channel in which data is overlapped with the real world in both temporal and spatial form, in real-time [29,30,40]. Thus, the user of augmented reality experiences virtual or simulated objects laid over the physical world [32,34,41]. For example, an application that allows AR users to scan a prominent building through their smartphones is a form of AR reality. Augmented reality (AR) signifies the incorporation of software-engendered 3D simulated objects into objective perspectives in order to empower computer-generated entities to exist alongside existent situations, improving the insight and interface between users and their actual world [36,37,57]. AR includes three features: a mixture of virtual objects and the physical world, instant engagement, and 3D authentication, which correctly brings into line the facts of simulated substances and factual atmospheres to allow artifacts to emerge in atmospheres suitably, or to imitate computer-generated imagery alongside the physical substances [28,38,68].
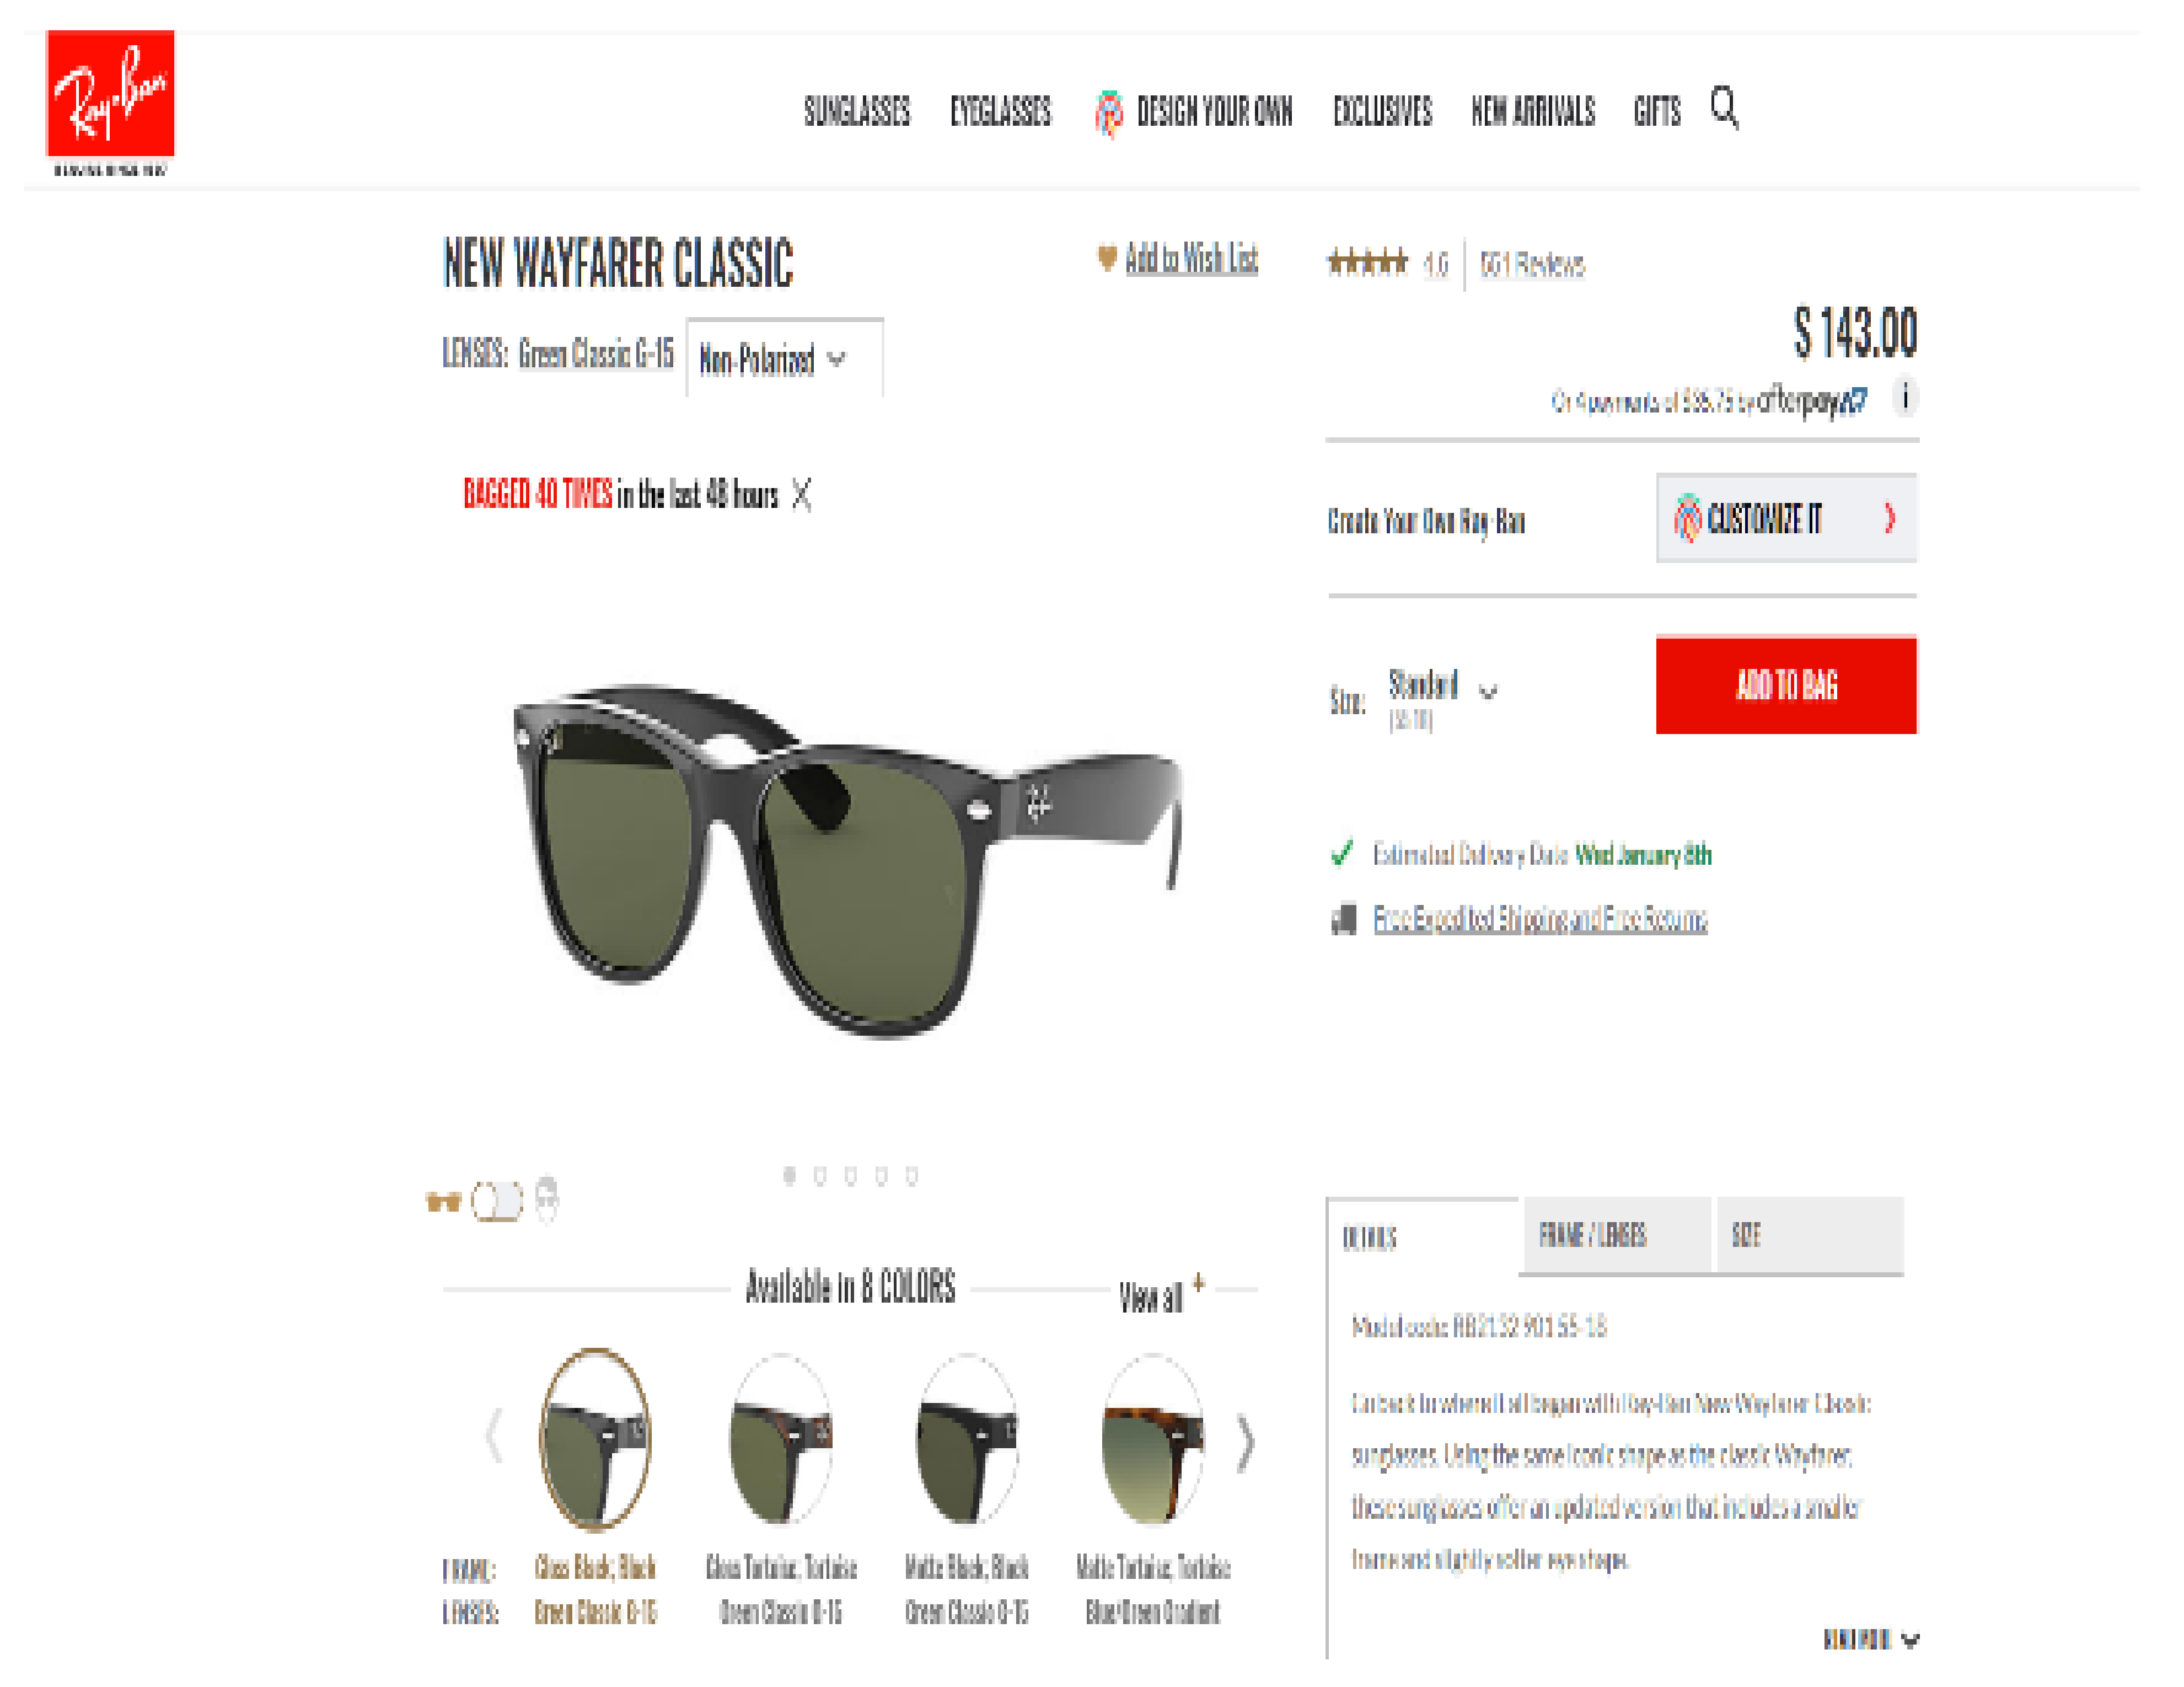
This study attempted to examine the influence of augmented reality experiential marketing (AREM) activities on the user experience and its succeeding effect on user’s satisfaction and intention to purchase. For this purpose, the researchers selected the virtual mirror facility of Ray-Ban.com/USA to augment the users’ experience, which was recorded by administering a survey questionnaire. Respondents to the study were randomly assigned to one of two groups of individuals based on their level of familiarity with augmented reality (AR) innovative applications. Augmented reality applications superimpose 3D models over real-time pictures and enhance the experience. The analysis of the study revealed that user experience is enhanced due to the presence of AREM. In contrast, user experience is itself dependent upon different aspects of human behavior and the nature of augmented reality (AR) platforms. AR provides a user-enriched experience through absorbing colors, styles, and enchanting 3D innovative models. Augmented reality also augments the display of product information by enriching the information available about an online or physical store item. For example, Google Maps AR (global localization) recognizes its surrounding buildings and street names, and superimposes directions, landmarks, and pathways on the screen when a user turns on the camera. Augmented reality (AR) also enables the placing of product information on online merchandise, or the placing of a digital bar code on the physically available merchandise that is linked to a digital advertisement or product information link. Augmented reality enhances and improves playfulness and indulgence as the users display their tailored proficiencies over their social networks. The augmented reality enriched user experience enables users to out-perform tasks and empowers users to enjoy better functionality. Similarly, the augmented user experience empowers users to virtually interact with programs and with their surroundings with seemingly endless possibilities. Therefore, the AREM user experience results in a significant positive change in the attitude of users towards the specific brand/offering, which in return generates a higher intention to purchase and similarly higher satisfaction due to changes in consumers’ behavior. The intention to purchase after being exposed to an augmented user experience is mediated through behavioral and attitudinal changes. This change in attitude is also, according to the researchers, associated with the level of familiarity of the user with Augmented Reality (AR) innovative business models. A person with lesser exposure to AR applications, lesser interaction with online buying portals, and lesser trust in online forums. In contrast, individuals with knowledge of augmented reality (AR) and innovative business models tend to have a positive attitude towards AREM.

5.1. Theoretical Implications

The undertaken research initially combines the user gratification theory and user experience model to investigate the influence of augmented reality on consumer experience and its subsequent effect in shaping the attitude and user satisfaction for a fashion accessory product. The study is also the chief proponent of application familiarity as the only significant moderator between attitude and augmented reality enriched user experience, while disagreeing with the previous studies that stressed the role of gender and age. This study extended the literature on customer interaction and user experience in general. It mainly contributed to literature regarding the usage of augmented reality (AR) in digital marketing, while stressing the importance of user experience in amplifying user satisfaction and user intention for purchases made through the use of augmented reality (AR) experiential marketing. The current study is one of the few studies which utilizes the accurate within group experimental design method in an emerging market to test the theorized relationships in a laboratory setting. By successfully designing and completing the experiment, the researcher hopes to diversify the research methodology.

5.2. Practical Implications

Besides the theoretical implications, the practical implications of this study are also of extreme importance. Augmented reality experiential marketing activities should be designed by the developers, keeping in view hedonic quality by identification, hedonic quality by simulation, aesthetic quality, and pragmatic quality, which are the four defining characteristics of the user experience as suggested through the analysis of the results. Effort should be applied in the development of augmented reality experiential marketing to make it easy to learn and use, symmetric and planned, pleasant and attractive, and capable of delivering prompt, pertinent, and effective information while fulfilling the unconscious emotional aspects of consumers during purchase. The design should be pleasant and novel enough to empower users to express their true selves on social media/blogs/websites. Retailers, venture capitalists, and marketing researchers must realize the potential power of the mediation of user experience and attitude has over user satisfaction and intention to purchase. It should collaborate in exploring and developing marketing management strategies that enhance and enrich the shopping experience of digital consumers.

5.3. Recommendation and Area of Future Research

Augmented reality signifies the entrenchment of 3D computer-generated objects (computer-generated) into material (physical) real-world environments, which can enhance and enrich user perception and experiences. It is a practical artistic tool to draw and hold the attention of users. With the modernization of computer technology, the number of augmented reality-enabled devices is increasing. The characteristics of augmented reality involve a combination of the natural environment with the virtual world, immediately enhancing interaction with and registration of 3D objects and items that appear in the real environment. The current research has numerous limitations. The primary limitation of the research was the non-availability of the lab environment where the test could be conducted with more individuals. Since the study required a computer lab with laptops and accessibility to fast internet to browse the Ray Ban virtual mirror, the only available smart lab was the School of Business (SZABIST), Karachi. Therefore, accessing individuals who could participate in the experiment was a challenging task. Due to this limitation, the number of participants was restricted to 100 individuals (which poses a threat to the external validity of results). Therefore, there is scope for conducting the same study with a larger sample size. Also, due to time constraints, the moderating effect of an evaluation of benefits and risks was not carried out. Similarly, exogenous variables affecting intention to purchase, such as social influencers, were also omitted, and the study was limited to understanding the mediating effect of attitude on intention to purchase. In addition, Ray-Ban shut down its virtual mirror facility due to website maintenance, which posed a threat to the experimental activity (though the study participant was already exposed to the stimulus). The researchers had to limit their experimental size to 100 individuals. The study is also geographically confined, as the data was only collected from Karachi.
Retailers, promoters, and marketers can use the results of this analysis to redesign their future digital activities by incorporating AR apps into their overall marketing mix while keeping user experience as the center of focus. Venture capitalists can invest in creating munificent virtual information that can appear on smartphones and can augment real objects and products into a meaningful fantasy world. In return, customers will be encouraged to download and interact with the AR app, and promoters can have a bigger canvas on which to display their products and services with an in-app environment. Regarding the avenues of future research, researchers may look forward to including hedonic qualities by evocation and affective, aesthetic qualities to the user experience. Similarly, researchers may test the influence of data security, physical security, emotional benefits, and social benefits on attitude and intention to purchase in AR experiential users. In addition, future researches may test the role of social influencers in impacting intention to purchase. Future research may also be conducted by bifurcating the user satisfaction variable into the pre-purchase, purchase, and post-purchase sub-variables, and checking the effect of AREM on every step. Culture and ethnic effects on user experience can also be added to the model. Besides these, it would be valuable and enlightening to evaluate the effect of AR apps and devices in other industries such as education and health care.

Author Contributions

Conceptualization, S.H.A.K. and R.R.A.; methodology, S.H.A.K. and R.R.A. investigation, K.A.S. and A.R.H.E.; formal analysis, S.H.A.K. and R.R.A.; resources, A.R.H.E. writing—original draft preparation, S.H.A.K. and R.R.A.; writing—review and editing, A.R.H.E. and H.A.; visualization, K.A.S.; validation, V.P., supervision, S.H.A.K. and H.A.; funding acquisition, V.P. and H.A. All authors have read and agreed to the published version of the manuscript.

Funding

This work is financially supported by Taif University Researchers Supporting Project 771 number (TURSP-2020/338), Taif University, Taif, Saudi Arabia.

Institutional Review Board Statement

Not applicable.

Informed Consent Statement

Informed consent was obtained from all the subjects involved in the study.

Acknowledgments

The authors would like to thank School of Business, SZABIST, Karachi; and Taif University, Taif, Saudi Arabia for supporting the scientific facilities for this study. We further acknowledge the financial support of Taif University, Saudi Arabia for supporting project 771 number (TURSP-2020/338).

Conflicts of Interest

The authors declare no conflict of interest.

Appendix A

Appendix A.1. Questionnaire

Note: This study evaluates the impact of augmented reality (AR) on User experience (UX) and its outcomes. The following questionnaire is developed in the context of measuring various attributes of luxury fashion accessory buying behavior. Commonly wearable fashion accessories are wallets, watches, glasses, purses, scarves, mobile covers, etc.). The questions are developed on a continuum of 1–7, with “1” being statements that you “strongly agree” with and “7” denoting the statements that you “strongly disagree” with. Your responses will not be shared, and the researcher will maintain complete confidentiality of data.

Appendix A.2. Demographic Profile

Gender
MaleFemale
Email address
Contact Details
Qualification
UndergraduateBachelors
MastersOther
Household income (monthly)
Below 50,00050,001–100,000
100,001–150,000150,001–200,000
above 200,000
Age
18–2336–45
24–3546 above
Name the eyeglasses and sunglasses accessory you like to wear or prefer carrying:
Do you use online websites or forums to purchase eyeglasses/sunglasses?
How frequently you use online application/social forums or websites to for purchasing or searching?
Daily (more than 30 min)
Daily (less than 30 min)
Several times a week
Occasionally but not every week
Fewer
Are you familiar with AR (augmented reality) applications?
Yes         No
Questionnaire
S#ConstructsItems Scales1234567
1Hedonic Quality by IdentificationHQ-I 1:The Ray Ban website is presentable
2HQ-I 2:My eyeglasses/sunglasses brings me closer to people
3HQ-I 3: I buy expensive eyeglass/sunglasses
4HQ-I 4: I wear stylish eyeglasses/ sunglasses
5HQ-I 5: My sunglasses/eyeglasses augment my self-image
6HQ-I 6: My eyeglasses/sunglasses make me feel I belong to a community
7Hedonic Quality by StimulationHQ-S 1: The Ray Ban website is appealing
8HQ-S 2: The Ray Ban website motivates me to buy
9HQ-S 3: The Ray Ban website is not absorbing
10HQ-S 4: The user experience is captivating
11HQ-S 5: The Ray Ban website is innovative
12HQ-S 6: The Ray Ban website is conventional
13Aesthetic QualityAQ 1: The Ray ban website is beautiful
14AQ 2: The website is attractive
15AQ 3: The alignment of the content was symmetrical
16AQ 4: The layout is not clean
17AQ 5: The Ray Ban website was aesthetically displeasing
18AQ 6: The design of the website was artistic
19AQ 7: The animations where realistic
20AQ 8: The website is user-friendly
21AQ 9: I had an enjoyable experience
22Pragmatic QualityPQ 1: The Ray Ban website is clearly structured
23PQ 2: The Ray Ban website is practical
24PQ 3: The Ray Ban website is easy to learn
25PQ 4: The Ray Ban website is effortless
26User SatisfactionUS 1: Overall, I am satisfied with the Ray Ban website
27US 2: Being a user of this website has been a satisfying experience
28US 3: Having experienced this website was pleasurable.
29AttitudeATT 1: I have a positive attitude towards buying eyeglasses/sunglasses from the Ray Ban website
30ATT 2: I am attracted to eyeglasses/sunglasses in my daily life
31ATT 3: Eyeglasses/sunglasses are useless.
32Intention to purchaseIP 1: I do not intend to buy eyeglass/sunglasses from the Ray Ban website
33IP 2: I would be willing to buy my eyeglasses/sunglasses via the Ray-Ban website.
34IP 3: In the future, I would buy my eyeglasses/sunglasses via the Ray Ban website.

Appendix B

The Ray-ban website was used for testing the augmented reality experiment. The website is open-source and publicly accessible to all visitors.
Figure A1. The publicly accessible website (Rayban.com (accessed on 15 June 2020)).
Sustainability 13 14064 g0a1
Figure A2. Virtual mirror used for the experiment.
Sustainability 13 14064 g0a2
Figure A3. After superimposition of glasses over the face of the respondent.
Sustainability 13 14064 g0a3

References

  1. Ahmed, R.R.; Štreimikienė, D.; Berchtold, G.; Vveinhardt, J.; Channar, Z.A.; Soomro, R.H. Effectiveness of online digital media advertising as a strategic tool for building brand sustainability: Evidence from FMCGs and Services sectors of Pakistan. Sustainbility 2019, 11, 3436. [Google Scholar] [CrossRef] [Green Version]
  2. Ahmad, M.; Shah, S.Z.A.; Abbass, Y. The role of heuristic-driven biases in entrepreneurial strategic decision-making: Evidence from an emerging economy. Manag. Decis. 2021, 59, 669–691. [Google Scholar] [CrossRef]
  3. Tsai, S.-P. Augmented reality enhancing place satisfaction for heritage tourism marketing. Curr. Issues Tour. 2020, 23, 1078–1083. [Google Scholar] [CrossRef]
  4. Qin, H.; Peak, D.A.; Prybutok, V. A virtual market in your pocket: How does mobile augmented reality (MAR) influence consumer decision making? J. Retail. Consum. Serv. 2021, 58, 102337. [Google Scholar] [CrossRef]
  5. Uddin, S.-A.; Hanna, G.; Ross, L.; Molina, C.; Urakov, T.; Johnson, P.; Kim, T.; Drazin, D. Augmented Reality in Spinal Surgery: Highlights from Augmented Reality Lectures at the Emerging Technologies Annual Meetings. Cureus 2021, 13, e19165. [Google Scholar] [CrossRef]
  6. Huang, T.-L.; Liao, S. A model of acceptance of augmented-reality interactive technology: The moderating role of cognitive innovativeness. J. Electron. Commer. Res. 2015, 15, 269–295. [Google Scholar] [CrossRef] [Green Version]
  7. Hong, S.J.; Han, S.-L. A Study of the Effect of Shopping Experience in Virtual Reality and Augmented Reality on Consumer Decision Making: Analysis of Mediating Effect of Perceived Value. Korea Bus. Rev. 2020, 24, 173–187. [Google Scholar] [CrossRef]
  8. Saima, H.; Ahmed, R.R.; Shamsi, A.F. Technology Confirmation is associated to Improved Psychological Wellbeing: Evidences from an Experimental Design. Transform. Bus. Econ. 2021, 20, 177–196. [Google Scholar]
  9. Rauschnabel, P.A.; He, J.; Ro, Y.K. Antecedents to the adoption of augmented reality smart glasses: A closer look at privacy risks. J. Bus. Res. 2018, 92, 374–384. [Google Scholar] [CrossRef]
  10. Carmigniani, J.; Furht, B.; Anisetti, M.; Ceravolo, P.; Damiani, E.; Ivkovic, M. Augmented reality technologies, systems and applications. Multimed. Tools. Appl. 2011, 51, 341–377. [Google Scholar] [CrossRef]
  11. Javornik, A. [Poster] Classifications of Augmented Reality Uses in Marketing. In Proceedings of the 2014 IEEE International Symposium on Mixed and Augmented Reality—Media, Art, Social Science, Humanities and Design (ISMAR-MASH’D), Munich, Germany, 10–12 September 2014; pp. 67–68. [Google Scholar]
  12. Cao, M.; Zheng, L.; Jia, W.; Liu, X. Fast monocular visual odometry for augmented reality on smartphones. IEEE Consum. Electron. 2020. [Google Scholar] [CrossRef]
  13. Yadav, M.S.; Pavlou, P.A. Marketing in computer-mediated environments: Research synthesis and new directions. J. Mark. 2014, 78, 20–40. [Google Scholar] [CrossRef] [Green Version]
  14. Hoffman, D.L.; Kalsbeek, W.D.; Novak, T.P. Internet use in the United States: 1995 baseline estimates and preliminary market segments. Commun. ACM 1996, 39, 36–46. [Google Scholar] [CrossRef]
  15. Kaplan, A.M.; Haenlein, M. Users of the world, unite! The challenges and opportunities of Social Media. Bus. Horiz. 2010, 53, 59–68. [Google Scholar] [CrossRef]
  16. Kozinets, R.V. Netnography: Doing Ethnographic Research Online; Sage Publications Ltd.: London, UK, 2010. [Google Scholar]
  17. Ström, R.; Vendel, M.; Bredican, J. Mobile marketing: A literature review on its value for consumers and retailers. J. Retail. Consum. Serv. 2014, 21, 1001–1012. [Google Scholar] [CrossRef] [Green Version]
  18. Shankar, V.; Balasubramanian, S. Mobile marketing: A synthesis and prognosis. J. Interact. Mark. 2009, 23, 118–129. [Google Scholar] [CrossRef]
  19. Escadas, M.; Jalali, M.S.; Farhangmehr, M. What goes around comes around: The integrated role of emotions on consumer ethical decision-making. J. Consum. Behav. 2020, 19, 409–422. [Google Scholar] [CrossRef]
  20. Agarwal, R.; Karahanna, E. Time flies when you are having fun: Cognitive absorption and beliefs about information technology usage. Mis Q. 2000, 24, 665–694. [Google Scholar] [CrossRef]
  21. Cannavo, A.; Lamberti, F. How Blockchain, Virtual Reality, and Augmented Reality are Converging, and Why. IEEE Consum. Electron. 2021, 10, 6–13. [Google Scholar] [CrossRef]
  22. Huang, T.-L.; Hsu-Liu, F. Formation of augmented-reality interactive technology’s persuasive effects from the perspective of experiential value. Internet Res. 2014, 24, 82–109. [Google Scholar] [CrossRef]
  23. ABI Research. The Digital Enterprise Ecosystem: Augmented Reality Spotlight. 2019. Available online: https://www.sbiresearch.com/blogs/2019/10/01/digital-enterprise-ecosystem-augmented-reality-spotlight/ (accessed on 15 May 2021).
  24. Gaudiosi, J. How Augmented Reality and Virtual Reality Will Generate $150 Billion in Revenue by 2020. 2015. Fortune Magazine. Available online: http://fortune.com/2015/04/25/augmented-reality-virtual-reality/ (accessed on 30 September 2020).
  25. Grand View Research Inc. The Global Augmented Reality Market Size. 2021. Available online: https://www.prnewswire.com/news-releases/augmented-reality-market-size-worth-340-16-billion-by-2028--cagr-43-8-grand-view-research-inc-301228121.html (accessed on 8 December 2021).
  26. Ahmed, R.R.; Qureshi, J.A.; Štreimikienė, D.; Soomro, R.H.; Vveinhardt, J. Guerrilla marketing trends for sustainable solutions: Evidence from SEM-based multivariate and conditional process approaches. J. Bus. Econ. Manag. 2020, 21, 851–871. [Google Scholar] [CrossRef]
  27. Steinberger, J.; Qureshi, S. The Role of Augmented Reality and Virtual Reality in Contemporary Spine Surgery. Contemp. Spine Surg. 2020, 21, 1–5. [Google Scholar] [CrossRef]
  28. Yuan, Y.H.E.; Wu, C.K. Relationships among experiential marketing, experiential value, and customer satisfaction. J. Hosp. Tour. Res. 2008, 32, 387–410. [Google Scholar] [CrossRef]
  29. Sushereba, C.E.; Militello, L.G.; Wolf, S.; Patterson, E.S. Use of Augmented Reality to Train Sensemaking in High-Stakes Medical Environments. J. Cogn. Eng. Decis. Mak. 2021, 15, 55–65. [Google Scholar] [CrossRef]
  30. Farhad, M. Augmented Reality Swoops In, Fast Company, 140. 2009. Available online: www.ebscohost.com (accessed on 11 February 2021).
  31. Ahmad, F.; Guzmán, F. Consumer skepticism about online reviews and their decision-making process: The role of review self-efficacy and regulatory focus. J. Consum. Mark. 2021, 38, 587–600. [Google Scholar] [CrossRef]
  32. Dankwa, D.D. Social media advertising and consumer decision-making: The mediating role of consumer engagement. Int. J. Internet Mark. Advert. 2021, 15, 29–53. [Google Scholar] [CrossRef]
  33. Alha, K.; Koskinen, E.; Paavilainen, J.; Hamari, J. Why do people play location-based augmented reality games: A study on Pokémon GO. Comput. Hum. Behav. 2019, 93, 114–122. [Google Scholar] [CrossRef]
  34. Katz, E.; Blumler, J.G.; Gurevitch, M. Uses and gratifications research. Public Opin. Q. 1973, 37, 509–523. [Google Scholar] [CrossRef]
  35. Rauschnabel, P.A.; Rossmann, A.; tom Dieck, M.C. An adoption framework for mobile augmented reality games: The case of Pokémon Go. Comput. Hum. Behav. 2017, 76, 276–286. [Google Scholar] [CrossRef] [Green Version]
  36. Poushneh, A.; Vasquez-Parraga, A.Z. Discernible impact of augmented reality on retail customer’s experience, satisfaction, and willingness to buy. J. Retail. Consum. Serv. 2017, 34, 229–234. [Google Scholar] [CrossRef]
  37. McLean, G.; Barhorst, J.B.; Shah, E.; Mack, R. Exploring the Antecedents & Consequences of Augmented Reality on Brand Experience–A Longitudinal Perspective. In Proceedings of the Theory + Practice in Marketing Conference, New York, NY, USA, 16–18 May 2019; Available online: https://strathprints.strath.ac.uk/68024/1/McLean_etal_TPM2019_Exploring_the_antecedents_and_consequences_of_augmented_reality_on_brand_experience.pdf (accessed on 19 September 2020).
  38. Chen, J.V.; Tran, A.; Nguyen, T. Understanding the discontinuance behavior of mobile shoppers as a consequence of technostress: An application of the stress-coping theory. Comput. Hum. Behav. 2019, 95, 83–93. [Google Scholar] [CrossRef]
  39. BCG. Augmented Reality: Is the Camera the Next Big Thing in Advertising? 2018. Available online: https://www.bcg.com/publications/2018/augmented-reality-is-camera-next-bigthing-advertising.aspx (accessed on 18 September 2020).
  40. Jones, A.R.; Lee, S.-E. Factors Influencing Engagement in Fashion Brands’ Instagram Posts. Fash. Pract. 2021, 1–25. [Google Scholar] [CrossRef]
  41. Cho, E.; Kopp, S.W.; Heix, S. Do Young Consumers care about Country-of-Origin of Luxury Fashion Brands? In Proceedings of the 2020 Global Marketing Conference, Seoul, Korea, 5–8 November 2020; pp. 103–106. [Google Scholar] [CrossRef]
  42. Anand, S.A. Fashion Brands and Social Media Marketing. SSRN Elect. J. 2020, 1–20. [Google Scholar] [CrossRef]
  43. Perannagari, K.T.; Chakrabarti, S. Factors influencing acceptance of augmented reality in retail: Insights from thematic analysis. Int. J. Retail. Distrib. Manag. 2019, 48, 18–34. [Google Scholar] [CrossRef]
  44. Azuma, R.T. A survey of augmented reality. Presence: Teleop. Virtual Env. 1997, 6, 355–385. [Google Scholar] [CrossRef]
  45. Tussyadiah, I.P.; Wang, D.; Jung, T.H.; tom Dieck, M.C. Virtual reality, presence, and attitude change: Empirical evidence from tourism. Tour. Manag. 2018, 66, 140–154. [Google Scholar] [CrossRef]
  46. Craig, A.B. Understanding Augmented Reality: Concepts and Applications; Elsevier Publication: Boston, MA, USA, 2013. [Google Scholar]
  47. Bahuguna, Y.; Verma, A.; Raj, K. Smart Learning Is Based on Augmented Reality with the Android Platform and Its Applicability. In Proceedings of the 3rd International Conference on Internet of Things: Smart Innovation and Usages (IoT-SIU), Bhimtal, India, 23–24 February 2018; pp. 1–5. [Google Scholar] [CrossRef]
  48. Mahale, P.; Yeddu, S. Android-based Augmented Reality to Enhance Education System. Int. J. Comput. Appl. 2016, 146, 18–21. [Google Scholar] [CrossRef]
  49. Park, M.; Yoo, J. Effects of perceived interactivity of augmented reality on consumer responses: A mental imagery perspective. J. Retail. Consum. Serv. 2020, 52, 101912. [Google Scholar] [CrossRef]
  50. Dixon, B.J.; Daly, M.J.; Chan, H.; Vescan, A.D.; Witterick, I.J.; Irish, J.C. Surgeons blinded by enhanced navigation: The effect of augmented reality on attention. Surg. Endosc. 2013, 27, 454–461. [Google Scholar] [CrossRef]
  51. Sangiorgio, V.; Martiradonna, S.; Fatiguso, F.; Lombillo, I. Augmented reality based-decision making (AR-DM) to support multi-criteria analysis in constructions. Autom. Constr. 2021, 124, 103567. [Google Scholar] [CrossRef]
  52. Ruggiero, T.E. Uses and gratifications theory in the 21st century. Mass Commun. Soc. 2000, 3, 3–37. [Google Scholar] [CrossRef] [Green Version]
  53. Karapanos, E.; Teixeira, P.; Gouveia, R. Need fulfillment and experiences on social media: A case on Facebook and WhatsApp. Comput. Hum. Behav. 2016, 55, 888–897. [Google Scholar] [CrossRef]
  54. Wei, X.; Weng, D.; Liu, Y.; Wang, Y. Teaching based on augmented reality for a technical, creative design course. Comput. Educ. 2015, 81, 221–234. [Google Scholar] [CrossRef]
  55. Malik, A.; Dhir, A.; Nieminen, M. Uses and gratifications of digital photo sharing on Facebook. Telemat. Inf. 2016, 33, 129–138. [Google Scholar] [CrossRef] [Green Version]
  56. Martins, N.C.; Marques, B.; Alves, J.; Araújo, T.; Dias, P.; Santos, B.S. Augmented reality situated visualization in decision-making. Multimed. Tools Appl. 2021. [Google Scholar] [CrossRef]
  57. Sawilowsky, S.S. New effect size rules of thumb. J. Mod. Appl. Stat. Methods. 2009, 8, 597–599. [Google Scholar] [CrossRef]
  58. Bettiga, D.; Lamberti, L. Future-Oriented Happiness: Its Nature and Role in Consumer Decision-Making for New Products. Front. Psychol. 2020, 11, 929. [Google Scholar] [CrossRef]
  59. Denegri-Knott, J.; Molesworth, M. Concepts and practices of digital virtual consumption. Consum. Mark. Cult. 2010, 13, 109–132. [Google Scholar] [CrossRef]
  60. Pavlik, J.V. Drones, Augmented Reality and Virtual Reality Journalism: Mapping Their Role in Immersive News Content. Media Commun. 2020, 8, 137–146. [Google Scholar] [CrossRef]
  61. Puente-Díaz, R.; Cavazos-Arroyo, J. Experiential gifts as meaningful moments and memories: Their influence on nostalgia, and relive intention. Psychol. Mark. 2021, 38, 553–563. [Google Scholar] [CrossRef]
  62. Minowa, Y. Consumer behavior over the life course: Research frontiers and new directions. Psychol. Mark. 2020, 37, 1316. [Google Scholar] [CrossRef]
  63. Pacsi, D.; Szabó, Z. Experiential Marketing, Interactivity and Gamification—Differences and Similarities Among the World-Trends. Mark. Sci. Res. Org. 2018, 30, 115–136. [Google Scholar]
  64. Yu, D.; Jin, J.S.; Luo, S.; Lai, W.; Huang, Q. A Useful Visualization Technique: A Literature Review for Augmented Reality and Its Application, Limitation & Future Direction. In Visual Information Communication; Springer: Boston, MA, USA, 2009. [Google Scholar]
  65. Lee, C.K.H. How guest-host interactions affect consumer experiences in the sharing economy: New evidence from a configurational analysis based on consumer reviews. Decis. Support. Syst. 2021, 152, 113634. [Google Scholar] [CrossRef]
  66. Siriborvornratanakul, T. Enhancing User Experiences of Mobile-Based Augmented Reality via Spatial Augmented Reality: Designs and Architectures of Projector-Camera Devices. Adv. Multimed. 2018, 2018, 8194726. [Google Scholar] [CrossRef] [Green Version]
  67. Wall, J.; Bertoni, M.; Larsson, T. The Model-Driven Decision Arena: Augmented Decision-Making for Product-Service Systems Design. Systems 2020, 8, 22. [Google Scholar] [CrossRef]
  68. Kongsilp, S.; Dailey, M.N. User Behavior and the Importance of Stereo for Depth Perception in Fish Tank Virtual Reality. Presence Virt. Augm. Real. 2020, 27, 206–225. [Google Scholar] [CrossRef]
  69. Xue, H.; Sharma, P.; Wild, F. User Satisfaction in Augmented Reality-Based Training Using Microsoft HoloLens. Computers. 2019, 8, 9. [Google Scholar] [CrossRef] [Green Version]
  70. Gäthke, J. The impact of augmented reality on overall service satisfaction in elaborate servicescapes. J. Serv. Manag. 2020, 31, 227–246. [Google Scholar] [CrossRef]
  71. Choe, J.; Lee, T.; Seo, S. Augmented-Reality-Based 3D Emotional Messenger for Dynamic User Communication with Smart Devices. Electronics 2020, 9, 1127. [Google Scholar] [CrossRef]
  72. Dirin, A.; Laine, T. User Experience in Mobile Augmented Reality: Emotions, Challenges, Opportunities and Best Practices. Computers 2018, 7, 33. [Google Scholar] [CrossRef] [Green Version]
  73. Ghazali, E.; Mutum, D.S.; Woon, M.Y. Exploring player behavior and motivations to continue playing Pokémon GO. Inf. Technol. People 2019, 32, 646–667. [Google Scholar] [CrossRef]
  74. Tsai, C.-H.; Huang, J.-Y. Augmented reality display based on user behavior. Comput. Stand. Interfaces. 2018, 55, 171–181. [Google Scholar] [CrossRef]
  75. Fiore, A.M.; Kim, J.; Lee, H.H. Effect of image interactivity technology on consumer responses toward the online retailer. J. Interact. Mark. 2005, 19, 38–53. [Google Scholar] [CrossRef]
  76. Steuer, J. Defining virtual reality: Dimensions determining telepresence. J. Commun. 1992, 42, 73–93. [Google Scholar] [CrossRef]
  77. Lia, H.; Paulin, G.; Yeo, C.T.; Andrews, J.; Yi, N.; Haq, H.; Fichtinger, G. HoloLens in Suturing Training. SPIE Proc. 2018, 10576, 1057628. [Google Scholar]
  78. Wolfram, H.-J.; Mohr, G. Gender-typicality of economic sectors and gender-composition of working groups as moderating variables in leadership research. Gend. Manag. Int. J. 2010, 25, 320–339. [Google Scholar] [CrossRef]
  79. Tinko; Amelia, P. Measuring the moderating effect of age, gender and educational level on UMKM go digital program. AIP Conf. Proc. 2019, 2097, 030098. [Google Scholar] [CrossRef]
  80. Song, L.; Zhou, Y.; Wang, Y. Can social support make adolescents gritty? The moderating roles of age and gender. Curr. Psychol. 2021. [Google Scholar] [CrossRef]
  81. Morisada, M.; Miwa, Y.; Dahana, W.D. Behavioral Impacts of Promotion-induced Cross-buying: The Moderating Roles of Age and Gender. J. Bus. Divers. 2018, 18, 33–45. [Google Scholar] [CrossRef]
  82. Hassenzahl, M.; Tractinsky, N. User experience-a research agenda. Behav. Inf. Technol. 2006, 25, 91–97. [Google Scholar] [CrossRef]
  83. Rejeb, A.; Rejeb, K.; Treiblmaier, H. How augmented reality impacts retail marketing: A state-of-the-art review from a consumer perspective. J. Strat. Mark. 2021, 1–31. [Google Scholar] [CrossRef]
  84. Jordan, T. Activism! Direct Action, Hacktivism, and the Future of Society; Reaktion Books Ltd.: London, UK, 2002. [Google Scholar]
  85. Mahadeen, T.; Galanakis, K.; Samara, E.; Kilintzis, P. Heuristics and Evidences Decision (HeED) Making: A Case Study in a Systemic Model for Transforming Decision Making from Heuristics-Based to Evidenced-Based. J. Knowl. Econ. 2020, 12, 1668–1693. [Google Scholar] [CrossRef]
  86. Li, C.-Y.; Fang, Y.-H. I searched, I collected, I experienced: Exploring how mobile augmented reality makes the players go. J. Retail. Consum. Serv. 2020, 54, 102018. [Google Scholar] [CrossRef]
  87. Huang, T.-H. Restorative experiences and online tourists’ willingness to pay a price premium in an augmented reality environment. J. Retail. Consum. Serv. 2021, 58, 102256. [Google Scholar] [CrossRef]
  88. Hair, J.; Risher, J.; Sarstedt, M.; Ringle, C. When to use and how to report the results of PLS-SEM. Eur. Bus. Rev. 2019, 31, 2–24. [Google Scholar] [CrossRef]
  89. Fornell, C.; Larcker, D.F. Structural equation models with unobservable variables and measurement error: Algebra and statistics. J. Mark. Res. 1981, 18, 382. [Google Scholar] [CrossRef]
  90. Henseler, J.; Ringle, C.M.; Sinkovics, R.R. The Use of Partial Least Squares Path Modeling in International Marketing. In New Challenges to International Marketing; Emerald Group Publishing Limited: Bingley, UK, 2009; pp. 277–319. [Google Scholar]
  91. Geisser, S. A predictive approach to the random effect model. Biometrika 1974, 61, 101–107. [Google Scholar] [CrossRef]
  92. Kerlinger, F.N.; Lee, H.B.; Bhanthumnavin, D. Foundations of Behavioral Research: The Most Sustainable Popular Textbook by Kerlinger & Lee; Harcourt College Publishers: Fort Worth, TX, USA, 2000. [Google Scholar]
  93. Stone, M. Cross-validation and multinomial prediction. Biometrika 1974, 61, 509–515. [Google Scholar] [CrossRef]
  94. Nunnally, J.C.; Bernstein, I.H. Psychometric Theory, 3rd ed.; McGraw-Hill: New York, USA, 1994. [Google Scholar]
  95. Kaiser, H.F. An index of factorial simplicity. Psychometrika 1974, 39, 31–36. [Google Scholar] [CrossRef]
  96. Netemeyer, R.G.; Bearden, W.O.; Sharma, S. Scaling Procedures: Issues and Applications; Sage Publications: Thousand Oaks, CA, USA, 2003. [Google Scholar]
  97. Zikmund, W.G. Business Research Methods, 6th ed.; The Dryden Press: Fort Worth, Texas, USA, 2000. [Google Scholar]
  98. Cohen, E.; Aberle, D.F.; Bartolomé, L.J.; Caldwell, L.K.; Esser, A.H.; Hardesty, D.L.; Majumder, P.P. Environmental Orientations: A Multidimensional Approach to Social Ecology. Curr. Anthr. 1976, 17, 49–70. [Google Scholar] [CrossRef]
Figure 1. A Proposed Conceptual Model.
Sustainability 13 14064 g001
Figure 2. Final Conceptual Proposed Framework. Source: Adapted from: [35,36,73,84,87].
Sustainability 13 14064 g002
Table 1. Descriptive Analysis.
QuestionFrequencyValid Percent
GenderMale5555
Female4545
Total100100.0
QualificationUndergraduate66
Bachelors4141
Masters3939
Other1414
Total100100.0
IncomeBelow 50,00088
50,001–100,0001919
100,001–150,0002020
150,001–200,0002626
above 200,0002727
Total100100.0
Age18–232222
24–356767
36–451111
45 above--
Total100100.0
Table 2. Reliability test.
ScaleReferencesCronbach’s AlphaN of Items
HQI (Q1-Q6)Huang & Hsu-Liu [22]; Poushneh & Vasquez-Parraga [36]0.7896
HQS (Q7-Q12)Huang & Hsu-Liu [22]; Poushneh & Vasquez-Parraga [36]0.6426
AQ (Q13-Q21)Jordan [84]; Poushneh & Vasquez-Parraga [36]0.6429
PQ (Q22-Q25)Huang & Hsu-Liu [22]; Poushneh & Vasquez-Parraga [36]0.7504
US (Q26-Q28)Ghazali, Mutum & Woon [73]; Rauschnabel, Rossmann & Dieck [35]0.9233
Attitude (Q29-Q31)Karapanos, Teixeira, & Gouveia [53]; Alha [33]0.8603
Intention to buy (Q32-Q34)Karapanos, Teixeira, & Gouveia [53]; Alha [33]0.8043
Reliability (All Questions) 0.77234
Table 3. Exploratory Factor Analysis.
Time
Kaiser-Meyer-Olkin Measure of Sampling Adequacy.0.644
Bartlett’s Test of SphericityApprox. Chi-Square1327.574
Df100
Sig.0.000
Table 4. Measure of Convergent Validity.
Cronbach’s AlphaComposite ReliabilityAverage Variance Extracted (AVE)
AQ0.7790.8510.536
Attitude0.8350.9210.854
HQI0.8660.9200.795
HQS0.7320.8440.643
Intention to purchase0.8030.8850.727
PQ0.8830.9200.742
UX0.9250.9350.497
User satisfaction0.9220.9510.865
Significance value at; alpha > 0.70; CR > 0.70; AVE > 0.50.
Table 5. Discriminant Validity (Fornell and Larcker Criterion).
AQAttitudeHQIHQSIntention to PurchasePQUXUser Satisfaction
AQ0.732
Attitude−0.0460.923
HQI0.5940.2610.892
HQS0.6050.1980.5230.802
Intention to purchase−0.1380.8500.2540.2200.853
PQ0.7520.2360.8290.6070.1580.861
UX0.8650.1910.8630.7560.1380.9460.705
User satisfaction0.6960.3090.5890.7040.2400.7480.7950.930
Table 6. Total direct effects.
HypothesesDirect Effectsp-ValuesDecision
H1: UX → Attitude0.2100.000Accepted
H2: Attitude → Intention to purchase0.8460.000Accepted
H3: UX → User satisfaction0.7950.000Accepted
H4a: AQ → UX0.3010.000Accepted
H4b: PQ → UX0.3710.000Accepted
H4c: HQI → UX0.2670.000Accepted
H4d: HQS → UX0.2090.000Accepted
HypothesesModerating effectsp-Values
H5a: Familiarity → Attitude0.2090.000Accepted
H5b: Age → Attitude0.0370.901Rejected
H5c: Gender → Attitude−0.0570.813Rejected
Table 7. Total Indirect Effects.
HypothesesIndirect Effectsp-ValuesDecision
H6: UX → Attitude → Intention to purchase0.2210.000Accepted
H7a: AQ → UX → User satisfaction0.2390.000Accepted
H7b: HQI → UX → User satisfaction0.2130.000Accepted
H7c: HQS → UX → User satisfaction0.1660.000Accepted
H7d: PQ → UX → User satisfaction0.2950.000Accepted
Table 8. R Square (Percentage variance explained).
R SquareR Square Adjusted
Attitude0.2210.016
Intention to purchase0.7150.706
UX1.0001.000
User satisfaction0.6320.619
Table 9. Effect Size.
AttitudeUser Satisfaction
Intention to purchase2.513
Moderating Effect 10.209
UX0.0251.718
Table 10. Predictive relevance.
SSOSSE
(= 1 − SSE/SSO)
AQ155.000155.000
Age31.00031.000
Attitude62.00060.3570.026
Familiarity31.00031.000
Gender31.00031.000
HQI93.00093.000
HQS93.00093.000
Intention to purchase93.00051.8400.443
Moderating Effect 131.00031.000
Moderating Effect 231.00031.000
Moderating Effect 331.00031.000
PQ124.000124.000
UX465.000263.7940.433
User satisfaction93.00046.5010.500
Publisher’s Note: MDPI stays neutral with regard to jurisdictional claims in published maps and institutional affiliations.

