Abstract
China attaches importance to the combination of credit policy and environmental protection, tries to use credit policy tools to protect ecology and pollution prevention, and prevent environmental credit risk. With the proposal of the goal of “carbon peak and carbon neutralisation” (“double carbon”), green credit is also regarded as an important policy tool to achieve this goal. Firstly, this paper selects the time series data of green credit at the national level from 2013 to 2019 according to the official statistics and evaluates the coupling and coordinated development of credit system and environmental system based on the coupling coordination model. The results show that the two systems show well-coordinated development, but the interaction has annual fluctuations. Secondly, by calculating the provincial carbon emissions and green credit panel data from 2005 to 2019, the dynamic internal mechanism is analysed based on Panel Vector Autoregression (PVAR) model. It is found that green credit has a significant inhibitory effect on carbon emissions. The research results of this paper provide an overall evaluation of the quantity and quality of green credit for China’s banking industry. It also provides reasonable and effective support for green credit as a policy tool to promote realising the “double carbon” goal. In addition, China should maintain the consistency, stability and durability of green credit policy and continue to contribute to the low-carbon transformation of the economy and society.
1. Introduction
Global warming is related to human survival and development. The International Energy Agency (IEA) points out in its report that to limit the global temperature rise to 1.5 °C of “safety”, the net-zero targets have to quickly turn into real-world action. In 2020, at the General Debate of the 75th Session of the United Nations General Assembly, China clearly put forward the goals of “carbon peak” and “carbon neutralisation” (“double carbon”).
On the other hand, finance has the function of resource allocation. The development of green finance is also regarded as an important path to achieve sustainable economic and environmental development. Existing studies have summarised and classified the green financial and monetary policies of countries and regions worldwide, divided into three forms: neoliberal forms, reformist forms, and progressive forms [1]. China’s green finance focuses on energy conservation, pollution prevention and control, resource conservation and recycling, clean transportation, clean energy, ecological protection and climate adaptation. Because China’s financial system is dominated by indirect financing, the green credit policy is also the earliest and relatively important green financial policy [2]. In fact, China’s use of credit policy to carry out environmental protection can be traced back to the notice on implementing credit policy and environmental protection issued by the People’s Bank of China in 1995. The notice requires banks to consider ecological protection and pollution prevention when making loans so as to promote the coordinated development of the economy and environmental protection. In 2007, the Ministry of Ecology and Environment of the People’s Republic of China (Appendix A), the People’s Bank of China and the former CBRC jointly issued the opinions on implementing environmental protection policies and regulations to prevent credit risks, emphasising the prevention of credit risks caused by environmental pollution. However, due to the vague details and unclear implementation standards of China’s green credit policy at this stage, the policy effect has not been brought into full play [3]. It was not until 2012 that the former CBRC formulated the green credit guidelines to raise the green credit work to a strategic level that the scale of green credit in China began to grow rapidly. After years of improvement, China has established a relatively complete green credit system framework and carried out special statistics for many years. According to the data released by the People’s Bank of China, by the end of September 2021, the green credit balance of 21 major banking institutions in China had reached 14.08 trillion yuan, an increase of more than 21% over the beginning of the year. The annual carbon dioxide emission reduction is expected to exceed 700 million tons. In the practice of green credit in China, financial institutions not only guide capital investment and promote industrial structure adjustment by increasing loans for green industries and reducing the credit scale of high energy-consuming industries but also meet the credit needs of traditional energy users for energy conservation, emission reduction and technological innovation. Relevant studies also analyse the impact of financial development on environmental protection. It is empirically found that there is an inverted U-shaped relationship between financial development, carbon emission and energy consumption. It is believed that when economic and financial development reaches a higher level, it can inhibit carbon emission [4,5,6,7,8,9,10,11,12,13]. Further focusing on the impact mechanism of green credit on carbon emission, Zhang et al. [14] believe that green credit can inhibit carbon intensity by promoting industrial structure upgrading, technological innovation and signal effect.
However, the above analysis mainly considers the unilateral impact of green credit on carbon emissions or finance on the environment, but fewer analyses the credit system and environmental system in a unified framework. Actually, the pressure on financial institutions is also increasing day by day. There are strict capital investment restrictions on green credit. According to the latest statistical calibre of the China Banking and Insurance Regulatory Commission, green loans should be invested in green industries such as energy conservation and environmental protection, cleaner production, clean energy, ecological environment, green upgrading of infrastructure and green services. The “double carbon” goal has become the focus of China’s current environmental protection work. Under the policy background of vigorously developing green credit and promoting the realisation of the “double carbon” goal, most banks with a low proportion of green credit have the motivation to “let go” of green credit and “stop” lending to high energy-consuming industries. They are more likely to blindly lend to new energy industries and restrict loans to high energy-consuming industries. This may hurt high-carbon enterprises with the intention of transformation and is more likely to bring risks to the financial system itself. At present, the People’s Bank of China mainly quantitatively evaluates the green credit performance of banking financial institutions from the scale of green credit2. The evaluation system fails to better reflect the quality of green credit and its impact on the banking industry. As a profit-making body, commercial financial institutions still need to ensure the sustainability of their own operation and profits while undertaking social responsibilities.
Does credit work really achieve coordinated development with environmental protection? What impact will green credit have on its own system in promoting the realisation of the “double carbon” goal? What is the dynamic interaction between green credit and carbon emissions? Before we analyse the effectiveness of credit instruments on environmental protection, it is also very important to think about and evaluate their rationality, which is the problem this paper hopes to explore.
Therefore, the contributions of this study mainly include the following two points: Firstly, we analyse the coupling of a credit environment system based on the coupling coordination model and evaluate whether the application of credit policy to environmental protection regulation has realised the common sustainable development of the two systems through intuitive calculation results. Secondly, we focus on the dynamic and internal interaction between green credit and carbon emission. We use the panel vector autoregressive (PVAR) model to analyse their impact from the perspective of dynamics and internal logic. The above research results provide reasonable and effective support for China’s green credit as a policy tool to promote the realisation of the “double carbon” goal.
2. Literature Review
The practice of combining finance and environment can be traced back to the Comprehensive Environmental Response, Compensation, and Liability Act (CERCLA) promulgated by the United States in 1980. The act requires enterprises to be responsible for the environmental pollution caused by them, which has aroused the banking industry’s concern regarding the operational risk about the environmental risk of their lending enterprises. Coulson [15] commented on the Book “Sustainable Finance and Banking: the Financial Sector and the Future of the Planet”, pointing out that the book puts forward the concept of sustainable financing. The book also believes that the banking industry can achieve its own sustainable development in promoting the development of green finance. In 2003, 10 major banks announced accepting the “Equator Principle” and voluntarily undertaking and fulfilling more social and environmental responsibilities. This principle is also one of the most influential green credit standards at the international level. Based on these practices and studies, scholars put forward environmental risk theory and sustainable development theory [16].
In foreign studies, the term “green credit” is less used, and they use more concepts such as environmental finance [17], climate finance [18,19], sustainable finance [20,21] and green finance [22,23,24]. The emphases of these concepts are different, but they are interrelated and inclusive, and the academic circles have not given a clear definition of these concepts. Nedopil et al. [25] discussed the essence of green financial standards, put forward assumptions and tested them based on institutional and standards theories. It is found that the development and application of green financial standards depend on the system setting (e.g., economic governance of market versus government power). The development of green finance standards will accelerate people’s wider recognition of the need for action on green finance. The mode choice of different green financial standards is related to the policymakers, the characteristics of the implementation areas and the specific period.
The development of green credit in China is designed and improved based on constantly absorbing mature international experience and combined with China’s national conditions. Different from foreign countries that establish voluntary principles through the industry and promote the development of green finance from bottom to top, the implementation of green credit in China is promoted by the regulatory authorities from top to bottom and has the force of enforcement. Its essence is that environmental protection regulation means is realised through financial leverage. The connotation of green credit in China can be understood from two aspects: One is the national policy level, in which the government guides commercial banks to undertake corresponding social and environmental responsibilities in credit operation through policy incentives; Second, at the level of operation and management, commercial banks cultivate and support the growth and development of resource-saving and environment-friendly enterprises, and restrict the investment loans and working capital of polluting enterprises and projects with environmental problems [26]. Therefore, the domestic research on green credit mainly focuses on two aspects: one is the enthusiasm of the participants of green credit policy, and the other is the effectiveness evaluation of green credit policy. As for the research on the participants of green credit policy, Zhou et al. [27] analysed the behaviour choices of the government, banks and enterprises in the implementation of green credit based on the evolutionary game model. The results show that enterprises or banks always choose “don’t take” and “don’t implement” strategies in the short term, but the chosen strategy is the opposite in the long term. Wang [28] and Sun et al. [29] found that green credit can improve the quality of bank assets, reduce the non-performing loan ratio and inhibit bank credit risk. He et al. [30] empirically found that green credit can improve the return on total assets of commercial banks and enhance the competitiveness of commercial banks. Zhang and Lian [31], Guo and Liu [32] analyse the impact of green credit on the profitability of commercial banks based on the heterogeneity of commercial bank types. As for the research on the effectiveness of green credit policy, in 2012, China Banking Regulatory Commission issued the green credit guidelines (GCG2012), which provides normative guidelines for financial institutions to carry out green credit work. Different scholars have demonstrated the effectiveness of green credit from the perspectives of debt financing cost, technological innovation, energy investment efficiency and industrial structure upgrading [33,34,35,36]. However, from the above literature, most studies mainly focus on the effectiveness of credit policy on environmental protection, but less on the rationality of this practice itself.
Studies have shown that finance can promote the green allocation of economic resources in the process of low-carbon economic transformation [37,38,39]. However, relevant studies also emphasise the risks faced by the financial system in promoting sustainable development and emphasise that science and rationality should be paid attention to when using credit policies to guide the transformation of the low-carbon economy. Gunningham [40] stressed that financial markets could and should be the key driving force for the rapid transformation to a low-carbon economy. They should make a strong contribution to realising a low-carbon and climate-adaptive economy through a well-designed leverage mechanism. D’Orazio and Popoyan [41] proposed a critical review of existing and novel Prudential methods to stimulate de-carbonisation of bank balance sheets and align finance with sustainable growth and development goals so as to give play to the role of macro-prudential policies in promoting green credit while ensuring the stability of the financial system. Semieniuk et al. [42] pointed out that the systematic transformation of the economic structure caused some industries directly related to the production and consumption of fossil fuels to lead to a debt default because of sudden asset revaluation. The increase in relative economic weights in emerging industries is also likely to cause bubble risk, which has a significant impact on the financial system’s stability.
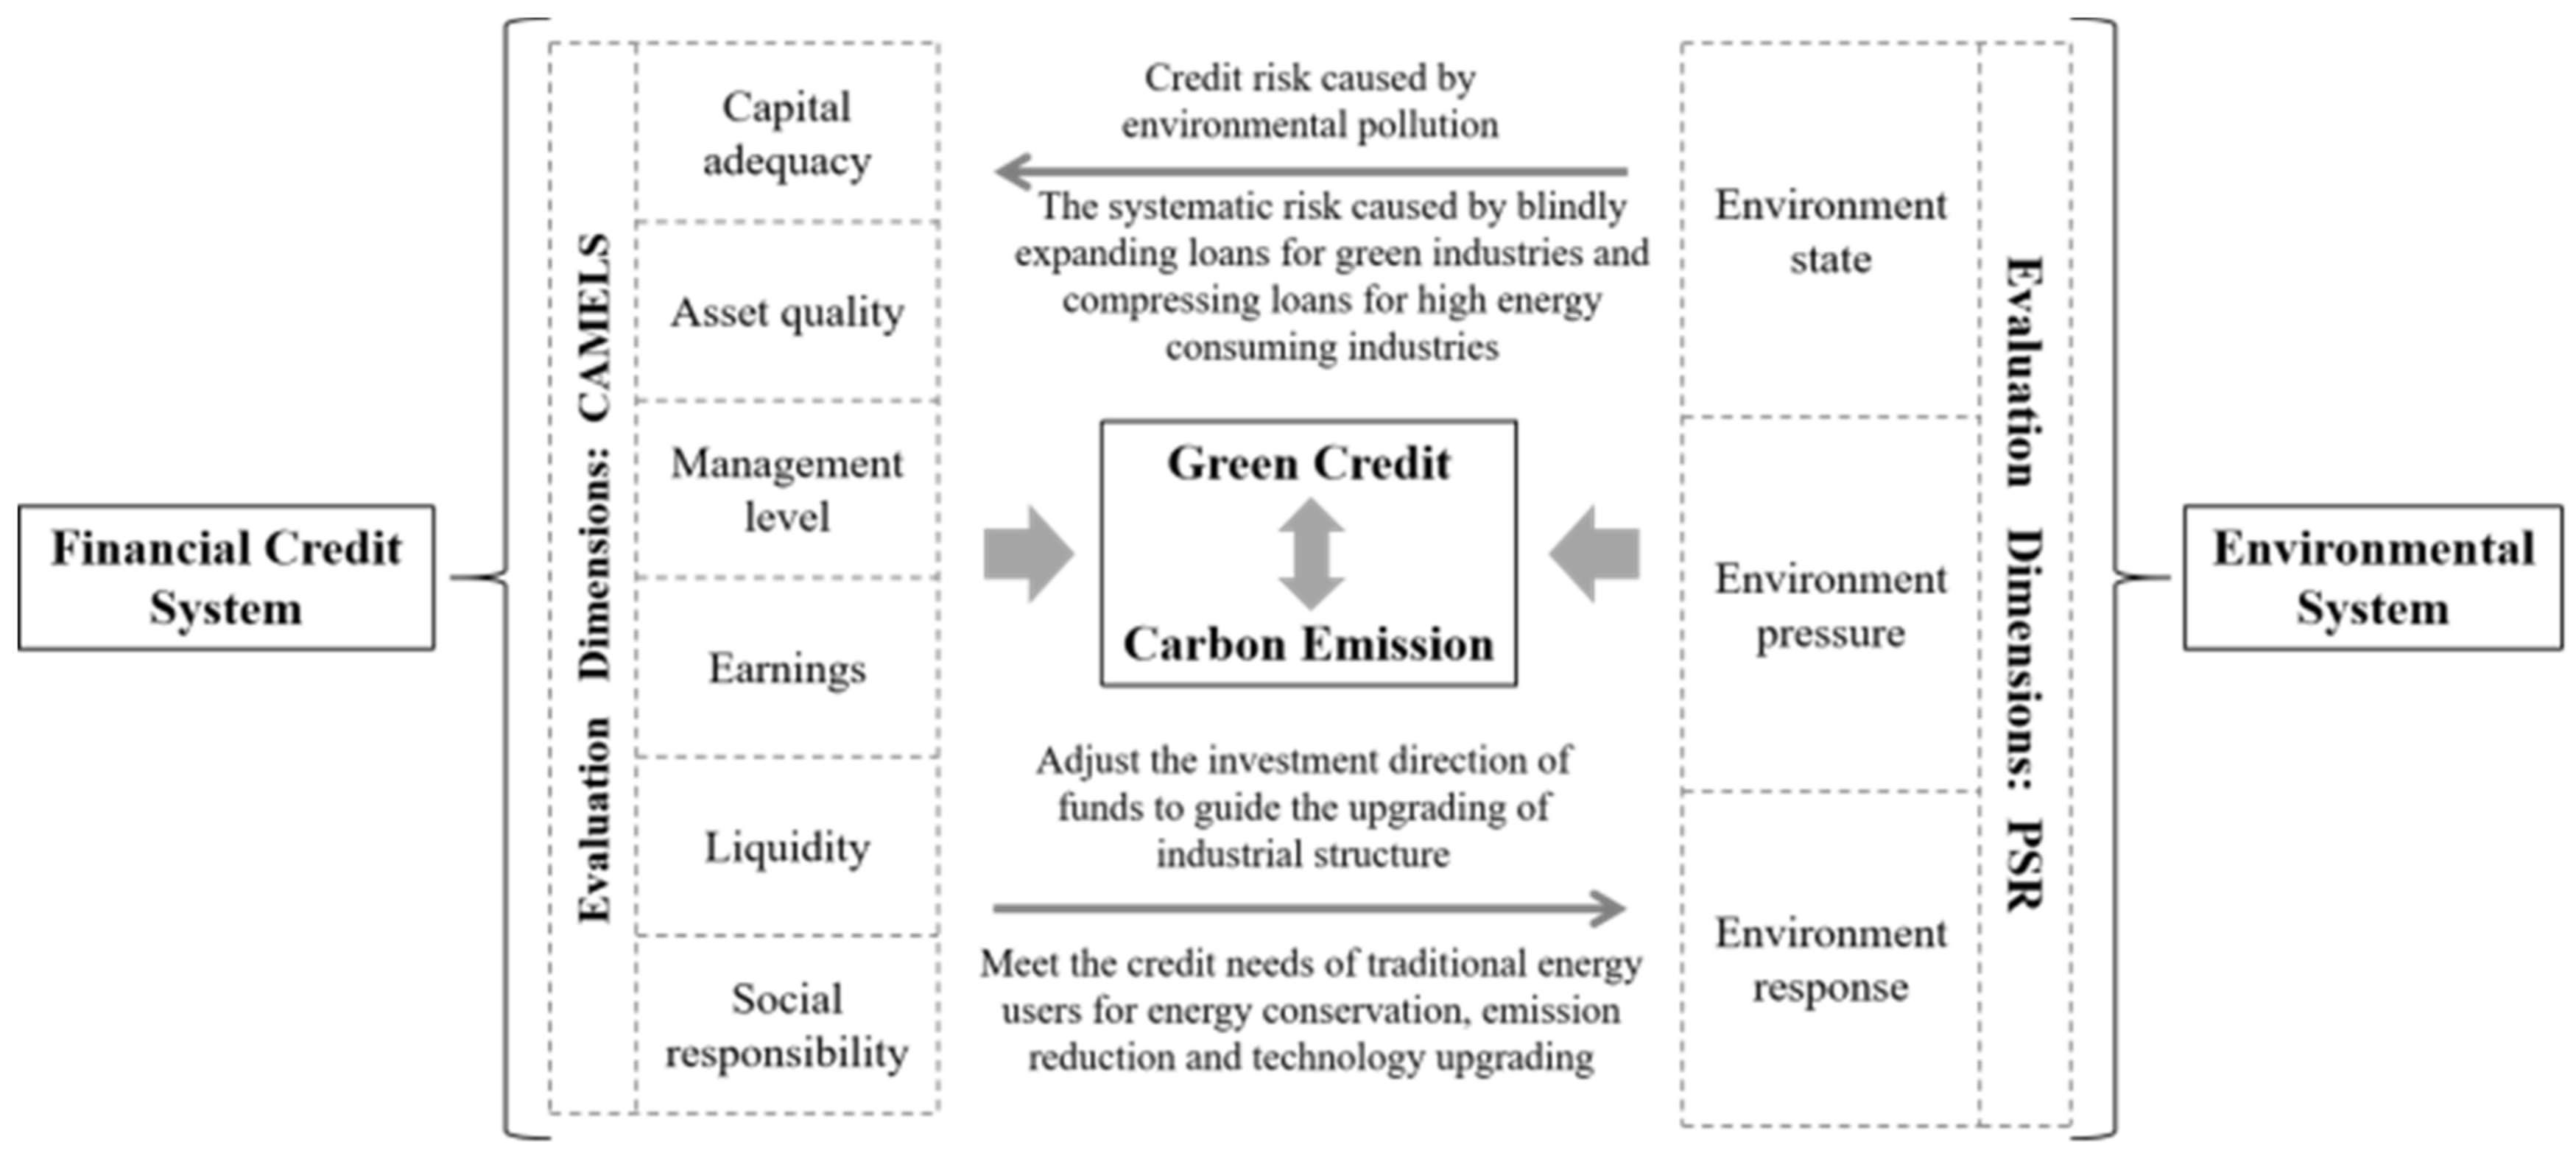
To sum up, existing studies have confirmed that there is a tight relationship between finance and the environment, and the change, development and mutual impact of the financial system and environmental system are more comprehensive and complex system problems. As China’s main green financial policy tool, green credit has its own characteristics. Most of the existing studies focus on analysing the effectiveness of green credit policy on environmental protection, but less on thinking and evaluating the rationality of this practice itself. At present, China has put forward the “double carbon” goal, and green credit is also regarded as an important tool to promote the realisation of this goal. Then, the impact of the development of green credit on the financial system itself and the environmental system is worth further discussion. The CAMEL evaluation method is mostly used for the evaluation of commercial banks and other financial institutions in the financial credit system [43]. Based on the traditional camel evaluation method, this paper adds the dimension of social responsibility to form the CAMELS evaluation system. For evaluating the environmental system, most studies use the PSR evaluation system [44]. The system describes the interaction between humans and the environment from the three dimensions of pressure, state and response. Pressure indicators reflect the role of human activities on the environment. State indicators describe the environmental state at a specific time stage. Response indicators reflect the remedial measures taken by human beings in the face of damage to the natural environment. The credit risk caused by environmental pollution has attracted the attention of the banking industry with the essence of business risk to environmental protection. Under the “double carbon” goal, green credit aims to promote industrial upgrading by guiding capital investment and to achieve energy conservation and emission reduction by meeting the capital needs of traditional energy users for technological upgrading. However, blind expansion of green industry loans and compression of high energy-consuming industry loans can also bring systemic risks. Therefore, we build a CAMELS-PSR analysis framework to analyse the above problems, as shown in Figure 1.
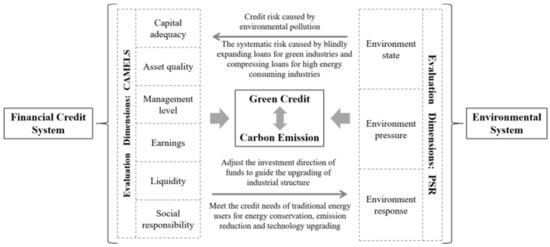
Figure 1.
CAMELS-PSR analysis framework of the financial credit system and environmental system.
3. Methods and Data
For the measurement and evaluation of whether the system elements can interact with each other and the overall coordinated development, the coupling coordination model can provide intuitive result evaluation, which is also adopted by many mathematicians. As a model to measure the interaction between system variables, the PVAR (panel vector autoregressive) model can analyse the changes in the process of system development from a dynamic perspective. Referring to the practice of Liao et al. [45], combining the two models can comprehensively evaluate the coupling between financial credit and environmental protection from the perspectives of “static” and “dynamic” and “external” and “internal”. This part will elaborate on the above two models and the data used.
3.1. Coupling Coordination Model
3.1.1. Model Setting
Coupling originates from the physical concept, which refers to the phenomenon that two or more systems and their elements affect each other and finally achieve synergy through interaction. Many scholars have introduced it into the measurement and evaluation of the overall coordinated development of the economy and society. Referring to the summary of existing coupling coordination models by Wang et al. [46], the calculation formula of coupling degree in this paper is as follows:
where represents the comprehensive value of each system layer, and n represents the number of system layers. The number of system layers in this paper is two: credit system and environment system, respectively. Therefore, the above coupling degree calculation formula is simplified as follows:
where represents the comprehensive evaluation index of the credit system, and represents the comprehensive evaluation index of the environmental system.
The larger the value of C, the smaller the dispersion between the credit and environmental systems and the better the coupling. However, the coupling degree C can only reflect the interaction degree between the two systems. It is necessary to introduce the coupling coordination degree D to measure whether different systems develop together. The specific calculation formula is as follows:
where and represent the weight of the two systems; this paper gives equal weight to the credit and environmental systems according to most existing research practices [46]. T represents the comprehensive and coordinated development index. D represents the coupling coordination degree. RDD represents the relevant development level. Further referring to the practice of Li et al. [47] and Liao et al. [45], combined with the RDD calculated by Formula (5), which represents the leading and lagging coordinated development relationship of the two systems, the coupling coordination of the two systems is divided into ten levels (Table 1).

Table 1.
Evaluation criteria for coupling and coordination of Credit–Environment System.
3.1.2. Index System
As a financial institution operating a money and credit business, banks not only have their own demands for profit but also have the functions of credit creation and capital financing. At the same time, as an important part of the financial system, banks should also meet the requirements of macro-prudential supervision and maintain the financial system’s stability. Moreover, according to the concept of sustainable financing, the banking industry should also bear the corresponding social responsibility in development. Therefore, based on the CAMELS evaluation system mentioned above, to comprehensively measure whether banks can take into account their own benefits, risks and social responsibilities in promoting green credit, this paper selects twelve indicators from six aspects: capital security, asset quality, management level, profitability, liquidity and the environmental benefits of constructing a comprehensive index of the credit system3. The relevant data are from the official website of the People’s Bank of China. For the construction of the comprehensive index of the environmental system, based on the PSR evaluation system, according to the green industry guidance catalogue jointly issued by seven ministries and commissions4, and the green credit statistical standard revised by the People’s Bank of China, this paper selects twenty indicators from the three aspects of the environmental state, environmental pressure and environmental response to evaluate the coordinated development of green credit and environmental protection in a more targeted way. The data are derived from China Statistics Yearbook on Environment and China Energy Statistics Yearbook. The specific indicators are shown in Table 2.
Table 2.
Evaluation index of coordinated development of Credit–Environmental System.
3.1.3. Data Processing and Weight Determination
Before building a comprehensive evaluation index for the credit and environmental systems, we need to standardise the data to eliminate dimension influence. The specific formula of standardisation is as follows:
where is the original value of system index in year , 0 < ≤ n, 0 < ≤ m. is the standardised value of system index in year , 0 ≤ ≤ 1. When the contribution of the selected index to the system evaluation is positive, it is called the positive index, which is standardised by Formula (6). When the contribution of the selected index to the system evaluation is negative, it is called the negative index, which is standardised by Formula (7).
Further, the index weight of each system layer needs to be determined. Referring to previous studies [45,46,47], the entropy method, as a weight determination method to measure the amount of information, is driven by data and can avoid the randomness of the subjective weighting method. Therefore, this method is also applied in this paper. The specific calculation process is as follows:
Firstly, the entropy value is obtained according to the calculation formula of the entropy method:
where represents the number of the system . indicators. To ensure significance, we specify:
Then, we calculate the weight of system index :
Finally, we calculate the system comprehensive evaluation index:
3.2. PVAR Model
3.2.1. Model Setting
The coupling coordination model gives an intuitive evaluation of the coupling of the credit environment system. Green credit is regarded as a tool to achieve the “double carbon” goal. It is important to clarify its dynamic internal mechanism with carbon emission. Vector autoregressive (VAR) model is used to estimate the dynamic relationship of joint endogenous variables without any prior constraints. It establishes a model based on the statistical properties of data. It constructs a model by taking each endogenous variable in the system as a function of the lag value of all endogenous variables in the system so as to explain the interaction between variables. By observing the impulse response function of the system, we can analyse the system’s response to a random impact of one of the variables and how long this response will last. The PVAR model further considers the impact of individual heterogeneity when the VAR model is applied to panel data. Therefore, this paper analyses the dynamic effect of green credit and carbon emission based on the PVAR model proposed by Holtz-Eakin et al. [48] and improved by Love and Zicchino [49]. The specific model is constructed as follows:
where represents the endogenous variables of the system, including green credit and carbon emission. is the regression coefficient. is the lag order. represents individual heterogeneity. represents the random residuals. The specific estimation method refers to Abrigo and Love [50]. Firstly, the orthogonal dispersion transformation method deals with the individual fixed effect. Then, the GMM method is used to construct the estimator and calculate the impulse response and prediction variance decomposition results.
3.2.2. Variables Collection and Data Sources
This paper focuses on the dynamic analysis of green credit and carbon emission, mainly including two variables:
- Green credit (GC):
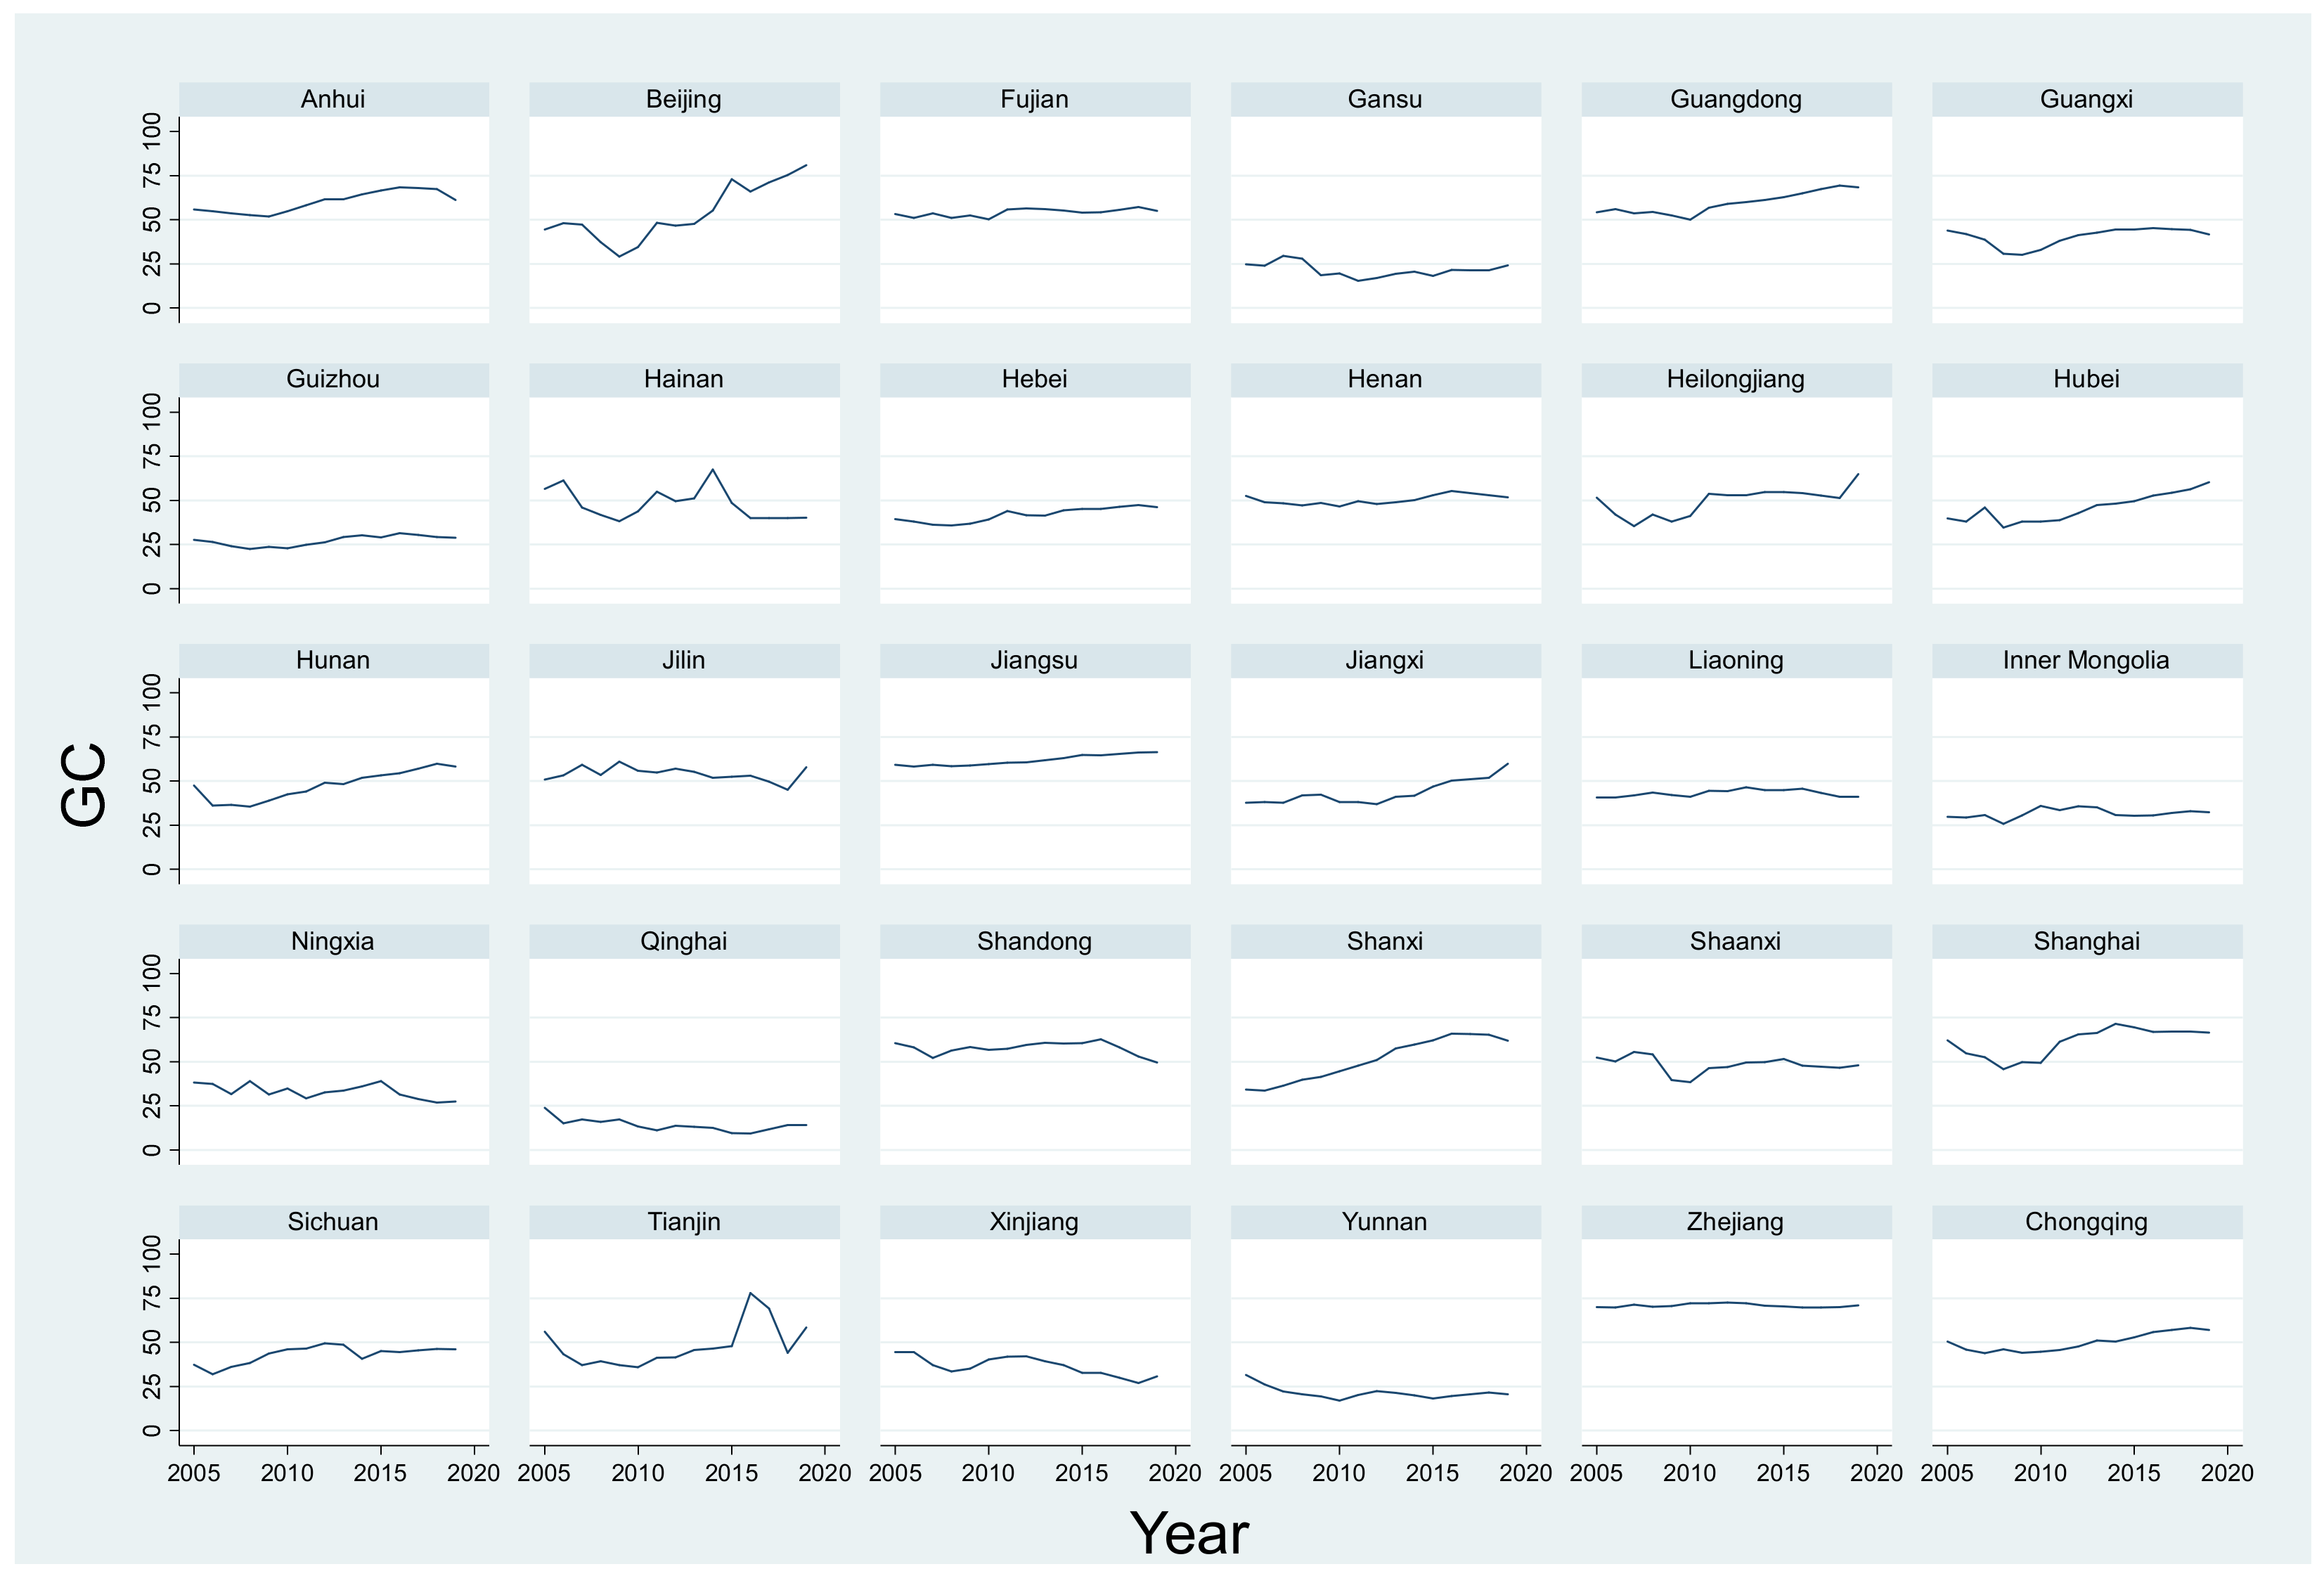
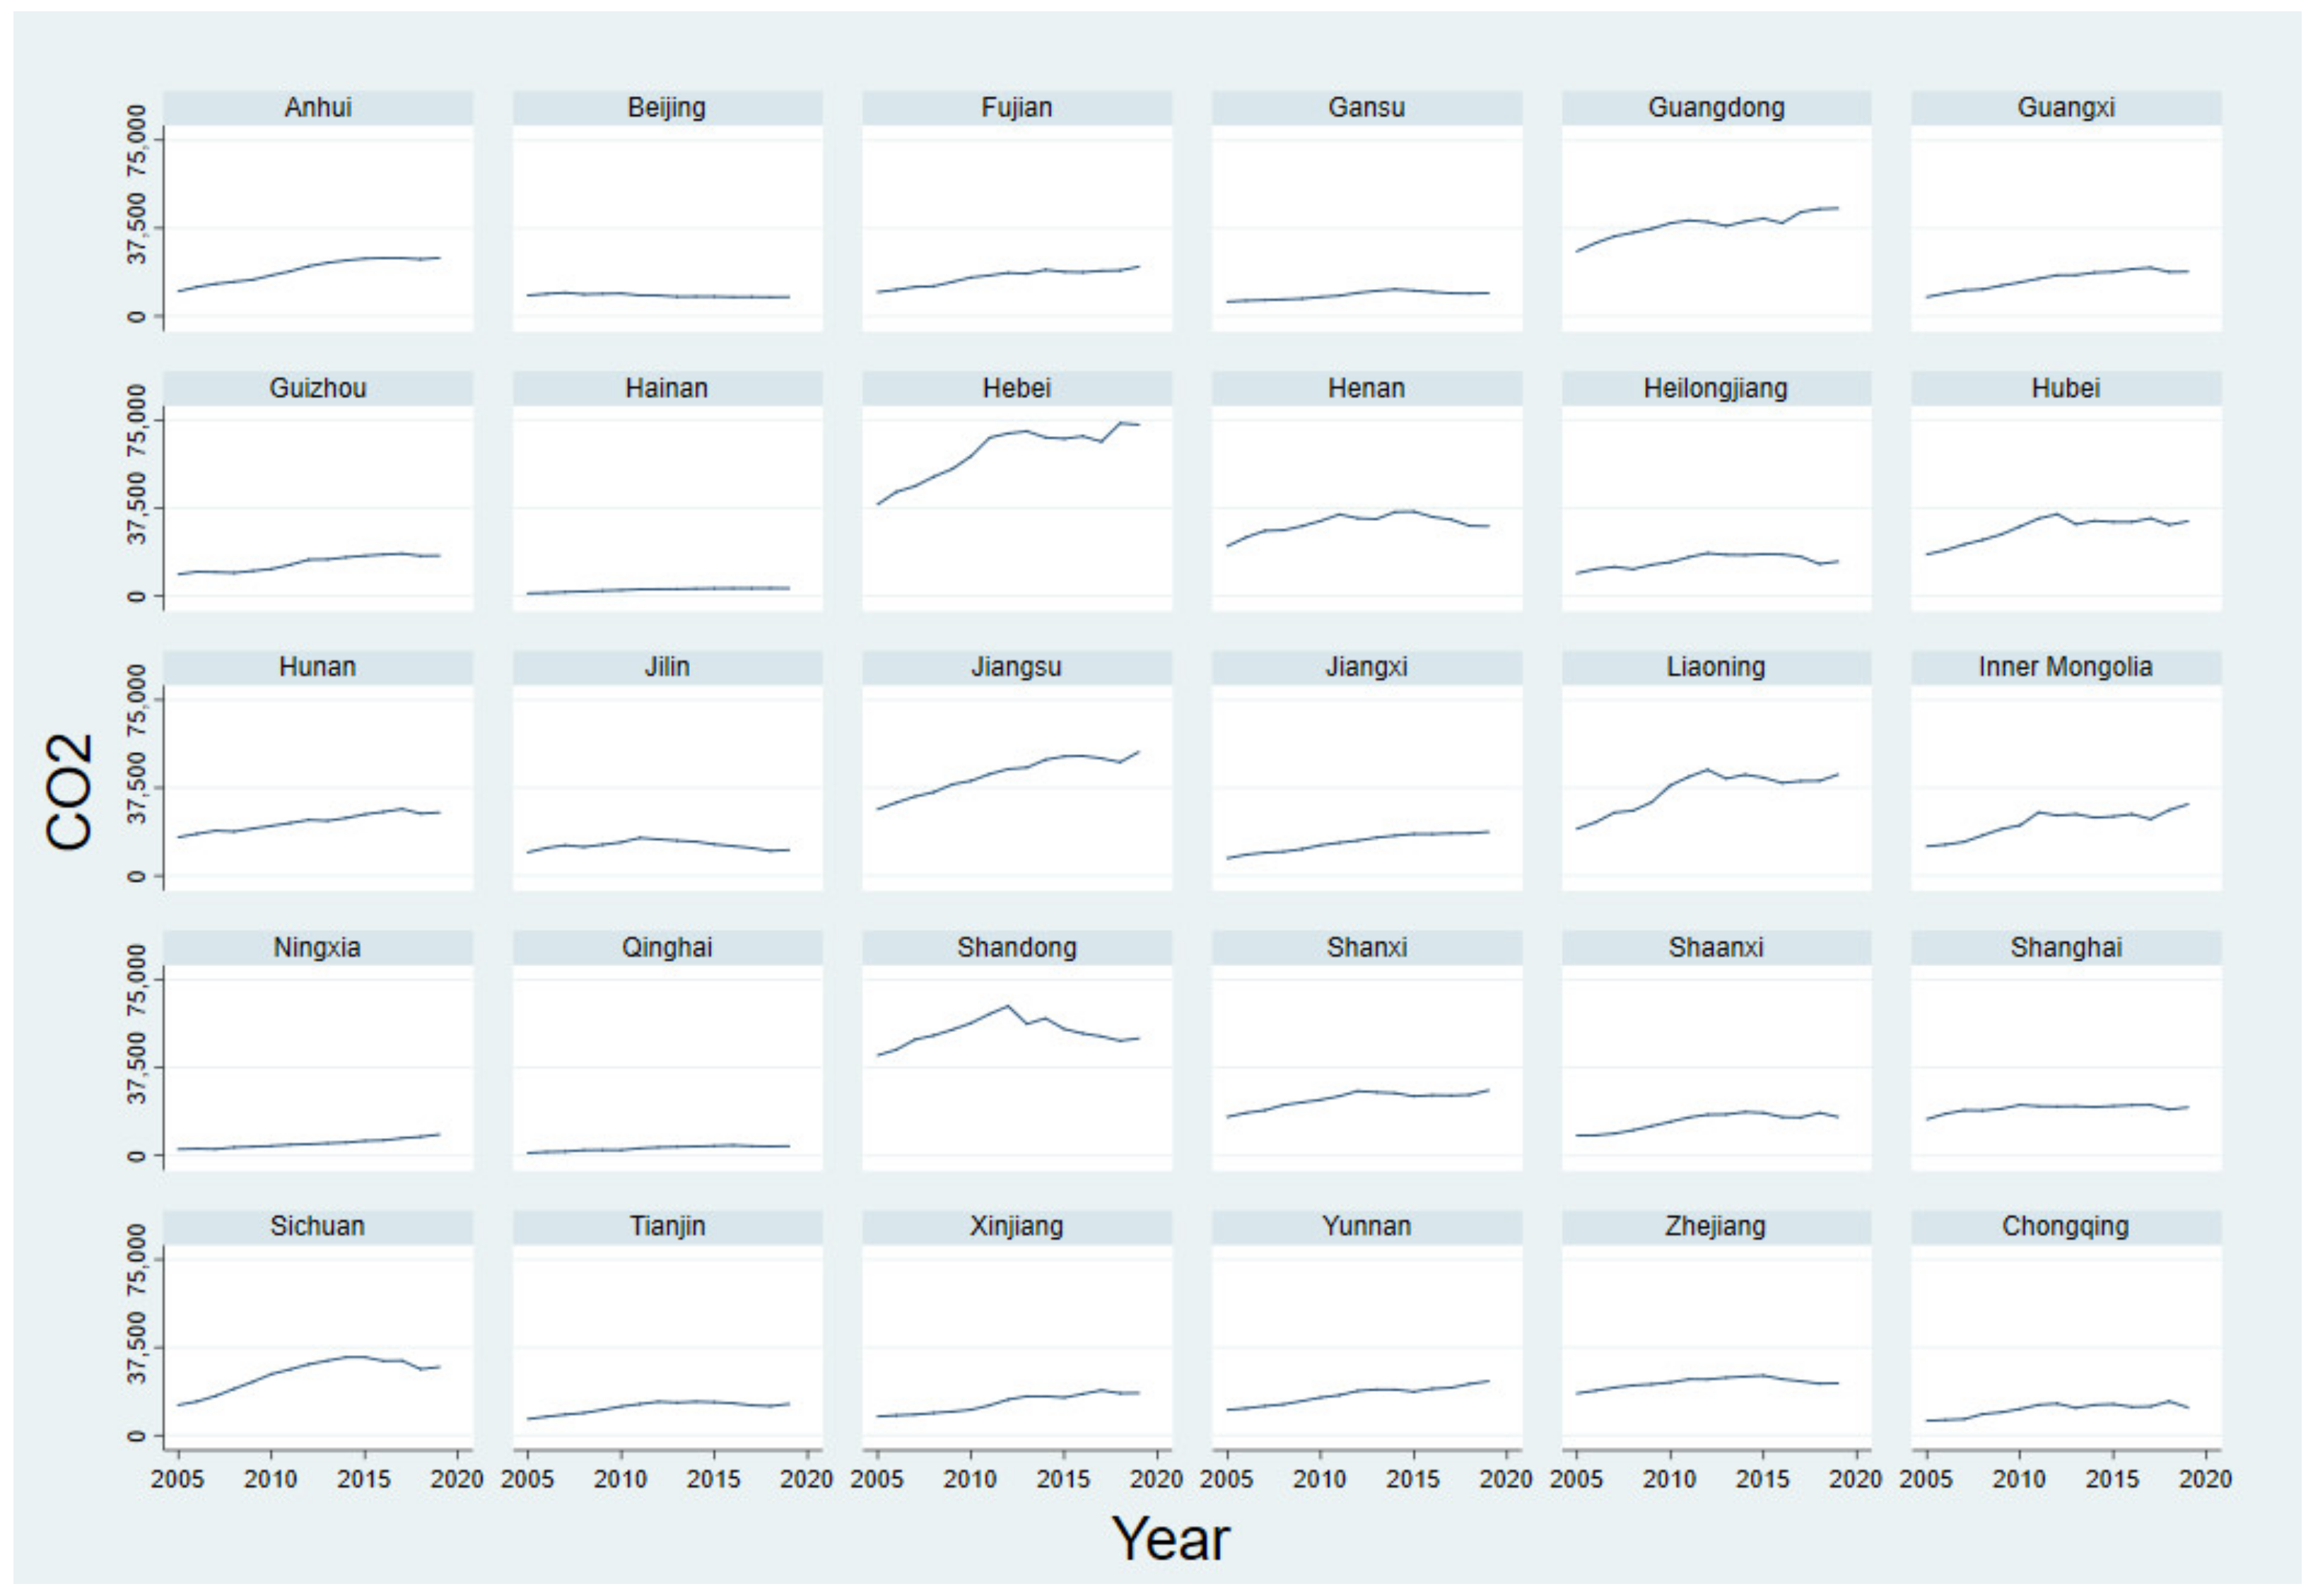
In practice, the People’s Bank of China has established a special statistical system for green loans to standardise the statistical calibre. Still, the statistical data are only at the national level, and there are only seven annual data from 2013 to 2019, with small sample size. In the existing studies, most studies use the ratio of interest expenditure of six high energy-consuming industries5 to the total interest expenditure of industrial industries to measure the green credit situation of each province [51,52]. The data are mainly derived from China Industry Statistical Yearbook and China Economic Census Yearbook. Provincial panel data better expand the sample size of data and reflect provinces’ heterogeneity. Therefore, this paper also refers to this practice. Since the Eleventh Five Year Plan, China has paid more attention to energy conservation and emission reduction and has strengthened the coordination and cooperation between environmental protection and credit management. Therefore, this paper calculates 450 green credit index values in 30 provinces and province-level municipalities (Tibet, Hong Kong, Macao and Taiwan are not included due to lack of data) from 2005 to 2019. The development trend of green credit in each province is shown in Figure 2.
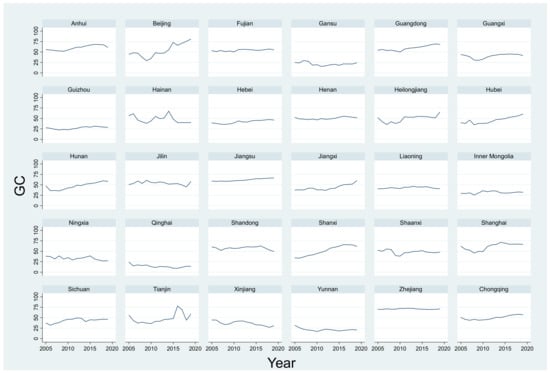
Figure 2.
Development of green credit in each province.
- 2.
- Carbon emission (CO2):
The carbon dioxide emissions of all provinces in China are calculated based on the calculation method provided by IPCC (Intergovernmental Panel on Climate Change). Considering the availability and accuracy of data, the carbon emissions of this study include those generated in energy activities and industrial production. In energy activities, the combustion of fossil fuels is the main source of carbon emissions, while the carbon content of different types of fossil fuels, the calorific value during complete combustion and the carbon emission coefficient corresponding to the combustion technology used are not the same. In this paper, 26 kinds of main fossil energy6 and heat are selected to calculate the carbon emission of energy activities. The specific calculation formula is as follows:
where represents the total carbon emission generated by energy activities in each province; represents energy consumption; is the low calorific value of energy; is the carbon emission coefficient; is the carbon oxidation factor; represents the specific energy type. The specific data and corresponding coefficients come from the 2006 IPCC Guidelines for National Greenhouse Gas Inventories, General Rules for Calculation of the Comprehensive Energy Consumption (GBT 2589-2020), Guidelines for the Preparation of China Provincial Greenhouse Gas inventories (Trial) and China Energy Statistical Yearbook.
In industrial production, the production of building materials, metals and chemical products in China is the main source of carbon emission. Referring to the Fan [53], this study selects the carbon emissions in cement and steel production to measure the carbon dioxide emissions in the process of industrial production. The carbon emission calculation formula of cement production is:
where is the cement production; is the proportion of clinker in cement; is the corresponding carbon emission coefficient. The carbon emission from steel production is divided into three stages: basic oxygen furnace (BOF), electric arc furnace (EAF) and open-hearth furnace (OHF). The specific calculation formula is:
, and represent the amount of crude steel produced in the corresponding stage, and is the corresponding carbon dioxide emission factor. The emissions from energy activities and industrial production are aggregated to obtain the carbon dioxide emissions of each province from 2005 to 2019 (Figure 3).
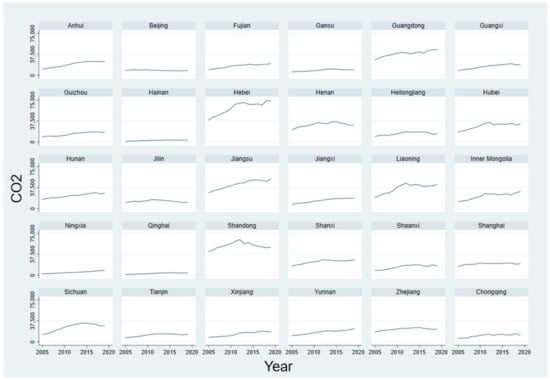
Figure 3.
Trend chart of carbon emission in each province.
4. Results and Discussion
4.1. Analysis of Evaluation Results of Coupling Coordination Model
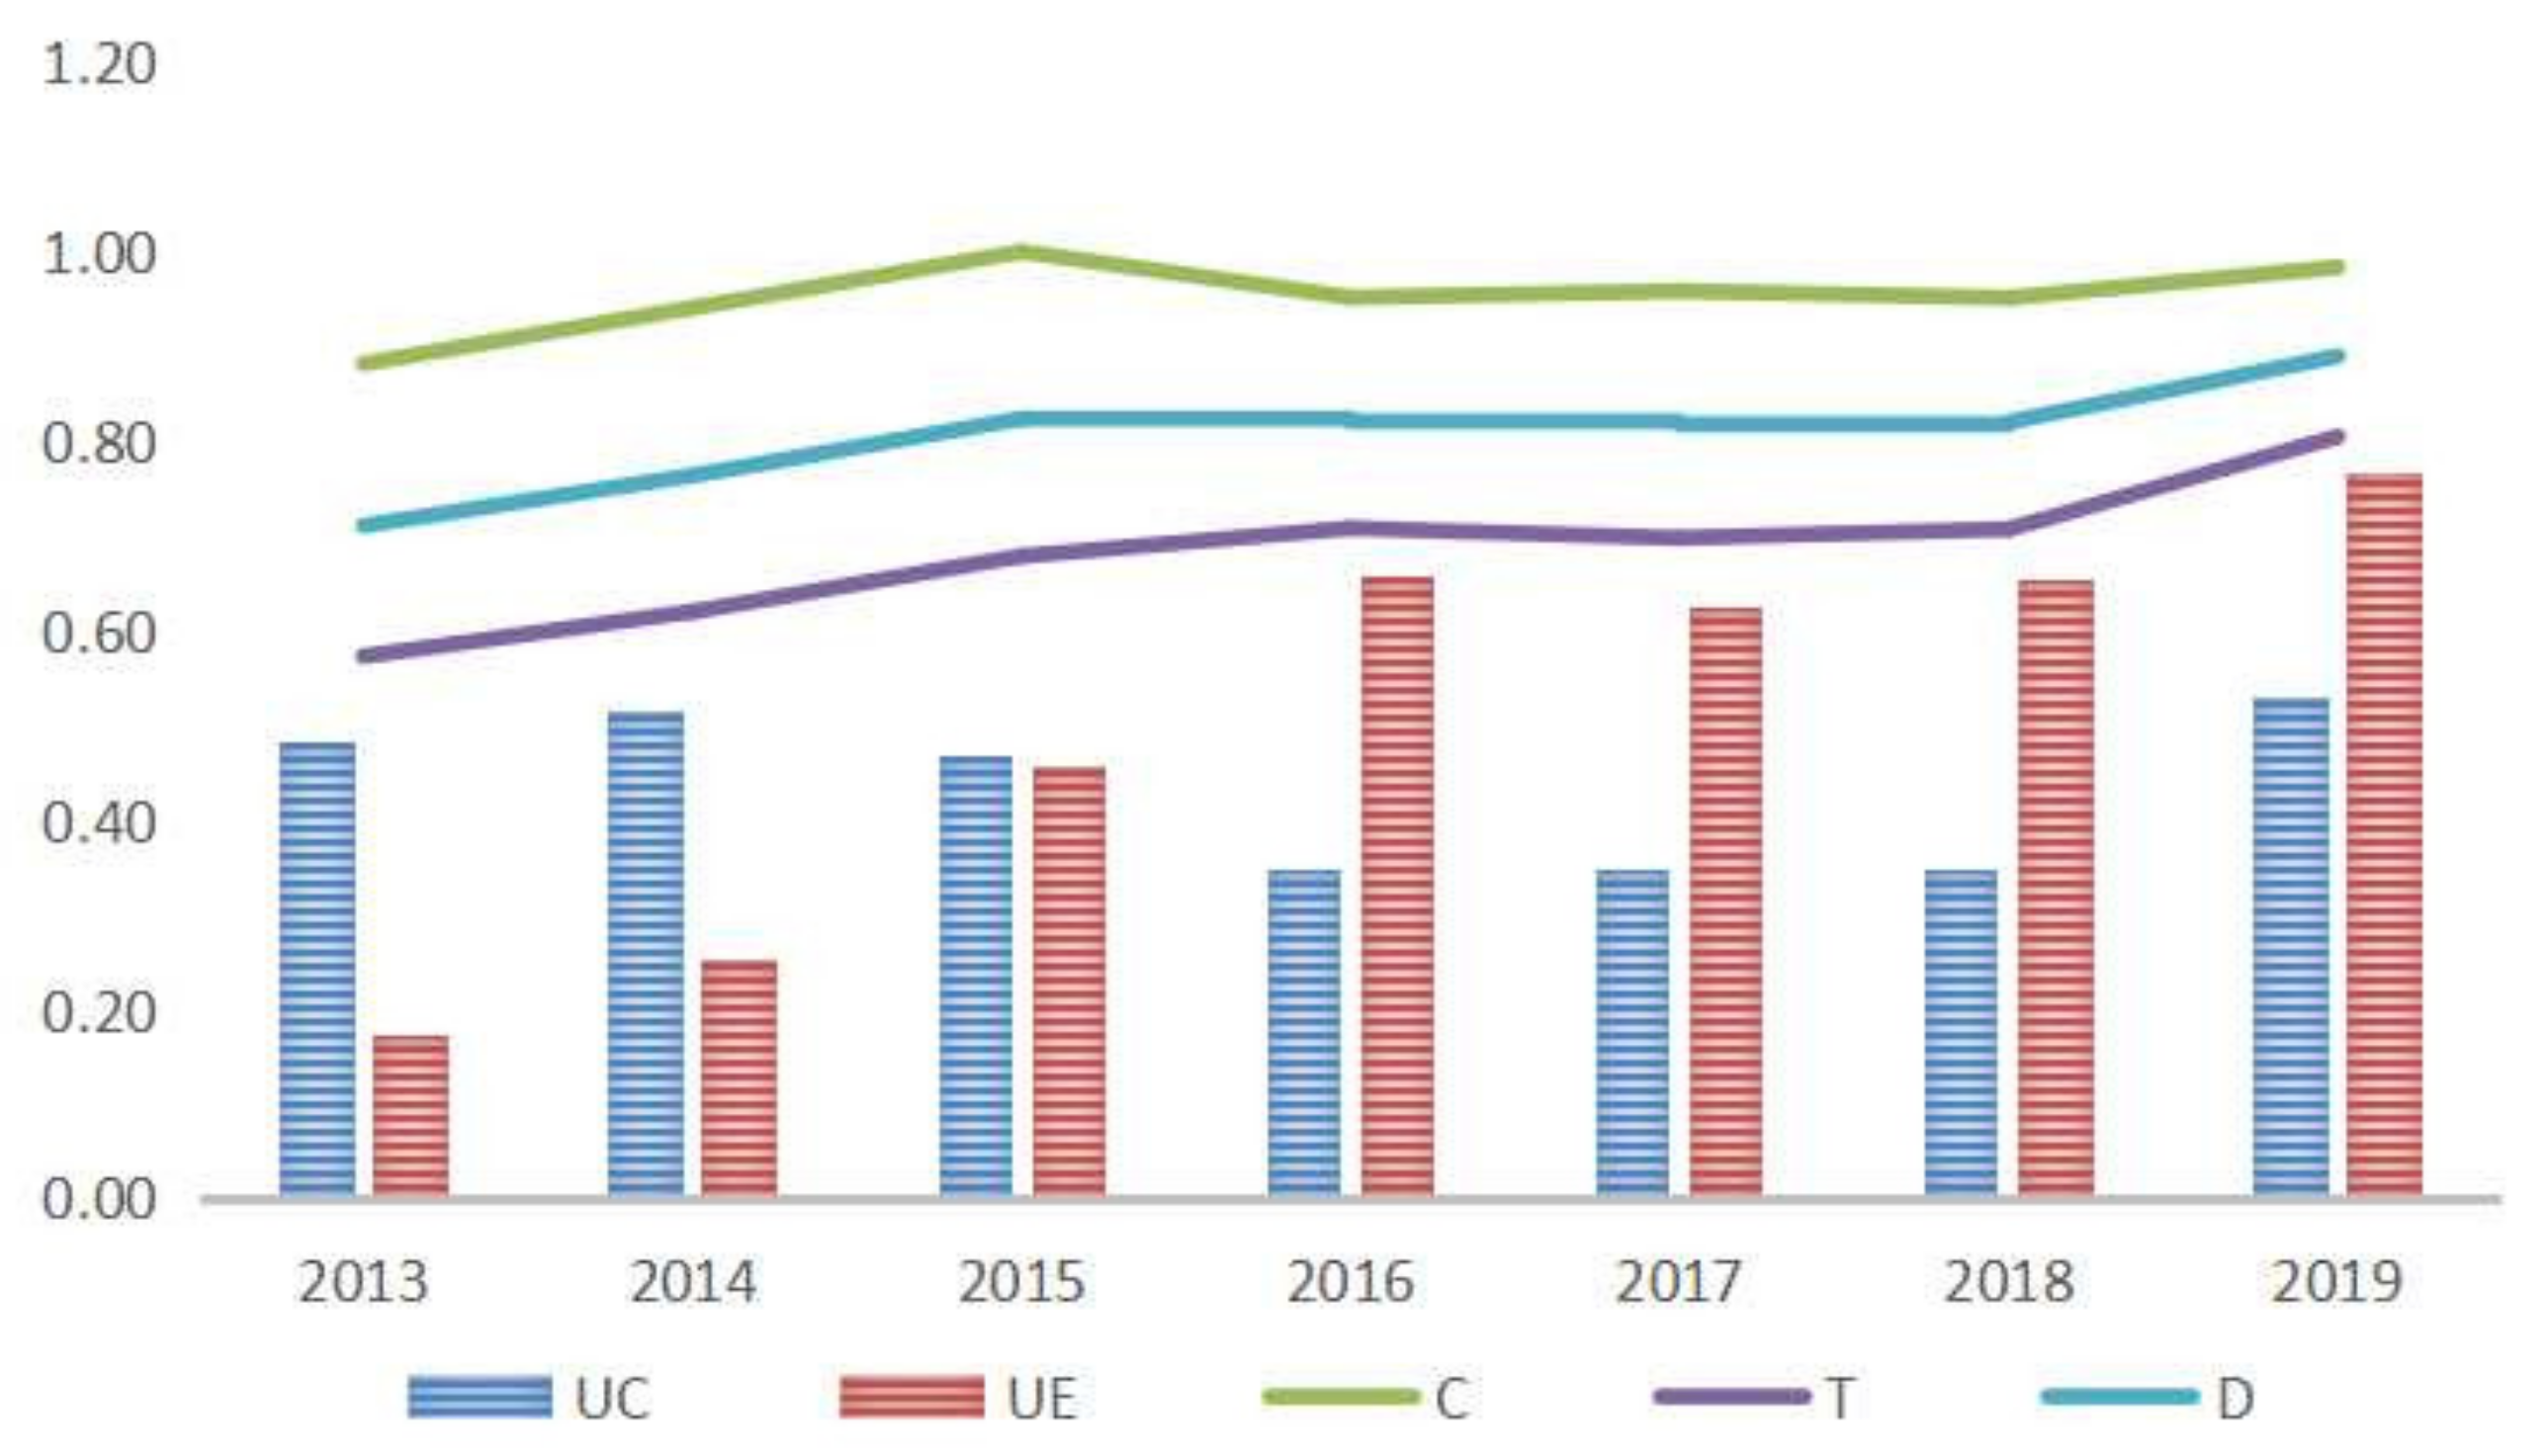
Since 2013, the People’s Bank of China has stipulated the statistical criteria of green credit and made annual disclosure. Therefore, this paper selects the annual sample data from 2013 to 2019 for calculation. The comprehensive evaluation index, coupling degree and coupling coordination degree of the credit environmental systems are shown in Table 3 and Figure 4.
Table 3.
Coupling and coordination of credit system and environmental system.
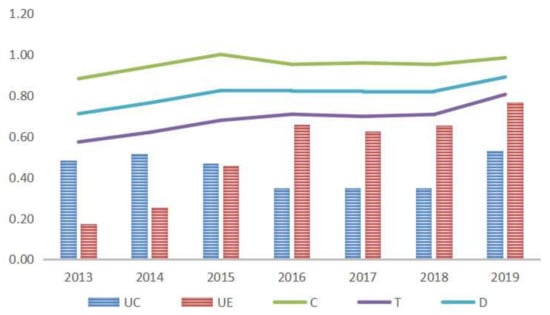
Figure 4.
The Credit–Environmental System coupling and coordination trend in China from 2013 to 2019.
It can be seen that there are fluctuations in the development of the credit system, which experienced a process of first rising, then falling and then rising. The credit system developed strongly in 2013 and 2014, and the index maintained an upward trend. However, the comprehensive credit system evaluation index began to decline, from 0.51 in 2014 to 0.35 in 2016. From 2016 to 2018, the credit composite index remained low, which was mainly caused by the increase in the non-performing loan ratio and asset credit impairment loss and the decrease in non-performing loan provision coverage and asset return. By 2019, the credit system had improved significantly, and the comprehensive evaluation index rebounded and peaked at 0.53.
The environmental system has been developing well, and the comprehensive evaluation index increased steadily from 0.17 to 0.76. This is mainly due to the reduction in per capita water consumption, total chemical oxygen demand emissions, ammonia nitrogen emissions, total sulphur dioxide emissions and total nitrogen oxide emissions, as well as the increase in urban sewage treatment rate, harmless treatment rate of urban domestic waste, greening coverage rate of urban areas, waterlogging removal area and soil erosion control area.
The coupling degree of the two systems also shows a trend of first rising, then falling and then rising, reflecting the annual fluctuation of the interaction between the credit and environmental systems. From 2013 to 2015, the coupling degree continued to rise, reflecting the increasing force between the two systems. However, the interaction between the two systems decreased slightly and did not increase again until 2019. The coupling coordination degree of the two systems shows an upward trend, reflecting the well-coordinated development of the two systems. According to the evaluation criteria for the coupling and coordination of the credit environment system (Table 1), China’s credit environment system is in a good low-level coordination stage.
4.2. Analysis of Dynamic Relationship between Green Credit and Carbon Emissions
In the last part, we analysed the comprehensive coupling and coordinated development of a credit system and an environmental system and provided the overall evaluation. At present, the realisation of the “double carbon” goal is an important work in the environmental system. Green credit in the credit system is also regarded as an important tool to achieve this goal. Focusing on analysing their dynamic internal mechanism is of great significance for policy formulation and implementation. Therefore, we use the PVAR model for research. The analysis steps and results are as follows.
4.2.1. Unit Root Test
Before using the PVAR model, it is necessary to test the unit root of variables to avoid pseudo regression. Considering the existence of common roots and different autoregressive coefficients, LLC, HT, IPS and Fisher methods are used to test the unit roots of CO2 and GC. Since there may be path dependence in the development of carbon emissions and green credit, we consider both time trend terms and individual fixed effects in the test. The test results are shown in Table 4. The two variables have no unit root and are stationary series. PVAR model can be used directly.
Table 4.
Unit root test results.
4.2.2. Granger Test
We can analyse the causal relationship between variables in time through the Granger test and investigate whether the influence between variables is one-way or two-way. It can be seen from Table 5 that carbon emissions and green credit are Granger cause for each other at the significance level of 1%, reflecting the interaction between them. The coupling relationship between them has been verified again from the perspective of panel econometrics.
Table 5.
Granger causality test results.
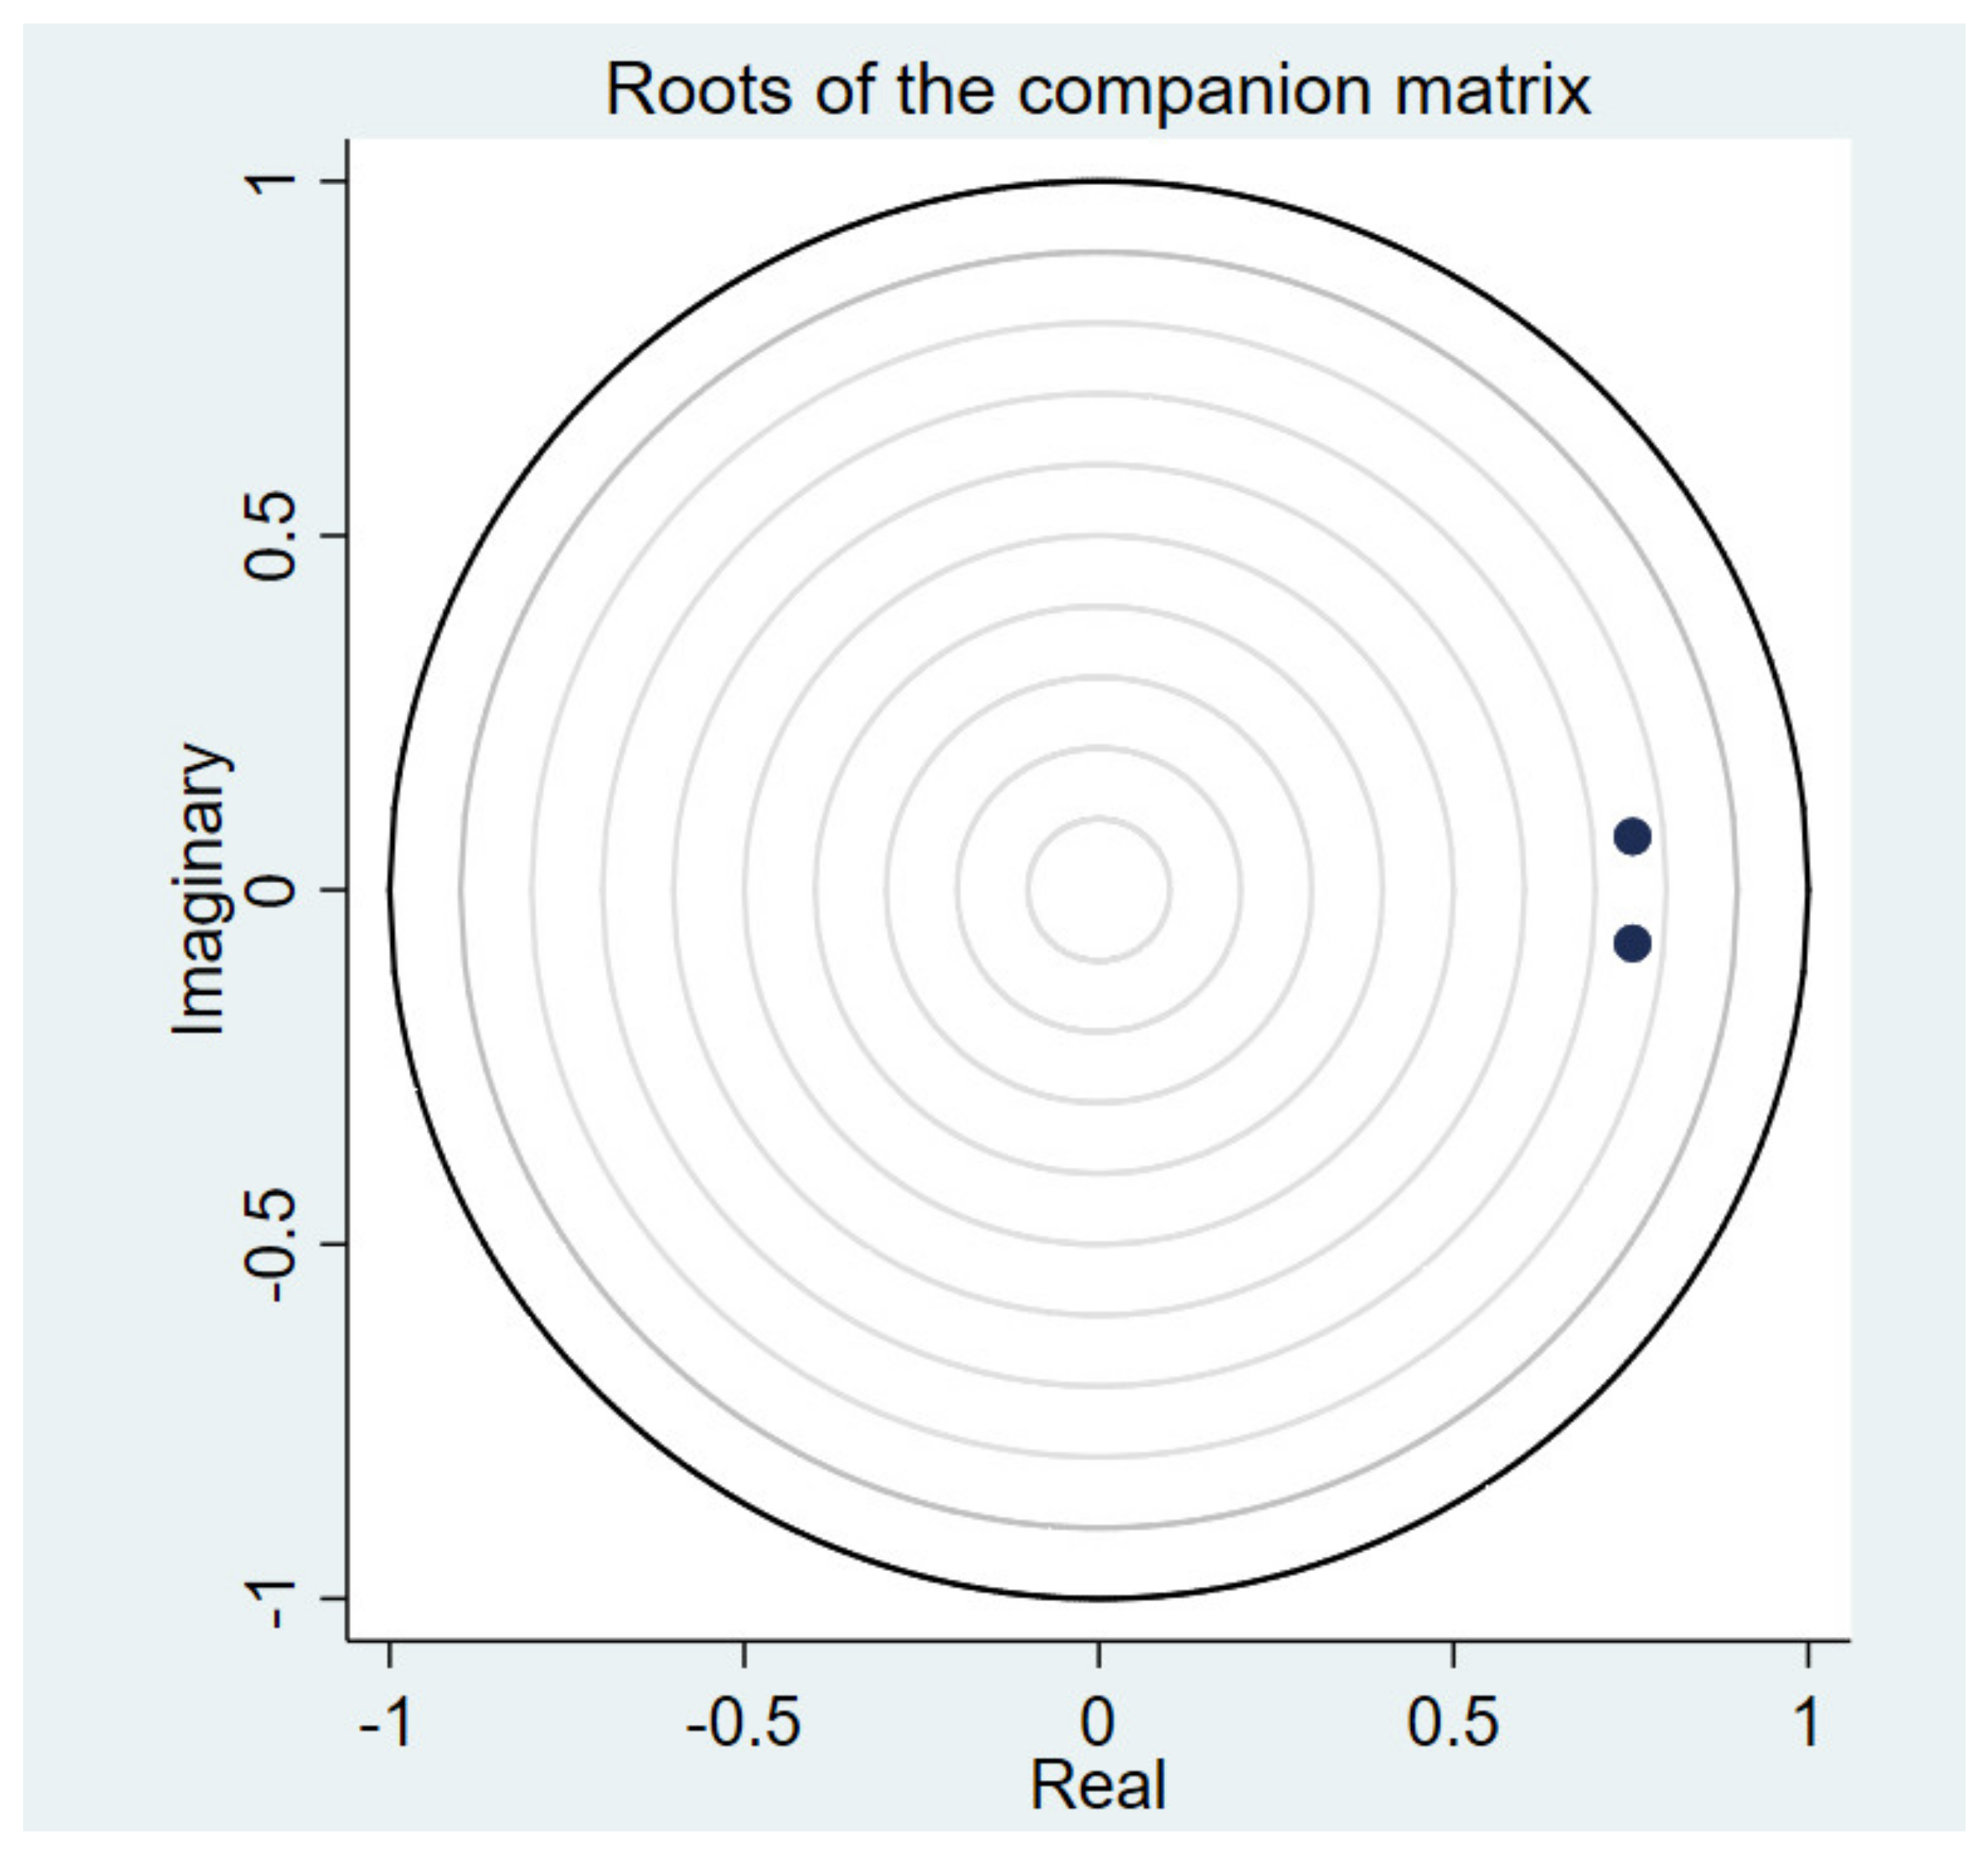
4.2.3. Model Stability Test
We need to conduct impulse response analysis to analyse further the short-term impact of green credit and carbon emissions. However, the stability of the model needs to be tested before impulse response analysis. As shown in Figure 5, all eigenvalues are within the unit circle, indicating that the model is stable and can be used for impulse response analysis.
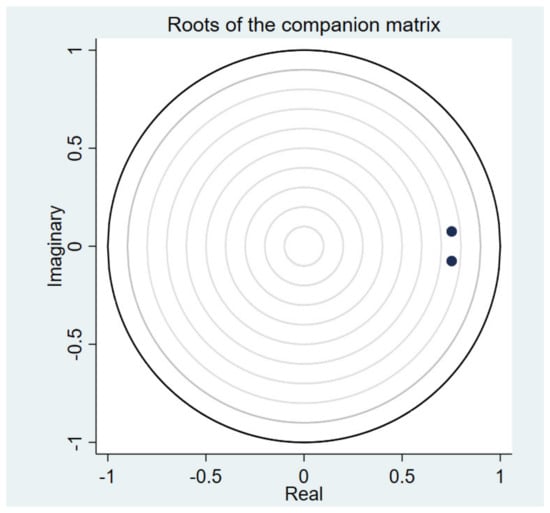
Figure 5.
Model stability test result.
4.2.4. Impulse Response Analysis
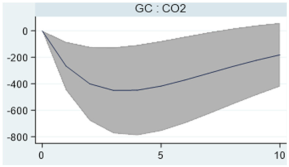
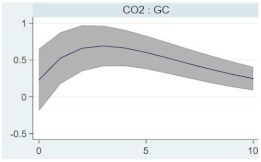
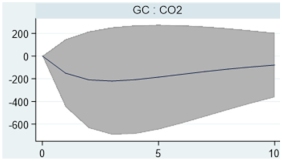
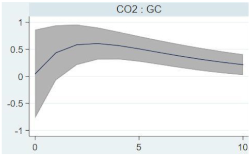
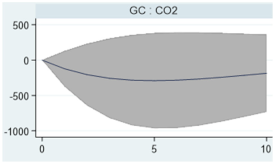
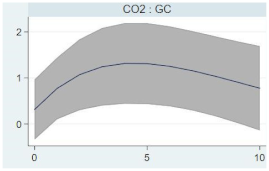
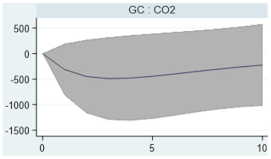
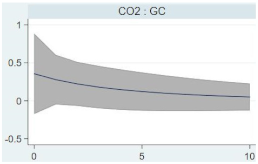
PVAR model contains many parameters, and its economic significance is difficult to explain, so it mainly analyses the impulse response function. The impulse response function can describe the system’s response to the random impact of a variable and its duration. Table 6 shows the impulse response of green credit and carbon emission in the samples of the whole country and the East, Middle and West regions7, respectively, in which the horizontal axis represents the lag order of impact (unit: year) and the vertical axis represents the response value of relevant variables. At the national level, facing the impact of green credit (GC), carbon emissions (CO2) decreased from the first phase, then down to a peak in the third phase, and then decreased steadily year by year. This shows that green credit can inhibit the increase in carbon emissions, but the response has a long time lag. The inhibition first increases and then decreases, and the impact lasts for a long time. This result is consistent with the evaluation result of the coupling coordination model. It can be seen from Figure 4 that the coupling degree between the credit system and the environmental system also reached the highest in the third phase. The test results of the two models verify each other, ensuring the robustness of our conclusion. At the same time, this result is also consistent with practice. The process of green credit policy from capital investment to project completion and realisation of environmental benefits requires a long construction cycle. Relevant research shows that financial institutions should not only tap potential green projects but also pay attention to the post loan management of green credit funds so as to ensure the smooth implementation of the project, effectively control their own risks and realise the expected environmental benefits [54,55,56,57,58,59]. As for the impact of carbon emissions on green credit, green credit gradually increased with the increase in carbon emissions in the first four periods. After phase 4, green credit still increases with the increase in carbon emissions, but the growth rate slows down, reflecting the phased structural characteristics of green credit. As a financial policy, green credit has internal and external time lag from formulation to implementation and then to production. Therefore, the amount of green credit gradually increases in the initial stage of development. However, when the green credit structure reaches a certain degree, the proportion of green credit becomes more and more stable, and the impact of carbon emission on green credit policy is weakened. From the regional level, the impact trend of green credit on carbon emissions in each region is basically consistent with the national sample. The impact effect in the West is the largest, the Middle is the second, and the East is the smallest. The impact of carbon emissions on green credit is similar to the overall national sample in the East and Middle of China but less in the West. Previous studies have also found a two-way causal relationship between financial development and carbon emissions, which is consistent with the conclusions of our empirical research [60,61]. Lei et al. [62] have shown that the positive impact brought by broad money can promote the use of renewable energy and reduce the consumption of non-renewable energy so as to reduce carbon dioxide emissions. Li et al. [63] found that improving financial development indicators is conducive to the realisation of sustainable development. This paper selects green credit, an indicator with environmental effect attributes and financial attributes, to study its relationship with carbon emissions. Our research is more in line with the concept of sustainable development in the transformation of the low-carbon economy.
Table 6.
The impulse–response curve between green credit and carbon emission in the samples of the whole country and the East, Middle and West regions.
4.2.5. Variance Decomposition
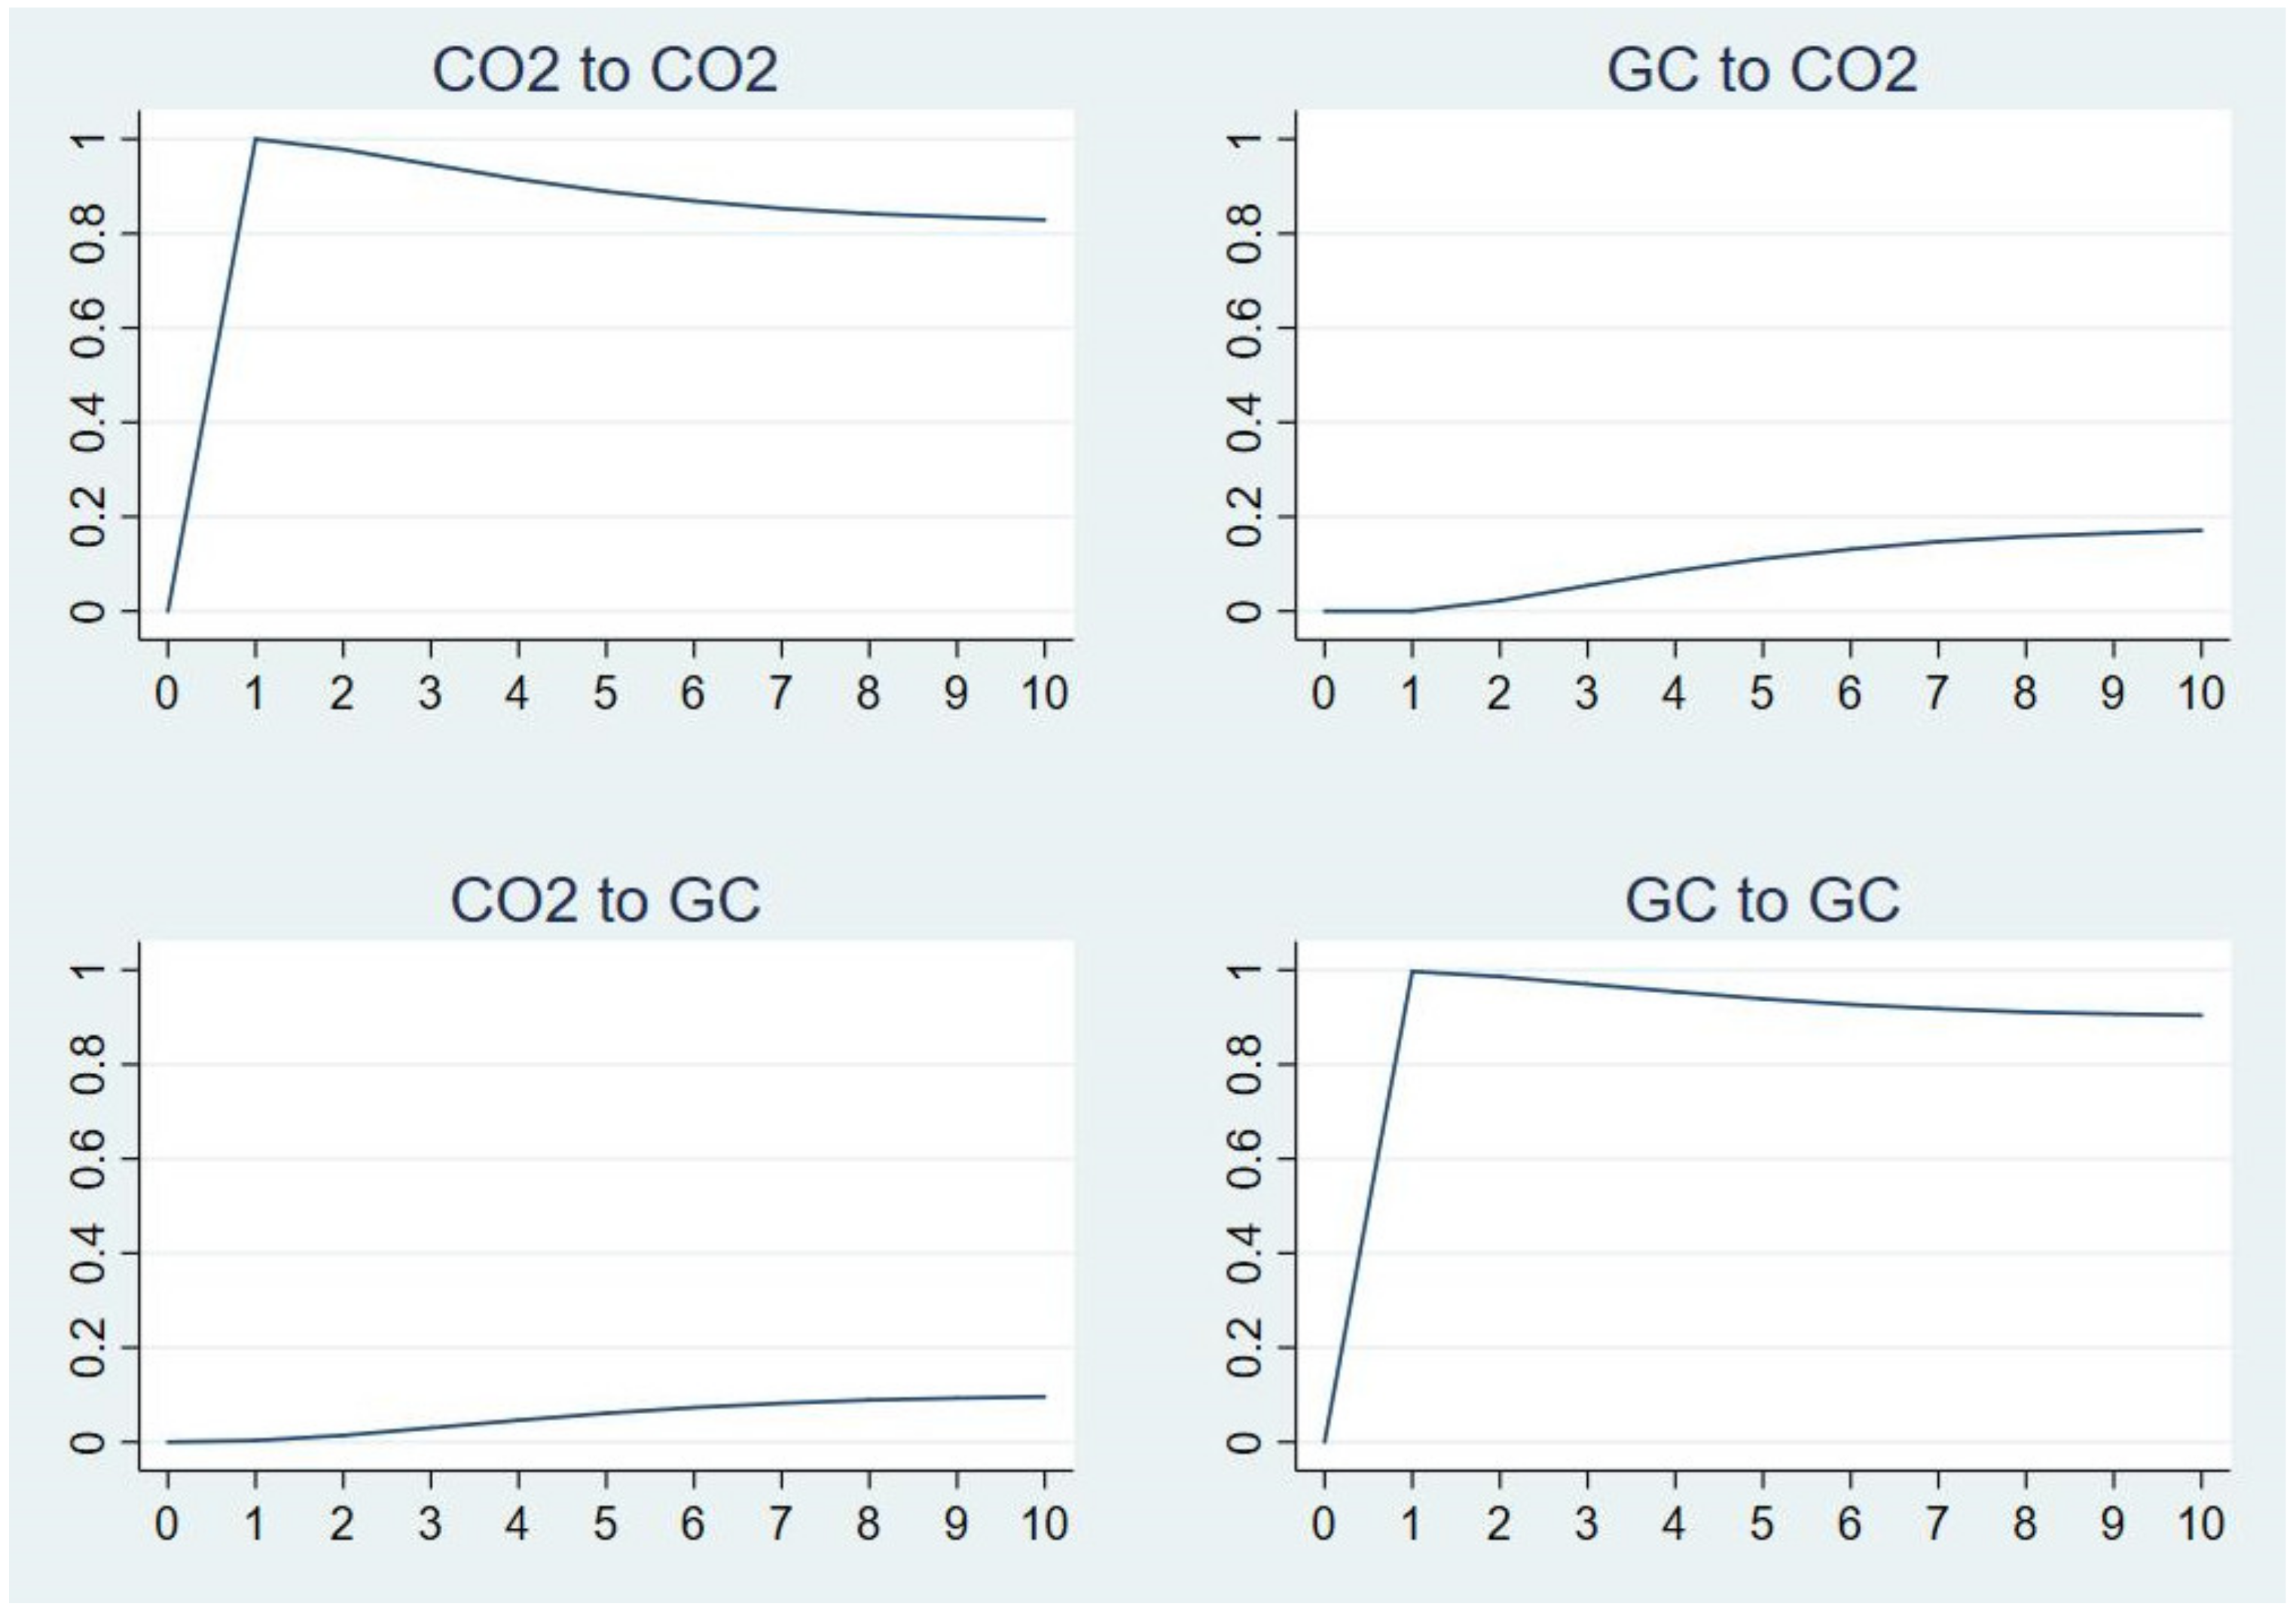
Further, the contribution of each variable impact of the system is analysed based on variance decomposition results. It can be seen from Figure 6 that the fluctuation of green credit and carbon emission mainly comes from their own impact, and their contribution rate to mutual fluctuation increases with time. Among them, the impact of green credit on carbon emission can reach 17%, while the impact of carbon emission on green credit only reaches 9%, which shows that the force of green credit is stronger in the interaction between the two.
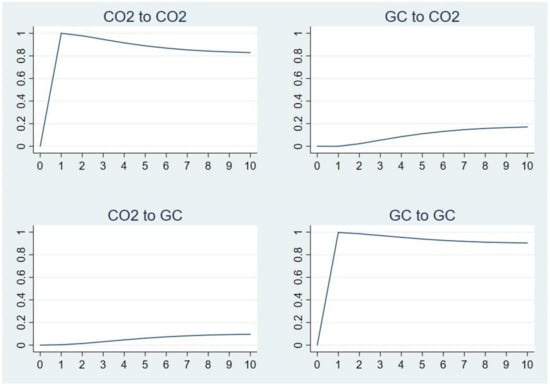
Figure 6.
Variance decomposition of green credit and carbon emission.
4.3. Limitation and Further Research
In this paper, the coupling coordination model is used to evaluate the overall external relationship between credit and environmental systems. Additionally, the PVAR model is used to describe the internal dynamic relationship between green credit and carbon emission. The coupling between financial credit and environmental protection is comprehensively evaluated through two models. However, the above two methods are mainly data-driven and only comprehensively describe the phenomena presented by the complex interaction mechanism. In the future, we hope to further analyse the mechanism of the two based on other econometric models and summarise the key paths and nodes in their interaction so as to better put forward more feasible guidance for China’s credit policy to play a role in environmental protection.
5. Conclusions
China earlier carried out the combination of credit policy and environmental protection, tried to use credit policy tools to protect ecology and pollution prevention, and prevent environmental credit risks. With China entering the transition period of a low-carbon economy and the “double carbon” goal proposal, green finance has also entered an important period of strategic development opportunity. As an important part of China’s green finance, green credit is regarded as an important tool to achieve the “double carbon” goal. It is important to reasonably and effectively evaluate the coordinated development of financial credit and environmental protection and clarify the dynamic relationship between green credit and carbon emission. Therefore, firstly, this paper selects the official green credit data from 2013 to 2019 to evaluate the coupling and coordinated development of credit system and environmental system based on the coupling and coordination model; Secondly, by calculating the provincial carbon emissions and green credit data from 2005 to 2019, the dynamic internal mechanism of them is analysed based on PVAR model. The main results show that: (1) There are annual fluctuations in the interaction between credit system and environmental system, showing a trend of first rising, then falling and then rising. The coupling coordination degree of the two systems shows an upward trend, reflecting the well-coordinated development of the two systems. (2) Green credit can inhibit the increase in carbon emissions, and the inhibition first increases and then decreases, reaching the peak in the third period. From a sub-regional perspective, the inhibitory effect of green credit on carbon emissions is the largest in the West, the second in the Middle and the smallest in the East. (3) Green credit and carbon emission interact, and their contribution rate to mutual fluctuation increases with time. Among them, the impact of green credit shock on carbon emission can reach 17%. In comparison, the impact of carbon emission shock on green credit can only reach 9%, indicating that green credit has a more important impact on carbon dioxide.
The research results of this paper have the following significance and enlightenment for promoting the development of green credit in China. Firstly, it provides an overall evaluation of the development of green credit in China’s banking industry. At present, the green credit evaluation system of the banking industry focuses on the evaluation of quantity and scale but less on the quality of green credit. This paper’s coupling and coordination model intuitively gives the coupling and coordination evaluation of the credit environment system to some extent. It better considers the balance of green credit for banks in undertaking the responsibility of environmental protection and their own sustainable development. It also provides an overall evaluation of quantity and quality for China’s banking industry to carry out green credit. Secondly, through data-driven analysis, this paper studies the dynamic action process of green credit and carbon emission so as to provide reasonable and effective support for green credit as a policy tool to promote the realisation of the “double carbon” goal. Thirdly, from the research results, it can be seen that the inhibitory effect of green credit on carbon emissions has a long time lag, but it also lasts for a long time. Therefore, the green credit policy’s consistency, stability and durability should be maintained. In practice, financial institutions should not only tap potential green projects but also pay attention to the post loan management of green credit funds so as to ensure the smooth implementation of the project and realise the expected environmental benefits. From the regional results, the impact of green credit on regional carbon emissions is heterogeneous. For the western region, the inhibitory effect of green credit on carbon emissions should continue to be played. For the eastern and middle regions, the green credit policy should further reform and innovate, improve quality and efficiency and continue to contribute to the low-carbon transformation of China’s economy and society.
Author Contributions
Conceptualisation, methodology, supervision and funding acquisition, Y.H.; Methodology, investigation, resources, data curation, writing—original draft, writing—review and editing and visualisation, J.Z. All authors have read and agreed to the published version of the manuscript.
Funding
This research was funded by the National Natural Science Foundation of China, grant number 72073124.
Institutional Review Board Statement
Not applicable.
Informed Consent Statement
Not applicable.
Data Availability Statement
The source of relevant data acquisition has been described in the text.
Conflicts of Interest
The authors declare no conflict of interest.
Appendix A
- The Ministry of Ecology and Environment of the People’s Republic of China:
Its predecessor was China State Environmental Protection Administration. On 15 March 2008, the First Session of the Eleventh National People’s Congress adopted the decision on the institutional reform plan of the State Council. The plan includes the establishment of the Ministry of Environmental Protection of the People’s Republic of China. The State Environmental Protection Administration will no longer be retained. In March 2018, the First Session of the 13th National People’s Congress approved the institutional reform plan of the State Council, established the Ministry of Ecology and Environment and no longer retained the Ministry of Environmental Protection.
- 2.
- Green credit performance evaluation of banking deposit financial institutions (2018) issued by the People’s Bank of China:
In this document, the quantitative score accounts for 80%. The quantitative indicators include the proportion of green loan balance, the proportion of green loan increment, the year-on-year growth rate of the green loan balance and the failure rate of the green loan.
- 3.
- The statistical calibre used in constructing the comprehensive index of credit system:
The statistical scope of relevant indicators refers to the 21 major banks in China according to the statistics of the Statistics Bureau of China Banking and Insurance Regulatory Commission, including China Development Bank, Export-Import Bank of China, Agricultural Development Bank of China, Industrial and Commercial Bank of China, Agricultural Bank of China, Bank of China, China Construction Bank, Bank of Communications, China CITIC Bank, China Everbright Bank, Huaxia Bank, China Guangfa Bank, China Merchants Bank, Ping An Bank, Shanghai Pudong Development Bank, Industrial Bank, China Merchants Bank, Evergrowing Bank, China Zheshang Bank, China Bohai Bank and Postal Savings Bank of China.
- 4.
- Seven ministries and commissions that issued the green industry guidance catalogue:
They refer to the People’s Republic of China National Development and Reform Commission, Ministry of Industry and Information Technology, Ministry of Natural Resources, Ministry of Ecology and Environment, Ministry of Housing and Urban-Rural Development, People’s Bank of China and National Energy Administration.
- 5.
- Six high energy-consuming industries:
They refer to petroleum processing, coking and nuclear fuel processing industry, chemical raw materials and chemical products manufacturing industry, non-metallic mineral products industry, ferrous metal smelting and rolling processing industry, non-ferrous metal smelting and rolling processing industry and power and heat production and supply industry.
- 6.
- The 26 kinds of main fossil energy used to measure carbon emissions:
They include raw coal, cleaned coal, other washed coal, briquettes, gangue, coke, coke oven gas, blast furnace gas, converter gas, other gas, other coking products, crude oil, gasoline, kerosene, diesel oil, fuel oil, naphtha, lubricants, petroleum waxes, white spirit, bitumen asphalt, petroleum coke, liquefied petroleum gas, dry refinery gas, natural gas and other petroleum products.
- 7.
- Division standard of Eastern, Middle and Western regions of China:
According to China’s official division standards, the Eastern region includes Beijing, Tianjin, Hebei, Liaoning, Shanghai, Jiangsu, Zhejiang, Fujian, Shandong, Guangdong and Hainan; The Middle region includes Shanxi, Jilin, Heilongjiang, Anhui, Jiangxi, Henan, Hubei and Hunan; The Western region includes Sichuan, Chongqing, Guizhou, Yunnan, Shaanxi, Gansu, Qinghai, Ningxia, Xinjiang, Guangxi, Inner Mongolia and Tibet.
References
- Dziwok, E.; Jaeger, J. A classification of different approaches to green finance and green monetary policy. Sustainability 2021, 13, 11902. [Google Scholar] [CrossRef]
- Research Bureau of the People’s Bank of China. China Green Finance Progress Report (2019); China Financial Publishing House: Beijing, China, 2020; pp. 8–33. [Google Scholar]
- Zhang, B.; Yang, Y.; Bi, J. Tracking the implementation of green credit policy in China: Top-down perspective and bottom-up reform. J. Environ. Manag. 2011, 92, 1321–1327. [Google Scholar] [CrossRef]
- Yan, C.; Li, T.; Lan, W. Financial development, innovation and carbon emissions. J. Financ. Res. 2016, 1, 14–30. (In Chinese) [Google Scholar]
- Khan, M.T.I.; Yaseen, M.R.; Ali, Q. Dynamic relationship between financial development, energy consumption, trade and greenhouse gas: Comparison of upper middle income countries from Asia, Europe, Africa and America. J. Clean. Prod. 2017, 161, 567–580. [Google Scholar] [CrossRef]
- Khan, M.T.I.; Yaseen, M.R.; Ali, Q. The dependency analysis between energy consumption, sanitation, forest area, finan-cial development, and greenhouse gas: A continent-wise comparison of lower middle-income countries. Environ. Sci. Pollut. Res. 2018, 25, 24013–24040. [Google Scholar] [CrossRef] [PubMed]
- Khan, M.T.I.; Yaseen, M.R.; Ali, Q. Nexus between financial development, tourism, renewable energy, and greenhouse gas emission in high-income countries: A continent-wise analysis. Energy Econ. 2019, 83, 293–310. [Google Scholar] [CrossRef]
- Louche, C.; Busch, T.; Crifo, P.; Marcus, A. Financial markets and the transition to a low-carbon economy: Challenging the dominant logics. Organ. Environ. 2019, 32, 3–17. [Google Scholar] [CrossRef]
- Hu, Z.; Li, Y. Dual effects and threshold characteristics of financial development on environmental pollution. China Soft Sci. 2019, 7, 68–80. (In Chinese) [Google Scholar]
- Liu, X.; Sun, T. The dynamic economic growth threshold effect of financial development on of China’s energy consumption. Contemp. Financ. Econ. 2019, 8, 48–57. (In Chinese) [Google Scholar] [CrossRef]
- He, Y.; Xu, T.; Zhong, L. How does financial development affect carbon-dioxide emissions in China. Comp. Econ. Soc. Syst. 2020, 2, 1–10. (In Chinese) [Google Scholar]
- Kim, D.; Wu, Y.; Lin, S. Carbon dioxide emissions and the finance curse. Energ Econ. 2020, 88, 104788. [Google Scholar] [CrossRef]
- Ibrahim, M.; Vo, X.V. Exploring the relationships among innovation, financial sector development and environmental pollution in selected industrialised countries. J. Environ. Manag. 2021, 284, 112057. [Google Scholar] [CrossRef]
- Zhang, W.; Hong, M.; Li, J.; Li, F. An examination of green credit promoting carbon dioxide emissions reduction: A provincial panel analysis of china. Sustainability 2021, 13, 7148. [Google Scholar] [CrossRef]
- Coulson, A.B. Sustainable banking and finance: People—The financial sector and the future of the planet. Futures 2003, 35, 894–895. [Google Scholar] [CrossRef]
- Hu, M.; Li, W. A comparative study on environment credit risk management of commercial banks in the Asia-Pacific region. Bus. Strategy Environ. 2015, 24, 159–174. [Google Scholar] [CrossRef]
- Descheneau, P.; Paterson, M. Between desire and routine: Assembling environment and finance in carbon markets. Antipode 2011, 43, 662–681. [Google Scholar] [CrossRef]
- Mahat, T.J.; Blaha, L.; Uprety, B.; Bittner, M. Climate finance and green growth: Reconsidering climate-related institutions, investments, and priorities in Nepal. Environ. Sci. Eur. 2019, 31, 46. [Google Scholar] [CrossRef]
- Bracking, S. Financialisation, climate finance, and the calculative challenges of managing environmental change. Antipode 2019, 51, 709–729. [Google Scholar] [CrossRef]
- Walter, C. Sustainable financial risk modelling fitting the SDGs: Some reflections. Sustainability 2020, 12, 7789. [Google Scholar] [CrossRef]
- Migliorelli, M. What do we mean by sustainable finance? Assessing existing frameworks and policy risks. Sustainability 2021, 13, 975. [Google Scholar] [CrossRef]
- Nawaz, M.A.; Seshadri, U.; Kumar, P.; Aqdas, R.; Patwary, A.K.; Riaz, M. Nexus between green finance and climate change mitigation in N-11 and BRICS countries: Empirical estimation through difference in differences (DID) approach. Environ. Sci. Pollut. Res. 2021, 28, 6504–6519. [Google Scholar] [CrossRef] [PubMed]
- Ionescu, L. Transitioning to a Low-Carbon Economy: Green Financial Behavior, Climate Change Mitigation, and Environmental Energy Sustainability. Geopolit. Hist. Int. Relat. 2021, 13, 86–96. [Google Scholar] [CrossRef]
- Ionescu, L. Leveraging Green Finance for Low-Carbon Energy, Sustainable Economic Development, and Climate Change Mitigation during the COVID-19 Pandemic. Rev. Contemp. Philos. 2021, 20, 175–186. [Google Scholar] [CrossRef]
- Nedopil, C.; Dordi, T.; Weber, O. The nature of global green finance Standards-Evolution, differences, and three models. Sustainability 2021, 13, 3723. [Google Scholar] [CrossRef]
- Wang, L.; Fu, Q. Green Credit; Liu, S., Ed.; China Environment Publishing Group: Beijing, China, 2016; pp. 2–4. [Google Scholar]
- Zhou, Y.; Liang, S.; Liu, S.; Wang, J. The game study on establishing green supply chain from the perspective of green credit. J. Manag. Sci. China 2017, 20, 87–98. (In Chinese) [Google Scholar]
- Wang, X. Environmental improvement investment and quality of bank assets—An analysis based on green credit. Financ. Forum 2016, 21, 12–19. (In Chinese) [Google Scholar]
- Sun, G.; Wang, Y.; Li, Q. The influence of green credit on credit risk of commercial banks. Financ. Forum 2017, 22, 31–40. (In Chinese) [Google Scholar]
- He, L.; Wu, C.; Zhong, Z.; Zhu, J. Green credit, internal and external policies and the competitiveness of commercial banks: An empirical study of nine listed commercial banks. Financ. Econ. Res. 2018, 33, 91–103. (In Chinese) [Google Scholar]
- Zhang, L.; Lian, Y. Green credit, bank heterogeneity and bank financial performance. Financ. Regul. Res. 2019, 2, 43–61. (In Chinese) [Google Scholar]
- Guo, W.; Liu, Y. Green credit, cost-benefit effect and profitability of commercial banks. South China Financ. 2019, 9, 40–50. (In Chinese) [Google Scholar]
- Su, D.; Lian, L. Does green credit policy affect corporate financing and investment? Evidence from publicly listed firms in pollution-intensive industries. J. Financ. Res. 2018, 12, 123–137. (In Chinese) [Google Scholar]
- Lu, J.; Yan, Y.; Wang, T. The microeconomic effect of green credit policy—From the perspective of technological innovation and resource reallocation. China Ind. Econ. 2021, 1, 174–192. (In Chinese) [Google Scholar]
- He, L.; Liu, R.; Zhong, Z.; Wang, D.; Xia, Y. Can green financial development promote renewable energy investment efficiency? A consideration of bank credit. Renew. Energy 2019, 143, 974–984. [Google Scholar] [CrossRef]
- Hu, Y.; Jiang, H.; Zhong, Z. Impact of green credit on industrial structure in China: Theoretical mechanism and empirical analysis. Environ. Sci. Pollut. Res. 2020, 27, 10506–10519. [Google Scholar] [CrossRef]
- Nie, P.; Chen, Y.; Yang, Y.; Wang, X.H. Subsidies in carbon finance for promoting renewable energy development. J. Clean. Prod. 2016, 139, 677–684. [Google Scholar] [CrossRef]
- Geddes, A.; Schmidt, T.S.; Steffen, B. The multiple roles of state investment banks in low-carbon energy finance: An analysis of Australia, the UK and Germany. Energy Policy 2018, 115, 158–170. [Google Scholar] [CrossRef]
- Li, Z.; Liao, G.; Wang, Z.; Huang, Z. Green loan and subsidy for promoting clean production innovation. J. Clean. Prod. 2018, 187, 421–431. [Google Scholar] [CrossRef]
- Gunningham, N. Financing a low-carbon revolution. B Atom. Sci. 2020, 76, 228–232. [Google Scholar] [CrossRef]
- D’Orazio, P.; Popoyan, L. Fostering green investments and tackling climate-related financial risks: Which role for macroprudential policies? Ecol. Econ. 2019, 160, 25–37. [Google Scholar] [CrossRef] [Green Version]
- Semieniuk, G.; Campiglio, E.; Mercure, J.; Volz, U.; Edwards, N.R. Low-carbon transition risks for finance. Wiley Interdiscip. Rev. Clim. Chang. 2021, 12, e6781. [Google Scholar] [CrossRef]
- Guan, F.; Liu, C.; Xie, F.; Chen, H. Evaluation of the competitiveness of china’s commercial banks based on the G-CAMELS evaluation system. Sustainability 2019, 11, 1791. [Google Scholar] [CrossRef] [Green Version]
- Wang, Q.; Li, S.; Li, R. Evaluating water resource sustainability in Beijing, China: Combining PSR model and matter-element extension method. J. Clean. Prod. 2019, 206, 171–179. [Google Scholar] [CrossRef]
- Liao, K.; Yue, M.; Sun, S.; Xue, H.; Liu, W.; Tsai, S.; Wang, J. An evaluation of coupling coordination between tourism and finance. Sustainability 2018, 10, 2320. [Google Scholar] [CrossRef] [Green Version]
- Wang, S.; Kong, W.; Ren, L.; Zhi, D.; Dai, B. Research on misuses and modification of coupling coordination degree model in China. J. Nat. Resour. 2021, 36, 793–810. (In Chinese) [Google Scholar] [CrossRef]
- Li, Y.; Li, Y.; Zhou, Y.; Shi, Y.; Zhu, X. Investigation of a coupling model of coordination between urbanisation and the environment. J. Environ. Manag. 2012, 98, 127–133. [Google Scholar] [CrossRef] [PubMed]
- Holtz-Eakin, D.; Newey, W.; Rosen, H.S. Estimating vector autoregressions with panel data. Econometrica 1988, 56, 1371–1395. [Google Scholar] [CrossRef]
- Love, I.; Zicchino, L. Financial development and dynamic investment behavior: Evidence from panel var. Q. Rev. Econ. Financ. 2006, 46, 190–210. [Google Scholar] [CrossRef]
- Abrigo, M.R.M.; Love, I. Estimation of panel vector autoregression in Stata. Stata J. 2016, 16, 778–804. [Google Scholar] [CrossRef] [Green Version]
- Xie, T.; Liu, J. How does green credit affect China’s green economic growth? China Popul. Resour. Environ. 2019, 29, 83–90. (In Chinese) [Google Scholar]
- Song, M.; Xie, Q.; Shen, Z. Impact of green credit on high-efficiency utilisation of energy in China considering environ-mental constraints. Energy Policy 2021, 153, 112267. [Google Scholar] [CrossRef]
- Fan, X. Calculation of Carbon Emissions and Research on Reduction Path in China; Liaoning University: Shenyang, China, 2013. (In Chinese) [Google Scholar]
- Brown, G.A.; Murray, G.S.C. Commitment, compliance and capacity—How environmental, safety, security and social financial issues affect lenders’ risk. In Proceedings of the 1st AusIMM Project Evaluation Conference, Melbourne, Australia, 19–20 June 2007. [Google Scholar]
- Xie, W.; Tian, G. Construction and evaluation of post-evaluation index system on loan projects of international financial organisations. In Proceedings of the IEEE 16th International Conference on Industrial Engineering and Engineering Management, Beijing, China, 21–23 October 2009. [Google Scholar] [CrossRef]
- Zhang, W.; Zhang, S.; Zhou, L. The discussion about development of emission rights pledged loan business. In Proceedings of the 2010 International Conference on Regional Management Science and Engineering, Jinan, China, 16–17 September 2010. [Google Scholar]
- Lennette, E.T.; Villa, L.V.; Chaves, R.V.; Villalobos, M.E.; Viquez, A.U. Forest conservation and restoration using eco-loan financing (ELF) in Costa Rica: Report on a working model. Conserv. Lett. 2011, 4, 402–407. [Google Scholar] [CrossRef]
- Du, X.; Fu, X.; Zhang, L. Establishment of index system of commercial banks’ Post-Evaluation of loan project based on the AHP. In Proceedings of the 3rd International Conference on Applied Social Science Research (ICASSR), Beijing, China, 22–23 May 2015. [Google Scholar]
- Giraudet, L.; Petronevich, A.; Faucheux, L. Differentiated green loans. Energy Policy 2021, 149, 111861. [Google Scholar] [CrossRef]
- Aslam, B.; Hu, J.; Hafeez, M.; Ma, D.; Algarni, T.S.; Saeed, M.; Abdullah, M.A.; Hussain, S. Applying environmental Kuznets curve framework to assess the nexus of industry, globalisation, and CO2 emission. Environ. Technol. Innov. 2021, 21, 101377. [Google Scholar] [CrossRef]
- Hafeez, M.; Yuan, C.; Yuan, Q.; Zhuo, Z.; Stromaier, D.; Musaad, A.S.O. A global prospective of environmental degradations: Economy and finance. Environ. Sci. Pollut. Res. 2019, 26, 25898–25915. [Google Scholar] [CrossRef] [PubMed]
- Lei, W.; Ozturk, I.; Muhammad, H.; Ullah, S. On the asymmetric effects of financial deepening on renewable and non-renewable energy consumption: Insights from China. Econ. Res.-Ekon Istraz. 2021, 1–18. [Google Scholar] [CrossRef]
- Li, X.; Yu, Z.; Salman, A.; Ali, Q.; Hafeez, M.; Aslam, M.S. The role of financial development indicators in sustainable development-environmental degradation nexus. Environ. Sci. Pollut. Res. 2021, 28, 33707–33718. [Google Scholar] [CrossRef]

Publisher’s Note: MDPI stays neutral with regard to jurisdictional claims in published maps and institutional affiliations. |
© 2021 by the authors. Licensee MDPI, Basel, Switzerland. This article is an open access article distributed under the terms and conditions of the Creative Commons Attribution (CC BY) license (https://creativecommons.org/licenses/by/4.0/).