Article

Assessment of Online Deliberative Quality: New Indicators Using Network Analysis and Time-Series Analysis

1
Faculty of Social Sciences, University of Helsinki, 00014 Helsinki, Finland
2
Consumer Society Research Centre, Faculty of Social Sciences & Helsinki Institute for Sustainability Science, University of Helsinki, 00014 Helsinki, Finland
*
Author to whom correspondence should be addressed.
Sustainability 2021, 13(3), 1187; https://doi.org/10.3390/su13031187
Submission received: 23 December 2020 / Revised: 14 January 2021 / Accepted: 20 January 2021 / Published: 23 January 2021

Abstract

:
Online deliberation research has recently developed automated indicators to assess the deliberative quality of much user-generated online data. While most previous studies have developed indicators based on content analysis and network analysis, time-series data and associated methods have been studied less thoroughly. This article contributes to the literature by proposing indicators based on a combination of network analysis and time-series analysis, arguing that it will help monitor how online deliberation evolves. Based on Habermasian deliberative criteria, we develop six throughput indicators and demonstrate their applications in the OmaStadi participatory budgeting project in Helsinki, Finland. The study results show that these indicators consist of intuitive figures and visualizations that will facilitate collective intelligence on ongoing processes and ways to solve problems promptly.

1. Introduction

This article proposes deliberative quality indicators that will help to monitor online governance processes. It is widely acknowledged that governments can no longer address social problems alone, and that there is an increasing need for collaboration with the market and civil society in making collective decisions and sharing responsibility [1,2,3,4,5,6]. Governance has become a popular term, referring to the emerging forms of the governing system, and featuring “interactive processes through which society and the economy are steered towards collectively negotiated objectives” [7] (p. 4). The notion of governance entails a change from top-down to bottom-up policy-making that promotes public participation to address social issues and social sustainability together [8,9,10]. Despite the positive connotation, however, governance brings new challenges [11,12,13,14]. Unlike governments under a bureaucratic hierarchy and markets coordinated with contracts, governance is based on networks of actors with fragmented interests, resources, and jurisdictions [15]. Moreover, citizens have more opportunities to directly engage in multi-channel and multi-voice processes as partners rather than customers [1,16]. In these cross-boundary settings, deliberation is an indispensable way to build consensus and foster voluntary collaboration among actors, but is prone to ineffective outcomes in the absence of appropriate arrangements [1,7,17,18,19,20].
In this regard, deliberation is a key element of governance, and assessing its quality is crucial to the development of better governance practices. As a social system, governance faces both internal and external impulses under changing environments. ‘Resilience’ refers to the collective capacity to cope with these shocks and quickly bounce back to its core functions after encountering disturbances [14,21,22,23]. Face-to-face meetings and public relation activities provide some assistance, but they are limited for this purpose. Scholars have recently focused on digital technology and online deliberation as complementary governance tools [24,25,26,27,28]. Online communications have the undoubted merits of overcoming physical limitations in sharing human experiences through texts and images that contribute to the co-creation of meaning [29]. Therefore, we agree with the potential benefits of e-deliberation but urge the adoption of a framework and tools for its democratic assessment [30]. Specifically, governments today invest heavily in digital platforms for policy-making and public services that hold a large amount of data generated through their operations. These data, often called ‘big data’ for their volume, variety, and velocity, are crucial sources for the analysis of governance activities (e.g., deliberation, dissemination, and voting) [31,32].
Among the three dimensions of deliberation analysis [27,33,34]—(institutional) input, (communicative) throughput, and (socio-political) output—this article focuses on developing throughput indicators. Existing studies have proposed a wide range of normative criteria, such as respect and accessibility, to assess how public deliberation should be conducted [27]. Based on a set of theory-based criteria, most deliberative quality indicators require trained coders to read and assess the quality of the contents of the deliberation [35,36,37,38,39,40,41]. This method is useful for detailed assessment, but it requires significant resources in terms of coders and time [42,43]. In particular, online deliberation often generates thousands and perhaps millions of user-generated discussion data, making human coding schemes difficult. We argue that the online deliberative quality could be measured using automated computational methods to provide criteria-based quality information that helps stakeholders and managers of deliberative processes to identify ongoing problems and fix them during the process. More recently, there has been a growing attempt to overcome the limitations of hand-coded measurements by employing automated content analysis and network analysis [42]. These methods are mainly based on digitized text data (e.g., discussion comments) and network data (e.g., discussion threads) [44,45,46,47,48]. Although these methods help assess the contents and patterns of interactions in online deliberation, they have limited capacity for handling time-series data (e.g., timestamp of posts), which provide empirical evidence of how online deliberation evolves.
Against this backdrop, this article proposes new throughput indicators for assessing online deliberative quality using social network analysis and time-series analysis. Online deliberation processes shape an evolving network of interpersonal communications, in which a combination of network and time-series analyses will help assess the dynamic process. Network data and time-series data are common data types on many digital platforms (e.g., Facebook, Twitter, and online forums) and entail a potentially zero cost to collect that can be analyzed and shared promptly with stakeholders. We consider that online throughput deliberative quality indicators should be (1) theoretically grounded (Habermasian communicative action model), (2) measured with established methods (social network analysis and time-series analysis), and (3) open to intuitive interpretation to promote collective intelligence of ongoing processes and shared responsibilities. With this in mind, this article develops deliberative quality indicators and demonstrates their applications with three research questions:
  • How can the quality of online deliberation be monitored on government-run platforms?
  • What new indicators can support such monitoring by applying network analysis and time-series analysis?
  • How can the new monitoring indicators help to develop more resilient governance practices?
This article is organized as follows. The second section reviews theoretical discussions of deliberation and existing automated indicators, followed by proposing new indicators. The third section introduces an empirical case of the OmaStadi project in Helsinki, Finland. The fourth and fifth sections then set formal definitions of the proposed indicators and report empirical results. In the final section, we discuss the findings, limitations, and implications for future study.

2. Theoretical Background of Deliberative Quality Indicators

2.1. Concept of Online Deliberation and Past Measurement Efforts

Online deliberation research is an emerging strand of deliberation literature that focuses on three aspects of internet-enabled deliberation [27,33,34]: input, throughput, and output. An input aspect sheds light on the preconditions of deliberation. Institutional arrangements (e.g., participatory budgeting), platforms (e.g., government-run platform), and socio-political elements (e.g., internet access rate and social strata) are examples of such. A second aspect is related to outcomes resulting from online deliberation—be they internal (e.g., knowledge gains and digital citizenship) or external effects (e.g., policy changes and side effects). A third aspect concerns processes through which multiple stakeholders participate and build consensus democratically. This article aims to contribute to the third aspect, the process of online deliberation, by proposing automated quality indicators using a social network and time-series analysis.
This section reviews current automated computational methods for assessing online deliberative quality. Theories of deliberation and deliberative democracy have long been influenced by Habermas’s notion of communicative rationality and the public sphere [49,50,51,52]. The central presumption is that social problems are increasingly “wicked,” that is, subjective and contextual; thus, instrumental rationality, which uses impersonal tools designed to attain measurable objectives, no longer captures the essence of social problems [53]. Since there is no single optimal solution to the problems faced by multiple stakeholders, they need to engage in communicative processes through which problems will be identified, viewpoints exchanged, and collective action promoted [54,55,56]. Therefore, social problems need to be solved through inter-subjective communication rather than objective calculation.
Nevertheless, deliberation literature has suffered from a lack of standard definition of deliberation [33,57,58], leading to fragmented quality indicators [28,41,59,60,61,62]. For instance, Dahlberg [62] suggested six criteria: reasoned critique, reflexivity, ideal role-taking, sincerity, inclusion and discursive equality, and autonomy from state and economic power. Fishkin [60] proposed five criteria: information, substantive balance, diversity, conscientiousness, and equal consideration, based on three democratic values: deliberation, equality, and participation. Gastil and Black [61] developed the following criteria: create an information base, prioritize key values, identify solutions, weigh solutions, make the best decision, speaking opportunities, mutual comprehension, consideration, and respect. Steenbergen et al. [41] suggested the criteria: open participation, level of justification, content of justification, respect, and constructive politics. Although many listed indicators share similar traits, this fragmented landscape demonstrates less standardized deliberative quality indicators even within the same theoretical root [28].
Traditionally, empirical studies select some of the theory-based criteria using coding schemes and then hire trained coders to assess deliberative quality [35,36,37,38,39,40,41,58,63,64]. For instance, Esau et al. [35] developed eight quality measures, and five coders assessed the quality of textual contents by reading a sample of user comments on several online platforms. This method is considered a “gold standard,” since human experts can extract sophisticated meanings from text [43]. However, Beauchamp [42] has pointed out that it requires intensive work and there may be biases as to what count as deliberative criteria. We agree in part, because there are well-established measures (e.g., Krippendorff’s alpha) in content analysis to handle inter-coder reliability. Nevertheless, manual coding can still be problematic when there is significant disagreement among coders or a large amount of online discussion data, which is the case in this article.
Alternatively, there have recently been attempts to develop automated deliberative quality indicators. By automation, we mean measuring deliberative quality by computational methods rather than by human judgment. According to Beauchamp’s review [42], automated methods are still rare but growing, centering around natural language processing and social network analysis. Social network analysis is useful in studying intricate interaction patterns in deliberation processes [44,45,46,65]. For instance, Gonzalez-Bailon et al. [46] developed two dimensions of network topology, representativeness and argumentation, and compared the quality of deliberation across different topics in an online discussion community. Another automated method is machine learning-based natural language processing [48,66,67]. For instance, Fournier-Tombs and Marzo Serugendo [48] adopted Steenbergen et al.’s [41] well-known discourse quality index and manually coded online comments in the training dataset, then applied the random forests algorithm (supervised learning) to automatically label deliberative quality in the testing set with computing training errors. Several studies combined network analysis and content analysis to identify major discussion topics and support flows in the discussion network [44,45].
While these automated methods have opened up promising future research avenues, they are in their infancy, and are far from complete. First, the most significant limitation is that human experts can better interpret nuanced political debates and contexts than machines at the current level of technical development. Beauchamp [42] found that studies employing automated methods tend “to focus on superficial, easily measured markers of argument and deliberation” (p. 324), “many of which measures are also disappointingly superficial when examined in detail” (p. 345). Second, he pointed out dozens of heterogenous indicators in the field (p. 336). This is perhaps because of unique online deliberative systems. For instance, online deliberation takes place on small online forums [38], online communities such as Twitter and Facebook [46,63,68], government-run platforms [65], parliament websites [69], and online newspapers [70,71]. These various digital platforms have unique deliberative systems, influencing data collection and analysis. For instance, while Campos-Domínguez et al. [70] used Twitter’s hashtags, Black et al. [38] used Wikipedia’s collaborative systems, and Gonzalez-Bailon et al. [46] used Slashdot’s moderation system to identify divergent topics under discussion and assess their quality quantitatively. Steenbergen et al. [41] saw that the lack of standard definitions and measures could lead to problems with validity. If one attempts to develop a comprehensive set of indicators that captures the universal elements of online deliberation, this could achieve external validity (generalizability) at the risk of reducing internal validity (trustworthiness). Third, automated methods have focused relatively less on a crucial dimension of deliberation: time. Without the time dimension, online deliberation data consist of a chunk of texts and interactions captured by a single snapshot. Since deliberation is a communicative process, it is crucial to assess how its quality changes over time.
Overall, we note that automated methods for assessing online deliberative quality pose potential validity issues. This article addresses internal validity by developing new deliberative quality indicators using network data and time-series data collected from an online deliberative platform of interest, arguing that the combination will provide information on how online deliberation evolves. In terms of external validity, we argue that the two types of data are commonly observed on many online platforms, creating comparable datasets.

2.2. New Online Deliberative Quality Indicators

Against this backdrop, we select some of the criteria from the pool of existing indicators or create a new one that can be measured and analyzed using the two types of data. For this aim, this article defines deliberation as “the process by which individuals sincerely weigh the merits of competing arguments in discussions together,” followed by James Fishkin [60] (p. 33) based on Habermas [72], and developed indicators based on his framework with three democratic dimensions: participation, deliberation, and equality [60]. These dimensions will provide us an analytical lens to examine online deliberation processes from various angles. We set participation and deliberation as two dimensions of the proposed indicators, with equality as an overarching value.
First, participation means “behavior on the part of members of the mass public directed at influencing, directly or indirectly, the formulation, adoption, or implementation of governmental or policy choices” [60] (p. 45). When residents intend to influence local politics, they might engage in a wide range of activities, for instance, joining an association, visiting petition websites, and attending offline meetings. Fishkin [60] regards these activities as forms of mass political participation, arguing that such activities should be spread throughout the population, and people should reinforce their participatory activities over time: “Mass participation is a cornerstone of democracy” (p. 46). One of the following criteria is the participation rate: what percentage of the population participates in online deliberation? It is a measure for the representative participation in online deliberation. Next, activeness measures the number of active commentators and comments and their longitudinal trends. To what extent do residents actively participate in online deliberation? Does online deliberation show an upward, downward, or constant trend? Lastly, continuity measures whether there is consistency in deliberation engagement, without significant gaps, especially during the operational periods. Overall, we consider participation rate, activeness, and consistency as essential indicators of the extent to which residents participate in online deliberation over time.
The second dimension is deliberation. While the participation dimension focuses on the volume of deliberation, in this article, the deliberation dimension focuses on interactions in deliberation. Fishkin [60] suggested five criteria of deliberation: information (accessibility of crucial information), substantive balance (reciprocal communications), diversity (multiple topics by multiple actors), conscientiousness (reasoned arguments), and equal consideration (equal opportunities to weigh up values offered by all actors). We found that network analysis and time-series analysis were useful in examining substantive balance and equal consideration, by which three indicators were developed. Responsiveness measures the degree to which online comments generate back-and-forth conversations like a real discussion that can help participants identify others’ viewpoints and clarify their preferences [73]. Janssen and Kies [28] noted that previous studies mostly categorized comments into “initiate” (a message initiates a new debate), “reply” (a message that replies to a previous message), and “monologue” (a message that is not part of a debate). This categorization requires qualitative interpretation of each comment, which does not conform to this article’s aim. Therefore, we applied an initiate-reply categorization and measured the proportion of replies. It is a simple yet useful indicator that shows the extent to which others respond to messages. Inter-linkedness examines structural patterns of who communicates with whom and how proposals are related to each other. Although online deliberative platforms provide free and accessible public space for the mass public, actors still select the appropriate partners and topics for benefits [46]. This intentionality in creating and maintaining interactions might form polarized subgroups when conflictual issues emerge that can be analyzed through social network analysis. Lastly, commitment measures the variability of engagement in online deliberation. Many empirical studies have observed that a handful of people and topics often dominate deliberation processes while others remain silent [61,62,74]. We consider this political inactivity an essential issue of political equality [60], and examine the degree of engagement across actors. Overall, we consider responsiveness, inter-linkedness, and commitment as essential indicators of interactions during deliberation processes.

3. Empirical Case: OmaStadi Participatory Budgeting Project

In this article, we focus on the case of OmaStadi to demonstrate how the proposed indicators can be used in practice. OmaStadi is a recently launched participatory budgeting project led by the City of Helsinki, Finland, in which residents can distribute a city budget of 4.4 million euros (0.1% of the total city budget). The project’s basic idea is to provide a platform for residents to initiate proposals for local planning, develop them in collaboration with city experts, and allocate public budgets through popular vote. Likewise, this project’s main feature is that residents can play active roles as initiators, developers, and decision-makers. OmaStadi has a biennial cycle. The first year involves decision-making for budget allocation; then, the second year involves implementation. We studied the OmaStadi 2018–2020 when the project was piloted. The project is now in its second term (2020–2022) with a doubled budget (8.8 million euros).
The city government employs an open-source digital platform developed by Metadecidim, called decidim (https://decidim.org), to make it possible for residents to initiate, discuss, and vote in one place. Dozens of municipalities in European countries have employed it for local participatory programs [75]. OmaStadi has six participatory budgeting stages [76]:
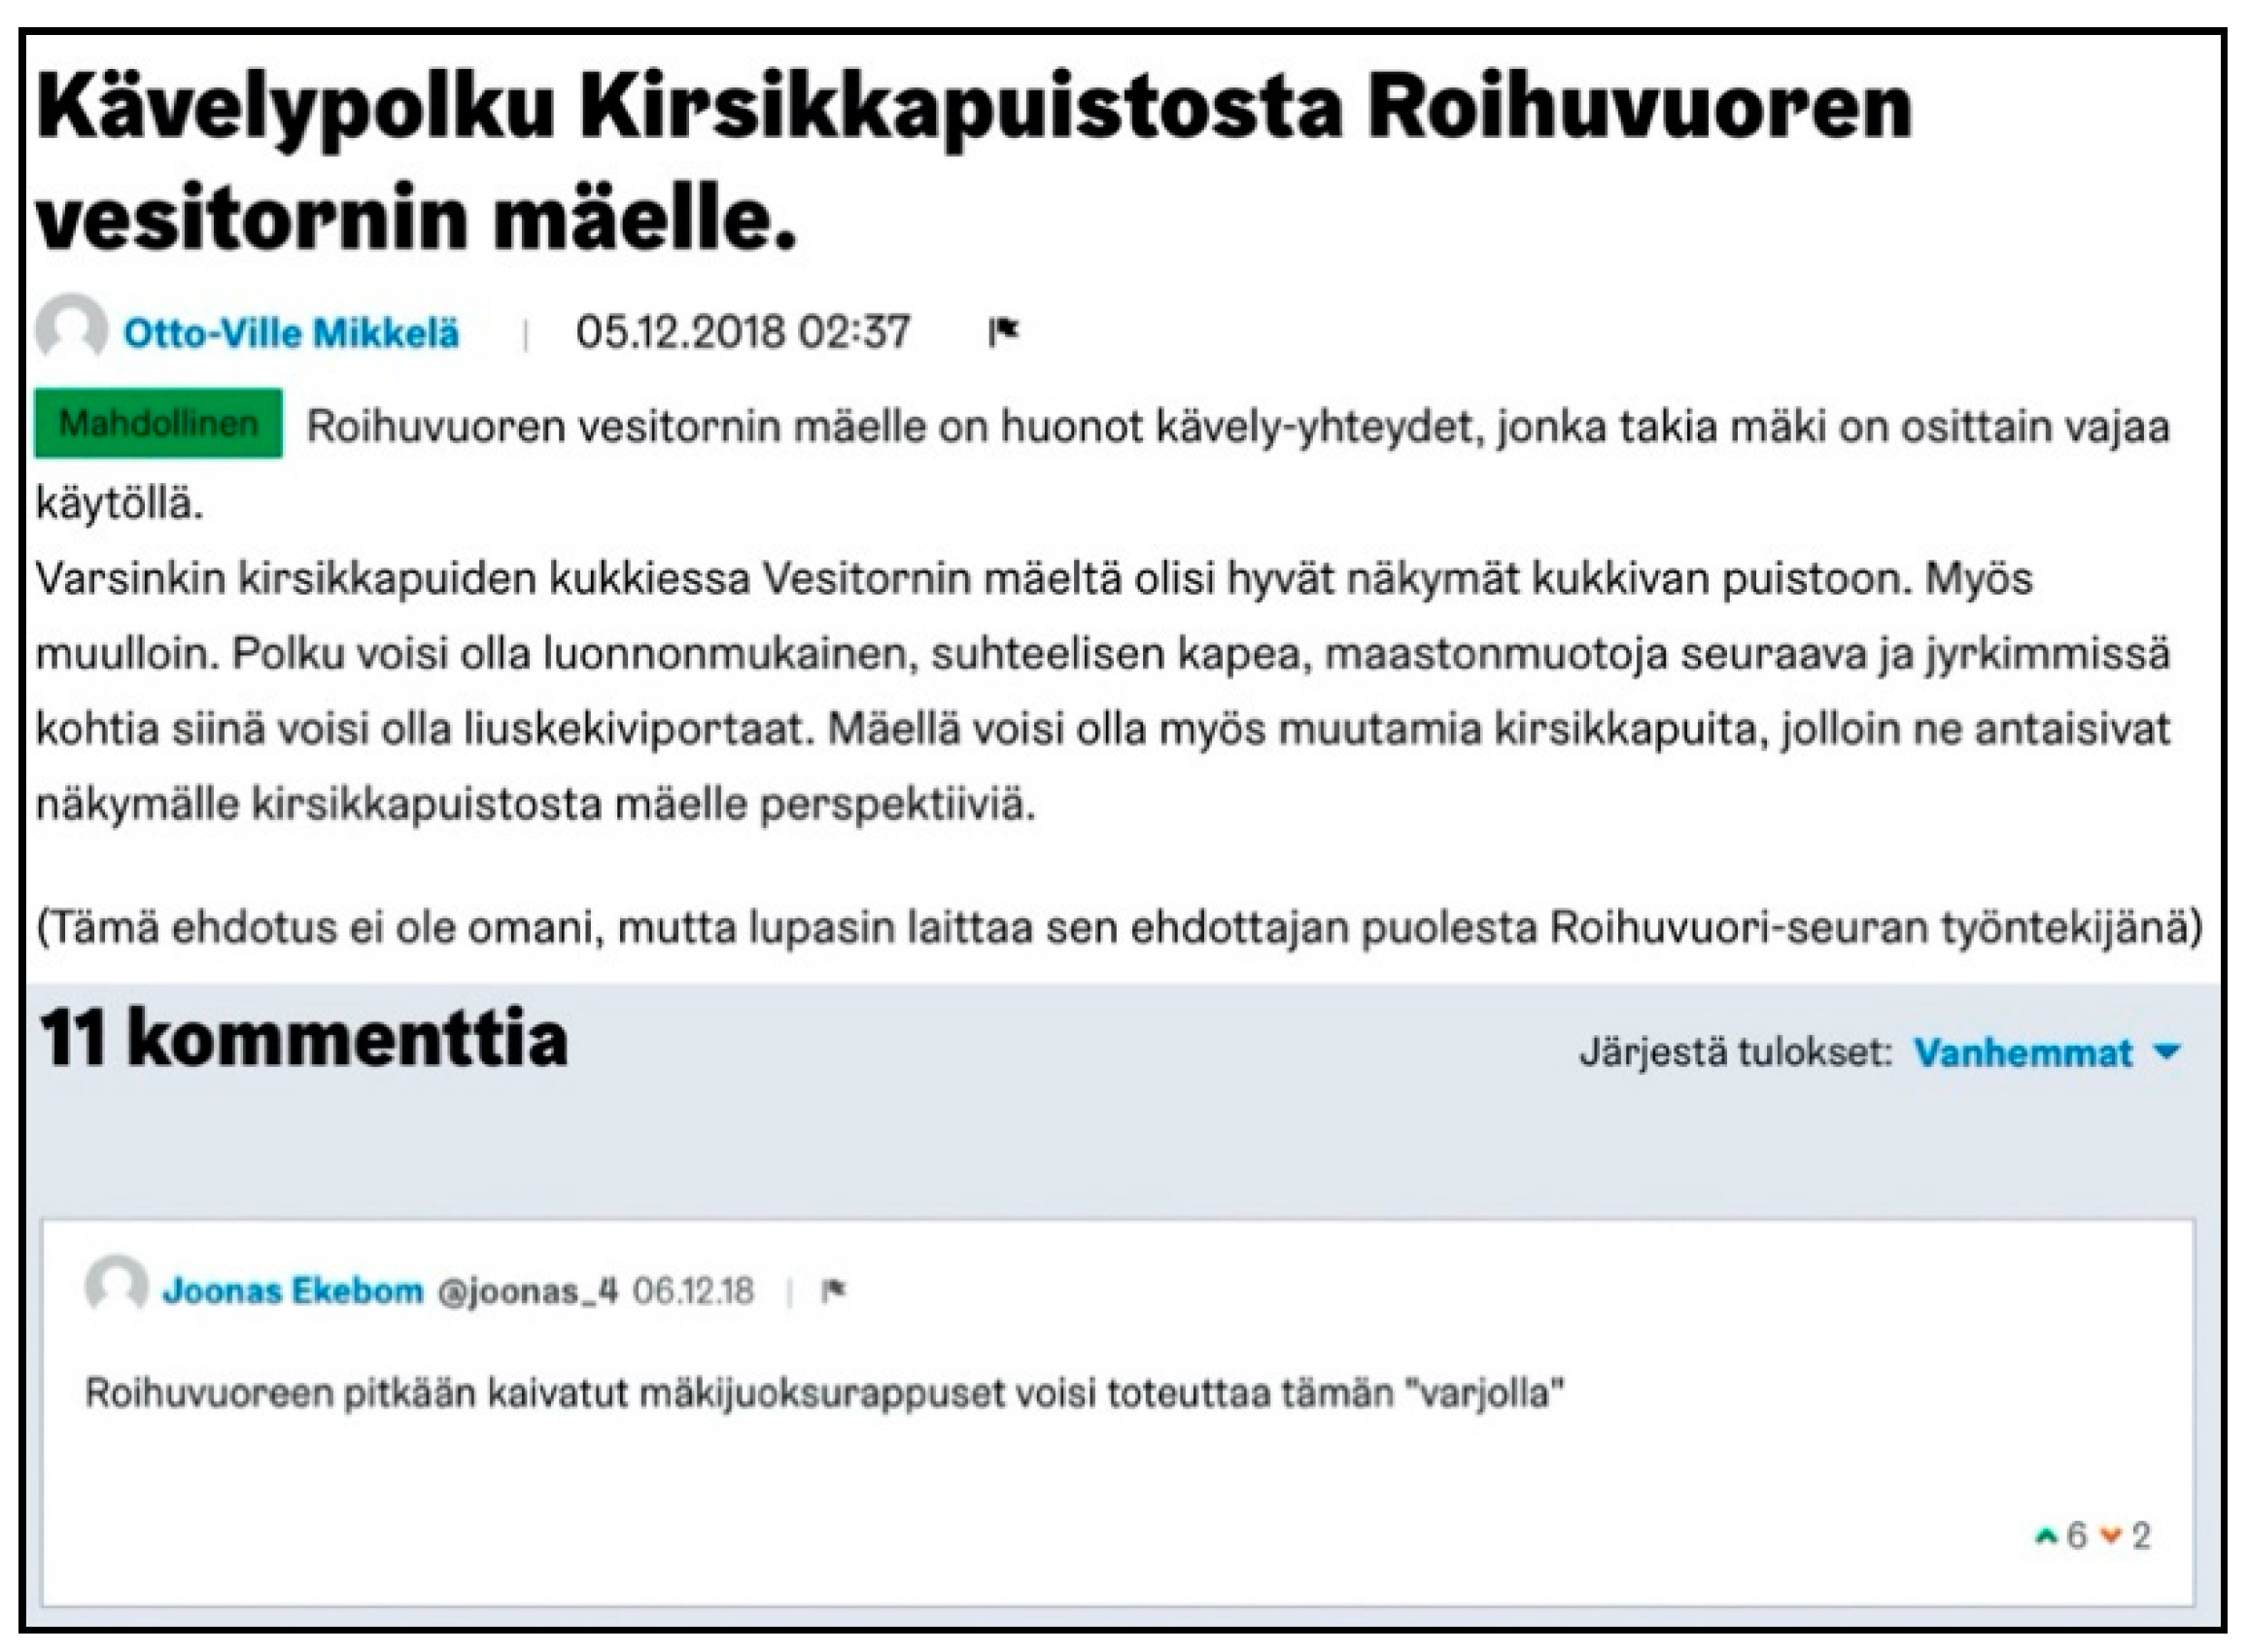
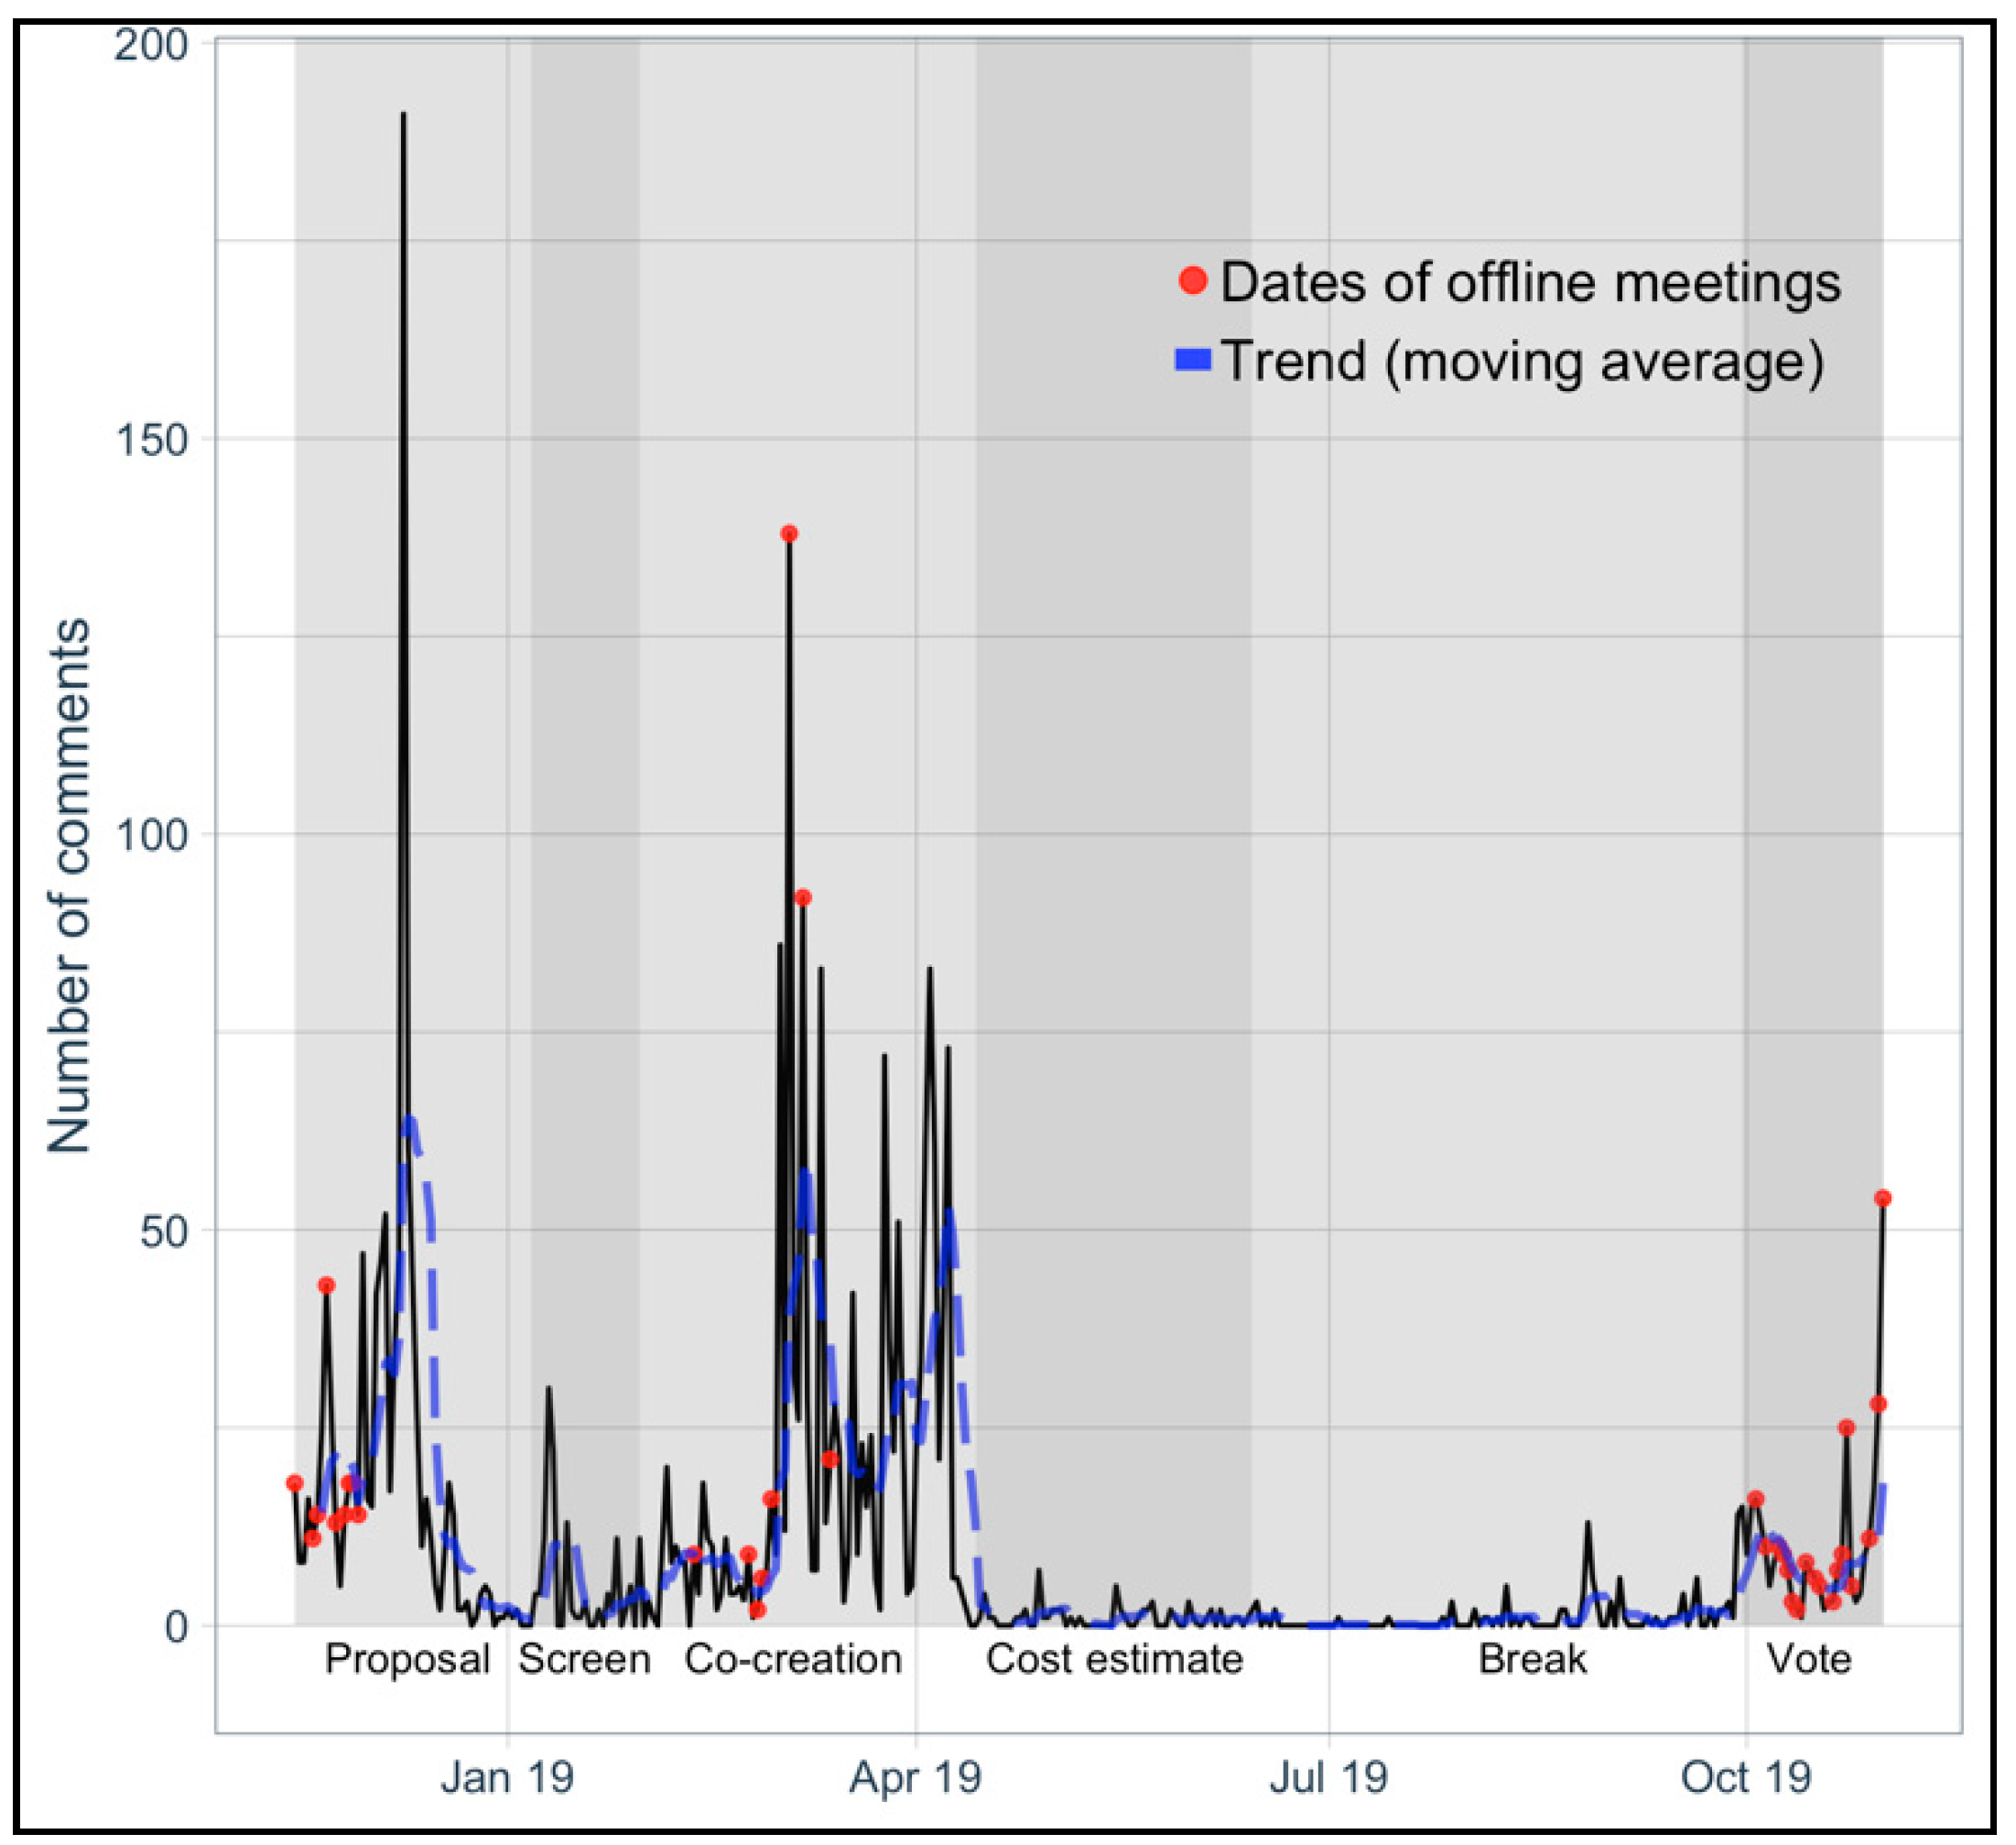
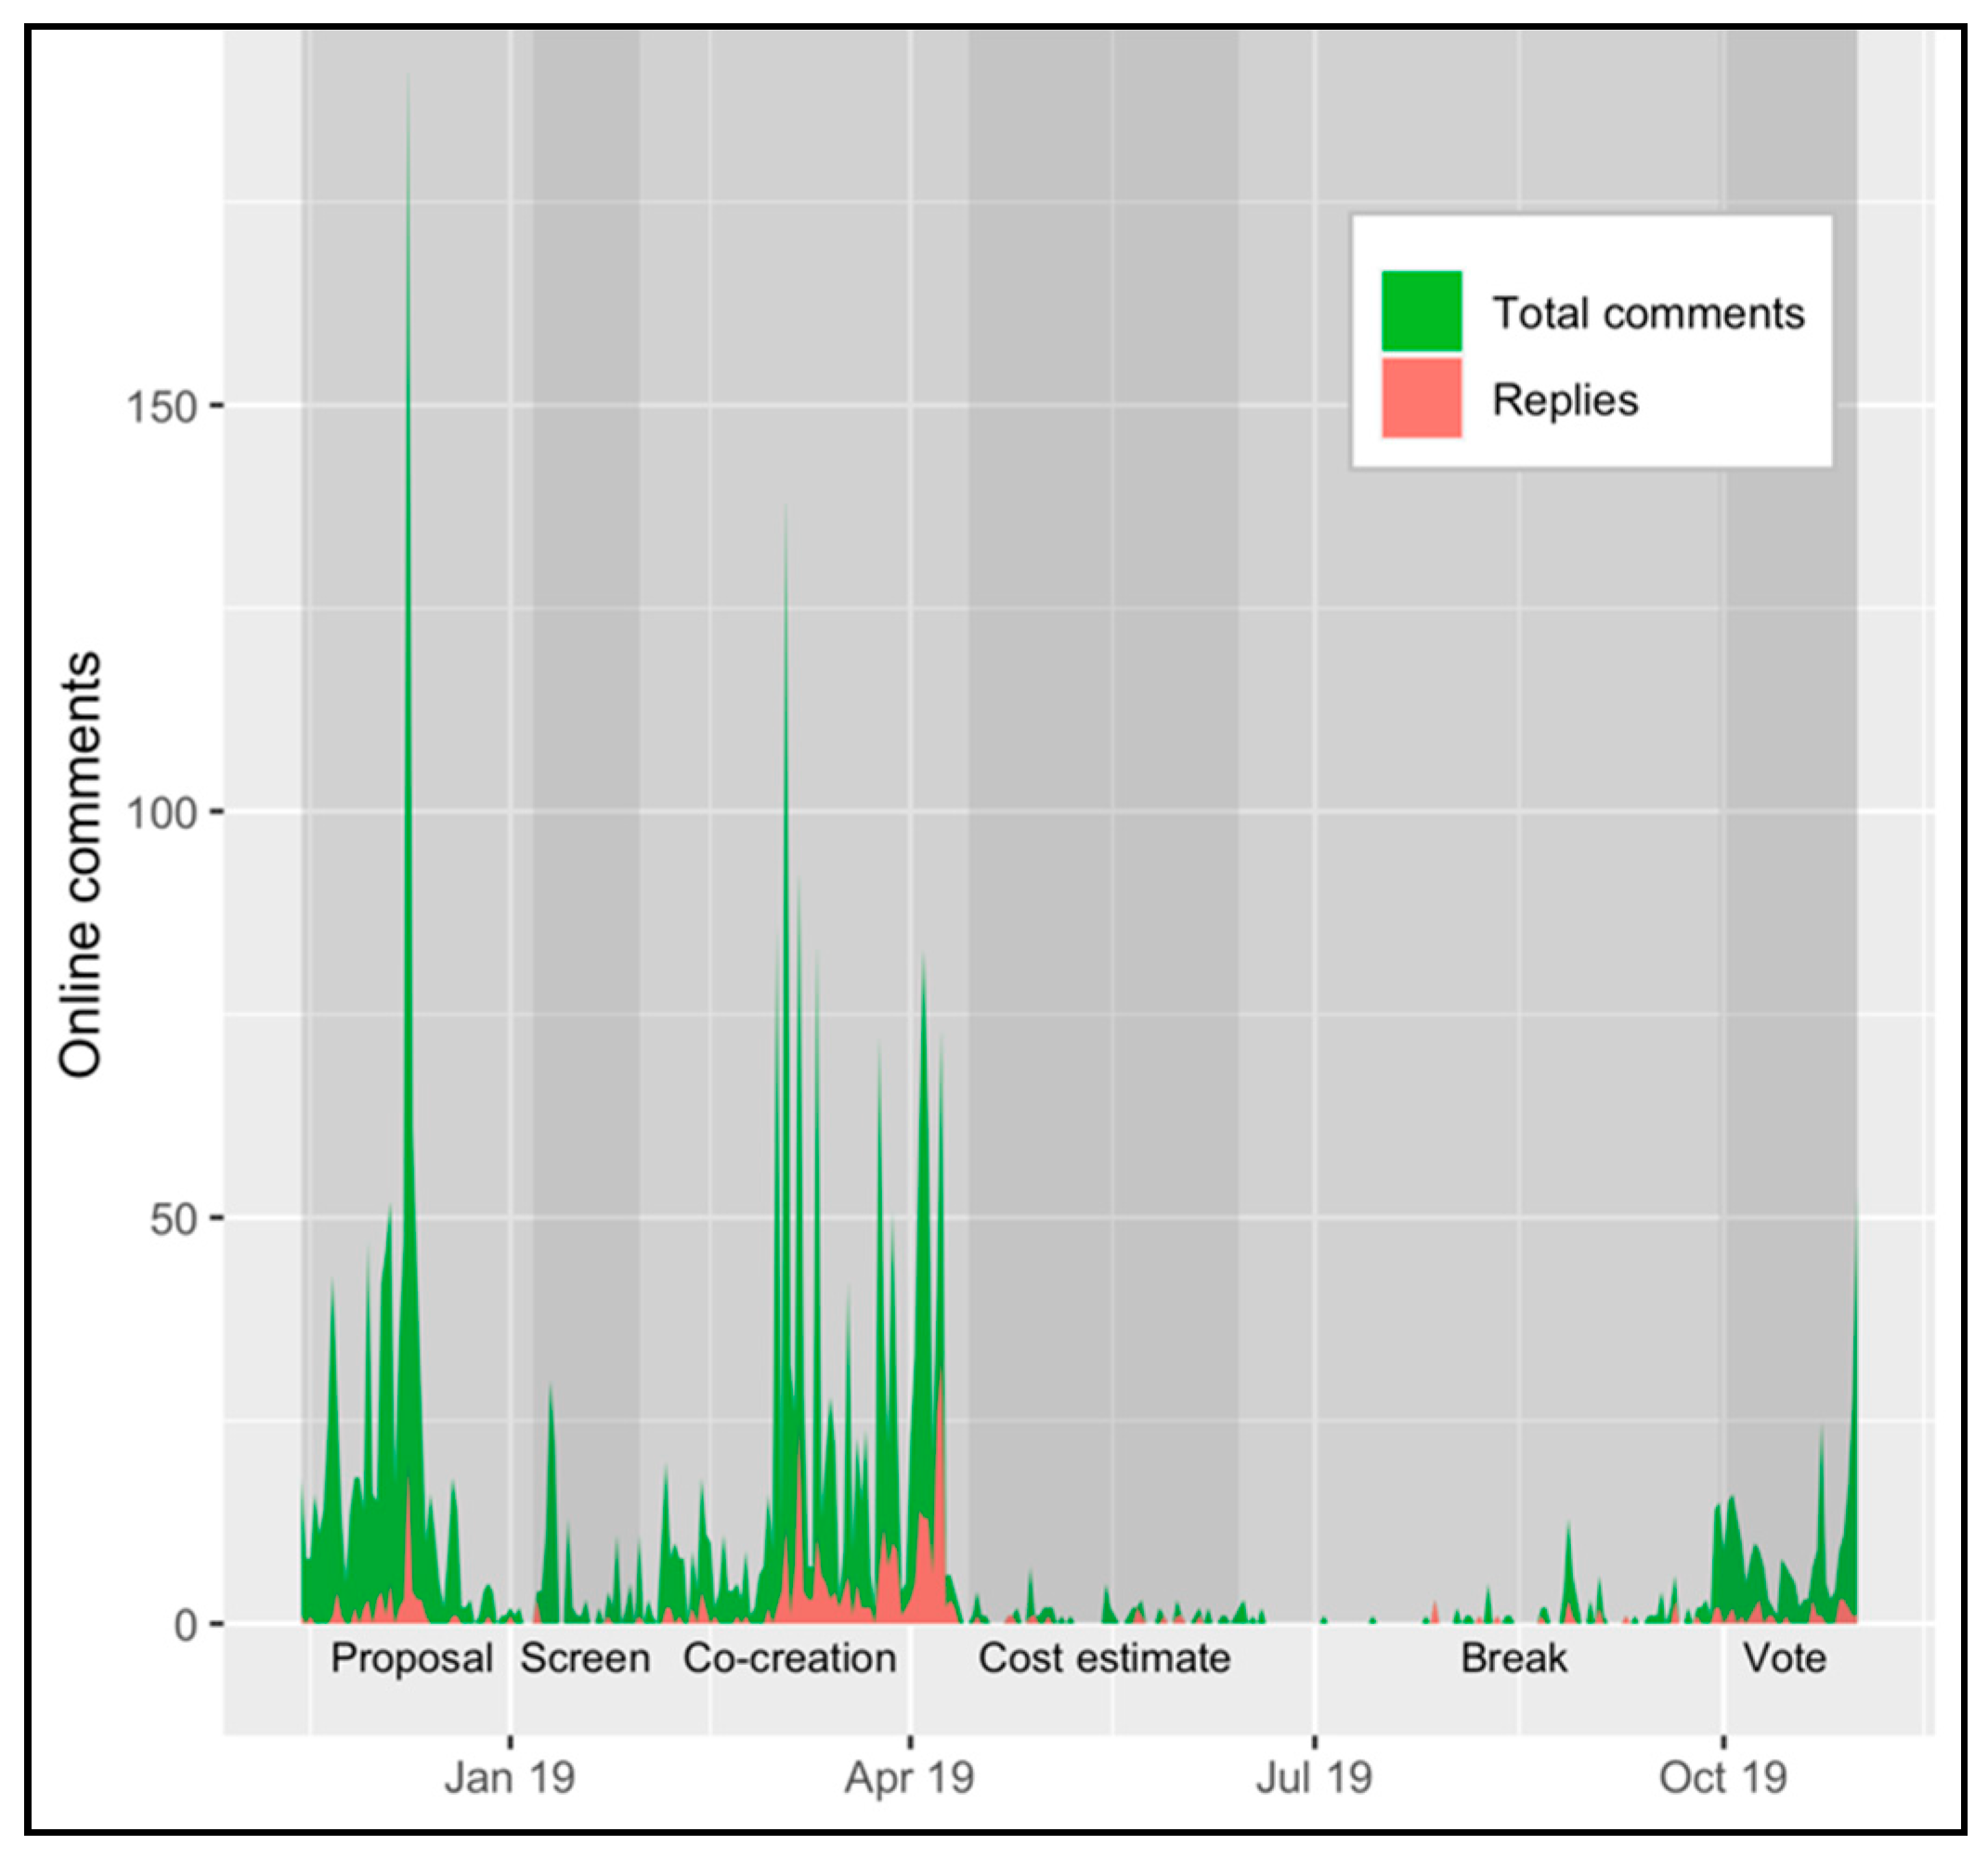
  • Proposal: Residents initiate proposals.
  • Screening: City experts screen all proposals and mark them either as impossible (ei mahdollinen) or possible (mahdollinen). Once a proposal is labeled “impossible,” it is no longer proceeded with.
  • Co-creation: Several “possible” proposals (ehdotukset) are combined into plans (suunnitelmat) based on traits and relevance in collaboration with residents and experts.
  • Cost estimates: City experts estimate the budget for each plan. Plans are prepared for a popular vote.
  • Voting: Citizens vote on desirable plans online or offline.
  • Implementation: Voted plans are implemented in the following year.
Another feature of OmaStadi is that online and offline participatory activities are combined within a digital platform. For instance, any registered resident can initiate a proposal(s) online or offline. It is then displayed on a dedicated web page where other residents can develop ideas through comments (Figure 1). This user-generated discussion system is similar to Reddit, while being distinct from the actor-oriented system of Facebook, for example. The city government reports that around 53,000 residents engaged in online/offline deliberation and voting processes for 1273 proposals through 3188 comments and 107 offline meetings. However, 1273 proposals were too many for a popular vote and less developed for a feasible plan, as there were no cost estimates, job assignments, or area surveys (see Figure 1). Therefore, the goal of the deliberation process was to reduce the number of proposals and develop them into formal plans: 1273 proposals were combined into 336 plans for a vote. As each proposal and plan had a webpage like Figure 1, there were 1609 separate spaces where residents could discuss. However, during a one-month voting stage, residents who entered into an online/offline voting system read a list of 336 plans, not 1273 proposals, on which they were to vote.
The city government played a crucial role as a moderator and facilitator in this process of “turning ideas into proposals” [77]. The city government hosted face-to-face meetings and workshops at various locations in eight areas (east, west, north, south, southeast, northeast, and central areas and the entire area). Seven borough liaisons hired by the city facilitated offline and online deliberation processes. The city government intervened directly in the screening and co-creation stages, during which initial proposals were filtered and developed.

4. Materials and Methods

4.1. Data Collection

We collected data from an online deliberative platform of OmaStadi (https://omastadi.hel.fi). The first dataset contains information on offline meetings, including specific meeting dates and their frequency. The second dataset contains observational data on proposals, plans, and online comments collected by parsing the web pages of all proposals (n = 1273) and plans (n = 336) with Python in May 2020. Although the official deliberation process started in October 2018, the first comment was made on 15 November 2018, which becomes the first date of the investigation period (from 15 November 2018 to 31 October 2019). The parsed data contain the proposal ID, proposal title, proposal area (n = 8), proposal status (impossible or possible), type of post (proposal/plan/initial comments/replies), author ID, and date of publication. The author IDs are registered with nicknames on the digital platform. The Finnish National Board on Research Integrity defines personal data as “any information relating to an identified or identifiable natural person,” such as names, telephone numbers, and age, which are strictly regulated [78] (p. 55). Since nicknames could become identifiable when users register with their real names, we anonymized nicknames by numbering them. We used the R statistical program to conduct empirical analyses.

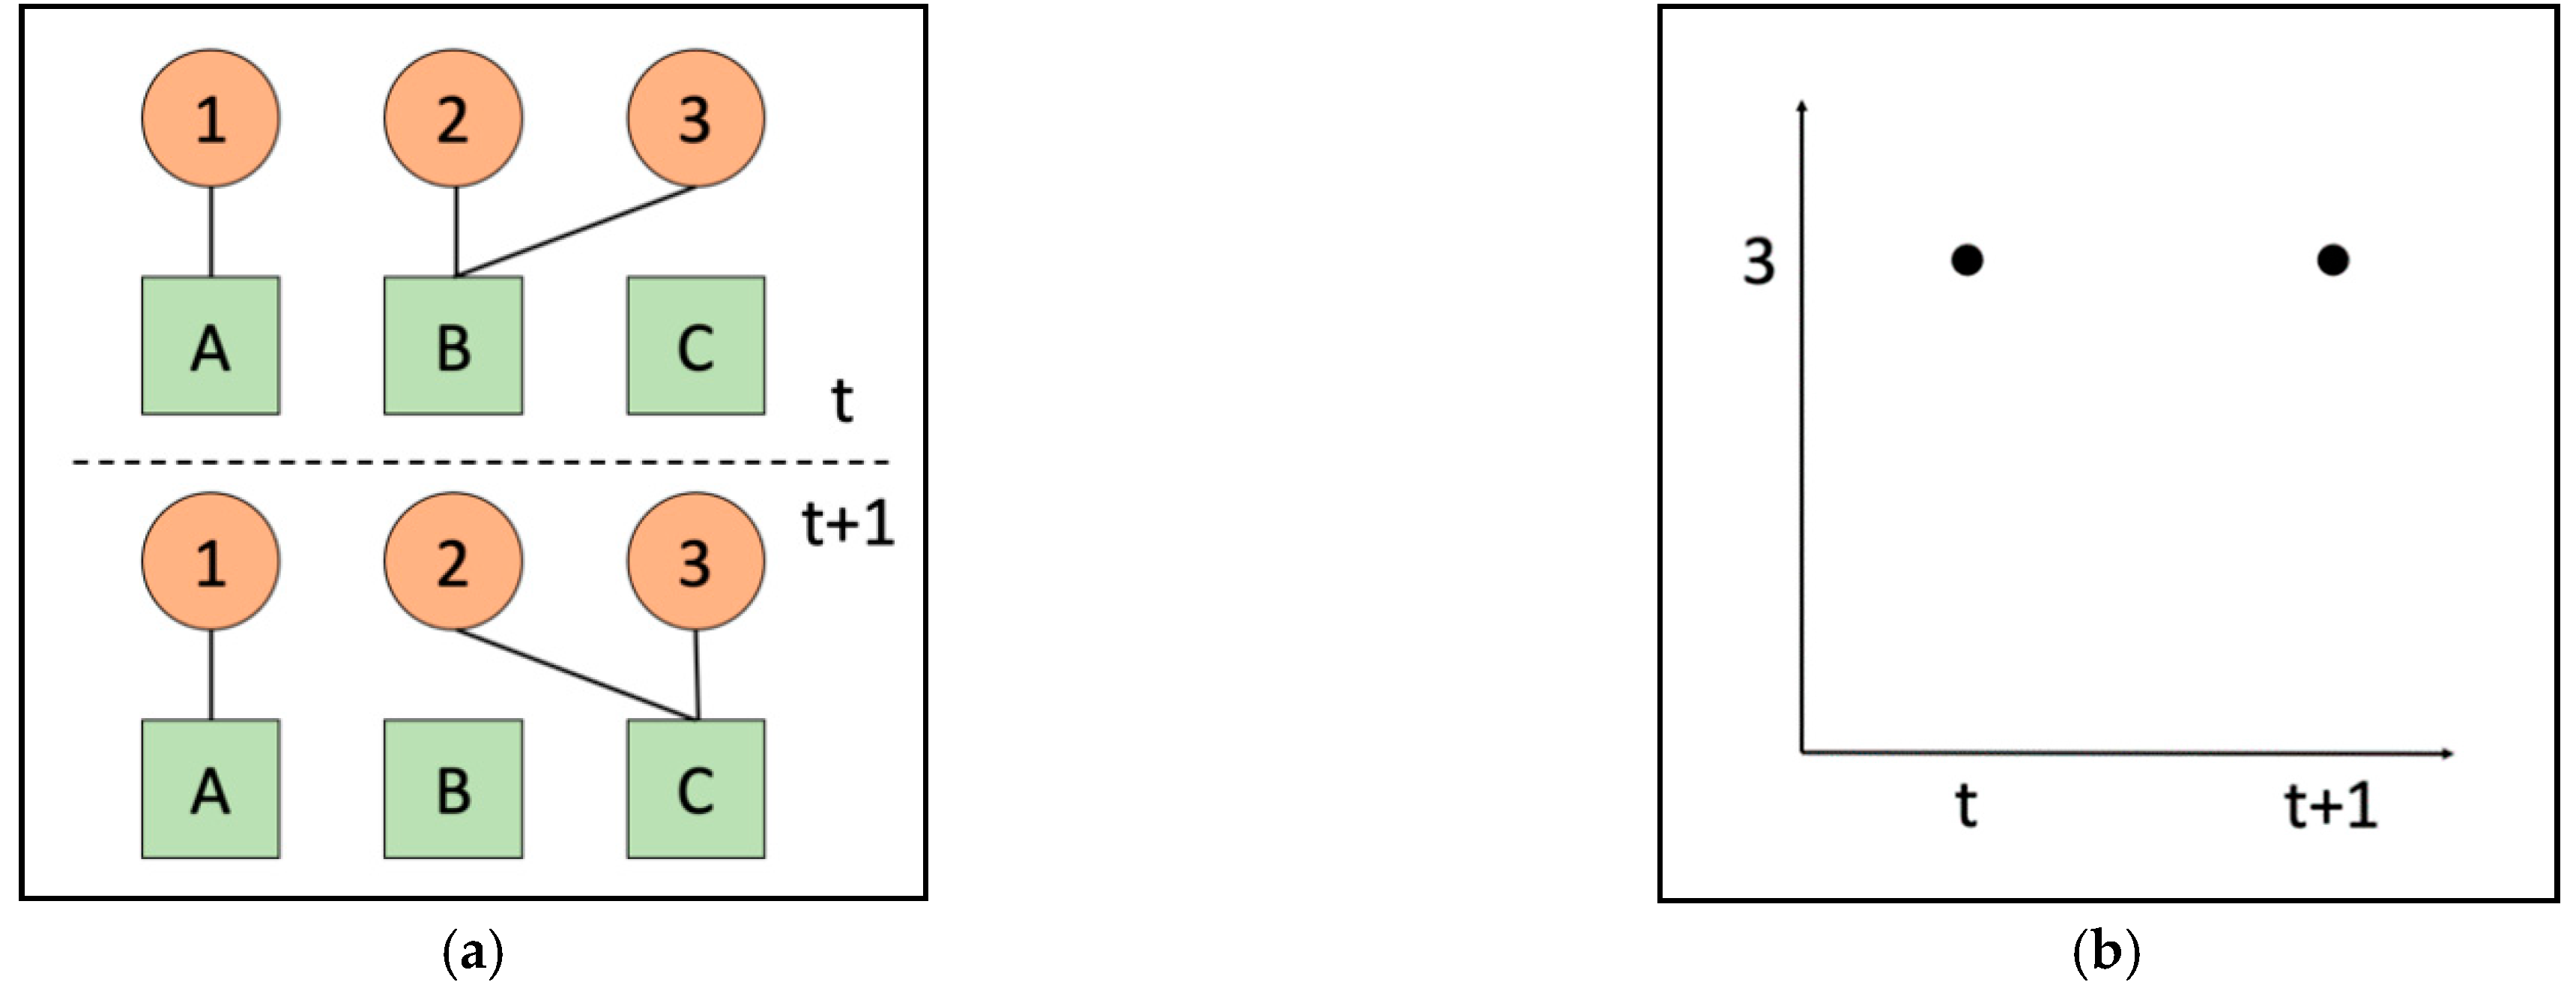
4.2. Methods: Network Analysis and Time-Series Analysis

This article proposes new online deliberative quality indicators using network analysis [79,80] and time-series analysis [81,82]. Although the two analyses have distinct theories and applications, we stress that the analyses can be used to shed light on different sides of the same coin, and more specifically, the same data [83]. Recall Figure 1, which shows the engagement of several residents in a proposal through comments. Contrary to Facebook, for instance, in which actors directly connect with other actors through being Facebook Friends, there is no direct connection between users in Figure 1. That is, commentators only create indirect relationships with others, mediated through proposals or plans. In social network analysis, a network that consists of two node sets (actors and proposals) is called a two-mode (bipartite or affiliation) network [79].
A two-mode network can be represented as a graph B = { U ,   V ,   E } , consisting of disjoint sets of commentators U , proposals (plans) V , and edges E = { ( u , v ) : u U ,   v V } that maps connections into pairs of the two sets [84]. If there are n commentators and m proposals, an edge set E can be represented as a matrix with a size of n × m that contains x u v elements. We designate k u as the degree of node u U and d v as the degree of node v V , where the degree refers to the number of edges connected to each node [85]. If we consider a time dimension, the network B contains additional time-varying functions B ( t ) = { U ( t ) ,   V ( t ) ,   E ( t ) } . The total number of edges of the network B ( t ) at a given time t   T is then as follows:
| E | ( t ) = u U ,   t T k u ( t ) = v V , t T d v ( t )
This simple equation will bridge the network and time-series data. Figure 2 illustrates a fictitious example of how these two types of data are interconnected. Figure 2a presents a two-mode network composed of actors (1, 2, 3) and proposals (A, B, C) at time t and t + 1. At time t, Actor 1 commented on Proposals A, and Actor 2 and 3 commented on Proposal B. The total number of edges at time t is, thus, 3. At time t + 1, Actor 1 commented again on Proposal A, whereas Actor 2 and 3 made comments on Proposals C. Despite the change in interactions, the total number of edges at time t + 1 is still 3. We can use this network metric | E | ( t ) to construct a continuous-time series Y T , where Y = { y ( t ) | t = { 1 , , p } ,   y ( t ) } , as shown in Figure 2b [81,83].
As Figure 2 shows, the two types of data have both advantages and disadvantages. On the one hand, network data (Figure 2a) contains snapshots of relational information among nodes at discrete time points. This relational information allows us to study the structural properties of interactions but becomes cumbersome as new nodes or time variables are added. On the other hand, time-series data (Figure 2b) stores the volume of interactions at discrete points of time. Compared to the network data, time-series data are efficient in analyzing trends, seasonal variations, and forecasting without relational information. Based on the discussions, we now present measurements for each indicator (Table 1).

4.2.1. Participation Dimension

The participation dimension examines the volume of public engagement in deliberation and its longitudinal change within a given online deliberative system. First, the participation rate measures the proportion of residents who registered with the online system, calculated by the number of registered IDs divided by the registered population. The registered IDs of interest cover residents who initiated proposals and commentators on this article.
Second, the activeness measures the volume of active commentators, proposals, and comments over time. While the participation rate shows a total number of available participants and proposals, the activeness shows the degree of actual engagement in deliberation. We count active commentators and comments based on a condition of x u v > 1 in a discussion network of the whole investigation period. This means that we apply a substantially low threshold for defining “activeness” even though residents commented only once or proposals received only one comment within a whole process. Next, we use a (two-sided) moving average (Equation (2)), a fundamental function of time-series analysis, to capture a smoothed trend of online comments [86]. A moving average (MA) is an (arithmetic) average of the values of y t , denoted as y ^ t , obtained from the sum of y t divided by “moving” period q . A period q is “moving” because it is continuously rolling accompanied with time t with a fixed length defined by past q 1 and future q 2 .
M A :   Y t ^ | q 1 , q 2 =   Y t q 1 + Y t 1 + Y t + Y t + 1 + + Y t + q 2 q 1 + q 2 + 1 ,   q = q 1 + q 2 + 1 ,   a n d   q T
Third, continuity measures the extent of consistency in participation. There is a similar concept in time-series analysis, called a “stationary” process with three conditions [81]: (1) the mean of y t is constant, (2) the variance of y t is constant (height of fluctuation), and (3) the correlation structure of y t and its lags is constant (width of fluctuation). As will be discussed later, the data collected show a substantial inactivity level, specifically y t = 0 , during the investigation period; thus, we created a binary variable C t (1: if y t > 0 ; 0, otherwise) that counts the existence of daily activities. Using this variable, continuity is obtained by the number of active days divided by the number of the investigation period, p .

4.2.2. Deliberation Dimension

The deliberation dimension examines interactions in deliberation and its longitudinal change. First, responsiveness indicates the proportion of replies to all comments. We consider replies to be the simplest yet explicit evidence of reciprocated communication. Responsiveness is calculated by the number of replies divided by the number of comments.
R e s p o n s i v e n e s s = #   r e p l i e s #   c o m m e n t s
Second, inter-linkedness refers to the interactive patterns among actors and proposals analyzed using social network analysis. This article focuses on the networks in the southeast and central area due to specific controversial events that will be discussed later. In terms of the network graph, we will demonstrate how the two networks evolve at three stages (proposal stage, co-creation stage, and vote stage) to detect hidden patterns of interactions. We will then calculate descriptive statistics, including the mean number of comments per actor and the mean number comments per proposal.
Third, commitment measures how the number of connections is distributed across the entire network. A handful of active actors and proposals is substantially vibrant in many cases, while most others remain inactive. This article calculates commitment by counting k u ( t ) and d v ( t ) separately, then draws degree distribution defined as follows:
Actors :   P u ( k ) =   fraction   of   nodes   in   U   with   degree   k Proposals :   P v ( d ) =   fraction   of   nodes   in   V   with   degree   d

5. Results

This section reports the empirical results of participation rate, activeness, and continuity in the participation dimension; and responsiveness, inter-linkedness, and commitment in the deliberation dimension based on the online data of OmaStadi 2018–2020.

5.1. Participation Rate
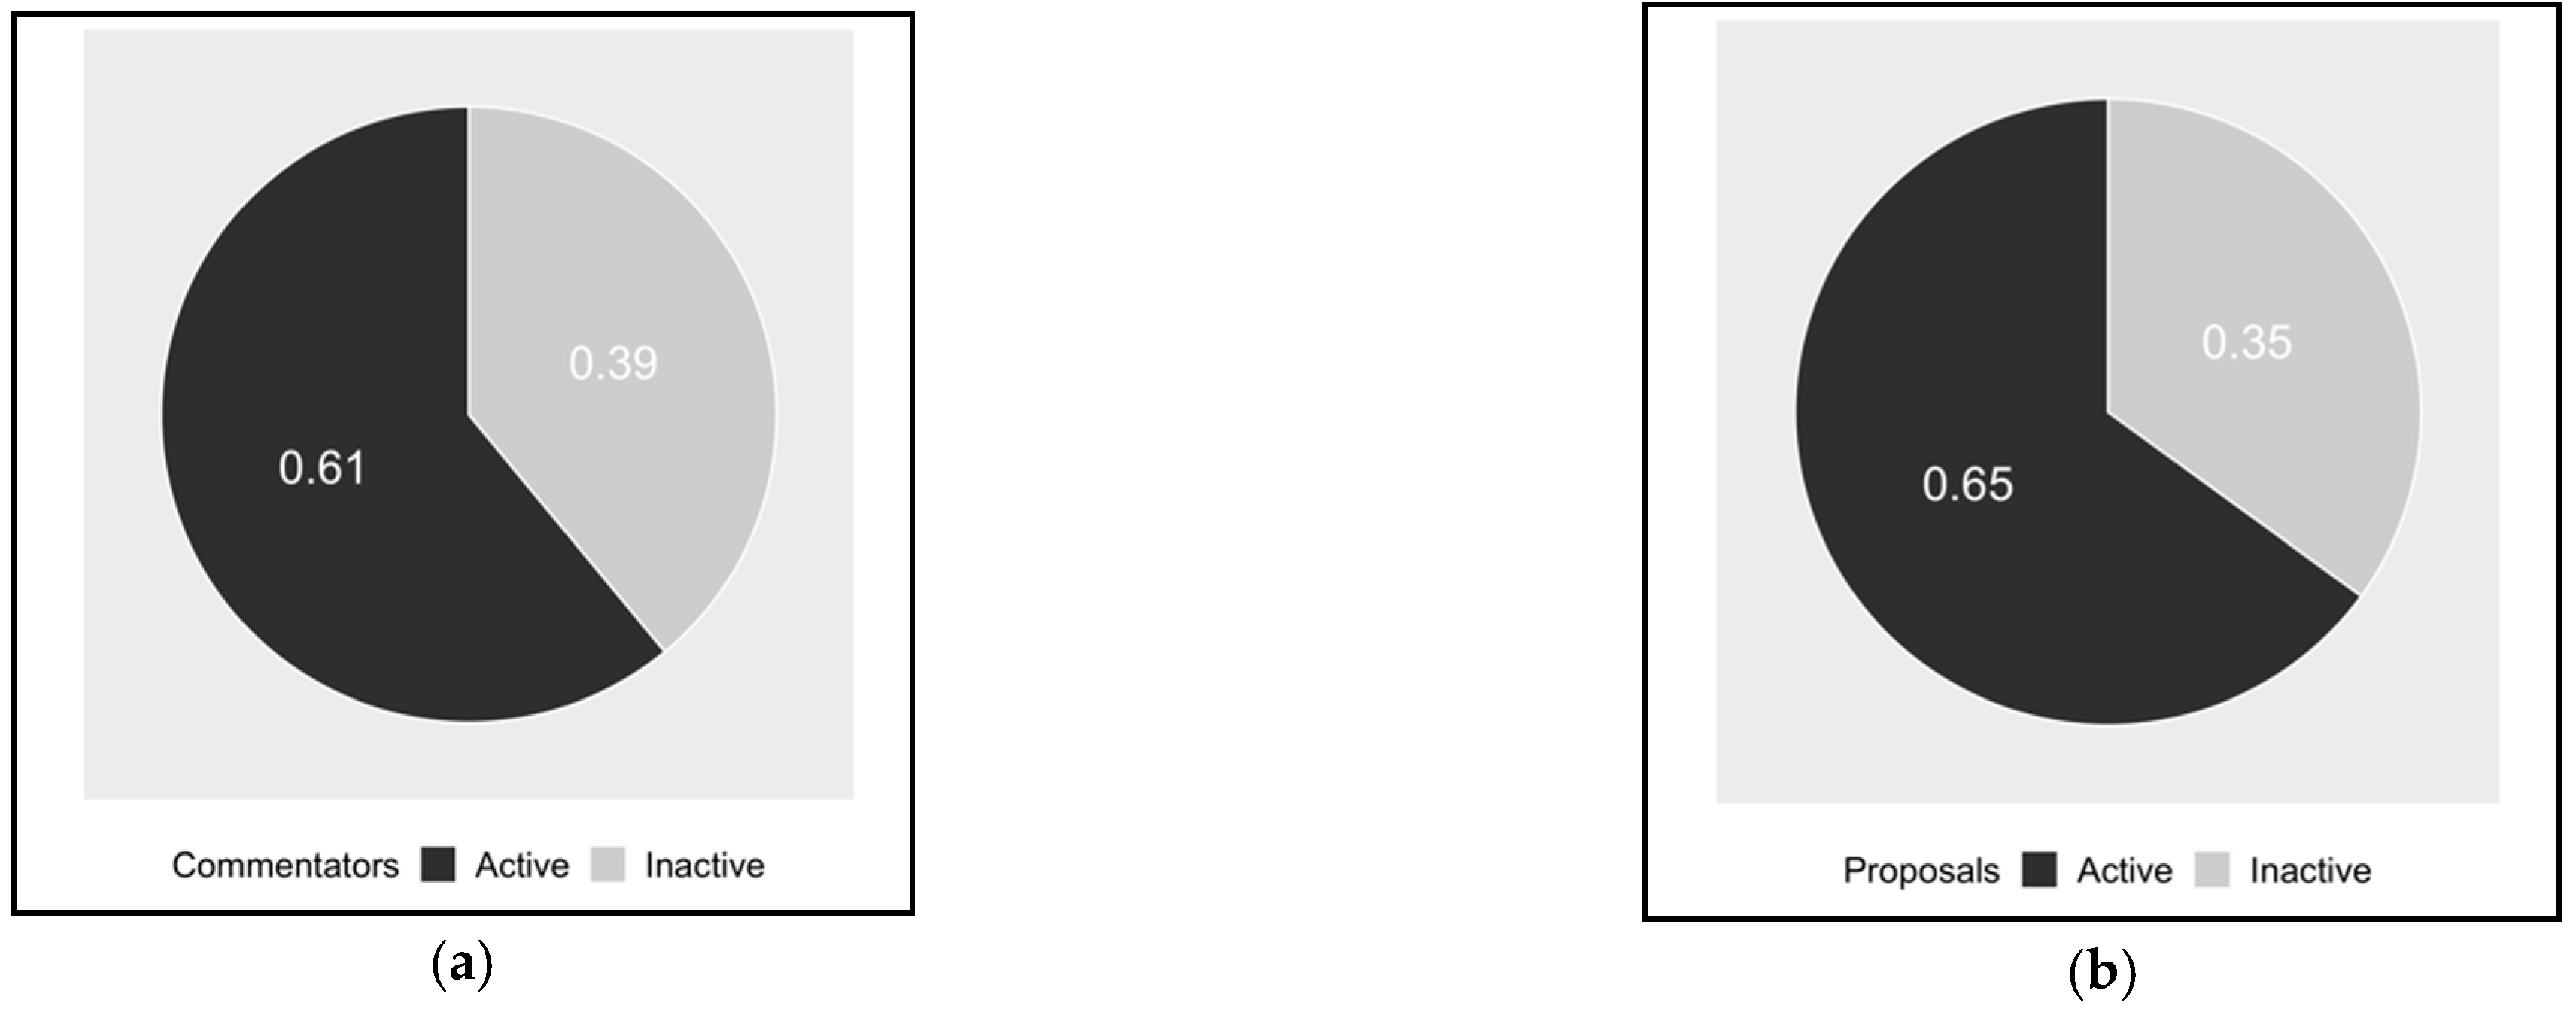
The participation rate measures the proportion of residents who registered in the online system. To register in the online system of OmaStadi, a resident had to have a Finnish bank account or a mobile certificate (linked to the Finnish local registration system) to verify that their home address was in Helsinki (there were other registration options for the youth population). We considered online IDs as identifiers based on this registration system. The number of unique IDs who participated in the proposal stage or made comments at least once during the investigation period was 2281. As the registered population of Helsinki was 648,042 in 2019, according to Helsinki Region Infoshare (https://hri.fi/data/en_GB/dataset/helsinki-vaesto), the participation rate was found to be 0.0035, that is 0.4% of the population.
Note that multiple participation channels existed in OmaStadi, such as offline meetings and workshops [77]. The City of Helsinki counted offline participants using the same registration system and estimates the total number as 52,938 (https://omastadi.hel.fi/processes/osbu-2019?locale=en). If we consider these participants, the total participation rate in deliberation processes was up to 8.2% of the population. Moreover, Rask et al. [76] found that the voter turnout rate was 8.6% (49,705 residents) in OmaStadi 2018–2020. These two figures show a moderately high level of participation rate given the fact that it was a pilot project with a small proportion of the city budget (0.1% of the total budget). In this article, we take 0.4% as the participation rate of interest because the focus is on online deliberation rather than overall participation in OmaStadi.

5.2. Activeness

The participation rate measures the pool of registered participants available for online deliberation. In practice, however, only a portion of them will be active. Therefore, activeness measures active participants and proposals (Figure 3). Figure 3a shows that the number of residents who commented on any proposal or plan at least once during the investigation period was 1385, or 60.7% of the total number of IDs identified earlier (n = 2281). Figure 3b shows that the number of proposals or plans that received any comment during the same period was 1040, 64.6% of all proposals and plans (n = 1609). This means that 569 proposals and plans received zero comments during the deliberation process.
Next, we examined the longitudinal change of comments to examine how online engagement evolved. Before this, we briefly illustrate what percentage of resident-initiated proposals were finally selected in the OmaStadi 2018–2020. In the proposal stage, residents proposed 1273 ideas, among which 838 proposals were labeled as “possible” by city experts in the following screening stage (January 2019). This means that 65.8% of proposals survived the filtering process. These “possible” proposals were then combined into 336 plans in the co-creation stage (February–April 2019), which means that 2.5 possible proposals combined into one plan on average. Among 336 plans, 44 plans were selected by popular vote in October 2019, consisting of 83 proposals. Therefore, 6.5% of 1273 initial proposals were finally selected, which shows a substantially low acceptance rate.
This competitive process might have influenced activeness. As Figure 4 shows, the volume of online comments fluctuated greatly according to the different stages of deliberation. In the proposal stage, during which residents proposed their ideas hopefully, there was a vital signal of online deliberation (31% of all comments). In the following screening stage, city experts decided whether proposals were possible or impossible; residents became relatively silent (3.7%). In the co-creation stage, during which possible proposals were prepared for a popular vote, residents showed the most active engagement (49%). However, after six months, until the voting stage (3.3%), online deliberation became almost entirely inactive (1.9%). From this result, we can conclude that the proposal stage and the co-creation stage attracted the majority of online participation (80% of all comments). We also marked the dates of offline meetings (red dots in Figure 4) to visually examine the tendency for offline meetings and online deliberation to co-occur, which was not explicit.
Overall, these results indicate that the degree of public participation in online deliberation fluctuated according to the six stages of OmaStadi. Time-series analysis provides tools, such as an ARIMA model (autoregressive integrated moving average) for analyzing such systematic patterns (seasonality) [81]. If OmaStadi conducts multiple rounds and accumulates multi-year data in the future, these models might become useful. The moving average (a blue dotted line in Figure 4) shows that it is hard to detect a clear trend in participation. Nevertheless, the result of a linear regression model of time-series data (online comments = constant + trend component + error term) shows that the trend component coefficient was −0.053 (SE: 0.01 ***), meaning that the degree of engagement was decreasing slightly (adjusted R square: 0.08).

5.3. Continuity

Figure 4 shows volatile patterns of public participation over time, which raises the need for the resilience of deliberation under varying situations. Since there was a substantially low degree of participation during the period between the co-creation stage and the vote stage, we created an indicator continuity to quantify the daily activeness of online deliberation. The continuity records whether online deliberation occurs daily (1 = happened, 0 = not happened), where white spaces in Figure 5 show the proportion of inactive dates. Despite the low threshold, we identified that 32.5% (114 days) of the investigation period ( p = 351 days) showed no activity at all (0 comments).

5.4. Responsiveness

We examined the proportion of replies (Figure 6). The number of replies was 435 during the investigation period, 13.7% of all comments (n = 3188). This means that a majority of online comments did not proceed to become back-and-forth discussions. However, there were noticeable differences in the proportion of replies according to different stages: the highest responsiveness was recorded during the cost estimate stage (22%) partially due to city experts’ responsibility for explaining the budgets, followed by the co-creation stage (19.2%). In contrast, the proposal stage (6.8%), the screening stage (3.4%), and the voting stage (10.4%) showed low responsiveness. These results indicate that although residents actively engaged in deliberation during both the proposal stage (31% of all comments) and the co-creation stage (49%), the former was characterized by unilateral communications (3.4% replied) while the latter by a higher level of mutual communications (19.2%). Does this indicate that the deliberative quality during the co-creation stage was higher than that of the proposal stage? Rather than answering yes or no, we highlight that this deliberative system serves for participatory budgeting, which has different stages and activities. During the proposal stage, residents may simply express their opinions regarding the proposals. Later, residents attend offline meetings and gradually deliberate to develop proposals into plans through reciprocal discussions. Another remarkable feature is the promptness of responses. As Figure 6 represents, the correlation between initiates and replies on the same day (lag 0 in time series analysis) was 0.64, indicating that residents rarely responded to others’ comments, but did so quickly when they did. Overall, these results underline that online deliberation on government-run platforms substantially reflects formal governance processes so that the proposed indicators should be interpreted using qualitative investigations.

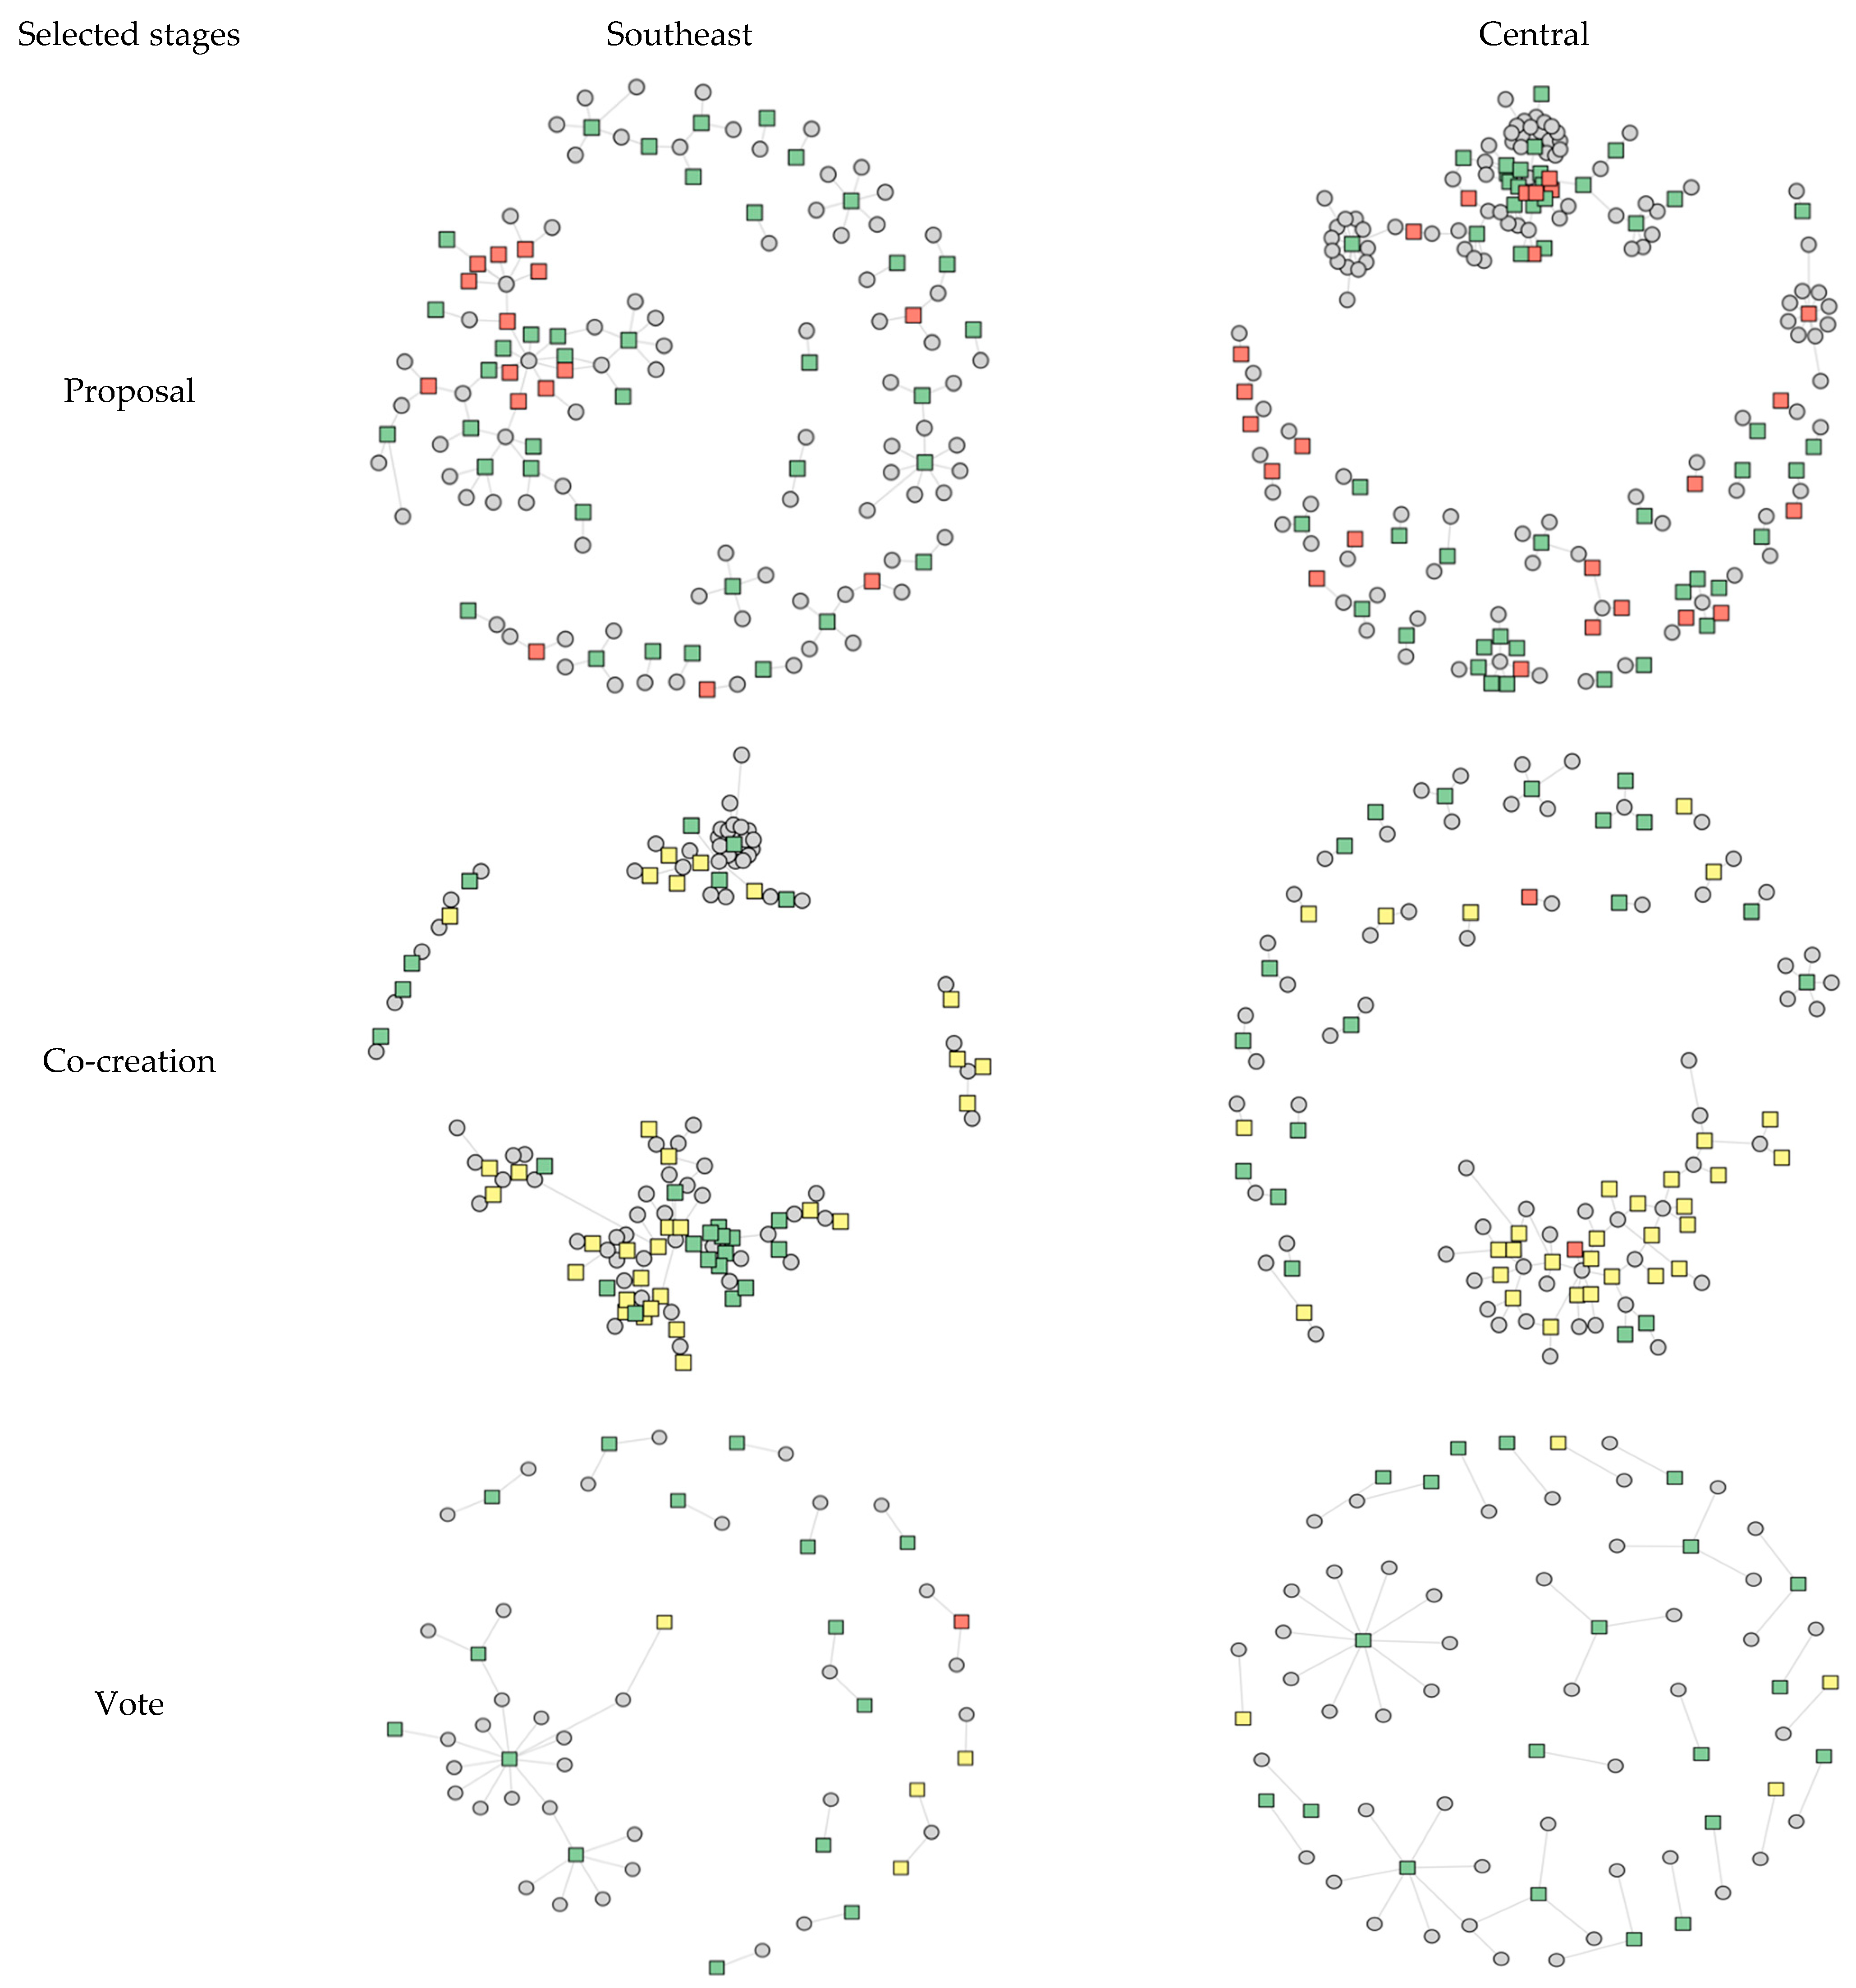
5.5. Inter-Linkedness
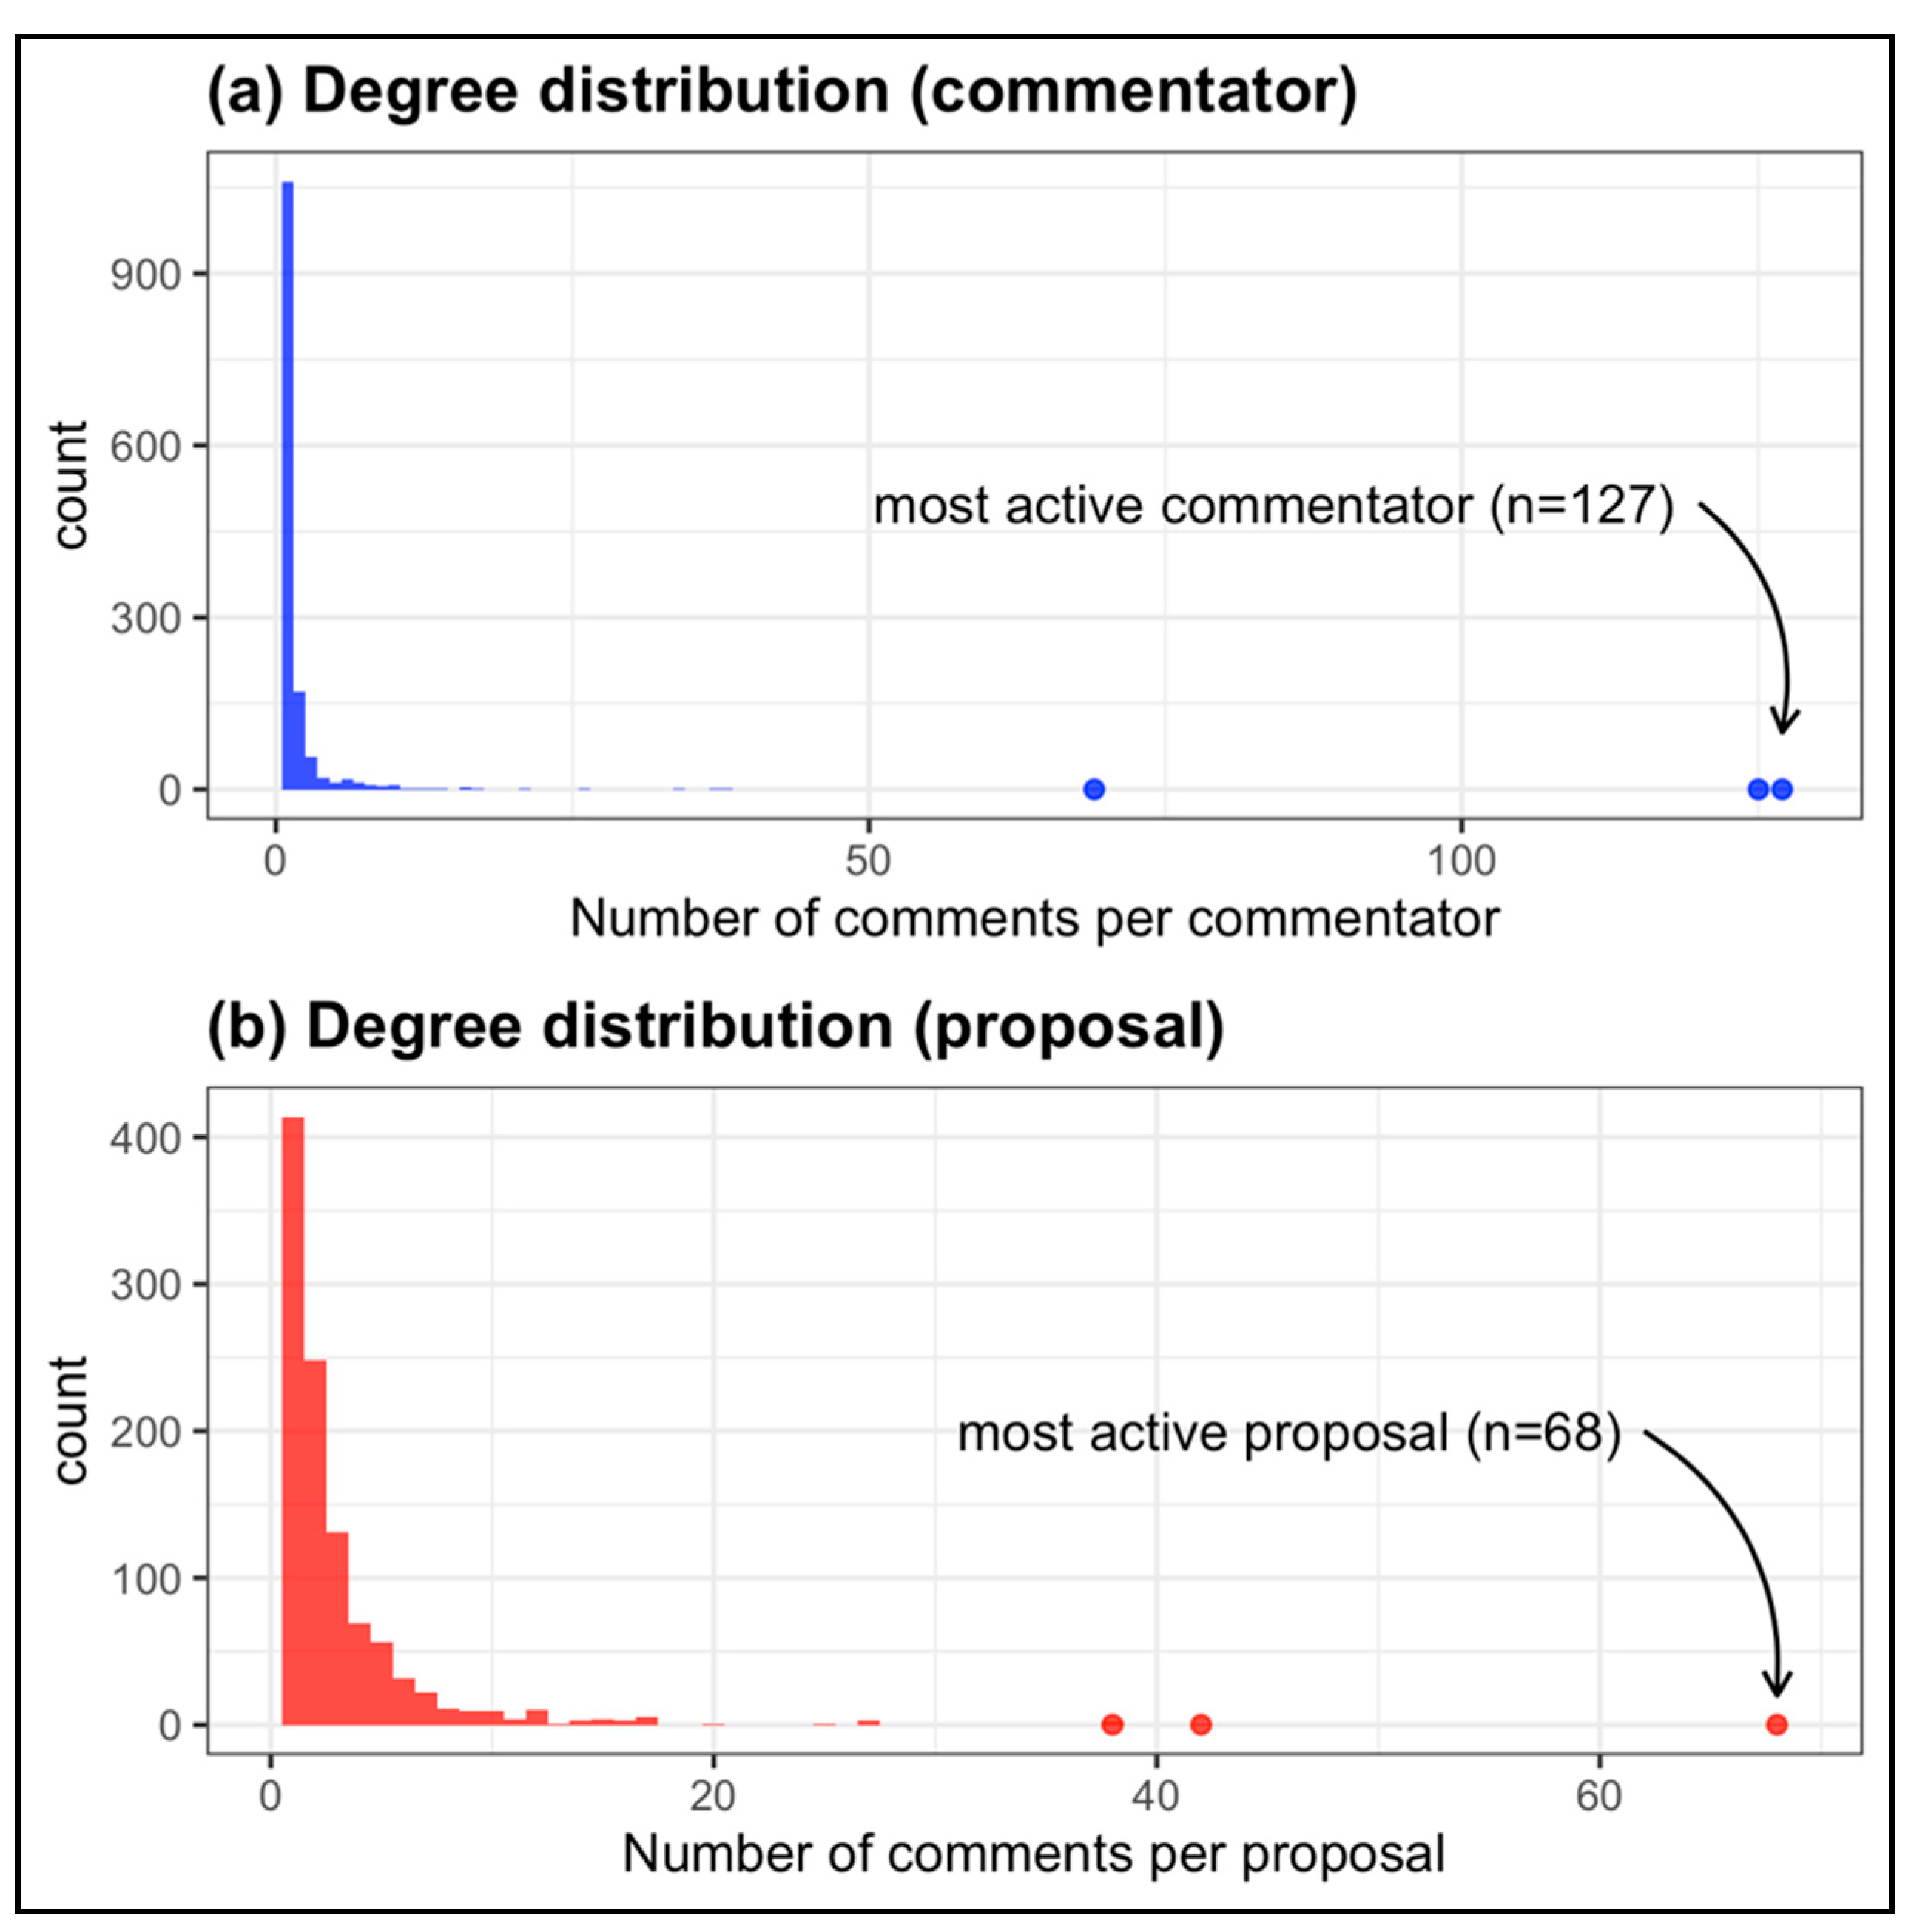
This article focuses on networks of two selected inner-city areas, the southeast and central areas, to investigate commentators’ inter-linkedness. In their final evaluation report on OmaStadi 2018–2020, Rask et al. [76] found fierce competition between supporters of proposals in these two areas. In the southeastern area, there were competing demands to renovate the Aino Ackté villa (a historical villa that commemorates soprano singer Aino Ackté) and to install a new artificial turf in the Herttoniemi sports park. The renovation for the villa finally received 2727 votes, while the artificial turf received 2710. In the central area, a similar competition was found between a proposal for artificial turf in Arabianranta and the regeneration of a historical Vallila workshop area, in which the former received 2870 votes, and the latter received 2784 votes.
In the voting stage, the city government used a vote visualization system that displayed real-time information on which proposals were leading. Unlike those voting in libraries and other public spaces, residents who voted through their own electronic devices could change their votes again during the one-month voting stage. The combination of the competing proposals and voting system sparked wait-and-see voting behaviors until the last minute. As a result, voter turnouts in the two areas were significantly higher than in other areas. Turnout in the southeastern area was three times higher than that in the eastern area [76].
Based on this context, we investigated discussion networks related to these two areas using a social network analysis. Table 2 shows that the discussion networks of the southeast and central areas took up 30.6% of total active commentators, 21.6% of all proposals and plans, and 22.7% of the total number of comments. This result indicates that these two areas were relatively more vibrant than the other six areas. Moreover, mean number of comments per commentator in these two areas were slightly lower than the average, indicating that residents participated more equally in online discussions. In contrast, mean number of comments per proposal in the two areas were higher than the average, indicating that proposals received more comments in these areas. Overall, the two areas’ discussion networks were characterized by the active and broad involvement of residents.
Next, we further investigated these two areas’ networks using network visualization, as shown in Figure 7. Unlike the qualitative investigation by Rask et al. [76], we could not identify clear patterns of network evolution. This result implies that residents might not have considered the platform of OmaStadi as a preferred place for discussion compared to other private platforms, such as Facebook or Twitter. However, Figure 7 still shows a hidden pattern of interactions to be noted. In Figure 7, circles denote actors, and squares denote proposals or plans (red: “impossible” proposals; green: “possible” proposals; yellow: plans). Recall that residents who entered into a voting system were allowed to read and vote among 336 plans (yellow squares).
In the proposal stage, residents tended to engage with both “impossible” and “possible” proposals; then, they started to focus on discussions for “possible” proposals and plans in the co-creation stage. This trend of a transition from “impossible” proposals (red squares) to plans (yellow squares) implies that residents understood the mechanism of OmaStadi and strategically chose which proposals were worth focusing on. Moreover, residents who participated in proposals for the southeast formed two polarized subgroups, which requires further investigation for the context. Logically, one would expect residents to continue to engage in plans during the voting stage. However, we observed two abnormal patterns. First, residents moved back to a few proposals and continued discussions, which are not displayed in the voting system. Second, compared to the clustered interactions shown in the co-creation stage, interactions between the proposals were hardly observed in the voting stage, indicating that their supporters discussed in separate forums. Overall, this result shows that interactive patterns of deliberation tend to be fragmented rather than inter-linked across groups in competitive situations, which raises a question about the efficacy of the decentralized system of OmaStadi: does the deliberative system consisting of 1609 separated spaces (1273 proposals plus 336 plans) provide practical ways for residents to discuss local matters collectively? Moreover, when conflictual issues occur, does the system provide an integrated space to exchange reasonable arguments and resolve conflicts?

5.6. Commitment

Another crucial deliberative quality indicator is commitment, which measures the degree to which commentators and proposals are evenly distributed. In network theory, degree refers to the number of links through which a given node has connected with other nodes. In our case, the term degree denotes the number of online comments. Most social networks show a highly right-skewed degree distribution, where a majority of nodes exhibit a small number of degrees with a handful of highly active nodes (e.g., social influencers) [85]. Our case did not deviate from this tendency. Figure 8a shows that most commentators made fewer than two comments in an entire process, 1.96 comments on average (sd: 5.69) with 16.9 skewness. The highest degree was 127 made by one individual, indicating an extremely active participant. Similarly, Figure 8b shows that proposals received 2.61 comments on average (sd: 3.42) with 8.4 skewness. The highest degree was 68, also indicating the existence of a few popular proposals. We do not consider these extreme cases of commentators and proposals to be inherently problematic. Instead, we argue for the importance of promoting inactive actors’ participation to make their voices heard and reflected in deliberation processes.

6. Discussion

As online deliberation results in a large amount of user-generated discussion data, traditional human coding for assessing deliberative quality is impracticable. A growing body of research has attempted to overcome this limitation by employing automated computational methods, including natural language processing and social network analysis. While this has opened up a promising research agenda, time-series data and associated analysis have been less studied. Time is a crucial dimension of deliberation because deliberation is a communicative process, the quality of which might change over time.
To fill this gap, we proposed throughput indicators for assessing online deliberative quality using network analysis and time-series analysis, arguing that the combination will help actors monitor how online deliberation evolves. Throughput indicators that focus on assessing the deliberation process could be communicative and intuitive to facilitate deliberation among actors and build the capacity to cope with various governance challenges. Based on Fishkin’s framework [60], we developed the six indicators of participation rate, activeness, continuity, responsiveness, inter-linkedness, and commitment, and then demonstrated their application with the empirical case of OmaStadi participatory budgeting in Helsinki. This was a pilot project in which residents could initiate proposals, develop them together, and vote for desirable proposals on a digital platform.
Table 3 summarizes the description and the usefulness of each indicator. By analyzing the online data of OmaStadi, we first found that 0.4% of Helsinki residents participated in online deliberation based on the participation rate; this is useful in assessing the representativeness of online deliberation. Second, among those participants, 60.7% of residents made comments at least once, and 64.6% of proposals received comments at least once during the entire process with a −0.053 linear decreasing trend based on activeness; this is useful in assessing the degree to which residents actively engaged in online deliberation processes and its longitudinal trend. Third, we found that 32.5% of the investigation period recorded zero participation in online deliberation based on continuity; this is useful in assessing the extent to which residents consistently participate. Fourth, we found that 13.7% of comments were replies, indicating the prevalence of messages receiving no reply, based on responsiveness; this can be used to assess how many online communications were reciprocated. Fifth, we focused on discussion networks in two areas where intense competition occurred and found intense and fragmented discussion patterns based on inter-linkedness; this is useful in examining discussion networks’ structural properties, especially communications between and within different subgroups. Sixth, we found that residents made 1.96 comments and proposals received 2.6 comments on average, while there were a few highly active cases based on commitment; this is useful to monitor unequal involvement in online deliberation.
These results answer the three research questions. The first question was about how the quality of online deliberation could be monitored on government-run platforms. We proposed automated throughput indicators that produce replicable results as an alternative to traditional manual coding schemes. In particular, we shed light on the importance of the time dimension and provide a novel approach for combining social network analysis and time-series analysis. The results demonstrated that online deliberation reflects formal governance processes, particularly on a government-run platform.
The second question was about what new indicators could support such monitoring by applying a network analysis and time-series analysis. We proposed six throughput indicators, as summarized above, which revealed substantial evidence regarding what transpires online.
The third question was about how the proposed indicators could help to develop more resilient governance practices. We summarize two main points. First, by considering the time dimension, the indicators could be used as a monitoring tool for keeping track of dynamic deliberation processes, which promote resilient governance capacity. Since the automated indicators can be produced rapidly, they can be used during ongoing deliberation processes. Second, the indicators help detect possible conflictual groups and facilitate discussion between them by focusing on the interaction dimension. Online deliberation does not automatically facilitate harmonious and integrated decision-making; instead, it could exacerbate polarization if manipulated by deepfakes and disinformation [87]. The time and interaction dimensions are crucial to monitoring the possible defects of online deliberation.
Based on these findings, we end this article by suggesting future research. One of the urgent research agendas is to develop a comprehensive framework that coherently connects multiple indicators to zoom in and out of multi-layered governance [88]. Under the framework, the next issue is to develop automated indicators by combining natural language processing, network analysis, time-series analysis, and other methods. Although these analyses have been developed in Mathematics, Physics, and Computer Sciences using distinct data collection strategies, online environments today often generate all data types. As an applied science, online deliberation research should combine multiple methods to investigate different aspects of the same empirical phenomenon. Lastly, future research should develop automated indicators that complement qualitative investigation. It is important to note that automated indicators are not the end of democratic assessment but the start of collective learning. The proposed indicators generate quantified results but do not answer how and why. Without considering context, automated quality indicators are mere numbers. We suggest that future research develop automated indicators as a tool for generating in-depth questions that will facilitate deliberation for improving a deliberative system, rather than answers. It is not unilateral communication; researchers could provide timely indicators, but the readers of these results probably know the local context better, and can better interpret the results. Public managers (e.g., borough liaisons in this case) can also pinpoint where to concentrate public resources to facilitate public deliberation. This co-learning combined with a trial-and-error process will strengthen the resilience of governance as a collective capacity.

Author Contributions

Conceptualization, B.S. and M.R.; methodology, B.S. and M.R.; software, B.S.; validation, B.S. and M.R.; formal analysis, B.S.; investigation, B.S. and M.R.; resources, B.S.; data curation, B.S.; writing—original draft preparation, B.S.; writing—review and editing, B.S. and M.R.; visualization, B.S.; supervision, M.R.; project administration, M.R.; funding acquisition, M.R. All authors have read and agreed to the published version of the manuscript.

Funding

This research was funded by NordForsk and the Academy of Finland, through the COLDIGIT project (no: 100855).

Institutional Review Board Statement

Not applicable for studies not involving humans or animals.

Informed Consent Statement

Not applicable for studies not involving humans or animals.

Data Availability Statement

The data presented in this study are available on request from the corresponding author. The data are not publicly available due to privacy concerns but will be shared under the data management plan of the COLDIGIT project (https://blogs.helsinki.fi/collective-intelligence-through-digital-tools-coldigit).

Conflicts of Interest

The authors declare no conflict of interest. The funders had no role in the design of the study; in the collection, analyses, or interpretation of data; in the writing of the manuscript, or in the decision to publish the results.

References

  1. Rask, M.; Mačiukaitė-Žvinienė, S.; Tauginienė, L.; Dikčius, V.; Matschoss, K.; Aarrevaara, T.; D’Andrea, L. Public Participation, Science and Society: Tools for Dynamic and Responsible Governance of Research and Innovation; Routledge: London, UK; New York, NY, USA, 2018. [Google Scholar]
  2. Lange, P.; Driessen, P.P.J.; Sauer, A.; Bornemann, B.; Burger, P. Governing Towards Sustainability—Conceptualizing Modes of Governance. J. Environ. Policy Plan. 2013, 15, 403–425. [Google Scholar]
  3. Loorbach, D.; Wittmayer, J.M.; Shiroyama, H.; Fujino, J.; Mizuguchi, S. Governance of Urban Sustainability Transitions; Springer: Berlin/Heidelberg, Germany, 2016. [Google Scholar]
  4. Torfing, J.; Sørensen, E.; Røiseland, A. Transforming the Public Sector Into an Arena for Co-Creation: Barriers, Drivers, Benefits, and Ways Forward. Adm. Soc. 2019, 51, 795–825. [Google Scholar] [CrossRef]
  5. Toikka, A. Exploring the Composition of Communication Networks of Governance—A Case Study on Local Environmental Policy in Helsinki, Finland. Environ. Policy Gov. 2010, 20, 135–145. [Google Scholar]
  6. Borg, R.; Toikka, A.; Primmer, E. Social Capital and Governance: A Social Network Analysis of Forest Biodiversity Collaboration in Central Finland. For. Policy Econ. 2014, 50, 1–9. [Google Scholar]
  7. Ansell, C.; Torfing, J. Handbook on Theories of Governance; Edward Elgar Publishing: Cheltenham, UK, 2016. [Google Scholar]
  8. Colantonio, A.; Dixon, T. Urban Regeneration and Social Sustainability: Best Practice from European Cities; Wiley-Blackwell: Oxford, UK, 2011. [Google Scholar]
  9. Eizenberg, E.; Jabareen, Y. Social Sustainability: A New Conceptual Framework. Sustainability 2017, 9, 68. [Google Scholar]
  10. Van Zeijl-Rozema, A.; Cörvers, R.; Kemp, R.; Martens, P. Governance for Sustainable Development: A Framework. Sustain. Dev. 2008, 16, 410–421. [Google Scholar] [CrossRef]
  11. Healey, P. Transforming Governance: Challenges of Institutional Adaptation and a New Politicalcs of Space. Eur. Plan. Stud. 2006, 14, 299–320. [Google Scholar] [CrossRef]
  12. Klijn, E.-H.; Koppenjan, J. Governance Network Theory: Past, Present and Future. Policy Politicalcs 2012, 40, 587–606. [Google Scholar] [CrossRef] [Green Version]
  13. Jessop, B. The Rise of Governance and the Risks of Failure: The Case of Economic Development. Int. Soc. Sci. J. 1998, 50, 29–45. [Google Scholar] [CrossRef]
  14. Alibašić, H. Sustainability and Resilience Planning for Local Governments: The Quadruple Bottom Line Strategy; Springer: Cham, Switzerland, 2018. [Google Scholar]
  15. Meuleman, L. Public Management and the Metagovernance of Hierarchies, Networks and Markets: The Feasibility of Designing and Managing Governance Style Combinations; Physica-Verlag: Leipzig, Germany, 2008. [Google Scholar]
  16. Voorberg, W.H.; Bekkers, V.J.J.M.; Tummers, L.G. A Systematic Review of Co-Creation and Co-Production: Embarking on the Social Innovation Journey. Public Manag. Rev. 2015, 17, 1333–1357. [Google Scholar]
  17. Healey, P. Collaborative Planning: Shaping Places in Fragmented Societies; Palgrave Macmillan: New York, NY, USA, 1997. [Google Scholar]
  18. Hajer, M.A.; Wagenaar, H. Deliberative Policy Analysis: Understanding Governance in the Network Society; Cambridge University Press: New York, NY, USA, 2003. [Google Scholar]
  19. McLaverty, P.; Halpin, D. Deliberative Drift: The Emergence of Deliberation in the Policy Process. Int. Politicalcal Sci. Rev. 2008, 29, 197–214. [Google Scholar] [CrossRef] [Green Version]
  20. Innes, J.E.; Booher, D.E. Reframing Public Participation: Strategies for the 21st Century. Plan. Theory Pract. 2004, 5, 419–436. [Google Scholar] [CrossRef]
  21. Duit, A.; Galaz, V.; Eckerberg, K.; Ebbesson, J. Governance, Complexity, and Resilience. Glob. Environ. Chang. 2010, 20, 363–368. [Google Scholar] [CrossRef]
  22. Skondras, N.A.; Tsesmelis, D.E.; Vasilakou, C.G.; Karavitis, C.A. Resilience–Vulnerability Analysis: A Decision-Making Framework for Systems Assessment. Sustainability 2020, 12, 9306. [Google Scholar] [CrossRef]
  23. Capano, G.; Woo, J.J. Resilience and Robustness in Policy Design: A Critical Appraisal. Policy Sci. 2017, 50, 399–426. [Google Scholar] [CrossRef]
  24. Chadwick, A. Bringing E-Democracy Back In: Why It Matters for Future Research on E-Governance. Soc. Sci. Comput. Rev. 2003, 21, 443–455. [Google Scholar] [CrossRef]
  25. Dawes, S.S. The Evolution and Continuing Challenges of E-Governance. Public Adm. Rev. 2008, 68, S86–S102. [Google Scholar] [CrossRef]
  26. Shane, P.M. Democracy Online: The Prospects for Politicalcal Renewal through the Internet; Routledge: New York, NY, USA; London, UK, 2004. [Google Scholar]
  27. Friess, D.; Eilders, C. A Systematic Review of Online Deliberation Research. Policy Internet 2015, 7, 319–339. [Google Scholar] [CrossRef]
  28. Janssen, D.; Kies, R. Online Forums and Deliberative Democracy. Acta Polít. 2005, 40, 317–335. [Google Scholar] [CrossRef]
  29. Lahlou, S. Digitization and Transmission of Human Experience. Soc. Sci. Inf. 2010, 49, 291–327. [Google Scholar] [CrossRef] [Green Version]
  30. Meijer, A.; Bolívar, M.P.R. Governing the Smart City: A Review of the Literature on Smart Urban Governance. Int. Rev. Adm. Sci. 2016, 82, 392–408. [Google Scholar] [CrossRef]
  31. Connelly, R.; Playford, C.J.; Gayle, V.; Dibben, C. The Role of Administrative Data in the Big Data Revolution in Social Science Research. Soc. Sci. Res. 2016, 59, 1–12. [Google Scholar] [CrossRef] [PubMed] [Green Version]
  32. Höchtl, J.; Parycek, P.; Schöllhammer, R. Big Data in the Policy Cycle: Policy Decision Making in the Digital Era. J. Organ. Comput. Electron. Commer. 2016, 26, 147–169. [Google Scholar] [CrossRef]
  33. Jonsson, M.E.; Åström, J. The Challenges for Online Deliberation Research: A Literature Review. Int. J. E-Politicals 2014, 5, 1–15. [Google Scholar] [CrossRef] [Green Version]
  34. Strandberg, K.; Grönlund, K. Online deliberation. In The Oxford Handbook of Deliberative Democracy; Bächtiger, A., Dryzek, J.S., Mansbridge, J., Warren, M., Eds.; Oxford University Press: Oxford, UK, 2018; pp. 365–377. [Google Scholar]
  35. Esau, K.; Fleuß, D.; Nienhaus, S. Different Arenas, Different Deliberative Quality? Using a Systemic Framework to Evaluate Online Deliberation on Immigration Policy in Germany. Policy Internet 2020, 1–27. [Google Scholar] [CrossRef] [Green Version]
  36. Esau, K.; Friess, D.; Eilders, C. Design Matters! An Empirical Analysis of Online Deliberation on Different News Platforms. Policy Internet 2017, 9, 321–342. [Google Scholar] [CrossRef]
  37. Escher, T.; Friess, D.; Esau, K.; Sieweke, J.; Tranow, U.; Dischner, S.; Hagemeister, P.; Mauve, M. Online Deliberation in Academia: Evaluating the Quality and Legitimacy of Cooperatively Developed University Regulations. Policy Internet 2017, 9, 133–164. [Google Scholar]
  38. Black, L.W.; Welser, H.T.; Cosley, D.; DeGroot, J.M. Self-Governance Through Group Discussion in Wikipedia: Measuring Deliberation in Online Groups. Small Gr. Res. 2011, 42, 595–634. [Google Scholar] [CrossRef] [Green Version]
  39. Zhang, W.; Cao, X.; Tran, M.N. The Structural Features and the Deliberative Quality of Online Discussions. Telemat. Inform. 2013, 30, 74–86. [Google Scholar] [CrossRef]
  40. Jennstål, J. Deliberation and Complexity of Thinking. Using the Integrative Complexity Scale to Assess the Deliberative Quality of Minipublics. Swiss Political Sci. Rev. 2019, 25, 64–83. [Google Scholar] [CrossRef]
  41. Steenbergen, M.R.; Bächtiger, A.; Spörndli, M.; Steiner, J. Measuring Politicalcal Deliberation: A Discourse Quality Index. Comp. Eur. Politicalcs 2003, 1, 21–48. [Google Scholar] [CrossRef]
  42. Beauchamp, N. Modeling and Measuring Deliberation Online. In The Oxford Handbook of Networked Communication; Foucault, B., González-Bailón, S., Eds.; Oxford University Press: New York, NY, USA, 2018; pp. 322–349. [Google Scholar]
  43. Iliev, R.; Dehghani, M.; Sagi, E. Automated Text Analysis in Psychology: Methods, Applications, and Future Developments. Lang. Cogn. 2015, 7, 265–290. [Google Scholar] [CrossRef] [Green Version]
  44. Himelboim, I. Civil Society and Online Politicalcal Discourse: The Network Structure of Unrestricted Discussions. Communic. Res. 2011, 38, 634–659. [Google Scholar] [CrossRef]
  45. Choi, S. Flow, Diversity, Form, and Influence of Politicalcal Talk in Social-Media-Based Public Forums. Hum. Commun. Res. 2014, 40, 209–237. [Google Scholar] [CrossRef]
  46. Gonzalez-Bailon, S.; Kaltenbrunner, A.; Banchs, R.E. The Structure of Politicalcal Discussion Networks: A Model for the Analysis of Online Deliberation. J. Inf. Technol. 2010, 25, 230–243. [Google Scholar] [CrossRef]
  47. Walker, M.A.; Tree, J.E.F.; Anand, P.; Abbott, R.; King, J. A Corpus for Research on Deliberation and Debate. In Proceedings of the LREC, Istanbul, Turkey, 23–25 May 2012; Volume 12, pp. 812–817. [Google Scholar]
  48. Fournier-Tombs, E.; Di Marzo Serugendo, G. DelibAnalysis: Understanding the Quality of Online Politicalcal Discourse with Machine Learning. J. Inf. Sci. 2020, 46, 810–922. [Google Scholar] [CrossRef]
  49. Habermas, J. The Theory of Communicative Action, Volume 1; Beacon Press: Boston, MA, USA, 1984. [Google Scholar]
  50. Habermas, J. The Theory of Communicative Action, Volume 2; Beacon Press: Boston, MA, USA, 1987. [Google Scholar]
  51. Habermas, J. Three Normative Models of Democracy. Constellations 1994, 1, 1–10. [Google Scholar] [CrossRef]
  52. Goode, L. Jürgen Habermas: Democracy and the Public Sphere; Pluto Press: London, UK, 2005. [Google Scholar]
  53. Rittel, H.W.J.; Webber, M.M. Dilemmas in a General Theory of Planning. Policy Sci. 1973, 4, 155–169. [Google Scholar] [CrossRef]
  54. Cohen, J. Deliberation and Democratic Legitimacy. In Debates in Contemporary Politicalcal Philosophy: An Anthology; Derek, M., Pike, J., Eds.; Routledge: London, UK; New York, NY, USA, 2003; pp. 342–360. [Google Scholar]
  55. Fishkin, J.S.; Laslett, P. Debating Deliberative Democracy; Blackwell Publishing: Boston, MA, USA, 2003. [Google Scholar]
  56. Gastil, J.; Dillard, J.P. Increasing Politicalcal Sophistication through Public Deliberation. Political Commun. 1999, 16, 3–23. [Google Scholar] [CrossRef]
  57. Coleman, S.; Moss, G. Under Construction: The Field of Online Deliberation Research. J. Inf. Technol. Politicalcs 2012, 9, 1–15. [Google Scholar] [CrossRef]
  58. Stromer-Galley, J. Measuring Deliberation’s Content: A Coding Scheme. J. Public Delib. 2007, 3, 12. [Google Scholar]
  59. Dahlberg, L. The Internet and Democratic Discourse: Exploring the Prospects of Online Deliberative Forums Extending the Public Sphere. Inf. Commun. Soc. 2001, 4, 615–633. [Google Scholar] [CrossRef]
  60. Fishkin, J.S. When the People Speak: Deliberative Democracy and Public Consultation; Oxford University Press: Oxford, UK, 2009. [Google Scholar]
  61. Gastil, J.; Black, L. Public Deliberation as the Organizing Principle of Politicalcal Communication Research. J. Public Delib. 2008, 4, 1–49. [Google Scholar]
  62. Dahlberg, L. Net-Public Sphere Research: Beyond the “First Phase”. Public 2004, 11, 27–43. [Google Scholar] [CrossRef]
  63. Halpern, D.; Gibbs, J. Social Media as a Catalyst for Online Deliberation? Exploring the Affordances of Facebook and YouTube for Politicalcal Expression. Comput. Huma. Behav. 2013, 29, 1159–1168. [Google Scholar] [CrossRef]
  64. Himmelroos, S. Discourse Quality in Deliberative Citizen Forums-A Comparison of Four Deliberative Mini-publics. J. Public Delib. 2017, 13, 1–28. [Google Scholar] [CrossRef]
  65. Aragón, P.; Kaltenbrunner, A.; Calleja-López, A.; Pereira, A.; Monterde, A.; Barandiaran, X.E.; Gómez, V. Deliberative Platform Design: The Case Study of the Online Discussions in Decidim Barcelona. In Proceedings of the International Conference on Social Informatics, Oxford, UK, 13–15 September 2017; pp. 277–287. [Google Scholar]
  66. Gold, V.; El-Assady, M.; Hautli-Janisz, A.; Bögel, T.; Rohrdantz, C.; Butt, M.; Holzinger, K.; Keim, D. Visual Linguistic Analysis of Politicalcal Discussions: Measuring Deliberative Quality. Digit. Scholarsh. Humanit. 2017, 32, 141–158. [Google Scholar] [CrossRef] [Green Version]
  67. Parthasarathy, R.; Rao, V.; Palaniswamy, N. Deliberative Democracy in an Unequal World: A Text-As-Data Study of South India’s Village Assemblies. Am. Politicalcal Sci. Rev. 2019, 113, 623–640. [Google Scholar] [CrossRef]
  68. Muñiz, C.; Campos-Domínguez, E.; Saldierna, A.R.; Dader, J.L. Engagement of Politicalcians and Citizens in the Cyber Campaign on Facebook: A Comparative Analysis Between Mexico and Spain. Contemp. Soc. Sci. 2019, 14, 102–113. [Google Scholar] [CrossRef]
  69. Giraldo Luque, S.; Villegas Simon, I.; Duran Becerra, T. Use of the Websites of Parliaments to Promote Citizen Deliberation in the Process of Public Decision-making: Comparative Study of Ten Countries (America and Europe). Commun. Soc. 2017, 30, 77–97. [Google Scholar]
  70. Campos-Domínguez, E.; Calvo, D. Participation and Topics of Discussion of Spaniards in the Digital Public Sphere. Commun. Soc. 2016, 29, 219–232. [Google Scholar]
  71. Rowe, I. Deliberation 2.0: Comparing the Deliberative Quality of Online News User Comments Across Platforms. J. Broadcast. Electron. Media 2015, 59, 539–555. [Google Scholar]
  72. Habermas, J. Moral Consciousness and Communicative Action; MIT Press: Cambridge, MA, USA, 1990. [Google Scholar]
  73. Beierle, T.C. Digital Deliberation: Engaging the Public Through Online Policy Dialogues. In Democracy Online: The Prospects for Politicalcal Renewal through the Internet; Shane, P., Ed.; Routledge: London, UK, 2004; pp. 155–166. [Google Scholar]
  74. Coleman, S.; Shane, P.M. Connecting Democracy: Online Consultation and the Flow of Politicalcal Communication; MIT Press: Cambridge, MA, USA, 2012. [Google Scholar]
  75. Peña-López, I. Decidim. Barcelona, Spain: Voice or Chatter? IT for Change: Bangalore, India, 2017. [Google Scholar]
  76. Rask, M.; Ertiö, T.-P.; Tuominen, P.; Ahonen, V. The Final Evaluation of the City of Helsinki Participatory Budgeting. OmaStadi 2018-2020 (Helsingin Kaupungin Osallistuvan Budjetoinnin Loppuarviointi. OmaStadi 2018-2020, in Finnish Only); BIBU: Helsinki, Finland, 2021; Available online: https://bibu.fi/osallistuvan-budjetoinnin-loppuarviointi/ (accessed on 13 January 2021).
  77. Ertiö, T.-P.; Tuominen, P.; Rask, M. Turning Ideas into Proposals: A Case for Blended Participation During the Participatory Budgeting Trial in Helsinki. In Electronic Participation, Proceedings of the International Conference, ePart 2019, San Benedetto Del Tronto, Italy, 2–4 September 2019; Panagiotopoulos, P., Edelmann, N., Glassey, O., Misuraca, G., Parycek, P., Lampoltshammer, T., Re, B., Eds.; Panagiotopoulos, P., Edelmann, N., Glassey, O., Misuraca, G., Parycek, P., Lampoltshammer, T., Re, B., Eds.; Springer: Cham, Switzerland, 2019; pp. 15–25. [Google Scholar]
  78. Finnish National Board on Research Integrity. The Ethical Principles of Research with Human Participants and Ethical Review in the Human Sciences in Finland; Finnish National Board on Research Integrity: Helsinki, Finland, 2019. [Google Scholar]
  79. Wasserman, S.; Faust, K. Social Network Analysis: Methods and Applications; Cambridge University Press: Cambridge, UK, 1994. [Google Scholar]
  80. Newman, M. Networks: An Introduction; Oxford University Press: Oxford, UK, 2010. [Google Scholar]
  81. Hamilton, J.D. Time Series Analysis; Princeton University Press: Princeton, NJ, USA, 1994. [Google Scholar]
  82. Montgomery, D.C.; Jennings, C.L.; Kulahci, M. Introduction to Time Series Analysis and Forecasting; John Wiley & Sons: Hoboken, NJ, USA, 2015. [Google Scholar]
  83. Campanharo, A.S.L.O.; Sirer, M.I.; Malmgren, R.D.; Ramos, F.M.; Amaral, L.A.N. Duality Between Time Series and Networks. PLoS ONE 2011, 6, e23378. [Google Scholar]
  84. Vasques Filho, D.; O’Neale, D.R.J. Degree Distributions of Bipartite Networks and their Projections. Phys. Rev. E 2018, 98, 022307. [Google Scholar] [PubMed] [Green Version]
  85. Egelston, A.; Cook, S.; Nguyen, T.; Shaffer, S. Networks for the Future: A Mathematical Network Analysis of the Partnership Data for Sustainable Development Goals. Sustainability 2019, 11, 5511. [Google Scholar] [CrossRef] [Green Version]
  86. Krispin, R. Hands-On Time Series Analysis with R: Perform. Time Series Analysis and Forecasting using R; Packt: Birmingham, UK, 2019. [Google Scholar]
  87. Vaccari, C.; Chadwick, A. Deepfakes and Disinformation: Exploring the Impact of Synthetic Politicalcal Video on Deception, Uncertainty, and Trust in News. Soc. Media Soc. 2020, 6, 1–13. [Google Scholar]
  88. Rask, M.; Ertiö, T.-P. The Co-creation Radar: A Comprehensive Public Participation Evaluation Model. Helsinki. 2019. Available online: https://bibu.fi/policy-brief-the-co-creation-radar-a-comprehensive-public-participation-evaluation-model/ (accessed on 13 January 2021).
Figure 1. An example of a proposal (ehdotus). Note: This figure shows an actual web page of a resident-initiated proposal. A resident proposed the idea of making a walking path from Kirsikka park to Roihuvuori water tower. This idea was marked as a possible proposal (Mahdollinen, marked with a green label) and received 11 comments during the deliberative process. Each comment has a timestamp that has been used to construct time-series data.
Sustainability 13 01187 g001
Figure 2. (a) A network graph; (b) a time-series graph. While the former is useful in analyzing a system’s properties (e.g., patterns of interactions), the latter is useful in analyzing the system’s evolution (e.g., trend and forecasting).
Sustainability 13 01187 g002
Figure 3. (a) Proportion of active commentators; (b) proportion of active proposals (plans).
Sustainability 13 01187 g003
Figure 4. Online comments by day. Note: red dots indicate offline meeting dates; a blue dotted line shows a smoothed trend using a two-side moving average; shaded areas demarcate deliberative stages.
Sustainability 13 01187 g004
Figure 5. Continuity. Note: 1 if there was any comment made on a given day; 0, otherwise.
Sustainability 13 01187 g005
Figure 6. Responsiveness. Note: the green area indicates the number of total comments; the red area indicates the number of replies.
Sustainability 13 01187 g006
Figure 7. Network visualization of two selected areas. Note: grey circles denote commentators; red squares denote “impossible” proposals; green squares denote “possible” proposals; yellow squares denote plans.
Sustainability 13 01187 g007
Figure 8. (a) Degree distribution (commentator); (b) degree distribution (proposal).
Sustainability 13 01187 g008
Table 1. Deliberative Quality Indicators.
IndicatorDescriptionMeasurement
Participation dimension (volume of deliberation)
Participation rateThe proportion of residents who registered with an online deliberative system# total IDs/population
ActivenessA longitudinal change in active commentators, proposals, and comments# active IDs/# total IDs
(two-sided) moving average
ContinuityThe extent of consistency in participation# active days/# entire days
Deliberation dimension (interaction in deliberation)
ResponsivenessThe proportion of replies in online comments# replies/# comments
Inter-linkednessInteractive patterns among actors and proposalsNetwork properties
CommitmentVariability of the degree of engagementDegree distribution
Table 2. Discussion Networks of two selected areas.
Statistic SoutheastCentralTotal
% of active commentators13.8% (n = 192)16.8% (n = 232)1385
% of active proposals and plans9.6% (n = 100)12% (n = 125)1040
% of comments11.1% (n = 354)11.6% (n = 368)3188
Mean number of comments per commentator1.601.431.96
Mean number of comments per proposal3.072.662.61
Table 3. Deliberative quality indicators and their usefulness.
IndicatorDescriptionUsefulness for Deliberative Quality Assessment
Participation dimension (volume of deliberation)
Participation rateThe proportion of residents who registered with an online deliberative systemRepresentativeness
ActivenessA longitudinal change in active commentators, proposals, and commentsActiveness
ContinuityThe extent of consistency in participationConsistency
Deliberation dimension (interaction in deliberation)
ResponsivenessThe proportion of replies in online commentsReciprocity
Inter-linkednessInteractive patterns among actors and proposalsStructural property
CommitmentVariability of the degree of engagementEqual involvement
Publisher’s Note: MDPI stays neutral with regard to jurisdictional claims in published maps and institutional affiliations.

