Regional Coordination and Security of Water–Energy–Food Symbiosis in Northeastern China


Abstract
:1. Introduction
2. Data and Methods
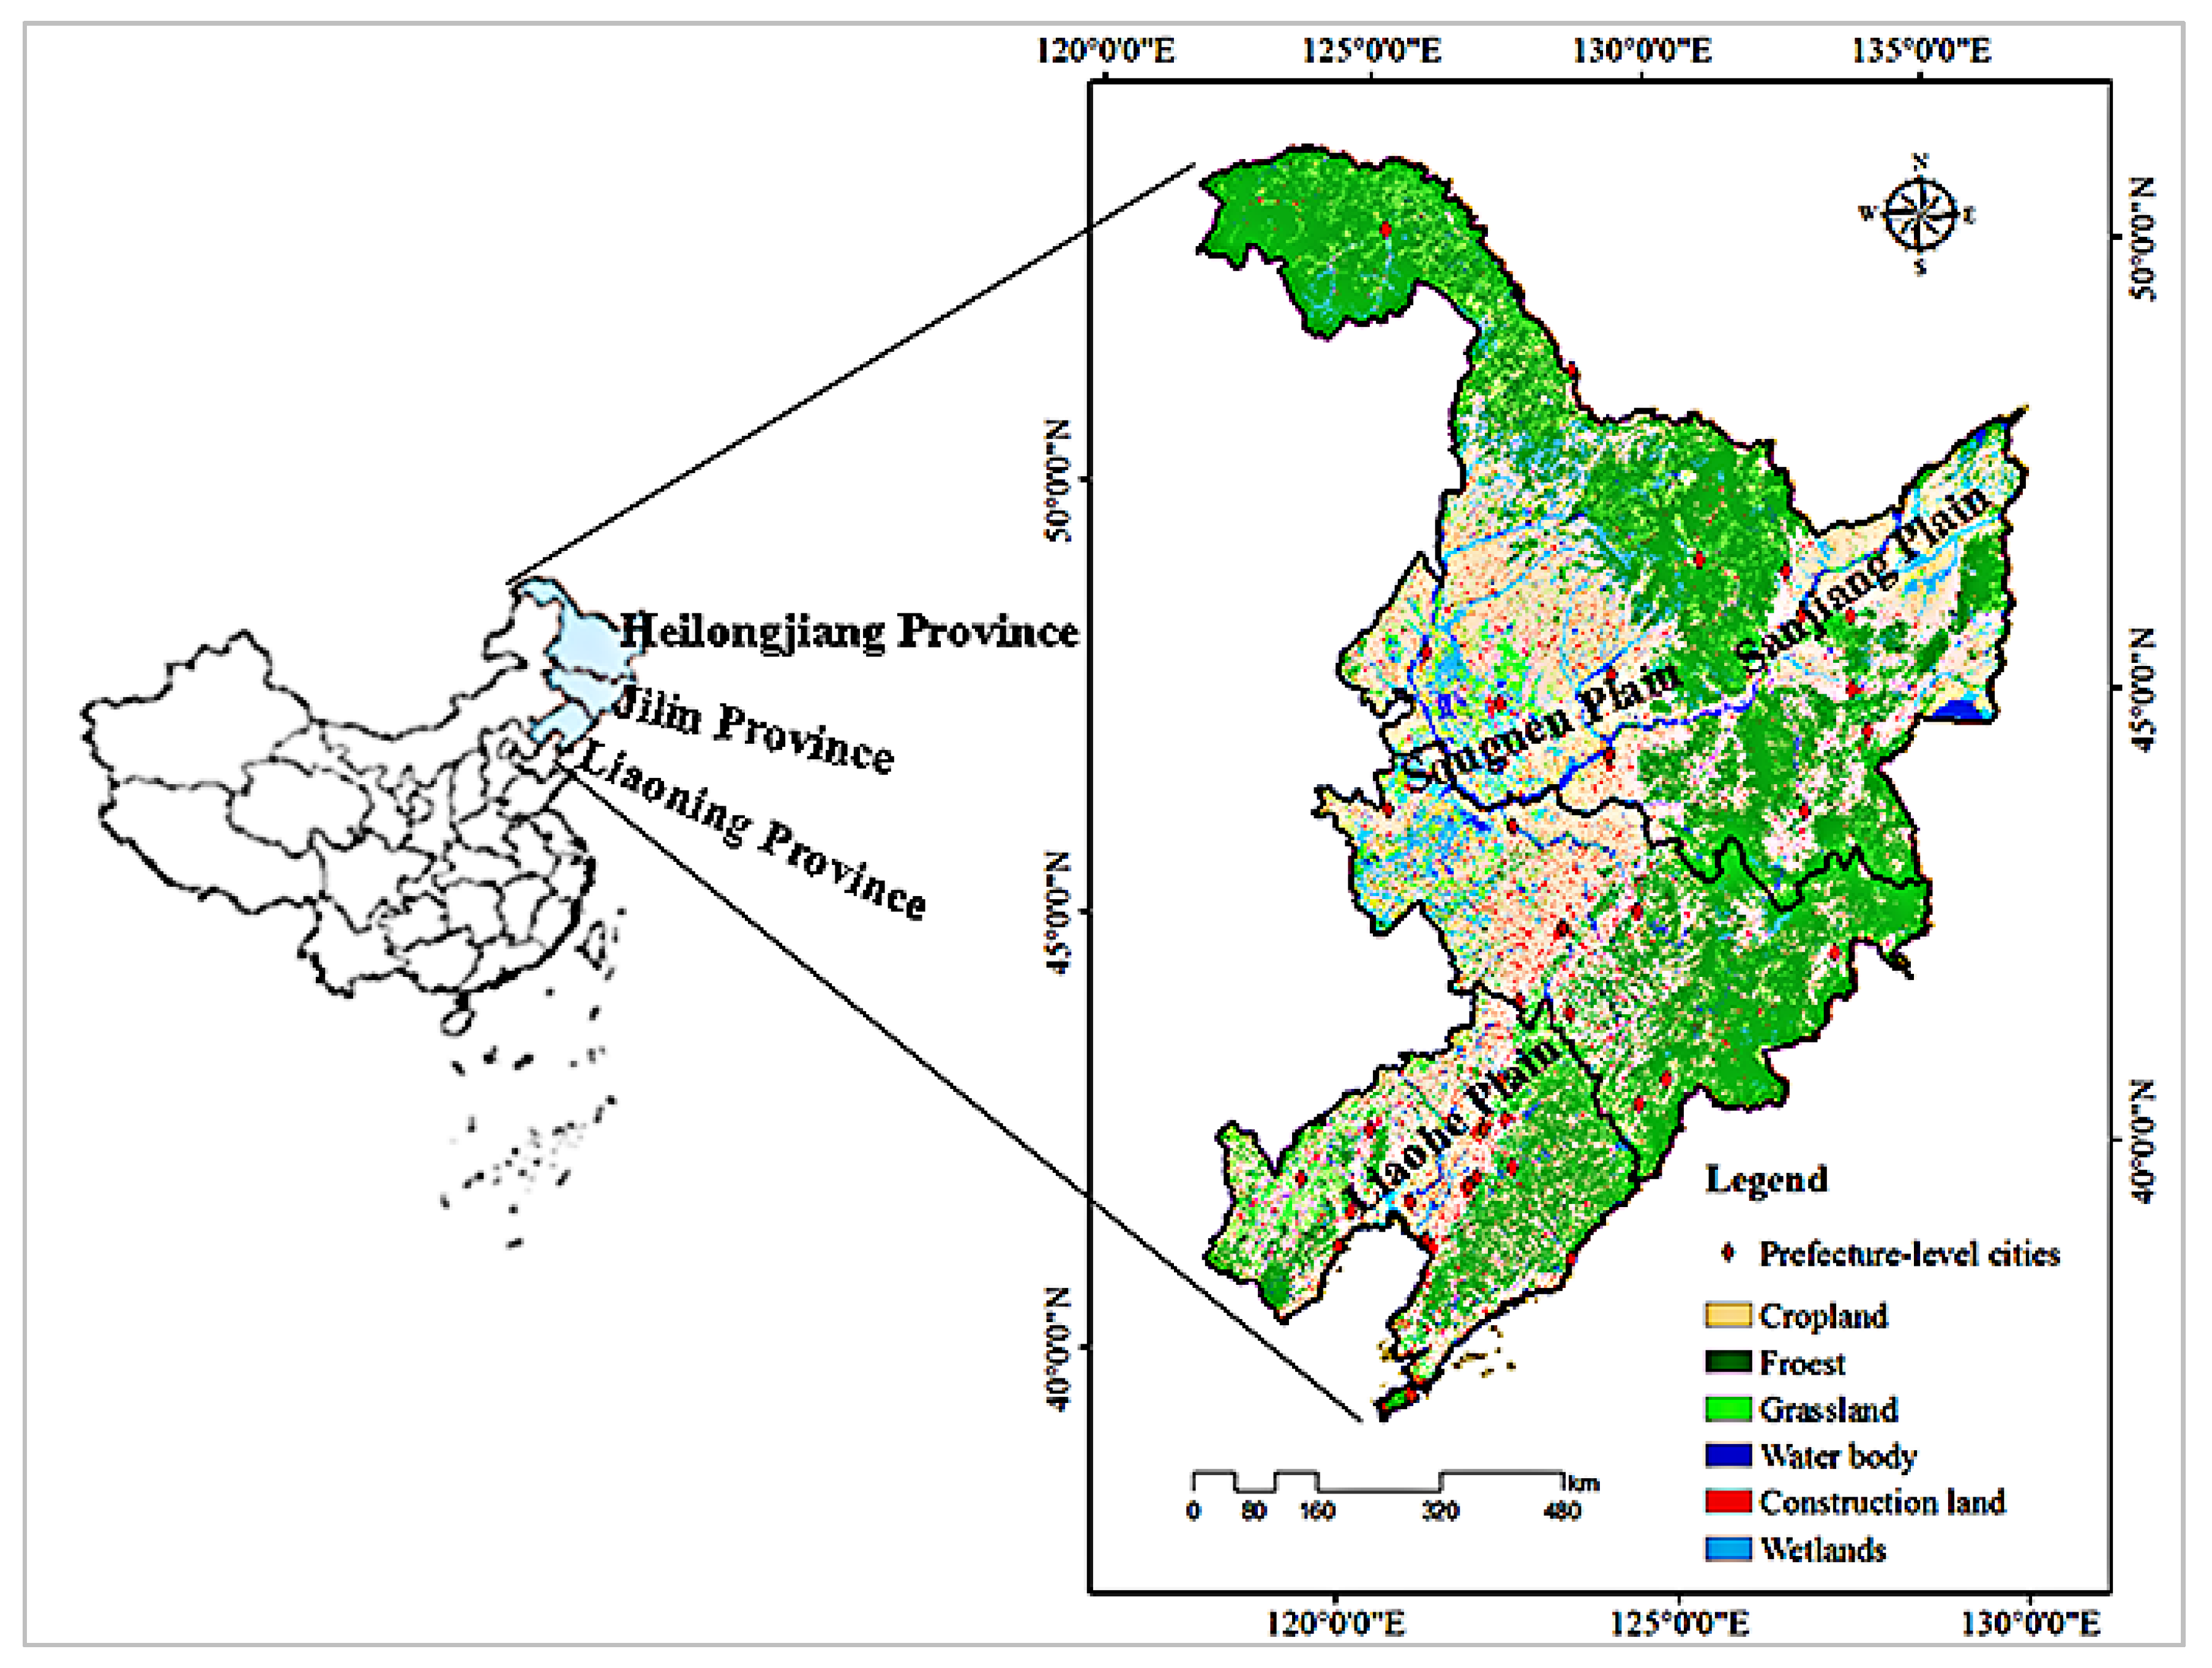
2.1. Study Area
2.2. Data
2.3. Methods
2.3.1. Construction of the Indicator System for Evaluating WEF Symbiosis
The Relationship between Symbiosis and the WEF System
Construction of the Evaluation Index System
2.3.2. Entropy Method
2.3.3. Comprehensive Evaluation Method
2.3.4. Construction of the Coupling Model
2.3.5. Development and Testing of the GM (1, 1) Model
Modelling
Model Testing
- (1)
- The standard deviation of the original sequence ():
- (2)
- The standard deviation of the absolute error series ():
- (3)
- The variance ratio (C):
- (4)
- The small error probability (P):
3. Results
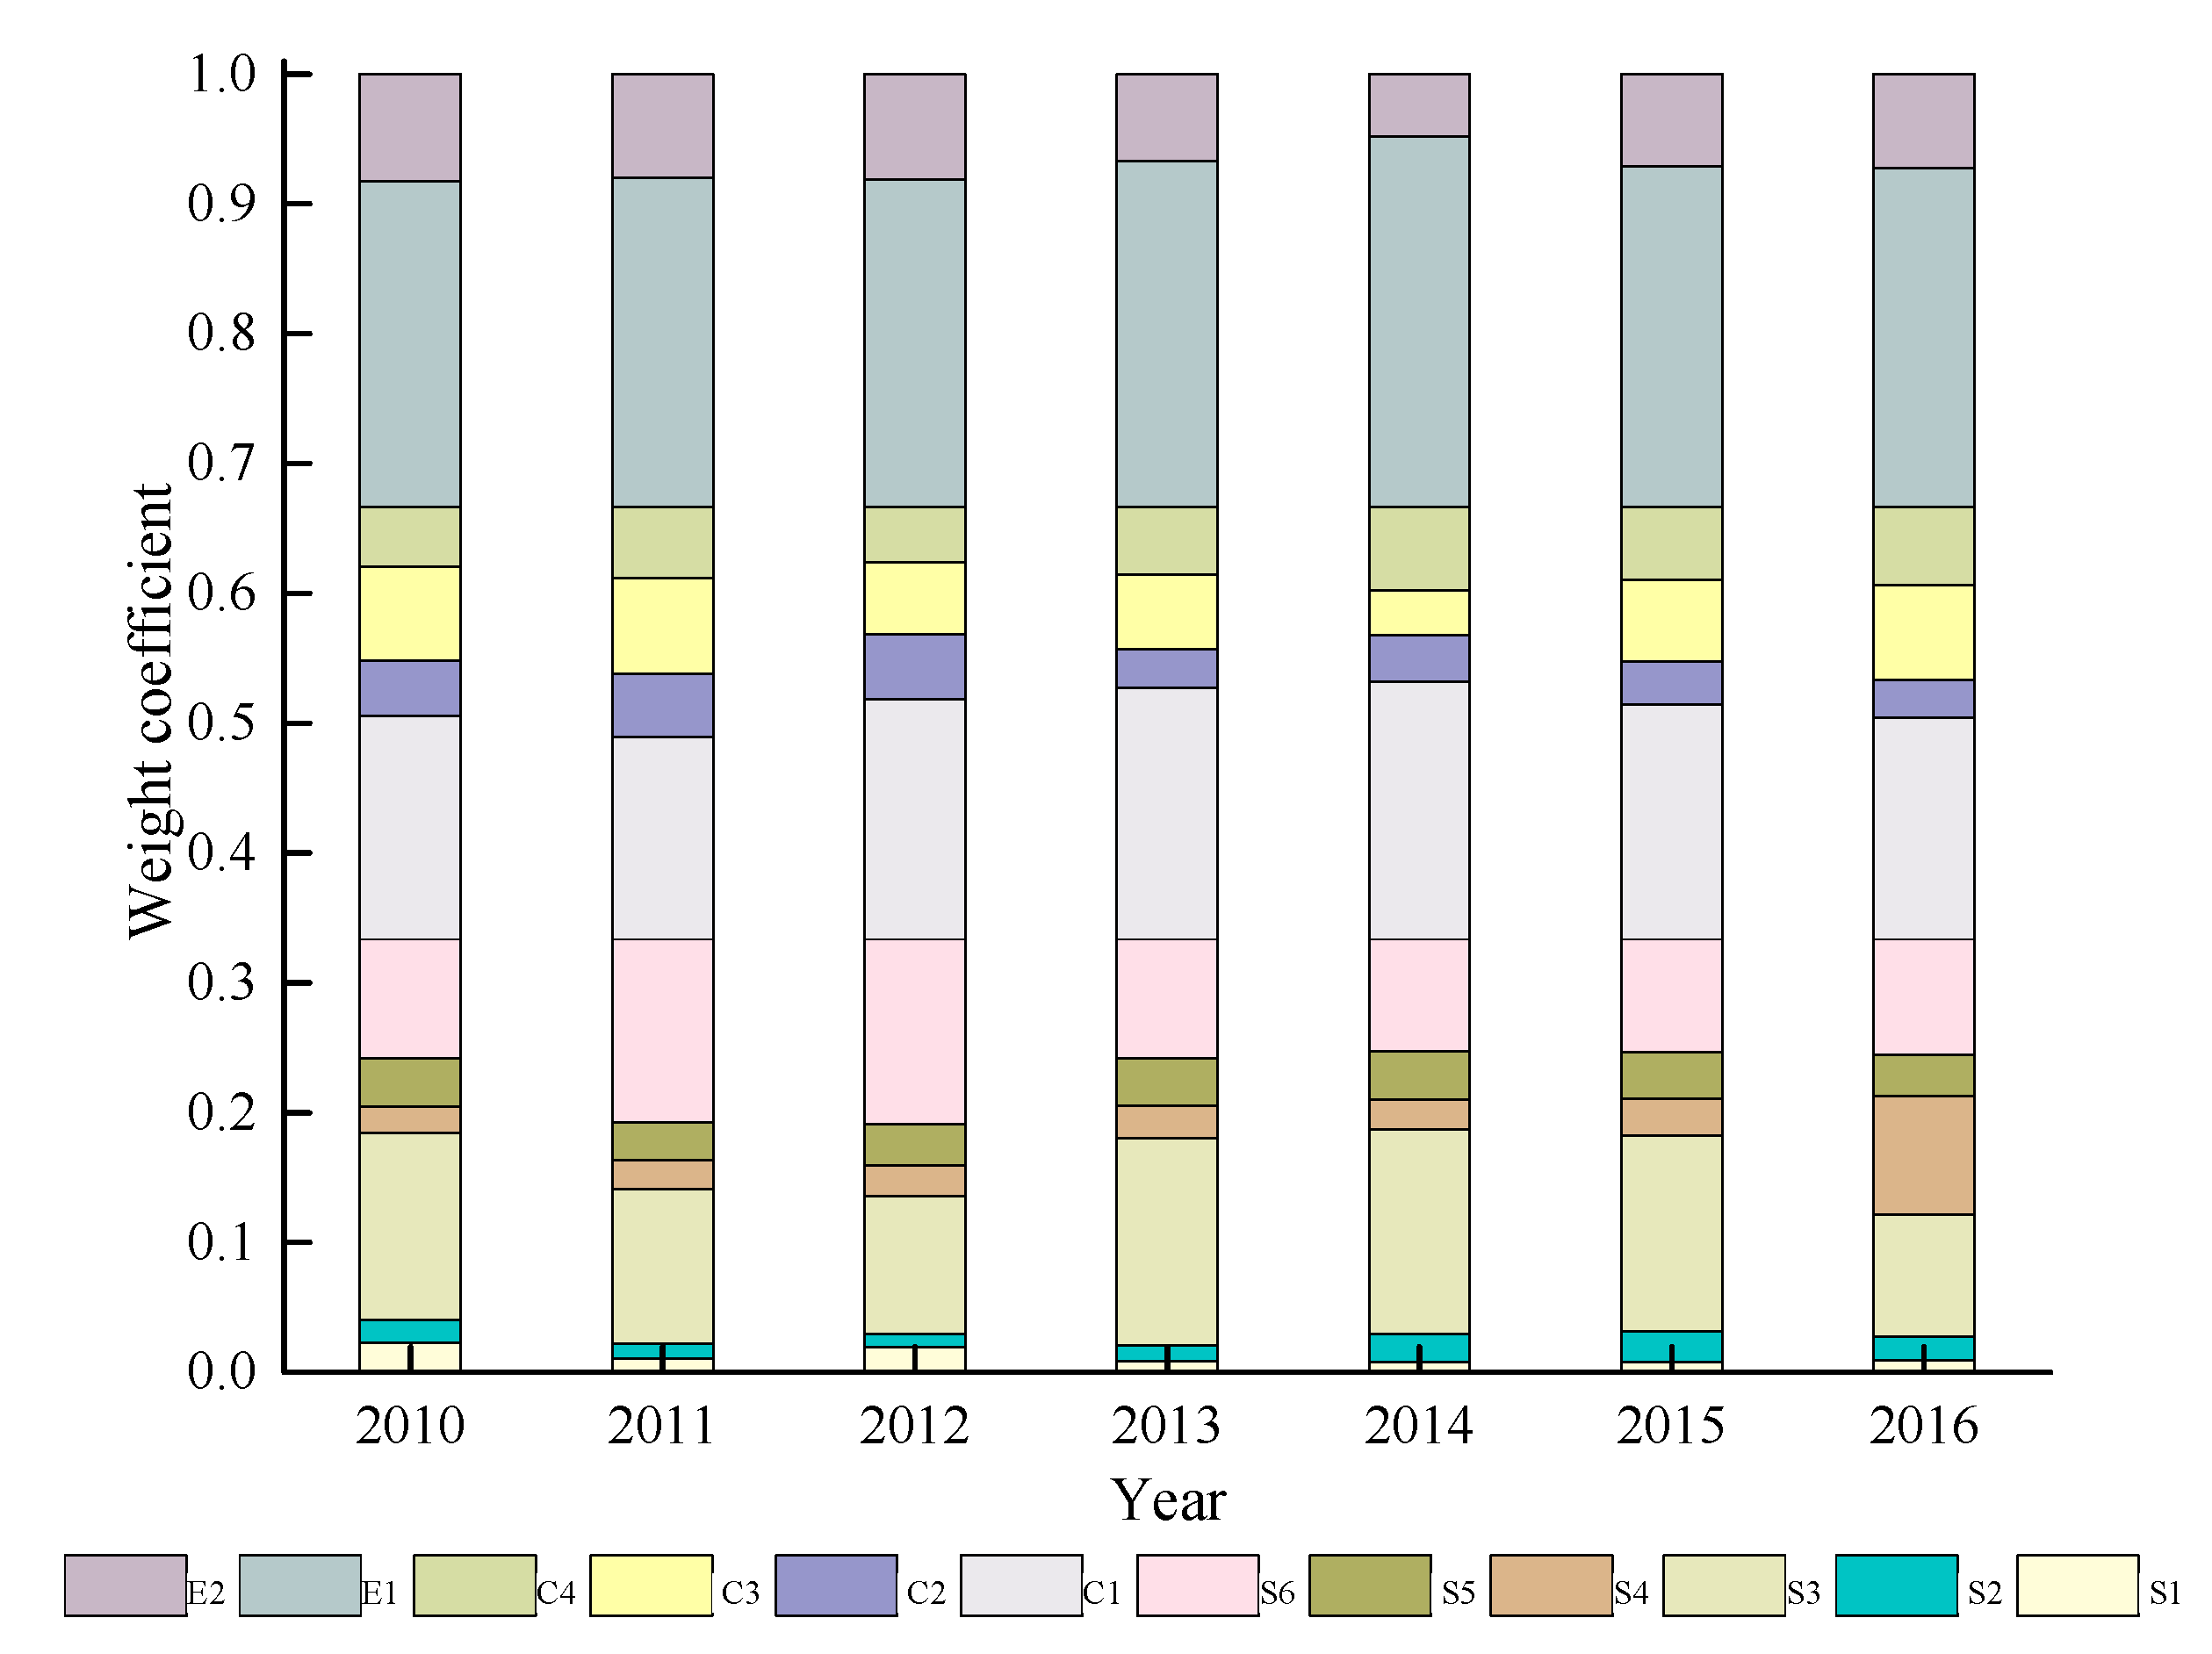
3.1. Impact Indicators
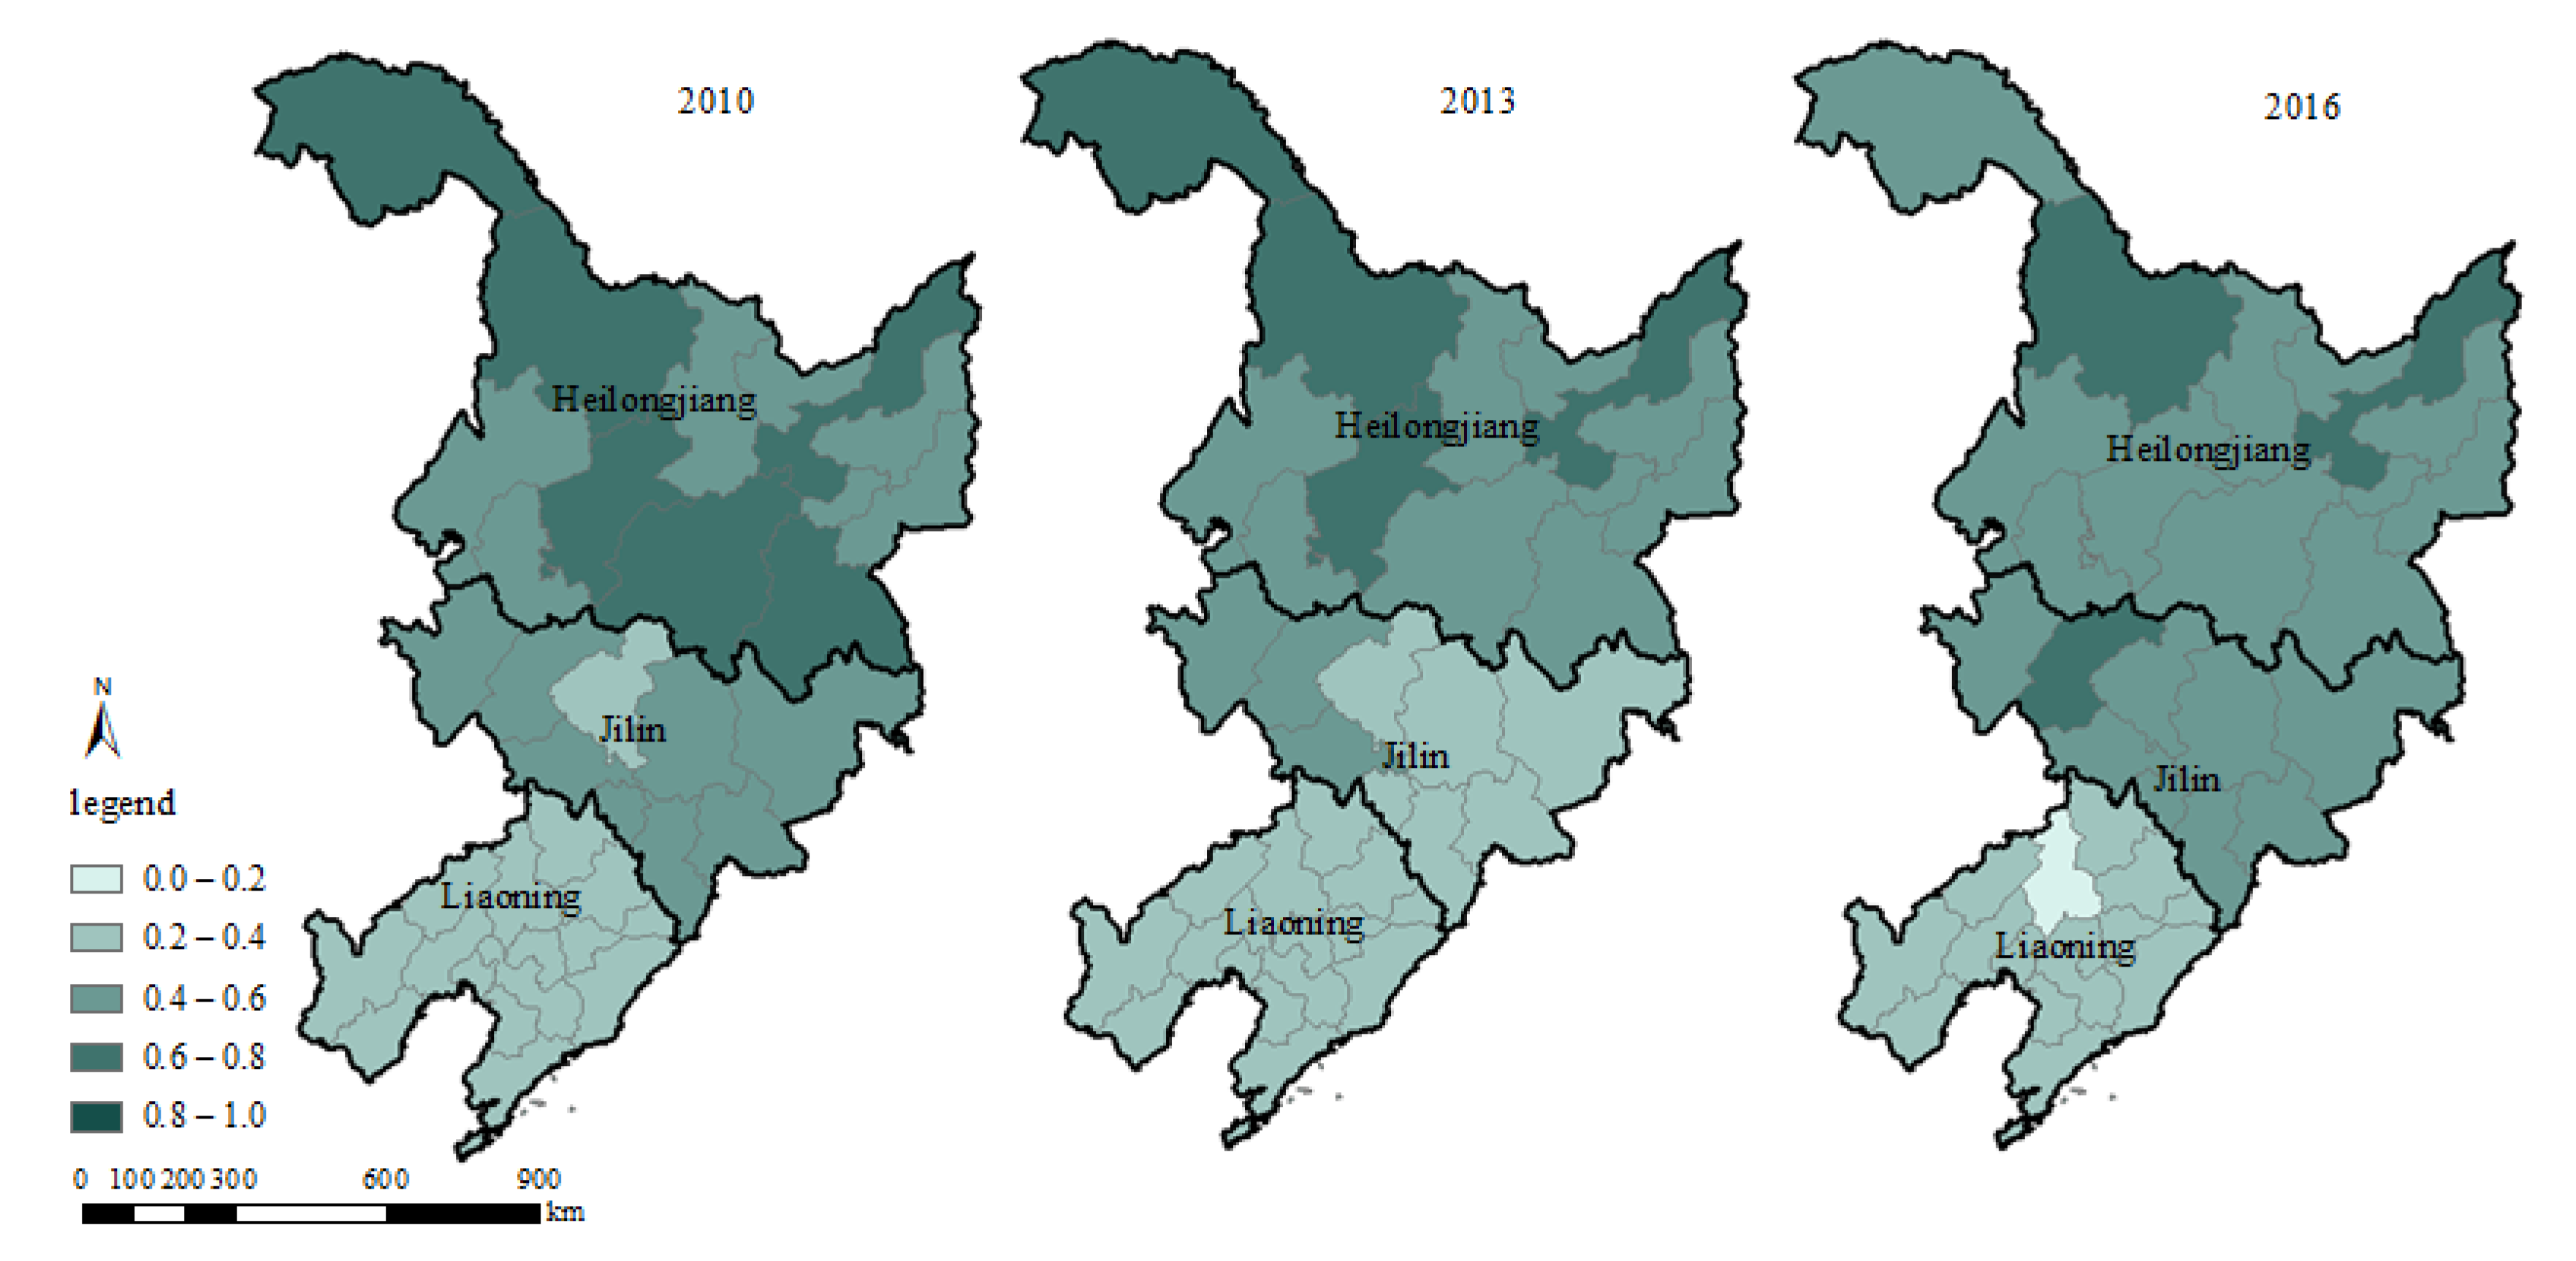
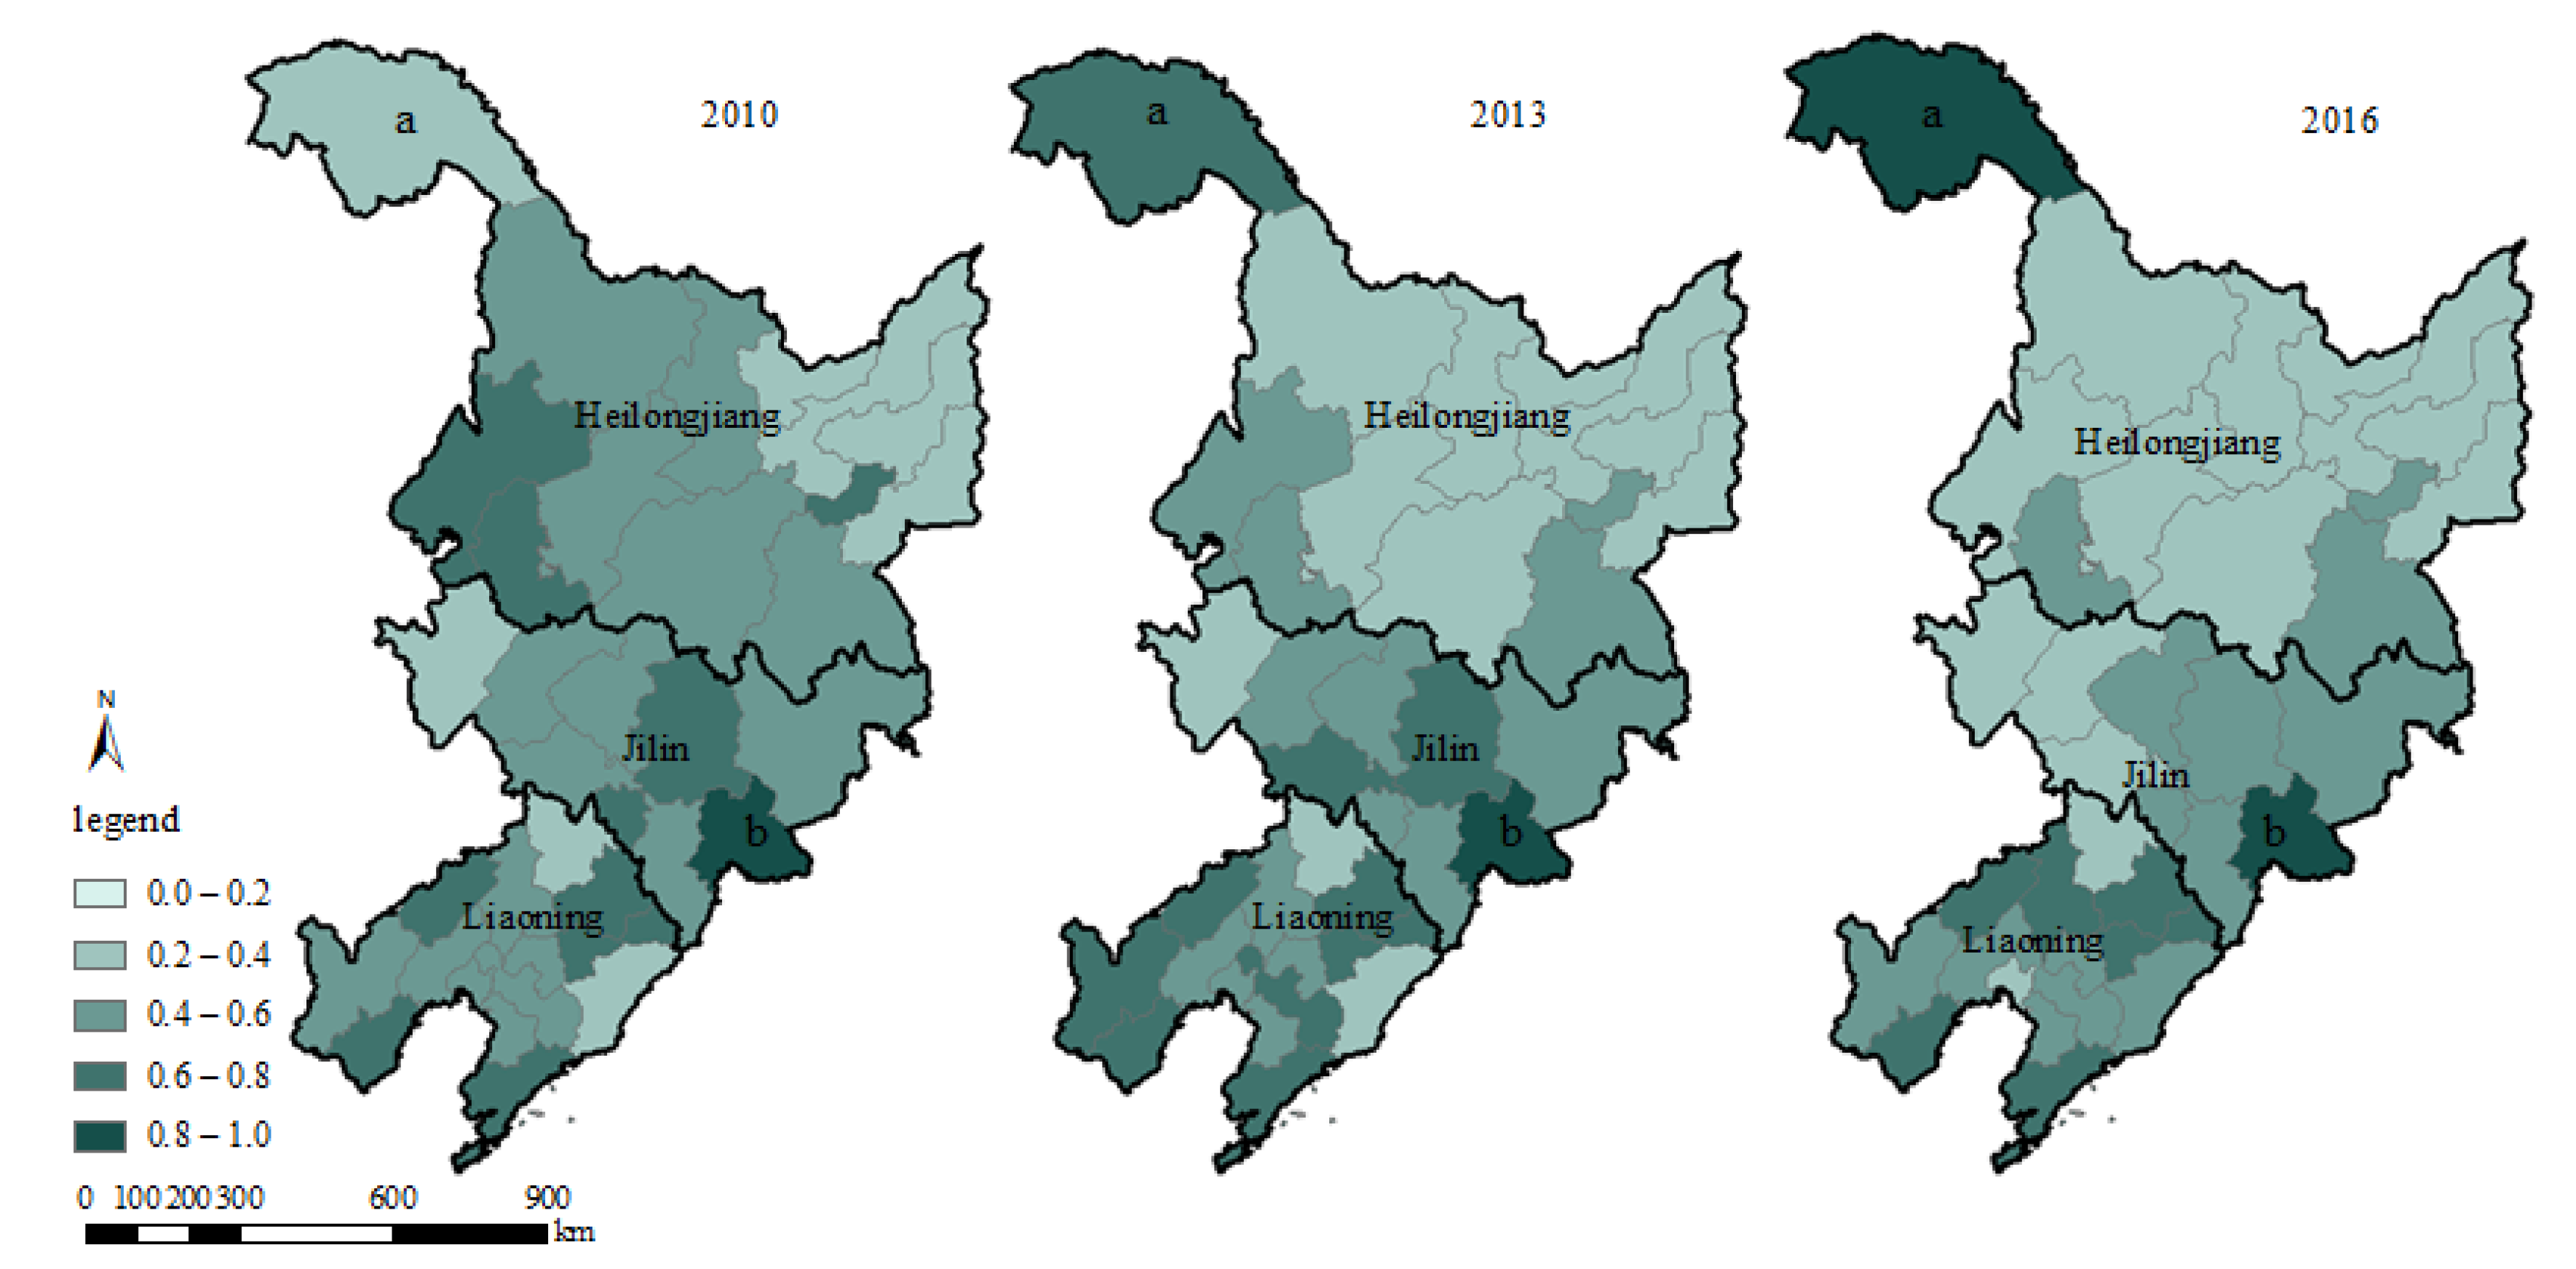
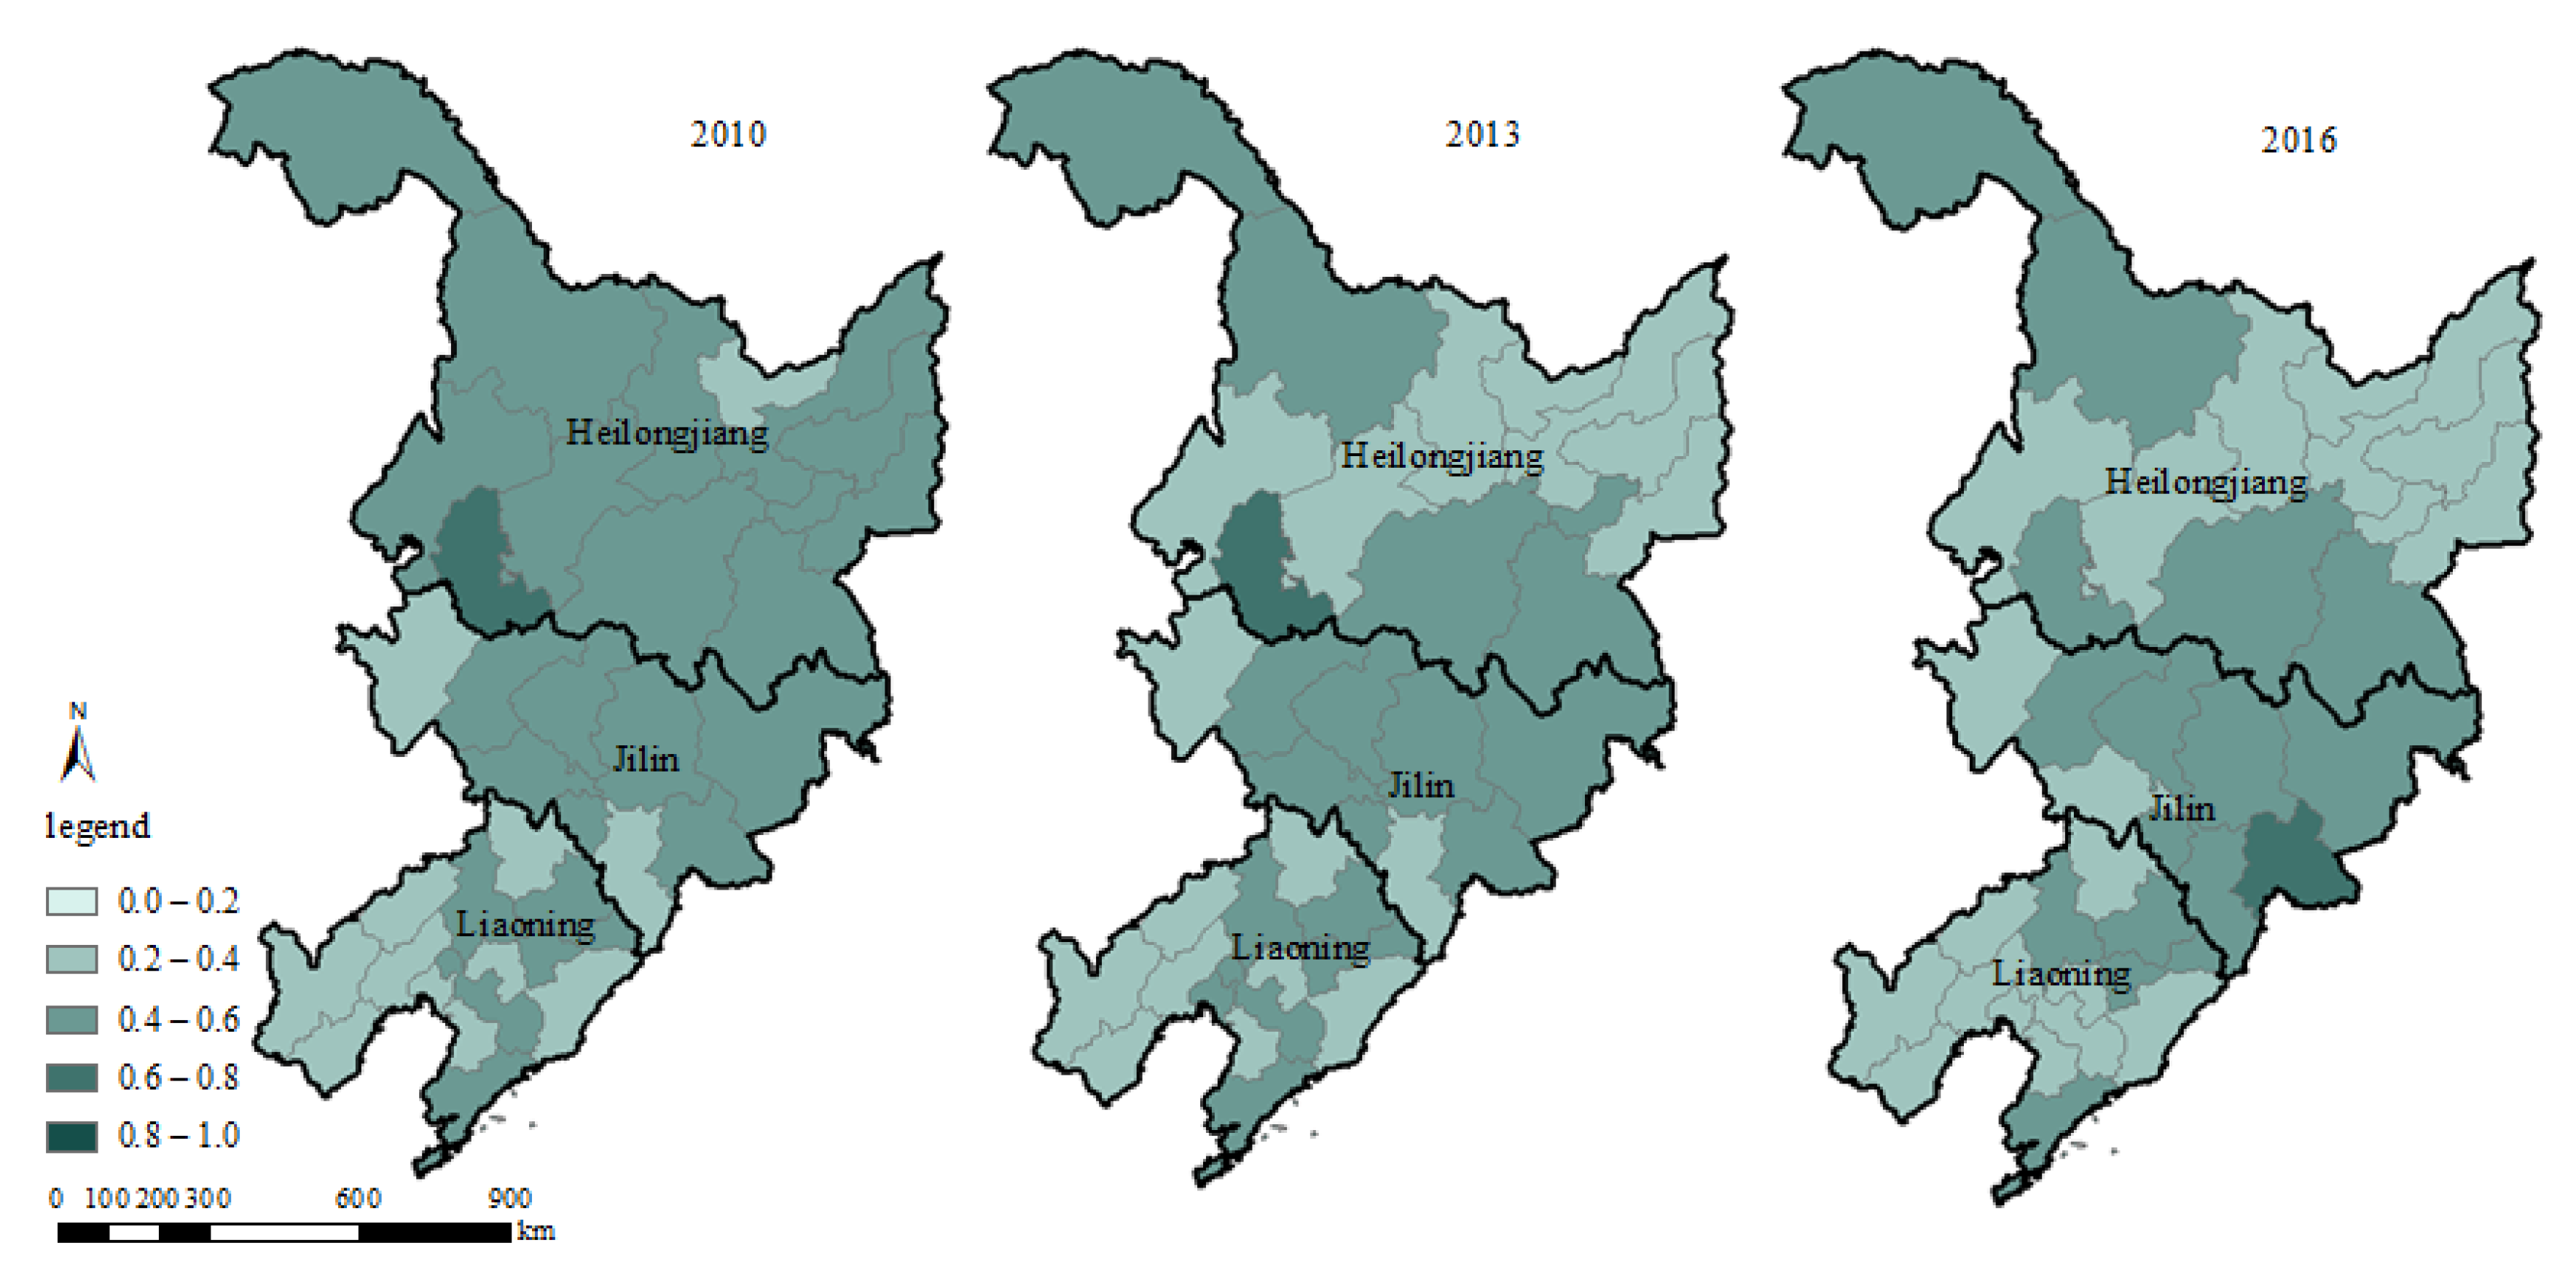
3.2. Spatial Analysis of the Coordination and Security of the WEF System in China’s Three Northeastern Provinces
3.2.1. WEF Stability
3.2.2. WEF Coordination
3.2.3. WEF Sustainability
3.2.4. Levels of Synergistic Safety in WEFs
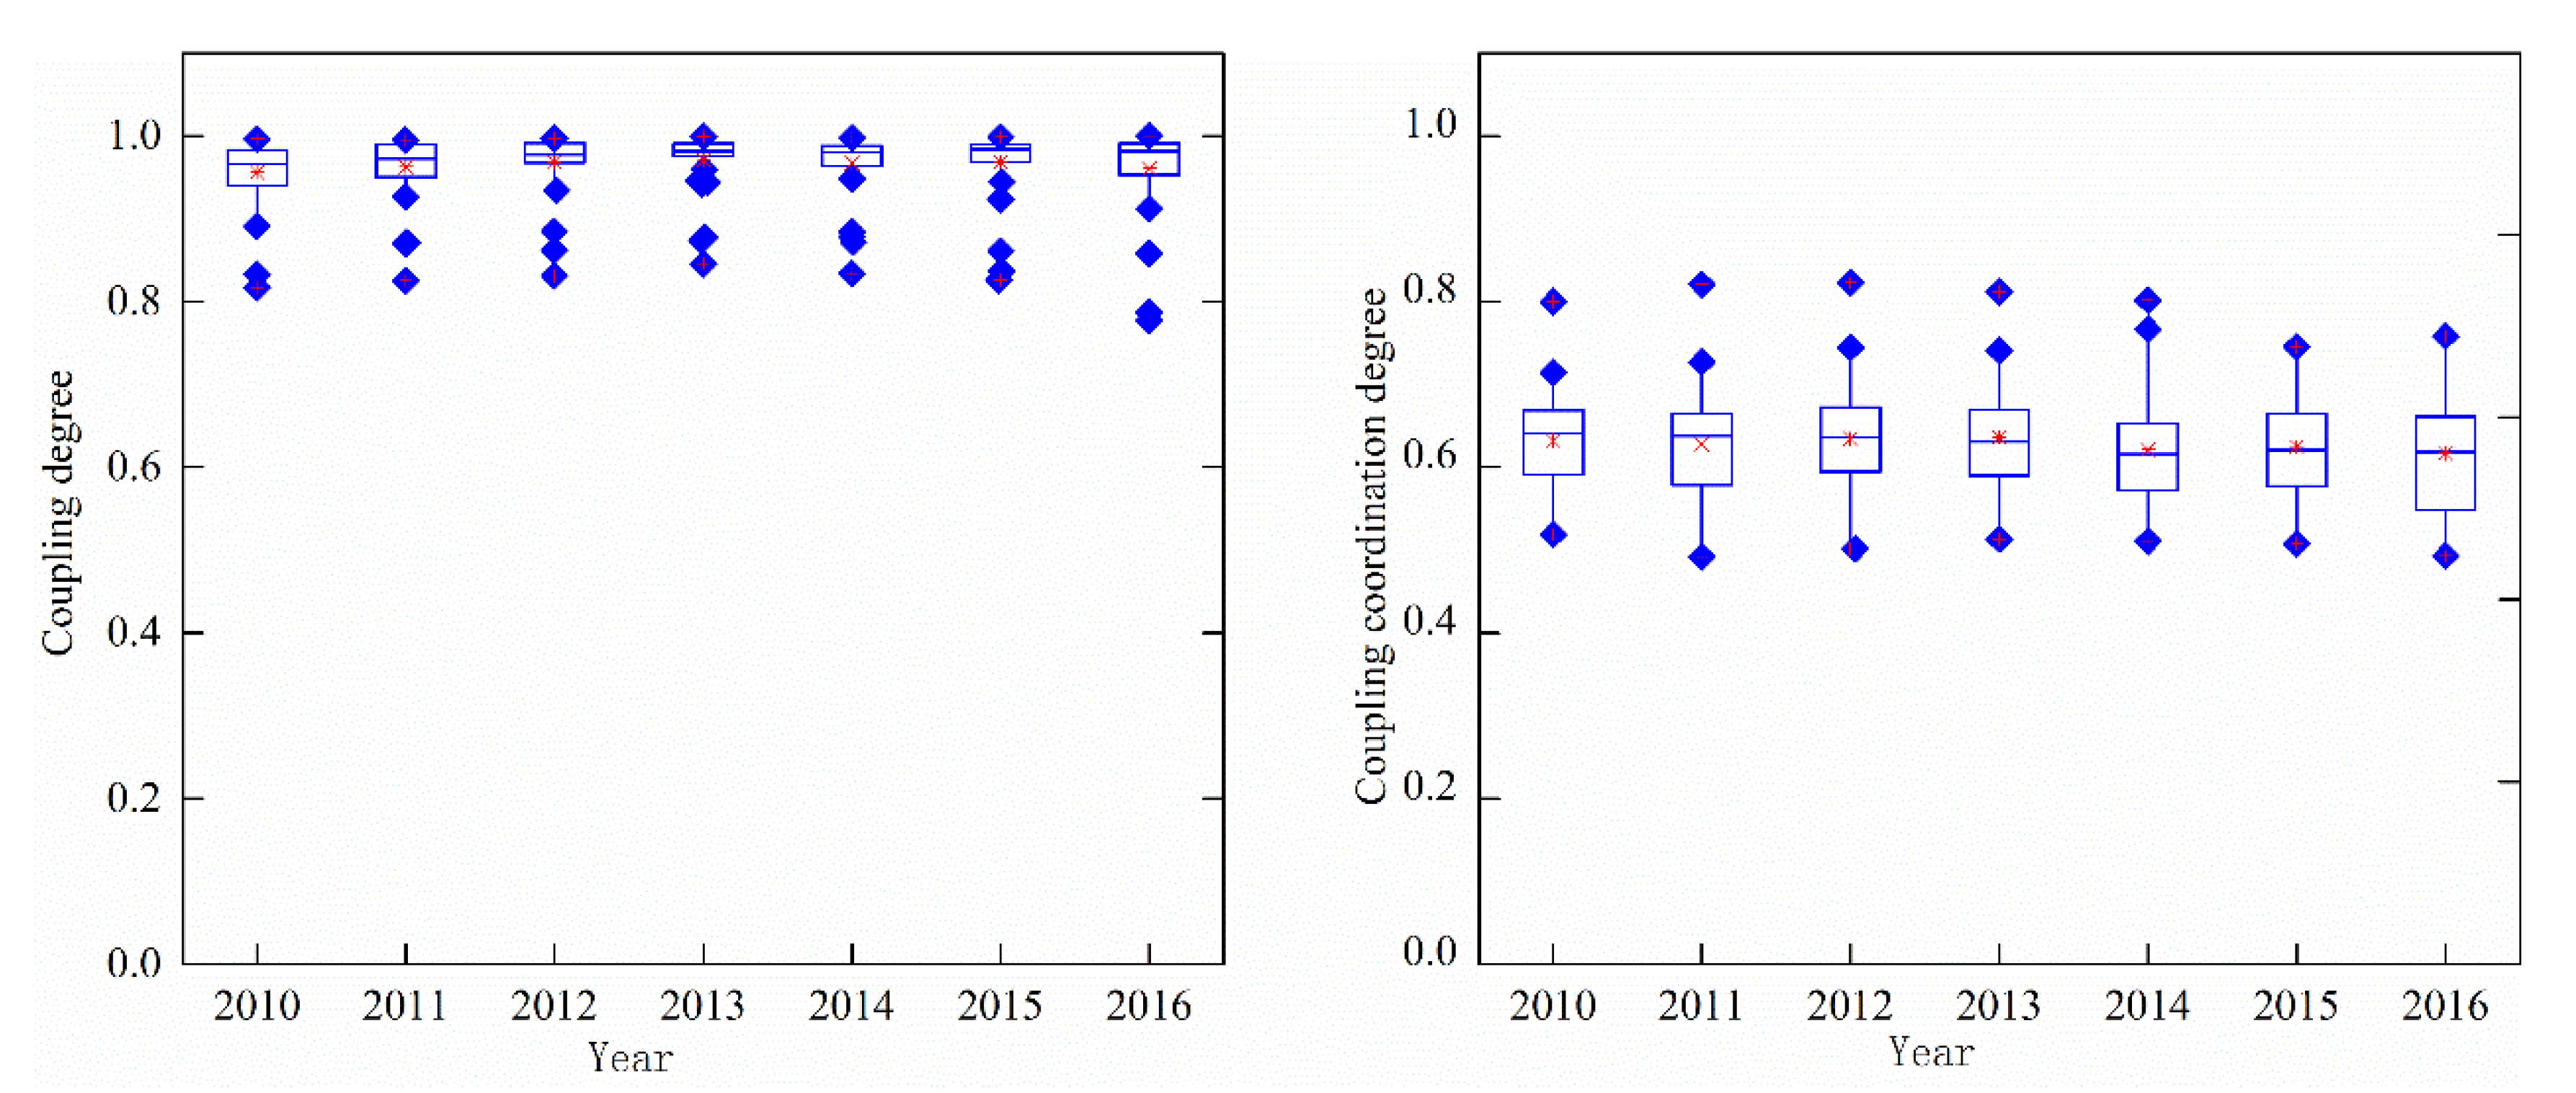
3.3. Analysis of the Degrees of Coupling and Coupling Coordination of the WEF System in the Three Northeastern Provinces
4. Discussion
4.1. The Difference of the WEF System between the Three Northeastern Provinces and Other Regions
4.2. Suggestions on the Safety Development of the WEF System in the Three Northeast Provinces
4.3. Limitations
5. Conclusions
Supplementary Materials
Author Contributions
Funding
Institutional Review Board Statement
Informed Consent Statement
Data Availability Statement
Conflicts of Interest
References
- Richard, N.C. Global trends 2030: Alternative worlds. Foreign Aff. 2013, 92, 187. [Google Scholar]
- Bazilian, M.; Rogner, H.; Howells, M.; Hermann, S.; Arent, D.; Gielen, D.; Steduto, P.; Mueller, A.; Komor, P.; Tol, R.S.J.; et al. Considering the energy, water and food nexus: Towards an integrated modelling approach. Energ. Policy 2011, 39, 7896–7906. [Google Scholar] [CrossRef]
- Goodarzi, M.R.; Vagheei, H.; Mohtar, R.H. The impact of climate change on water and energy security. Water Supply 2020, 7, 2530–2547. [Google Scholar] [CrossRef]
- Wicaksono, A.; Jeong, G.; Kang, D. Water, energy, and food nexus: Review of global implementation and simulation model development. Water Policy 2017, 19, 440–462. [Google Scholar] [CrossRef] [Green Version]
- Napoli, C.; Garcia-Tellez, B. A framework for understanding energy for water. Int. J. Water Resour. D 2016, 32, 339–361. [Google Scholar] [CrossRef] [Green Version]
- Keairns, D.L.; Darton, R.C.; Irabiena, A. The Energy-Water-Food Nexus. Annu. Rev. Chem. Biomol. Eng. 2016, 7, 239–262. [Google Scholar] [CrossRef] [PubMed]
- Hoff, H. Understanding the Nexus. In Proceedings of the Bonn 2011 Conference, The Water, Energy and Food Security Nexus, Bonn, Germany, 16–18 November 2011; Stockholm Environment Institute: Stockholm, Sweden, 2011. [Google Scholar]
- Food and Agriculture Organization of the United Nations. The Water-Energy-Food Nexus: A New Approach in Support of Food Security and Sustainable Agriculture; FAO: Rome, Italy, 2014. [Google Scholar]
- Giupponi, C.; Gain, A.K.; Chalov, S.; Ostonen, I.; Karthe, D.; Niinemets, Ü.; Mander, Ü.; Kasimov, N.; Giupponi, C.; Giupponi, C.; et al. Integrated spatial assessment of the water, energy and food dimensions of the Sustainable Development Goals. Reg. Environ. Chang. 2016, 17, 1881–1893. [Google Scholar] [CrossRef]
- Kaddoura, S.; El Khatib, S. Review of water-energy-food Nexus tools to improve the Nexus modelling approach for integrated policy making. Environ. Sci. Policy 2017, 77, 114–121. [Google Scholar] [CrossRef]
- de Andrade Guerra, J.B.S.O.; Berchin, I.I.; Garcia, J.; Da Silva Neiva, S.; Jonck, A.V.; Faraco, R.A.; de Amorim, W.S.; Ribeiro, J.M.P. A literature-based study on the water–energy–food nexus for sustainable development. Stoch. Env. Res. Risk A 2020. [Google Scholar] [CrossRef]
- Mahlknecht, J.; González-Bravo, R. Measuring the Water-Energy-Food Nexus: The Case of Latin America and the Caribbean Region. Energy Procedia 2018, 153, 169–173. [Google Scholar] [CrossRef]
- Tashtoush, F.M.; Al-Zubari, W.K.; Shah, A. A review of the water–energy–food nexus measurement and management approach. Int. J. Energy Water Resour. 2019, 3, 361–374. [Google Scholar] [CrossRef]
- Hamidov, A.; Helming, K. Sustainability Considerations in Water–Energy–Food Nexus Research in Irrigated Agriculture. Sustainability 2020, 12, 6274. [Google Scholar] [CrossRef]
- Rasul, G. Managing the food, water, and energy nexus for achieving the Sustainable Development Goals in South Asia. Environ. Dev. 2016, 18, 14–25. [Google Scholar] [CrossRef] [Green Version]
- Pereira Ribeiro, J.M.; Da Silva, S.A.; Da Silva Neiva, S.; Soares, T.; Montenegro, C.; Deggau, A.B.; de Amorim, W.S.; de Albuquerque Junior, C.L.; de Andrade Guerra, J.B.S.O. A proposal of a balanced scorecard to the water, energy and food nexus approach: Brazilian food policies in the context of sustainable development goals. Stoch. Env. Res. Risk. A 2020. [Google Scholar] [CrossRef]
- Karan, E.; Asadi, S.; Mohtar, R.; Baawain, M. Towards the optimization of sustainable food-energy-water systems: A stochastic approach. J. Clean Prod. 2018, 171, 662–674. [Google Scholar] [CrossRef]
- Karnib, A. Bridging Science and Policy in Water-Energy-Food Nexus: Using the Q-Nexus Model for Informing Policy Making. Water Resour. Manag. 2018, 32, 4895–4909. [Google Scholar] [CrossRef]
- Mannan, M.; Al-Ansari, T.; Mackey, H.R.; Al-Ghamdi, S.G. Quantifying the energy, water and food nexus: A review of the latest developments based on life-cycle assessment. J. Clean. Prod. 2018, 193, 300–314. [Google Scholar] [CrossRef]
- King, C.W.; Carbajales-Dale, M.; Saundry, P. Food–energy–water metrics across scales: Project to system level. J. Environ. Stud. Sci. 2016, 6, 39–49. [Google Scholar] [CrossRef]
- Yuan, K.Y.; Lin, Y.C.; Chiueh, P.T.; Lo, S.L. Spatial optimization of the food, energy, and water nexus: A life cycle assessment-based approach. Energy Policy 2018, 119, 502–514. [Google Scholar] [CrossRef]
- Howarth, C.; Monasterolo, I. Understanding barriers to decision making in the UK energy-food-water nexus: The added value of interdisciplinary approaches. Environ. Sci. Policy 2016, 61, 53–60. [Google Scholar] [CrossRef] [Green Version]
- Romero-Lankao, P.; Bruns, A.; Wiegleb, V. From risk to WEF security in the city: The influence of interdependent infrastructural systems. Environ. Sci. Policy 2018, 90, 213–222. [Google Scholar] [CrossRef]
- Rasul, G. Food, water, and energy security in South Asia: A nexus perspective from the Hindu Kush Himalayan region. Environ. Sci. Policy 2014, 39, 35–48. [Google Scholar] [CrossRef] [Green Version]
- Schlör, H.; Venghaus, S.; Hake, J. The FEW-Nexus city index—Measuring urban resilience. Appl. Energy 2018, 210, 382–392. [Google Scholar] [CrossRef]
- Bizikova, L.; Roy, D.; Swanson, D.; Venema, H.D.; McCandless, M. The Water–Energy–Food Security Nexus: Towards a Practical Planning and Decision Support Framework for Landscape Investment and Risk Management; International Institute for Sustainable Development: Winnipeg, MB, Canada, 2013. [Google Scholar]
- Ringler, C.; Bhaduri, A.; Lawford, R. The nexus across water, energy, land and food (WELF): Potential for improved resource use efficiency? Curr. Opin. Environ. Sustain. 2013, 5, 617–624. [Google Scholar] [CrossRef]
- Endo, A.; Tsurita, I.; Burnett, K.; Orencio, P.M. A review of the current state of research on the water, energy, and food nexus. J. Hydrol. Reg. Stud. 2017, 11, 20–30. [Google Scholar] [CrossRef] [Green Version]
- Lawford, R.; Bogardi, J.; Marx, S.; Jain, S.; Wostl, C.P.; Knüppe, K.; Ringler, C.; Lansigan, F.; Meza, F. Basin perspectives on the Water–Energy–Food Security Nexus. Curr. Opin. Environ. Sustain. 2013, 5, 607–616. [Google Scholar] [CrossRef]
- Dhaubanjar, S.; Davidsen, C.; Bauer-Gottwein, P. Multi-Objective Optimization for Analysis of Changing Trade-Offs in the Nepalese Water–Energy–Food Nexus with Hydropower Development. Water 2017, 9, 162. [Google Scholar] [CrossRef] [Green Version]
- Li, M.; Singh, V.P.; Fu, Q.; Liu, D.; Li, T.; Zhou, Y. Optimization of agricultural water–food–energy nexus in a random environment: An integrated modelling approach. Stoch. Environ. Res. Risk A 2019. [Google Scholar] [CrossRef]
- Willis, H.H.; Groves, D.G.; Ringel, J.S.; Mao, Z.; Efron, S.; Abbott, M. Developing the Pardee RAND Food-Energy-Water Security Index: Toward a Global Standaridized, Quantitative, and Transparent Resource Assessment; RAND Corporation: Santa Monica, CA, USA, 2016. [Google Scholar]
- Wang, Q.; Li, S.; He, G.; Li, R.; Wang, X. Evaluating sustainability of water-energy-food (WEF) nexus using an improved matter-element extension model: A case study of China. J. Clean. Prod. 2018, 202, 1097–1106. [Google Scholar] [CrossRef]
- Chen, J.; Yu, X.; Qiu, L.; Deng, M.; Dong, R. Study on Vulnerability and Coordination of Water-Energy-Food System in Northwest China. Sustainability 2018, 10, 3712. [Google Scholar] [CrossRef] [Green Version]
- Zhang, X.; Vesselinov, V.V. Integrated modeling approach for optimal management of water, energy and food security nexus. Adv. Water Resour. 2017, 101, 1–10. [Google Scholar] [CrossRef]
- Bai, J.; Zhang, H. Spatio-temporal Variation and Driving Force of Water-Energy-Food Pressure in China. Entia. Geogr. Sin. 2018, 38, 1653–1660. (In Chinese) [Google Scholar]
- Ringler, C.; Willenbockel, D.; Perez, N.; Rosegrant, M.; Zhu, T.; Matthews, N.; Saundry, P. Global linkages among energy, food and water: An economic assessment. J. Environ. Stud. Sci. 2016, 6, 161–171. [Google Scholar] [CrossRef] [Green Version]
- Smajgl, A.; Ward, J.; Pluschke, L. The water–food–energy Nexus—Realising a new paradigm. J. Hydrol. 2016, 533, 533–540. [Google Scholar] [CrossRef]
- Chai, J.; Shi, H.; Lu, Q.; Hu, Y. Quantifying and predicting the Water-Energy-Food-Economy-Society-Environment Nexus based on Bayesian networks—A case study of China. J. Clean. Prod. 2020, 256, 120266. [Google Scholar] [CrossRef]
- Hussien, W.A.; Memon, F.A.; Savic, D.A. A risk-based assessment of the household water-energy-food nexus under the impact of seasonal variability. J. Clean. Prod. 2018, 171, 1275–1289. [Google Scholar] [CrossRef]
- Yanling, Z.; Junfei, C.; Huimin, W.; Gang, L.; Waiming, Z. Assessment of water-energy-food nexus fitness in China from the perspective of symbiosis. China Popul. Resour. Environ. 2020, 30, 129–139. (In Chinese) [Google Scholar]
- Wang, Y.; Ye, X.; Zhu, Z.; Wang, Y. Logistic-based network stability study of industrial coupling symbiosis applied to oil-gas-based eco-industrial parks. J. Clean. Prod. 2019, 225, 256–261. [Google Scholar] [CrossRef]
- Quispel, A. Some theoretical aspects of symbiosis. Antonie Leeuwenhoek 1951, 17, 69–80. [Google Scholar] [CrossRef]
- Lamberton, D.M. The economics of information and organization. Annu. Rev. Inf. Sci. Technol. 1984, 19, 3–30. [Google Scholar]
- Liu, Y.; Wang, S.; Chen, B. Regional water–energy–food nexus in China based on multiregional input–output analysis. Energy Procedia 2017, 142, 3108–3114. [Google Scholar] [CrossRef]
- Kooi, B.W.; Kuijper, L.D.J.; Kooijman, S.A.L.M. Consequences of symbiosis for food web dynamics. J. Math. Biol. 2004, 49, 227–271. [Google Scholar] [CrossRef] [PubMed]
- Sims, M. How to count biological minds: Symbiosis, the free energy principle, and reciprocal multiscale integration. Synthese 2020. [Google Scholar] [CrossRef]
- Liu, X.; Gao, J. Discussion on the Index System of Intensive Land Use Evaluation in Development Area. Asian Agric. Res. 2011, 3, 91–96. [Google Scholar]
- Niva, V.; Cai, J.; Taka, M.; Kummu, M.; Varis, O. China’s sustainable water-energy-food nexus by 2030: Impacts of urbanization on sectoral water demand. J. Clean. Prod. 2020, 251, 119755. [Google Scholar] [CrossRef]
- Taniguchi, M.; Masuhara, N.; Burnett, K. Water, energy, and food security in the Asia Pacific region. J. Hydrol. Reg. Stud. 2017, 11, 9–19. [Google Scholar] [CrossRef] [Green Version]
- Chang, Y.; Li, G.; Yao, Y.; Zhang, L.; Yu, C. Quantifying the Water-Energy-Food Nexus: Current Status and Trends. Energies 2016, 9, 65. [Google Scholar] [CrossRef] [Green Version]
- Galdeano-Gómez, E.; Aznar-Sánchez, J.A.; Pérez-Mesa, J.C.; Piedra-Muñoz, L. Exploring Synergies Among Agricultural Sustainability Dimensions: An Empirical Study on Farming System in Almería (Southeast Spain). Ecol. Econ. 2017, 140, 99–109. [Google Scholar] [CrossRef]
- Li, G.; Huang, D.; Sun, C.; Li, Y. Developing interpretive structural modeling based on factor analysis for the water-energy-food nexus conundrum. Sci. Total Environ. 2019, 651, 309–322. [Google Scholar] [CrossRef]
- Irabien, A.; Darton, R.C. Energy–water–food nexus in the Spanish greenhouse tomato production. Clean. Technol. Environ. 2016, 18, 1307–1316. [Google Scholar] [CrossRef]
- Gao, Y.; Qian, H.; Ren, W.; Wang, H.; Liu, F.; Yang, F. Hydrogeochemical characterization and quality assessment of groundwater based on integrated-weight water quality index in a concentrated urban area. J. Clean. Prod. 2020, 260, 121006. [Google Scholar] [CrossRef]
- Islamoglu, M.; Apan, M.; Oztel, A. An Evaluation of the Financial Performance of REITs in Borsa Istanbul: A Case Study Using the Entropy-Based TOPSIS Method. Int. J. Financ. Res. 2015, 6, 124–128. [Google Scholar] [CrossRef] [Green Version]
- Xu, J.; Xu, J.; Feng, P.; Feng, P.; Yang, P.; Yang, P. Research of development strategy on China’s rural drinking water supply based on SWOT–TOPSIS method combined with AHP-Entropy: A case in Hebei Province. Environ. Earth Sci. 2016, 75, 1–11. [Google Scholar] [CrossRef]
- Wang, B.; Teng, Y.; Wang, H.; Zuo, R.; Zhai, Y.; Yue, W.; Yang, J. Entropy weight method coupled with an improved DRASTIC model to evaluate the special vulnerability of groundwater in Songnen Plain, Northeastern China. Hydrol. Res. 2020, 51, 1184–1200. [Google Scholar] [CrossRef]
- Ren, Y.; Yao, J.; Xu, D.; Wang, J. A comprehensive evaluation of regional water safety systems based on a similarity cloud model. Water Sci. Technol. 2017, 76, 594–604. [Google Scholar] [CrossRef] [PubMed]
- Liao, C. Quantitative Judgement and Classification System for Coordinated Development of Environment and Economy—A Case Study of the City Group in the Pearl River Delta. Trop. Geogr. 1999, 2, 76–82. (In Chinese) [Google Scholar]
- Ju-Long, D. Control Problems of Grey Systems. Syst. Control Lett. 1982, 1, 288–294. [Google Scholar] [CrossRef]
- Hua, E.; Wang, X.; Engel, B.A.; Sun, S.; Wang, Y. The competitive relationship between food and energy production for water in China. J. Clean. Prod. 2020, 247, 119103. [Google Scholar] [CrossRef]
- Li, X. Security Evaluation of Water-Energy-Food Nexus System in China Based on Synergetic-Symbiosis Theory. Master’s Thesis, Shandong Agricultural University, Shandong, China, 2020. (In Chinese). [Google Scholar]
- Liu, C.; Zhang, Z.; Liu, S.; Liu, Q.; Tanzer, J. Evaluating Agricultural Sustainability Based on the Water-Energy-Food Nexus in the Chenmengquan Irrigation District of China. Sustainability 2019, 11, 5350. [Google Scholar] [CrossRef] [Green Version]
- Jägermeyr, J.; Gerten, D.; Heinke, J.; Schaphoff, S.; Kummu, M.; Lucht, W. Water savings potentials of irrigation systems: Dynamic global simulation. Hydrol. Earth Syst. Sci. Discuss. 2015, 12, 3593–3644. [Google Scholar] [CrossRef]
- Cai, J.; Yin, H.; Varis, O. Impacts of industrial transition on water use intensity and energy-related carbon intensity in China: A spatio-temporal analysis during 2003–2012. Appl. Energ. 2016, 183, 1112–1122. [Google Scholar] [CrossRef]


| Target Layer | Criterion Layer | Element | Indicators | Unit | No. |
|---|---|---|---|---|---|
| WEF system synergis-tic safety level | Stability | Water | The rates of development and utilization of water resources | — | S1 |
| Water consumption per 10,000 RMB of GDP | Cubic meter/10,000 RMB | S2 | |||
| Energy | Energy self-sufficiency | — | S3 | ||
| Energy consumption per 10,000 RMB of GDP | Tons of standard coal/10,000 RMB | S4 | |||
| Food | The rate of utilization of cultivated land | — | S5 | ||
| Food production per capita | kg/person | S6 | |||
| Coordination | Water-Food | Proportion of agricultural water | — | C1 | |
| the amount of water use per unit food production | Cubic meter/kg | C2 | |||
| Energy-Food | Power of agricultural machinery per unit cultivated land | KW/ha | C3 | ||
| Proportion of energy consumption in primary industry | — | C4 | |||
| Sustainability | Economy-Society- | GDP per capita | RMB/person | E1 | |
| Environment | Chemical fertilizer consumption per unit sown land | kg/ha | E2 |
| Coupling Coordination Degree | Classification |
|---|---|
| 0.00–0.10 | extreme imbalance |
| 0.10–0.20 | serious imbalance |
| 0.20–0.30 | moderate imbalance |
| 0.30–0.40 | mild imbalance |
| 0.40–0.50 | on the verge of coordination |
| 0.50–0.60 | weak coordinated |
| 0.60–0.70 | primary coordination |
| 0.70–0.80 | intermediate coordination |
| 0.80–0.90 | well coordinated |
| 0.90–1.00 | very coordinated |
| P | C | Classification |
|---|---|---|
| >0.95 | <0.35 | very qualified |
| >0.80 | <0.50 | qualified |
| >0.70 | <0.65 | weak qualified |
| ≤0.70 | ≥0.65 | unqualified |
| Year | 2010 | 2011 | 2012 | 2013 | 2014 | 2015 | 2016 |
|---|---|---|---|---|---|---|---|
| Original value | 0.634 | 0.635 | 0.641 | 0.637 | 0.623 | 0.625 | 0.617 |
| Predict value | 0.634 | 0.641 | 0.636 | 0.632 | 0.627 | 0.623 | 0.619 |
| Evaluation | P = 0.86 > 0.80 | C = 0.49 < 0.50 | qualified | ||||
| Year | Coupling Coordination Degree | Classification |
|---|---|---|
| 2017 | 0.615 | primary coordination |
| 2018 | 0.610 | primary coordination |
| 2019 | 0.606 | primary coordination |
| 2020 | 0.602 | primary coordination |
| 2021 | 0.598 | weak coordination |
| 2022 | 0.594 | weak coordination |
| 2023 | 0.590 | weak coordination |
| 2024 | 0.586 | weak coordination |
| 2025 | 0.582 | weak coordination |
| 2026 | 0.578 | weak coordination |
Publisher’s Note: MDPI stays neutral with regard to jurisdictional claims in published maps and institutional affiliations. |
© 2021 by the authors. Licensee MDPI, Basel, Switzerland. This article is an open access article distributed under the terms and conditions of the Creative Commons Attribution (CC BY) license (http://creativecommons.org/licenses/by/4.0/).
Share and Cite
Li, H.; Wang, H.; Yang, Y.; Zhao, R. Regional Coordination and Security of Water–Energy–Food Symbiosis in Northeastern China. Sustainability 2021, 13, 1326. https://doi.org/10.3390/su13031326
Li H, Wang H, Yang Y, Zhao R. Regional Coordination and Security of Water–Energy–Food Symbiosis in Northeastern China. Sustainability. 2021; 13(3):1326. https://doi.org/10.3390/su13031326
Chicago/Turabian StyleLi, Hongfang, Huixiao Wang, Yaxue Yang, and Ruxin Zhao. 2021. "Regional Coordination and Security of Water–Energy–Food Symbiosis in Northeastern China" Sustainability 13, no. 3: 1326. https://doi.org/10.3390/su13031326