1. Introduction
Mitigation of ambient air pollution is the biggest challenge related to limiting negative impacts of environmental pollution on health [
1]. Globally, ca. 4.5 million deaths have been attributed to ambient air pollution in 2018 [
2]. It was the sixth-most important risk factor, among the 87 factors considered in the Global Burden of Disease (GBD) analysis, and the most important among environmental factors [
1]. Vast majority (92%) of the burden of disease globally is due to particulate matter (PM), with the remaining contribution due to ambient ozone. In Poland, the impacts of ambient PM exposure amount, according to the GBD project, to 27.8 thousand deaths per year [
3]. Other analyses, conducted with different methods, input data, and assumptions, estimate ca. 46.3 and 58.0 thousand premature deaths annually related to this exposure [
4,
5]. All those results indicate that ambient air pollution, and especially particulate matter, is a significant environmental and public health problem globally and in Poland.
The burden of disease estimates are rooted in a well-established evidence demonstrating that long term exposure to PM2.5 (particles with aerodynamic diameter equal to or smaller than 2.5 µm) has negative health consequences [
6,
7]. Long-term exposure to PM is associated with the increased risk of developing chronic diseases, as well as of premature death. Solid evidence also exists on effects of short term increases in exposure to PM2.5 and PM10 (particles with aerodynamic diameter equal to or smaller than 10 µm), which may lead to a rapid deterioration of body functions resulting in emergency department visit or unplanned hospitalization, or in premature death.
European legislation enforces protection and improvement of air quality using a wide range of air quality management tools. Most of them aim at limiting emission of pollutants to atmosphere from various sources, such as road traffic; commercial, institutional and households sector; industrial processes and product use; energy production and distribution; and agriculture. An important class of these measures relates to short-term actions, particularly required during short time high concentration episodes when air pollution levels reach their peak concentrations, significantly threatening human health. According to Article 24 of the AAQ Directive (Directive 2008/50/EC on ambient air quality and cleaner air for Europe) [
8], such measures, specified in short-term action plans (STAP), should be taken especially in the case of exceedance of one or more alert thresholds. An alert threshold is defined as “a level beyond which there is a risk to human health from brief exposure for the population as a whole and at which immediate steps are to be taken by the Member States”. The AAQ Directive itself enforces alert thresholds for only three substances: Sulfur dioxide, nitrogen dioxide, and ozone; however, many Member States have also introduced such thresholds for PM10. Another type of threshold introduced by AAQ Directive is the information threshold, i.e., “a level beyond which there is a risk to human health from brief exposure for particularly sensitive sections of the population and for which immediate and appropriate information is necessary”. Such threshold is set by the AAQ Directive only for ozone, but some of the Member States have specified it for PM10 as well.
Information and alert thresholds are linked to even less precise concept of air pollution/smog episodes. In a common sense, episode is an event when the concentrations of air pollutants reach particularly high values. In Poland, the term “episode” is almost exclusively related to PM pollution, being the most severe air quality problem in the country [
9]. The definition of a PM10 episode is even more unrestricted than of PM10 information or alert thresholds, as various assessments can use their own criteria to define an episode. Since the first large study on PM episodes in Poland, conducted on behalf of the Chief Inspectorate of Environmental Protection [
10], a commonly used “national” threshold for a PM10 episode is 75 µg/m
3, but it has never been formally sanctioned.
The requirements for informing and alerting citizens about high concentrations of PM10 are not unified between the EU Member States; in fact, they differ to a large extent—see
Table 1. In the case of information thresholds, the largest daily mean value (100 µg/m
3) is twice as high as the lowest one (50 µg/m
3), while for alert threshold this difference is triple (150 vs. 50 µg/m
3). In both cases the highest thresholds are set in Czech Republic, Slovakia and Poland. It is worth noticing that in Poland until October 2019 these values have been even higher—200 µg/m
3 and 300 µg/m
3 for daily information and alert thresholds, respectively. The discrepancy in the information and alert levels between countries leads to a situation when—given the same concentration of PM10—citizens in different parts of Europe would or would not be warned about poor air quality. It is certainly a plight which preferably ought to be solved at a central EU level, but until this happens, Member States should introduce wisely chosen thresholds on national levels. These thresholds serve not only the protection of human health, but they play another—possibly even more important—role of involving the citizens in the process of monitoring the effectiveness of air quality management in their countries.
One of the possible reasons for the lack of consistency of the PM10 alert threshold between countries is the fact that no guidance exists on how to determine such values, and therefore they are usually arbitrarily chosen by the authorities. Setting thresholds for the concentrations of air pollutants can be done for several reasons such as: Information on smog occurrences, air quality standards exceedances, health recommendations, or air quality index. The most extensive literature is available for air quality indices, since they can be introduced independently from existing legally binding rules, therefore research is done globally. There are two main types of methods for developing a threshold of air pollution, based on the number of exceedances and/or on health determinates. First approach focuses usually on the frequency of occurrence of a given concentration of air pollutants per selected time period and area. The second uses association between air pollution and adverse health effects [
12].
The literature documents three general approaches to setting thresholds of PM10 considering health effects of the pollution:
Using the World Health Organization Air Quality Guidelines (WHO AQG) as a base for threshold level;
setting threshold based on concentration–response functions (CRF) and recalculation to air pollution concentration;
assessing the number of health outcomes in a population and deriving an air pollution threshold based on it.
The first approach is relatively the simplest method for appointing PM10 threshold level. The WHO AQG of PM10 (which is equal to 50 µg/m
3 with 24 h averaging period [
13]) is used as a reference and the threshold is set at, e.g., 100% or 200% of this value [
14,
15]. More complex methods from the second category use CRF parameters such as relative risk (RR) or excess risk (ER). The threshold is set with regard to the risk increase in relation to current air quality standard [
16,
17]. For example, a threshold of PM10 can be calculated for a 50% increase of risk of hospital admission, as compared with the hospitalization risk assessed for the limit value of PM10 (50 µg/m
3). The third method is the most complex, since it is based on calculations of the number of health outcomes (such as deaths, hospitalizations, or emergency department visits due to various diseases). This requires combining CRFs with baseline data on an incidence of selected health effects and PM10 concentration [
18,
19,
20,
21,
22,
23]. CRF function can be based on local epidemiological studies or a metaanalysis of all regionally or globally available studies, such as used by WHO HRAPIE or other projects [
24,
25,
26].
The aim of this study was to determine PM10 daily mean concentrations for information and alert thresholds for Poland using human health perspective. Based on short-term health effects of air pollution, we have assessed the number of hospital admissions that could be avoided if a particular threshold concentration of PM10 would not be exceeded, e.g., due to actions by proper authorities and the society following the forecast of reaching an information or alert level of the pollution. The choice of the threshold concentrations is then based on expected health gains balanced by the frequency of the announcements in regions with various pollution levels.
2. Materials and Methods
The analysis was carried out using a 3-year dataset on air quality from 2015–2017, covering the whole Poland [
27]. Air quality data included the measurements collected within the National Environmental Monitoring network, which is the official air quality measurement system of Poland, reporting its results to the European Commission. The analysis was aggregated to 46 air quality assessment zones [
28], determined (as required by AAQ Directive) by the Regulation of the Minister of the Environment of 2 August 2012 on zones where air quality is assessed (AQ zones) (Journal of Laws of 2012, item 914)—see
Figure 1.
Daily mean concentrations of PM10 were collected from all manual stations (applying the reference gravimetric method [
29]) in Poland, whose time coverage reached at least 75% of days in each year. To avoid additional uncertainty related to using PM data obtained via different measurement methods, automatic stations were excluded from the analysis. As PM10 was monitored by over twice as many stations as PM2.5, the analysis was carried out using the PM10 fraction, even though the applied analysis of health effects is based on PM2.5. To overcome this issue, a method of estimating PM2.5 levels from PM10 measurements was developed for the purpose of this study. First, for each station where both PM10 and PM2.5 were measured (marker stations), monthly average ratios of daily PM2.5/PM10 were determined in the whole analysed period. Afterwards, the stations where only PM10 is observed were assigned to the corresponding marker stations, based on two criteria: (a) Geographic position belonging to the same air quality assessment zone and (b) similarity of localization characteristics. Finally, PM2.5 daily mean levels were calculated from PM10 mean concentrations, using the monthly ratios determined for marker stations. Since the vast majority of PM10 daily limit value exceedances occurs in Poland during the so-called heating season, further calculations were limited to the 1st and 4th quarters of each year (January–March and October–December).
Data on population health was obtained from the National Health Fund, and included quarterly mean of daily counts of hospital admissions due to cardiovascular (ICD10 codes I00-I99) and respiratory (ICD10 codes J00-J99) disorders, separately for each of the 380 counties of Poland in the period 2015–2017.
The analyses were conducted taking into account short-term exposures to PM2.5 and its impact on daily number of cardiovascular (CV) and respiratory (RS) hospitalizations, with relative risk (RR) values per 10 µg/m
3 of PM2.5 equal to 1.0091 and 1.0190, respectively [
24].
In order to determine the recommended information and alert thresholds, a health-oriented approach was elaborated within this study. It was based on six scenarios, which assumed adoption of potential alert thresholds at the levels of 50, 75, 100, 150, 200, and 300 µg/m3 for daily mean concentration of PM10, respectively. The thresholds were determined arbitrarily; however, they span from the WHO daily air quality guidelines value for PM10 (50 µg/m3) up to the alert threshold which was in force in Poland until 2019 (300 µg/m3).
In each scenario, the original dataset on PM10 concentrations was modified in a way that all records exceeding the respective threshold value in a given scenario (e.g., 50 µg/m3) were converted to this threshold value (50 µg/m3 in this case). Then, health impacts (number of hospitalizations) attributed to PM2.5 exposure were calculated for the modified (reduced) PM levels and compared with the base case, i.e., the impacts resulting from the PM2.5 levels estimated from the measured PM10 concentration with the use of the month- and location-specific PM2.5/PM10 ratios. It was assumed that the alert system would be based on the mean daily PM10 concentration averaged over all stations within a given zone. For example, in the 100 µg/m3 scenario alert would be issued for a certain zone if in this zone the mean concentration of PM10 averaged over all its stations exceeded 100 µg/m3.
To calculate the potential reduction in hospital admissions due to reduction of PM concentrations, an approach recommended by the APHEKOM project [
30] has been applied. For each of the analysed health outcomes, the change of the number of cases under particular scenarios has been calculated using the following health impact function:
where:
—The decrease of the number of cases of a given outcome, associated with the decrease of PM concentrations;
—the baseline number of cases of a given outcome;
—the coefficient of the concentration response function (=ln(RR)); and
—the decrease of PM concentration in a given scenario (in 10 µg/m3).
Considering the continuity of the risk increase over all range of exposure levels observed in Poland, and the lack of a specific threshold below which no health effects can be expected, selection of the information and alarm thresholds is, to some extent, arbitrary. In the present approach, we propose that the selection of the information and alert threshold concentrations should assure substantial health gains (e.g., more than half of that in the “best case scenario”), and be relevant for most of the country. To fulfil this latter condition, and considering that air pollution is a problem in the whole Poland, the threshold exceedances should be observed at least a few times per year also in the zones with relatively good air quality to assure it remains “on the agenda” also there, and happen not too frequently in the most polluted zones to avoid the state of “continuous alarm”.
3. Results
The analysis was based on the PM10 data from 151, 153 and 163 monitoring stations in 2015, 2016, and 2017, respectively. Three-years mean PM10 ranged from 15.5 µg/m
3 to 64.3 µg/m
3 in various zones (
Table 2). The PM2.5/PM10 ratio varied markedly between the zones and months, justifying the use of local and month-specific conversion factors.
The frequency of PM10 alerts that would be issued in all zones in Poland in the heating seasons of 2015–2017 decreases quickly with the increase of the threshold concentration and varies significantly between the zones (
Table 3).
According to the performed analyses, for the most ambitious daily threshold value of 50 µg/m3, PM alerts would be issued on average 43 times per year in all zones in Poland. In this scenario, the zone with the best air quality would face 13 alerts annually, while the most polluted zone—87 alerts. Conversely, the highest threshold amongst the analysed values—300 µg/m3—would result in no more than two alerts every three years (maximum frequency for all zones averaged over the three-year analysis period equals 0.67). It is worth emphasizing that such a high alert threshold (300 µg/m3) has in fact been in force in Poland for 7 years (2012–2019) (Earlier, i.e., between 2008–2012, PM10 daily alert threshold was set in Poland at 200 µg/m3. Before 2008 no alert threshold for PM10 was applied). All other scenarios, with simulated thresholds between 75 and 200 µg/m3, would result in several alerts per year in most zones, while in the most polluted one there would be from 3 to 49 alerts annually for the 200 and 75 µg/m3 scenarios, respectively.
The analyses revealed big differences between various regions of the country: In the most polluted zones PM alerts would be issued over ten times more often than in the cleanest areas. The zones with the worst air quality and thus most frequent alerts (at least 58 and 29 per year assuming the 50 µg/m
3 and 100 µg/m
3 daily threshold, respectively) are located in the southern and central parts of Poland and amongst them the Rybnik-Jastrzębie agglomeration faces the highest number of alerts (
Figure 2). On the other hand, the cleanest regions are located in northern Poland, with the least number of alerts (less than 14 and 4 assuming the 50 µg/m
3 and 100 µg/m
3 daily threshold, respectively) issued in Podlaskie zone.
In the analysis considering health impacts of daily mean levels of PM, the scenario assuming 50 µg/m
3 as an alert PM10 threshold was selected as a reference, i.e., the “best case scenario” (BCS). No exceedance of daily mean of 50 µg/m
3 is in agreement with WHO Air Quality Guidelines for PM10 [
13]. For all scenarios with higher threshold concentrations we calculated the number of CV and RS hospitalizations, which could potentially be avoided under each of the scenarios. The results are presented in
Table 4.
The potential positive effect of assumed scenarios decreases with increasing PM10 daily threshold values. For both health endpoints, this decrease is very well described with exponential models—see
Figure 3.
The highest analysed daily threshold value, i.e., 300 µg/m3 is associated with very small potential for reduction of the number of hospitalizations within the country (annually 14 cases of CV and 16 cases of RS hospitalizations are potentially avoided). On the other hand, the BCS with 50 µg/m3 as a threshold value could lead to a reduction of around 3000 and 4000 CV and RS hospitalizations, respectively.
To recommend a new alert threshold based on population health perspective, inverted calculations were conducted in order to find out at which threshold PM10 daily mean concentrations certain impacts, e.g., 75% or 50% of the BCS, could be achieved. Selected results are presented in
Table 5.
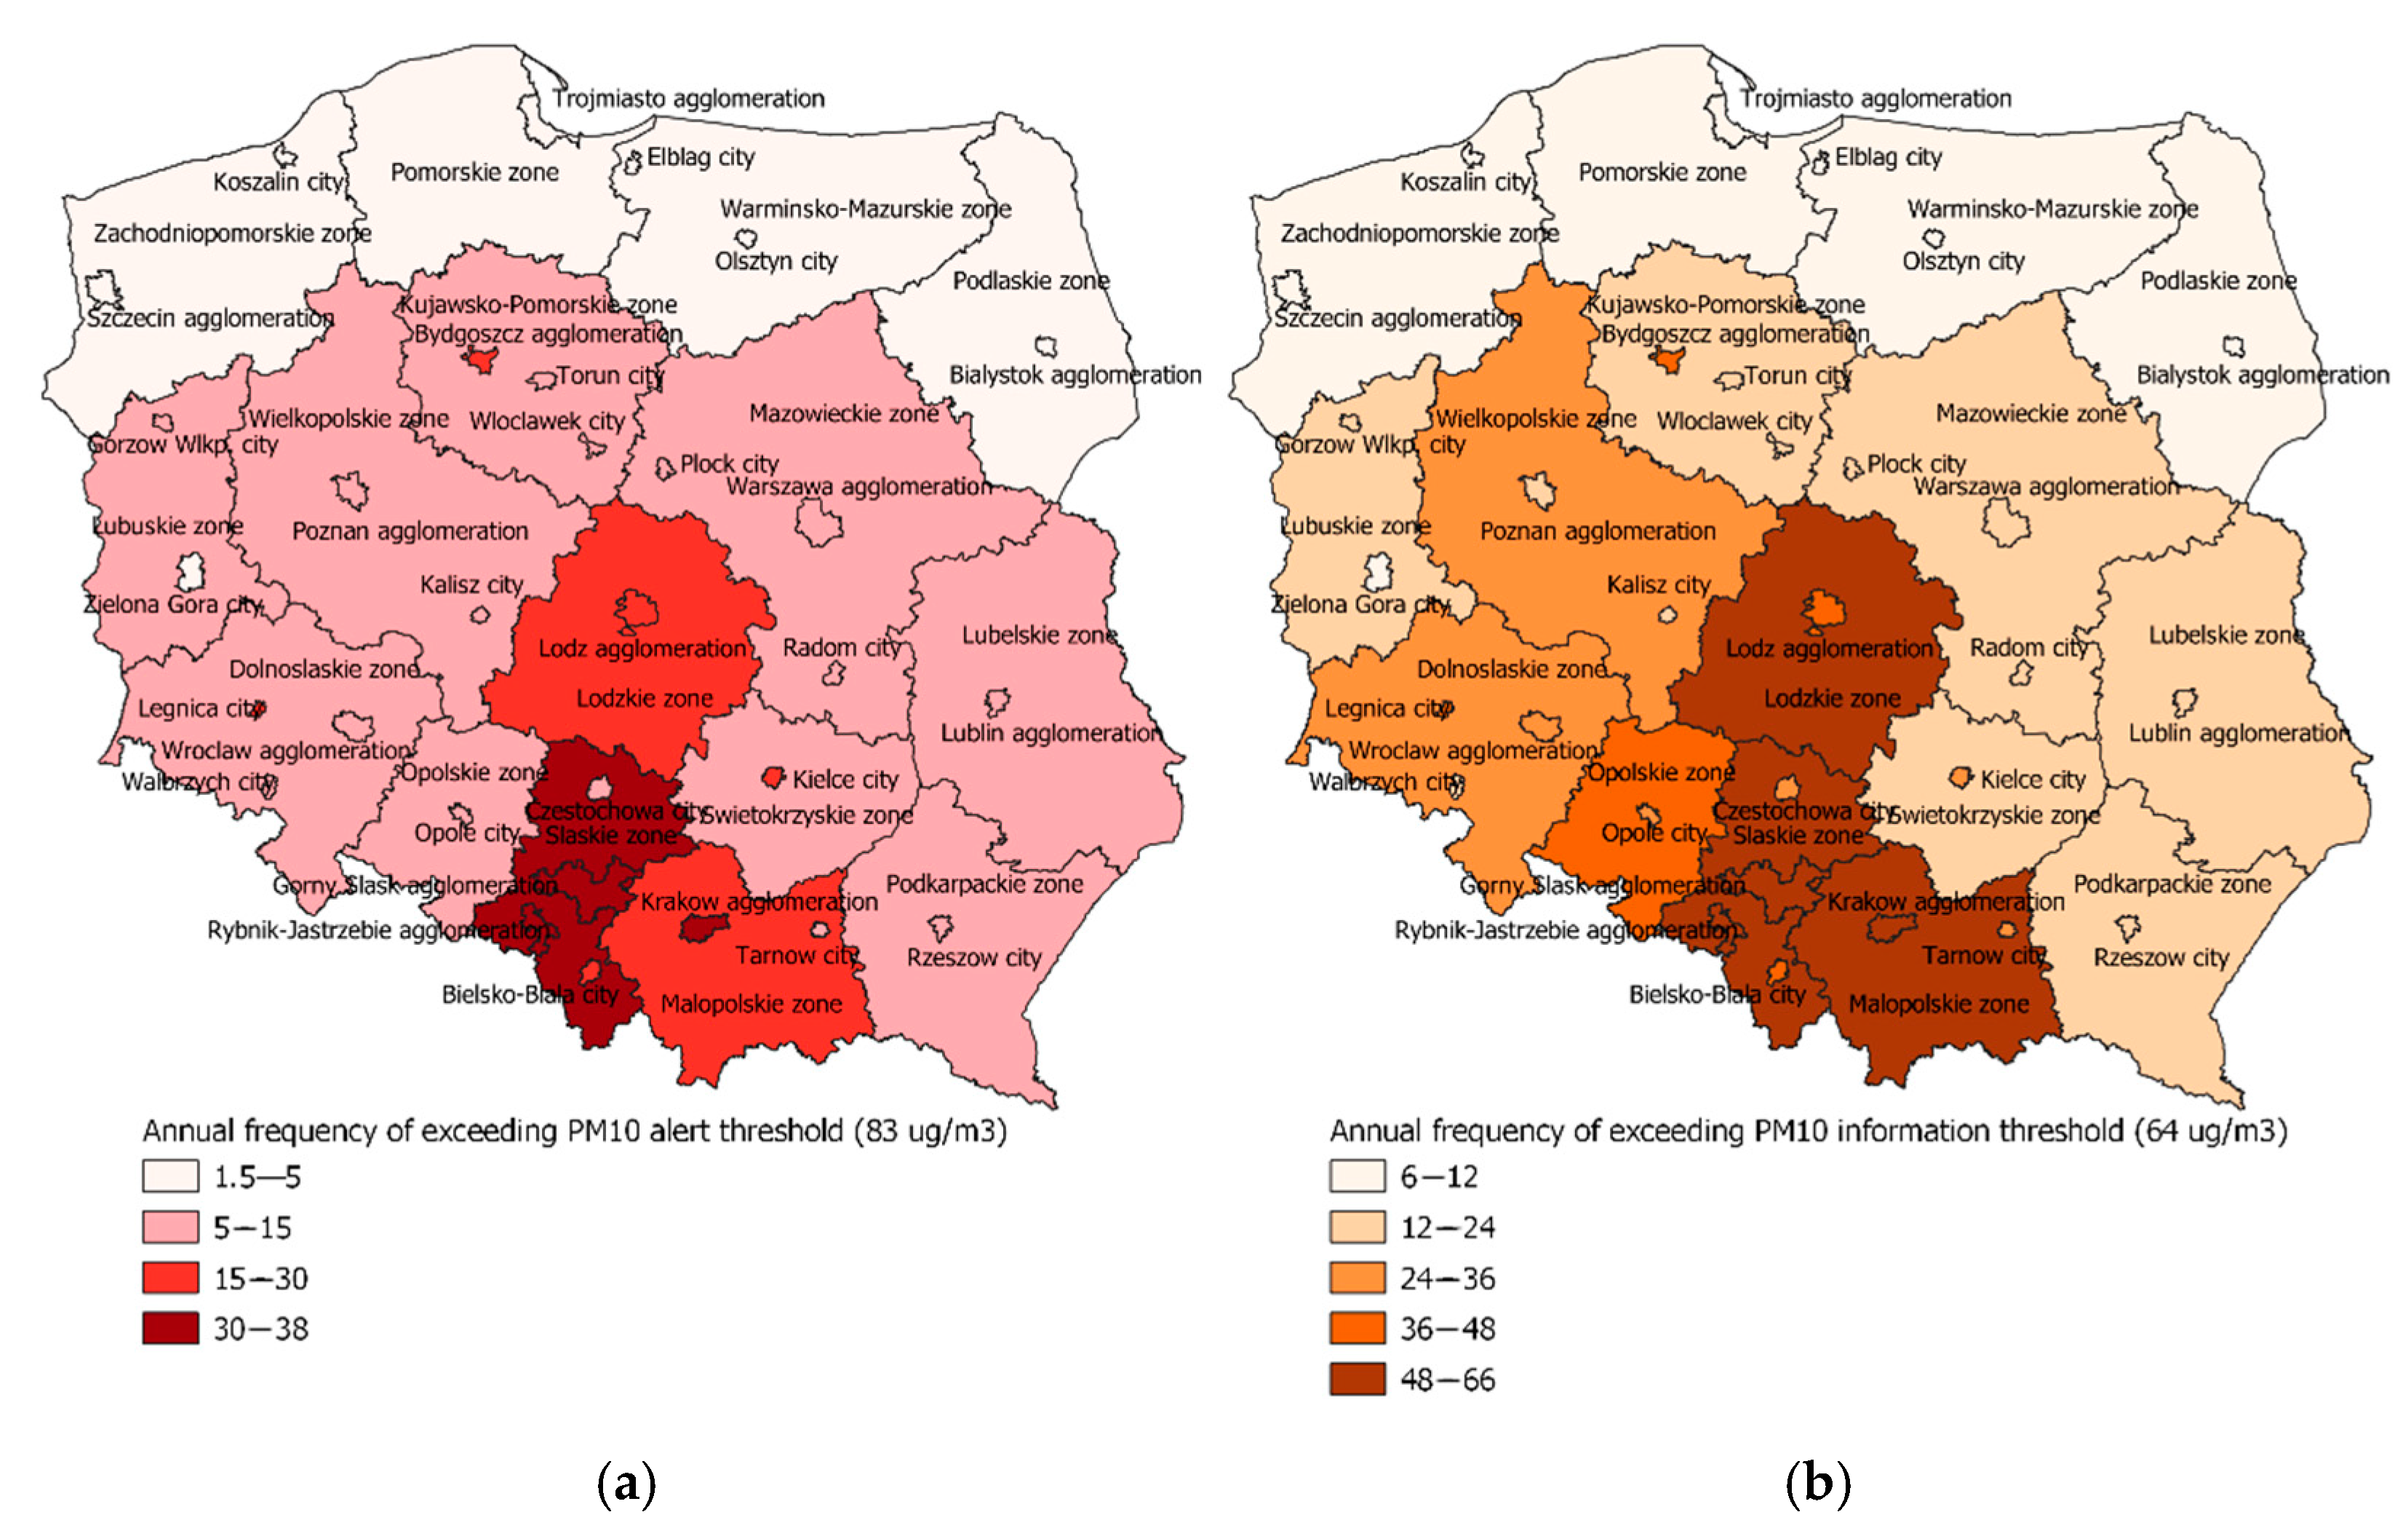
To achieve 75% of the health gain (reduced hospitalizations) expected for the BCS, the threshold equal to 64 µg/m
3 would be required, and for 50% of BCS, the threshold for daily PM10 should be 83 µg/m
3. As the results summarized in
Table 2 indicate, such thresholds would be linked with limited frequency of alerts: On average 12 times per year in all zones in Poland (from less than 2 times in Białystok agglomeration located in the North-East part of Poland to 38 times in Rybnik-Jastrzębie agglomeration in the South—see
Figure 4a). Suggested information threshold would be reached on average 25 times annually, ranging from 6 times in Koszalin city and Podlaskie zone up to 66 times in the Rybnik-Jastrzębie agglomeration (
Figure 4b).
4. Discussion
The presented study aimed at optimizing the information and alert daily thresholds for PM with our own method based on population health impact perspective. It does include an arbitrary decision about the magnitude of the potential health gain associated with the prevention of peak concentrations but is transparent and based on the actual local data on air pollution and health.
Setting information and alert thresholds in the EU Member States is voluntary and there is no unified approach to this problem. Usually, such choice is based on statistical probability of frequency of exceeding certain concentrations. Our method is more complex and includes a health dimension introduced by quantifying potential health gains described as potential reduction of hospital admissions which could be achieved if the smog alerts would be issued early enough to undertake efficient measures to improve air quality and prevent concentration peaks.
Calculations performed with the proposed method show that the relation between alert levels and health gains is exponential. The best-case scenario (BCS), i.e., alert threshold set at 50 µg/m3 (equal to daily WHO air quality guideline level, allowed in the EU to be exceeded 35 times per year), which would provide the largest reduction in health outcomes, was used as a reference. The proposed information threshold was set at 75% of the BCS and alert threshold at 50% of the BCS, which resulted in PM10 values of 64 µg/m3 and 83 µg/m3, respectively. If the air quality in Poland remained at a current level, these values would be, on average, exceeded in all zones 25 and 12 times per year, respectively. Lower thresholds would result in larger potential health gains, but would be announced more frequently, especially in highly polluted areas. On the other hand, higher thresholds would reduce the health gains and would be extremely rare in less polluted areas, even though also in these areas further improvement of air quality is necessary.
It is worth noticing that the approach used within this study has been based on the assumption that a certain PM10 daily alert threshold implies that this value is not exceeded in the zone, because proper short-term air quality improvement strategies are undertaken early enough to prevent the PM concentration increase above this threshold. Of course, such situation is an ideal one and most likely it would never be fully achieved in reality, however it is an assumption allowing determination of the recommended information and alert thresholds on the basis of potential measurable health benefits for the population, rather than setting these values arbitrarily.
Technically, the proposed scenarios consist of eliminating PM10 peak concentrations, exceeding a certain threshold values. Such type of a scenario was also applied in the APHEKOM recommendations; however, it was proposed to be used for calculating short-term impacts of ozone [
30]. In present study it was used with the primary intention of determining reasonable values of information and alert thresholds for PM10, rather than estimating plausible health benefits due to decrease of population exposure to air pollutants.
The present approach has its limitations. The first group of limiting factors relates to input data uncertainty. The air quality monitoring in Poland is performed in more sites for PM10 than for PM2.5 concentrations, while the RR values for the short-term impact are set for PM2.5 levels. Therefore, it was necessary to recalculate PM10 to PM2.5, which results in an uncertainty. To reduce it, we have applied location- and month-specific PM2.5/PM10 conversion factors, which varied from 0.37 to 1.0. Such approach results in a smaller uncertainty than a commonly used fixed conversion factor of 0.7 while estimating PM2.5 levels based on PM10 measurements, as recommended in the guidelines of the APHEKOM project [
30].
Hospital admission data was available for each commune, while data on PM exposure was an average for a whole zone, sometimes covering several dozen communes. Moreover, the existing differences in hospital availability in rural and urban areas were not accounted for, possibly affecting a reliability of the number of hospital admissions as an indicator of the incidence of considered health effects in various communes.
The concentration-response function used is based on studies conducted in various European countries (Czech Republic, France, Spain, UK) but not in Poland. While the association between short term changes in air pollution and mortality has been analysed for some cities in Poland [
31,
32], no such analysis was performed considering hospital admissions as the health outcome. It is possible that the health status of patients hospitalized due to cardiovascular and respiratory diseases, as well as its relation with daily air pollution levels, is different in Poland than in the other countries, with differently organized health system. This might introduce an error in estimation of the health gain due to the avoidance of the pollution peaks exceeding information and alert thresholds. This error could be reduced if locally conducted epidemiological studies, linking hospital admissions with daily air pollution levels, would be available.
Smooth form of the relation between the health gain and exposure requires an arbitrary rule for setting of the threshold values, which remains the largest limitation of this study. We decided that the most justified approach would be to use some standard parameters of the health gain distribution, such as quartiles and therefore the proposed thresholds correspond with 75% and 50% of the BCS. However, any other percentile could have been chosen. In any case, this decision is informed by the ultimate gain of this action, which is population health protection.
Another limitation concerns differences in defining threshold exceedance. According to the national regulation, smog alerts are announced every time the alert threshold is exceeded even at a single monitoring station, although in an AQ zone there is usually more than one station. When health impact assessment is considered, population exposure to air pollutants is more accurately represented by an average concentration from all stations within a certain AQ zone. With such approach, alarms would certainly be announced with different frequency than if they were based on measurements from single stations. As proposed thresholds should primarily serve initiating short-term actions improving air quality, and such actions usually concern the area of the whole AQ zone, PM levels averaged over whole zones seem more adequate for our health-oriented method.
5. Conclusions
The proposed approach provides a transparent support to the decision makers for selection of the information and alert thresholds for air pollutants with health effects occurring at all observed concentrations, with no sharp changes in the slope of the concentration-response function. The information and alarm threshold was proposed to be set at PM10 values of 64 µg/m3 and 83 µg/m3, respectively. They would provide 75% and 50% of the health gain expected to be achieved if PM10 would not exceed the EU limit value of 50 µg/m3. At the current air pollution levels in Poland, these values would be, on average, exceeded in all zones 25 and 12 times per year, respectively. Health gains expected to be due to the prevention of pollution levels exceeding the selected thresholds can be easily communicated to residents of affected regions, justifying and involving them in activities to improve air quality. With this approach, the information about excessive PM levels is communicated not only in areas with extremely poor air quality but also in regions with less frequent pollution peaks. This helps in perceiving air pollution as a national, and not only as a local health problem.
The advantage of the method presented in this study is that it provides the framework for science-based policies concerning atmospheric air quality. Thanks to the results of this analysis, in October 2019 Polish authorities issued an amendment to a national regulation, reducing the former PM10 daily information and alert thresholds by half (from 200 to 100 µg/m3 and from 300 to 150 µg/m3, respectively). The presented method can also be used to determine thresholds for subsequent levels of air quality indices, providing more unified approach to informing the society about health risks of atmospheric air pollution.


 ,
, 


