Article

Prioritization in Strategic Environmental Assessment Using Fuzzy TOPSIS Method with Random Generation for Absent Information in South Korea

1
Department of Civil and Environmental Engineering, Konkuk University, Seoul 05029, Korea
2
Department of Safety, Health and Environmental Engineering, Hungkuang University, Taichung 43302, Taiwan
3
Department of Civil and Environmental Engineering, Princeton University, Princeton, NJ 08544, USA
4
Korea Hydro & Nuclear Power Co. Ltd., Chuncheon 24202, Korea
5
Department of Civil Engineering, Kyonggi University, Suwon 16227, Korea
*
Author to whom correspondence should be addressed.
Sustainability 2021, 13(3), 1458; https://doi.org/10.3390/su13031458
Submission received: 27 November 2020 / Revised: 20 January 2021 / Accepted: 25 January 2021 / Published: 30 January 2021
(This article belongs to the Collection Modeling and Simulations for Sustainable Water Environments)

Abstract

:
This study evaluated a fuzzy technique for order performance by similarity to ideal solution (TOPSIS) as a multicriteria decision making system that compensates for missing information with undefined weight factor criteria. The suggested Fuzzy TOPSIS was applied to ten potential dam sites in three river basins (the Han River, the Geum River, and the Nakdong River basins) in South Korea. To assess potential dam sites, the strategic environment assessment (SEA) monitored four categories: national preservation, endangered species, water quality, and toxic environment. To consider missing information, this study applied the Monte Carlo Simulation method with uniform and normal distributions. The results show that effects of missing information generation with one fuzzy set in GB1 site of the Geum River basin are not great in fuzzy positive-ideal solution (FPIS) and fuzzy negative-ideal solution (FNIS) estimations. However, the combination of two fuzzy sets considering missing information in Gohyun stream (NG) and Hoenggye stream (NH) sites of the Nakdong River basin has a great effect on estimating FPIS, FNIS, and priority ranking in Fuzzy TOPSIS applications. The sites with the highest priority ranking in the Han River, Geum River, and Nakdong River basins based on Fuzzy TOPSIS are the Dal stream 1 (HD1), Bocheong stream 2 (GB2) and NG sites. Among the sites in all river basins, the GB2 site had the highest priority ranking. Consequently, the results coincided with findings of previous studies based on multicriteria decision making with missing information and show the applicability of Fuzzy TOPSIS when evaluating priority rankings in cases with missing information.

1. Introduction

The long-term master plan for dam construction (LPDC) in South Korea is the most significant regulatory arrangement that oversees the activity of the dam development plan in areas where water resources are not sufficient. The LPDC is reformulated every 10 years based on Article 4 of “the Act on Construction of Dams and Assistance, etc., to their Environs” and mainly consists of the basic policy of dam construction, prediction of the water supply and demand, regional dam construction plan, financing plan, flood control plan, and mitigation methods for environmental impacts, etc. The LPDC is not the final stage to determine the feasibility of dam sites because the actual and specific dam construction sites are not confirmed in the process. However, it establishes basic policies on dam construction and plans for each water system and sets up the site selection criteria for dam construction [1].
The strategic environmental assessment (SEA) process for the national LPDC was suggested as an effective planning process because SEA not only includes environmental and social acceptance by aligning the master plan with related plans but also incorporates feedback to improve the master plan. Thus, SEA is a very useful approach for dam planners to recognize environmental and sustainability issues. In South Korea, SEA was implemented in the LPDC for 2001–2011 to assess the most suitable sites among ten proposed dam construction sites. However, the applied data set for SEA contained missing information and suggested suitable sites without applying robust decision-making techniques. Thus, many studies have been conducted to investigate methods for reducing uncertainty when applying insufficient datasets and to robustly identify the priority of proposed dam construction sites.
Park et al. [2] applied AHP, PROMETHEE II, ELECTRE III, and Compromise Programming as multiple criteria decision making (MCDM) methods and provided insufficient data with uniform and binomial distribution generations. They arranged the priority ranking of potential dam sites in five different river basins. Additionally, Park and Um [3] used AHP, Maximax, Maximin, Hurwicz, and the equal likelihood criterion method as MCDM methods and used normal and uniform distributions to fill in data gaps. They classified the priority ranking results for three river basins. Kim et al. [4] adopted the VIKOR method as an MCDM method and used different classifications and uniform distributions to generate missing data. That study investigated the dependence of the priority ranking results on the weight of the strategy of the maximum group utility (α) of the VIKOR method in an entire river basin.
This study applied the fuzzy technique for order performance by similarity to ideal solution (TOPSIS) as the MCDM method with insufficient information and analyzed the results of priority rankings for an entire river basin and for three different river basins. TOPSIS is one of the well-known MCDM techniques suggested by Hwang and Yoon [5]. In particular, the United Nation Environmental Program (UNEP) has proposed a TOPSIS-type approach to deal with water resource development projects [6]. The TOPSIS method involves calculating the geometric distance between each alternative and the ideal positive and negative ideal solutions [7]. Additionally, Chen [8] extended TOPSIS with triangular fuzzy number concepts and introduced a vertex method to calculate the distance between two triangular fuzzy numbers. Fuzzy TOPSIS has been widely used in the airline industry [9], bridge risk assessment [10], garment industry [11], traffic noise abatement [12], nuclear power plants [13], etc.
In the field of water resources, Afshar et al. [6] used a Fuzzy TOPSIS method to solve a water resources management problem in the Karun River Basin in Iran. Senent-Aparicio et al. [14] applied Fuzzy TOPSIS coupled with the SWAT model to assess the headwaters of the Segura River basin, Spain. Noori et al. [15] investigated the optimal dam sites in Kermanshah Province, Iran, with the Fuzzy TOPSIS method. In addition, Fuzzy TOPSIS has been applied to many other water resources issues such as water supply [16], irrigation water allocation [17], water quality failure evaluations [18,19], and water loss management [20]. Particularly, in South Korea, the Fuzzy TOPSIS method has been used to resolve various water resource problems. Fuzzy TOPSIS has been used to assess the spatial water resource vulnerability index of the North Han River basin by Jun et al. [21], the most suitable sites for treated wastewater use in the Anyangcheon basin by Kim et al. [22] and Chung and Kim [23], flood vulnerability in the Han River by Lee et al. [24] and water use vulnerability in the 12 main river basins by Won et al. [25].
However, previous Fuzzy TOPSIS application studies did not consider missing information and did not investigate the performance of Fuzzy TOPSIS as absent information exists. It is therefore necessary to examine the performance of FPIS, FNIS, and cloudiness and to understand the characteristics of Fuzzy TOPSIS results for absent information. This study investigated the application results of the Fuzzy TOPSIS method as an MCDM approach to assess the priority ranking of proposed dam sites under conditions with missing information and provides the priority ranking results and variables of the Fuzzy TOPSIS method, such as fuzzy positive-ideal solution (FPIS), fuzzy negative ideal solution (FNIS), and cloudiness coefficients. Finally, this study compared the characteristics of the Fuzzy TOPSIS approach under incomplete data conditions with those of previous studies.

2. Methods

2.1. Proposed Dam Sites E

The LPDC in South Korea is the highest-ranking administrative plan and provides a long-term vision of water resource development and basic ideas about dam planning based on sustainable water resources and environmental strategies for the entire territory of the nation in Figure 1. Assessment indicators are selected for the plan based on the possible objectives and directions, the strategy of sustainable development, and environmental-friendly development rather than environmental effects, such as site conditions and pollution production. The SEA of the LPDC involves monitoring four objectives at ten potential dam sites. However, national preservation and toxic environmental indicators are not fully monitored, and it is necessary to consider how to add this missing information. This study used Monte Carlo Simulation of uniform and normal distributions to generate missing information and applied the Fuzzy TOPSIS method to assess the priority ranking of ten proposed dam sites, as shown in Figure 2.
The South Korean government has proposed ten potential dam sites, shown in Table 1 and Figure 3: four sites are located in the Han River basin, two sites are located in the Geum River basin, and the remaining four sites are located in the Nakdong River basin. Among the four sites in the Han River basin, two sites are on the Sooip stream (SS), and the other two are on the Dal stream (DS), which are tributaries of the Han River. The two proposed sites in the Geum River basin are on the Bocheong stream (BS), a tributary of the Geum River. The four proposed sites in the Nakdong River basin are on the Im stream (IS), Mansoo stream (MS), Gohyun stream (GS), and Hoeggye stream (HS), which are tributaries of the Nakdong River.
This study selects four socio-ecologic-environmental assessment classes to evaluate the proposed dam sites and to evaluate environmental risks in terms of the social, ecological, and environmental objectives in Table 2. To accurately evaluate the environmental feasibility of the proposed sites, this study suggested the subfactors in each class. National preservation (including historic and scenic preservation), endangered species of wildlife, water quality (in terms of total phosphorus (TP), total nitrogen (TN), chemical oxygen demand (COD), biological oxygen demand (BOD)), and toxic environmental factors (the number of abandoned mines) were designated the main evaluation parameters.

2.2. Study Framework

To assess the suitability of the proposed dam sites, this study investigated four categories, namely, national preservation (NP), endangered species (ES), water quality (WQ), and toxic environment (TE), as shown in Table 2. The NP category contained natural preservation and historic and scenic preservation, as noted in Table 3. Table 3 shows that the NG and NH sites do not have information on either natural preservation or historic and scenic preservation (NP1~NP4). The ES category covers seven types of organisms: amphibians and reptiles, benthic macroinvertebrates, and fish as water organisms and birds, mammals, insects, and plants as land organisms, as shown in Table 4. Table 5 shows that the WQ category is composed of four parameters: TP, TN, COD, and BOD. For TE, this study has selected the number of abandoned mines, as shown in Table 6. However, the TE category features three sets of missing information (TC1, TC2, and TC3) in the GB1, NG and NH sites.
For the fuzzy indicator, this study assessed the monitoring information of four classes based on the fuzzy indicator as very low (VL), low (L), medium (M), high (H), and very high (VH) in Table 3, Table 4, Table 5 and Table 6.

2.3. Generation of Missing Information

This study contains seven sets of missing information. Four sets of missing information (NP1–NP4) are associated with the NP objective in Table 3, and three sets of missing information (TC1–TC3) are associated with the TE objective in Table 6. To make up for these seven sets of missing information, this study used the Monte Carlo Simulation sampling method with uniform and normal distributions, as shown in Figure 4. The total number of missing information simulations is 1000 for each distribution.

2.4. Fuzzy TOPSIS

The importance weights of various criteria and the ratings of qualitative criteria are considered linguistic variables in this study. These linguistic variables can be expressed with a numeric membership function based on positive triangular fuzzy numbers, as shown in Table 7.
The Fuzzy TOPSIS method procedure was introduced by Chen [8]. This study adopted linguistic factors, listed in Table 1 and Table 2, which can be represented with positive triangular fuzzy numbers.
A fuzzy MCDM problem that can be generally expressed in matrix format as
D ˜ = A 1 A 2 A 3 C 1 C 2       C n [ x ˜ 11 x ˜ 12 x ˜ 1 n x ˜ 21 x ˜ 22 x ˜ 2 n x ˜ m 1 x ˜ m 2 x ˜ m n ]
W ˜ = [ w ˜ 1 , w ˜ 2 , , w ˜ n ]
where A i represents the alternatives, C i represents the criteria or attributes, x ˜ i j denotes the fuzzy performance rating, and w ˜ j (j = 1, 2, …, n) represents the fuzzy weight for each criterion. x ˜ i j and w ˜ j can be expressed by triangular fuzzy numbers, such as x ˜ i j = ( a i j , b i j , c i j ) and w ˜ j = ( w j 1 , w j 2 , w j 3 ) .
To avoid the complicated normalization formula used in classical TOPSIS, the linear scale transformation is used here to transform the various criteria scales into a comparable scale. The normalized fuzzy decision matrix denoted by r ˜ i j can be calculated as follows:
r ˜ i j = ( a i j c j * , b i j c j * , c i j c j * ) ,     c j * = max i c i j     i f     j B
r ˜ i j = ( a j c i j , a j b i j , a j a i j ) ,   a j = min i a i j     i f     j C
where B and C represent the set of benefit criteria and cost criteria, respectively.
Next, the weighted normalized fuzzy matrix,   v ˜ i j , is calculated by multiplying the normalized fuzzy decision matrix and weights values, w ˜ j , as follows:
v ˜ i j = r ˜ i j ( · ) w ˜ j
To equivalently reflect the effect of weight values, this study generates w ˜ j values between one and nine and applies all possible cases to all normalized fuzzy decision matrices. This study applied triangular fuzzy numbers as weight values in this study, as shown in Table 8.
Then, the FPIS (A+) and FNIS (A) are estimated as follows:
A + = m a x ( v ˜ 1 + , v ˜ 2 + , , v ˜ n + )
A = m i n ( v ˜ 1 , v ˜ 2 , , v ˜ n )
The Euclidian distance equation is applied to estimate the distance of two fuzzy numbers, A ˜ 1 = ( a 1 , b 1 , c 1 ) and   A ˜ 2 = ( a 2 , b 2 , c 2 ) , as follows:
d ( A ˜ 1 ,   A ˜ 2 ) = 1 3 [ ( a 1 a 2 ) 2 + ( b 1 b 2 ) 2 + ( c 1 c 2 ) 2 ]
The distance of each alternative from FPIS (A+) and FNIS (A) can be currently determined as
d i + = j = 1 n d ( v ˜ i j , A i + ) ,       i = 1 , 2 , , m
d i = j = 1 n d ( v ˜ i j , A i ) ,       i = 1 , 2 , , m
where m denotes the number of alternatives and d(·,·) is the distance measurement between two fuzzy numbers.
A closeness coefficient ( C C i ) for each alternative (Ai, I = 1, 2, …, m) is estimated with FPIS and FNIS as follows:
C C i = d i d i + + d i ,   i = 1 ,   2 , , m
The closeness coefficient (CC) ranges between 0 and 1. The ranking of all alternatives can be determined by a descending order of CC values. In other words, a higher CC value indicates a better alternative in fuzzy MCDM problems.

3. Results

This study applied 625,000 generations to estimate priority rankings in the Fuzzy TOPSIS method. The 625,000 generated data sets were calculated from the 1000 generated data sets for seven sets of missing information with uniform and normal distributions multiplied by 625(= Π 5 4 ) to account for the five possible weights in Table 8 of the four categories. This study adopted a box plot, and mean values were calculated to represent all results.
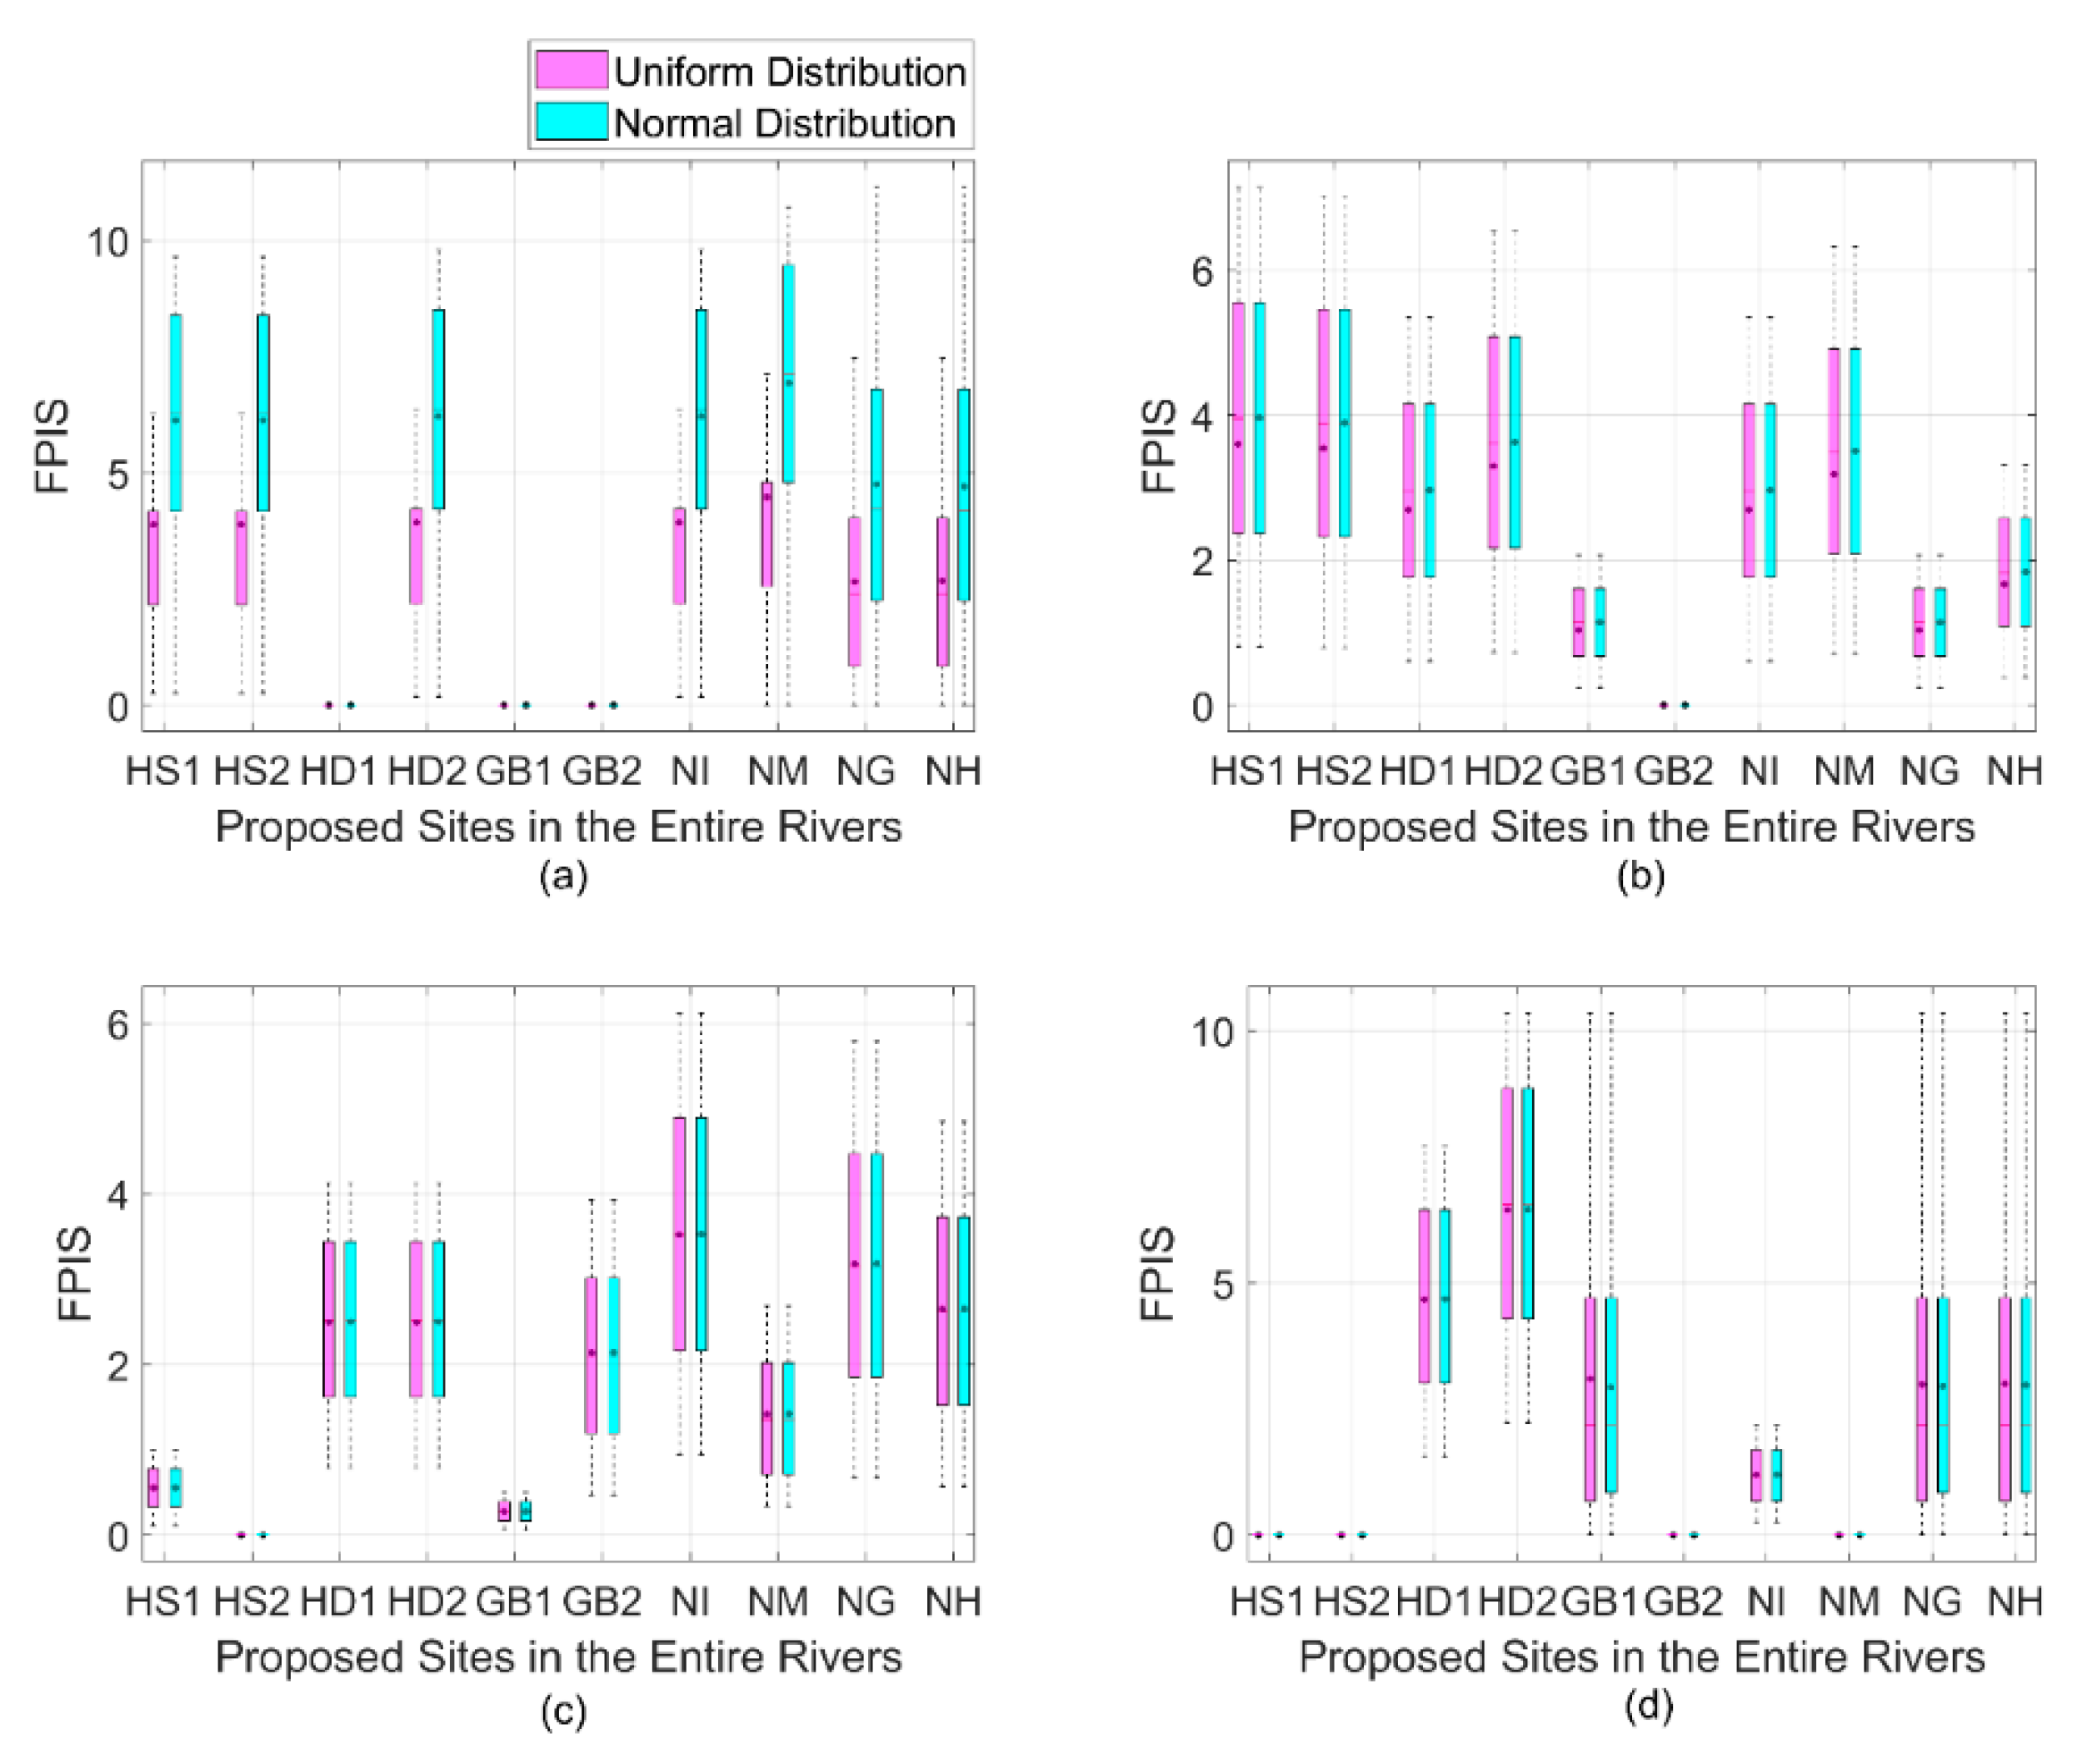
The box plots of FPIS (A+) results based on the four classes are represented in Figure 5. The FPIS box plots are close to zero in the HD1, GB1, and GB2 sites for NP; the GB2 site for ES; the HS2 and GB1 sites for WQ; and the HS1, HS2, GB2, and NM sites for TE. This indicates that the normalized fuzzy decision numbers ( r ˜ i j ) from Equation (3) in the above sites are small because the triangular fuzzy numbers ( a i j , b i j , c i j ) in the above sites are too small to compare with the maximum fuzzy numbers ( c j * ).
The box plots of FPIS for the ES and WQ classes in Figure 5b,c are similar, regardless of the use of the normal or uniform distribution for missing information generation, because there was no missing information in these two classes. However, the NP class shows much greater differences in the box plots between normal and uniform distributions than other classes. This is because the NP class contains four sets of missing information with two fuzzy sets (natural preservation and historical and scenic preservation) at the NG and NH sites. This combination of missing information and two uncertain fuzzy sets creates great uncertainty, and the box plots are very different depending on the generation methods. Particularly, to fill missing information, the normal distribution generation provides a greater maximum of the weighted normalized fuzzy set in Equation (5) than uniform distribution generation.
However, the TE class in Figure 5d features three sets of missing information with one fuzzy set at the GB1, NG, and NH sites. In this case, there is only one uncertain fuzzy set, unlike in the national preservation case. This fuzzy set produces constant maximum fuzzy numbers ( c j * ) in Equation (3) for both uniform and normal missing information generation, because the probability of the generated numbers having an effect on the maximum number in a TE class fuzzy set is small. These constant maximum fuzzy numbers ( c j * ) lead to almost identical box plots between the generation methods for the TE class.
Figure 6 shows the box plots of FNIS (A-) results for the four categories. The FNIS box plots are close to zero for the NM site in national preservation (Figure 6a), HS1 and HS2 sites in ES in Figure 6b, NI site in WQ and HD2 site in TE (Figure 6d). These sites are characterized by distances of d ( A ˜ 1 ,   A ˜ 2 ) from Equation (7) that are very small and fuzzy set numbers that are close to the minimum fuzzy number ( c j * ) in Equation (4). Likewise, the FPIS box plot in Figure 4 shows that the differences in the box plots of the GB2, NG and NH sites based on different generation methods for the TE class in Figure 6d are very small because the generated numbers of the fuzzy set in the TE are rarely effective in calculating the minimum fuzzy numbers ( c j * ) in Equation (4).
Figure 7 shows CC box plots for the proposed dam sites in different basins. A higher CC indicates a more suitable site. In other words, a high CC implies that the d i to d i + ratio from Equation (11) is high. At all sites, the uniform distribution generation method yields slightly higher means and boxes than the normal distribution generation method. In the Han River basin, the HS1, HS2, and HD1 sites show similar CC box plots, but the HD1 site has slightly higher CC values than the HS1 and HS2 sites. The CC values from the normal distribution generation method are greater than 0.2, but the CC values from the uniform distribution generation method are less than 0.2, except for HD2. The HD2 site shows very low CC results. In the Geum River basin, the GB2 site has greater mean and median CC values than the GB1 site. In the Nakdong River basin, the box plots of the NG and NH sites are only slightly different. This result demonstrates that the priority rankings of the NG and NH sites are not overwhelming different and are similar to each other.
Figure 8 shows box plots of the priority rankings of the suitable sites based on uniform and normal distribution data generation for the seven No Data components in Table 3 (NH1~NH4) and Table 6 (TC1–TC3). Among all the sites in the river basins, GB2 and GB1 rank first and second, respectively, and HD2 represents the tenth priority rank in all cases. This suggests that the ranks of these three sites are not influenced by the generation of the missing information in Table 3 and Table 6. The other seven sites are presented as box plots because the priority rankings of the seven sites change depending on the cases. This also implies that these seven sites were affected by generation of the missing information. However, in the Han River and Geum River sites, the priority rankings of each river site are constant in all cases. This indicates that the relative site comparison in the Han River and Geum River basins is not affected by changes in the generation of the missing information. In the Han River, the order of the site priority rankings is HD1, HS2, HS1, and HD2. In the Geum River, the GB2 site is a higher priority site than the GB1 site. However, in the Nakdong River basin, the order of site priority ranking changes depending on the method for generating the missing information. The NH site has a better priority ranking than the NG sites for normal distribution is applied for information generation, but the NG and NH sites have almost the same mean and median values when the uniform distribution is applied for information generation. The only distinctly different result between the NG and NH sites under uniform distribution information generation in the Nakdong River basin is the third quartile in Figure 8. The priority rankings of the NM and NI sites are stable regardless of the missing information generation method, either normal distribution or uniform distribution. Consequently, the missing information generation method has an effect on priority comparison for the entire river basin and for the Nakdong River basin. However, the priority site analyses in the Han River and Geum River basins are not influenced by the choice of missing information generation method.
Figure 9 shows the selected percent of the most suitable (first priority ranking) proposed sites by river basins. In all river basins in Figure 9a, GB2 is selected over 80% of the time, and GB1 is chosen less than 20% of the time under both normal and uniform distribution generation methods. In the Han River in Figure 9b, HD1 is chosen as the most suitable site among the four sites in all missing information generations, and there are no other secondary suitable sites for dam planning. In the Geum River in Figure 9c, GB2 is selected approximately 80% of the time, and GB1 is selected approximately 20% of the time under the two generation methods. The results for the Geum River in Figure 9c are the same for the entire river basin in Figure 9a because among the ten proposed sites, GB1 and GB2 are the two most suitable sites (highest priority rankings) in the entire river basin. In the Nakdong River in Figure 9d, the NG site is more suitable than the other sites. The difference in the selection percentage between the NH and NG sites differs among the missing information generation methods. The uniform distribution generation method results in a greater difference in selected selection percentage between NH and NG sites than normal distribution generation. In addition, the NI site is not the most suitable site in any cases. This reveals that the NI site is the least suitable site for dam construction planning among the four sites in the Nakdong River in Figure 9d. Consequently, the order of suitable dam planning sites in the Nakdong River based on the two missing information generation methods is as follows: the NG, NH, NM, and NI sites.

4. Discussion

In Figure 5 and Figure 6, FPIS and FNIS results between normal and uniform distribution generation for missing information are different in natural preservation and toxic environment categories. In the natural preservation category, normal distribution generation is greater FPIS than the unform distribution application for missing information. However, FPIS and FNIS results with two different generation methods in the toxic environment category are similar as shown in Figure 5d and Figure 6d. It is determined that the results of difference in the natural preservation is greater than the toxic environment category because of the combination of four uncertain numbers in the natural preservation. In other words, these results show that the combination of the missing information including the natural preservation category (NP1–NP4) influences FPIS and FNIS calculations while the single missing information including the toxic environment category (TC1–TC3) do not have a great effect on FPIS and FNIS calculations. Regarding CC estimation as shown in Figure 7, the uncertainties of NG, NH, and GB sites which contain absent information are not dominant from other sites. The CC values of the uniform distribution generation are higher than the CC values of normal distribution generation for all sites in Figure 7.
In Figure 8, the estimated priority rankings for NG and NH sites show the large differences comparing with other sites. Similarly, the missing information (NP1–NP4 and TC2–TC3) are centralized to NG and NH sites and these missing information produce various rankings in NG and NH sies. HS1–HS2 sites in Figure 8a and NI and NM sites in Figure 8d show different rankings due to the change of rankings in NG and NG sites. In addition, Figure 8c represents that the missing information generation of TC1 seems not to affect the estimation of ranking in the Geum River.
Overall, the GB1 and GB2 sites are the most suitable sites for dam construction planning in entire river basin. In particular, the GB2 site is the most suitable site for dam planning if a decision-maker is required to choose one site for dam planning. HD1 is the most suitable site if a decision-maker is choosing among dam planning sites in the Han River basin. Three of the four sites in the Nakdong River are considered suitable sites, and there is no single outstandingly suitable dam planning site.
For comparison with the findings of previous studies [2,3], the highest priority rankings in the Han River basin and Geum River basin, namely, HD1 and GB2, in this study are selected. However, the highest priority ranking in the Nakdong River basin in this study differs from that in previous studies, as NG site is considered higher priority than the NH site, although previous studies showed that the NH site was higher priority than the NG site. The main reason for these different results in the Nakdong River basin between previous studies and this study is the difference in evaluation with the fuzzy set of this study and the site assessment results of previous studies. Based on this analysis, it would be better to consider both the NG and NH sites the highest priority sites in the Nakdong River basin.

5. Conclusions

This study investigated the performance of the Fuzzy TOPSIS method in generating a missing information set. This study used the dam planning assessment based on socioenvironmental data categorized as NP, ES, WQ, and TE. There are seven missing sets in the data set, and these gaps were filled with Monte Carlo-generated data with normal and uniform distributions. This study pointed out that the FPIS and FNIS of each alternative do not distinctly vary in data sets containing one fuzzy set and missing information but do show large differences in data sets containing two fuzzy sets and missing information. This is because the Fuzzy TOPSIS method used the maximum and minimum weighted normalized fuzzy values to estimate the priority ranking.
The priority rankings of proposed dam sites in different basins are classified in this study. Based on the entire river basin, GB2 is the dominant proposed dam site, and GB1 is also a suitable dam site. Based on various analysis approaches, the HD1, GB2, and NG sites are the highest priority sites in the Han River, Geum River, and Nakdong River basins, respectively. The priority rankings of the Han River sites are constant between the different methods for generating missing information. However, the priority rankings of the proposed sites in the Geum River and the Nakdong River basins are influenced by the choice of the missing information generation method. Based on the results, this study concludes that Fuzzy TOPSIS produces robust priority rankings with probabilistic selection percentages for proposed dam sites with missing information. However, this study is still uncertain because the study applied Monte Carlo Simulation for missing information with uniform and normal distribution. Moreover, we do not know the actual distribution of absent information. For future research, it is necessary to apply various types of absent information to estimate the precise performance of Fuzzy TOPSIS and to investigate theoretical approaches for Fuzzy TOPSIS performance. Further, it needs to explore the most suitable MCDM approach to provide an optimal solution in absent information cases.

Author Contributions

Conceptualization, D.P. and K.J.; methodology, D.P. and H.-J.F.; investigation, J.-J.Z. and M.-J.U.; funding acquisition, T.K.; writing, review, and editing, D.P., K.J., S.K., and S.J. All authors have read and agreed to the published version of the manuscript.

Funding

This paper is supported by KOREA HYDRO & NUCLEAR POWER CO., LTD. (No. H18S023000) and by Konkuk University Research Fund in 2019.

Institutional Review Board Statement

Not applicable.

Informed Consent Statement

Not applicable.

Data Availability Statement

Not applicable.

Acknowledgments

This paper is supported by KOREA HYDRO & NUCLEAR POWER CO., LTD. (No. H18S023000) and by Konkuk University Research Fund in 2019. We thank the anonymous reviewers for their careful reading of our manuscript and their many insightful comments and suggestions.

Conflicts of Interest

The authors declare no conflict of interest.

References

  1. Song, Y.-I.; Park, D.; Shin, G.; Kim, C.; Grigg, N.S. Strategic environmental assessment for dam planning: A case study of south korea’s experience. Water Int. 2010, 35, 397–408. [Google Scholar] [CrossRef]
  2. Park, D.; Kim, Y.; Um, M.-J.; Choi, S.-U. Robust priority for strategic environmental assessment with incomplete information using multi-criteria decision making analysis. Sustainability 2015, 7, 10233–10249. [Google Scholar] [CrossRef] [Green Version]
  3. Park, D.; Um, M.-J. Robust decision-making technique for strategic environment assessment with deficient information. Water Resour. Manag. 2018, 32, 4953–4970. [Google Scholar] [CrossRef]
  4. Kim, Y.; Park, D.; Um, M.-J.; Lee, H. Prioritizing alternatives in strategic environmental assessment (SEA) using VIKOR method with random sampling for data gaps. Expert Syst. Appl. 2015, 42, 8550–8556. [Google Scholar] [CrossRef]
  5. Hwang, C.-L.; Yoon, K. Methods for multiple attribute decision making. In Multiple Attribute Decision Making; Springer: Berlin/Heidelberg, Germany, 1981; pp. 58–191. [Google Scholar]
  6. Afshar, A.; Mariño, M.A.; Saadatpour, M.; Afshar, A. Fuzzy topsis multi-criteria decision analysis applied to karun reservoirs system. Water Resour. Manag. 2011, 25, 545–563. [Google Scholar] [CrossRef] [Green Version]
  7. Assari, A.; Assari, E. Role of public participation in sustainability of historical city: Usage of topsis method. Indian J. Sci. Technol. 2012, 5, 2289–2294. [Google Scholar] [CrossRef]
  8. Chen, C.-T. Extensions of the topsis for group decision-making under fuzzy environment. Fuzzy Sets Syst. 2000, 114, 1–9. [Google Scholar] [CrossRef]
  9. Torlak, G.; Sevkli, M.; Sanal, M.; Zaim, S. Analyzing business competition by using fuzzy TOPSIS method: An example of Turkish domestic airline industry. Expert Syst. Appl. 2011, 38, 3396–3406. [Google Scholar] [CrossRef]
  10. Wang, Y.-M.; Elhag, T.M. Fuzzy TOPSIS method based on alpha level sets with an application to bridge risk assessment. Expert Syst. Appl. 2006, 31, 309–319. [Google Scholar] [CrossRef]
  11. Yildiz, A. Interval type 2-fuzzy TOPSIS and fuzzy TOPSIS method in supplier selection in garment industry/Metoda fuzzy TOPSIS Interval tip 2 si metoda fuzzy TOPSIS în selectarea furnizorului din industria de confectii. Ind. Textila 2016, 67, 322. [Google Scholar]
  12. Garg, N.; Maji, S. Fuzzy TOPSIS approach in selection of optimal noise barrier for traffic noise abatement. Arch. Acoust. 2015, 40, 453–467. [Google Scholar] [CrossRef] [Green Version]
  13. Kurt, Ü. The fuzzy TOPSIS and generalized Choquet fuzzy integral algorithm for nuclear power plant site selection–a case study from Turkey. J. Nucl. Sci. Technol. 2014, 51, 1241–1255. [Google Scholar] [CrossRef] [Green Version]
  14. Senent-Aparicio, J.; Pérez-Sánchez, J.; Carrillo-García, J.; Soto, J. Using swat and fuzzy topsis to assess the impact of climate change in the headwaters of the segura river basin (se spain). Water 2017, 9, 149. [Google Scholar] [CrossRef] [Green Version]
  15. Noori, A.; Bonakdari, H.; Morovati, K.; Gharabaghi, B. The optimal dam site selection using a group decision-making method through fuzzy topsis model. Environ. Syst. Decis. 2018, 38, 471–488. [Google Scholar] [CrossRef]
  16. Onu, U.P.; Xie, Q.; Xu, L. A fuzzy TOPSIS model framework for ranking sustainable water supply alternatives. Water Resour. Manag. 2017, 31, 2579–2593. [Google Scholar] [CrossRef]
  17. Elleuch, M.A.; Anane, M.; Euchi, J.; Frikha, A. Hybrid fuzzy multi-criteria decision making to solve the irrigation water allocation problem in the Tunisian case. Agric. Syst. 2019, 176, 102644. [Google Scholar] [CrossRef]
  18. Islam, M.S.; Sadiq, R.; Rodriguez, M.J.; Najjaran, H.; Francisque, A.; Hoorfar, M. Evaluating water quality failure potential in water distribution systems: A fuzzy-TOPSIS-OWA-based methodology. Water Resour. Manag. 2013, 27, 2195–2216. [Google Scholar] [CrossRef]
  19. Li, P.; Qian, H.; Wu, J.; Chen, J. Sensitivity analysis of TOPSIS method in water quality assessment: I. sensitivity to the parameter weights. Environ. Monit. Assess. 2013, 185, 2453–2461. [Google Scholar] [CrossRef]
  20. Zyoud, S.H.; Kaufmann, L.G.; Shaheen, H.; Samhan, S.; Fuchs-Hanusch, D. A framework for water loss management in developing countries under fuzzy environment: Integration of Fuzzy AHP with Fuzzy TOPSIS. Expert Syst. Appl. 2016, 61, 86–105. [Google Scholar] [CrossRef]
  21. Jun, K.S.; Chung, E.-S.; Sung, J.-Y.; Lee, K.S. Development of spatial water resources vulnerability index considering climate change impacts. Sci. Total Environ. 2011, 409, 5228–5242. [Google Scholar] [CrossRef]
  22. Kim, Y.; Chung, E.-S.; Jun, S.-M.; Kim, S.U. Prioritizing the best sites for treated wastewater instream use in an urban watershed using fuzzy topsis. Resour. Conserv. Recycl. 2013, 73, 23–32. [Google Scholar] [CrossRef]
  23. Chung, E.-S.; Kim, Y. Development of fuzzy multi-criteria approach to prioritize locations of treated wastewater use considering climate change scenarios. J. Environ. Manag. 2014, 146, 505–516. [Google Scholar] [CrossRef] [PubMed]
  24. Lee, G.; Jun, K.S.; Chung, E.-S. Robust spatial flood vulnerability assessment for han river using fuzzy topsis with α-cut level set. Expert Syst. Appl. 2014, 41, 644–654. [Google Scholar] [CrossRef]
  25. Won, K.; Chung, E.-S.; Choi, S.-U. Parametric assessment of water use vulnerability variations using swat and fuzzy topsis coupled with entropy. Sustainability 2015, 7, 12052–12070. [Google Scholar] [CrossRef] [Green Version]
Figure 1. The long-term plan for dam construction (LPDC) including strategic environment assessment (SEA) in South Korea [1].
Sustainability 13 01458 g001
Figure 2. Priority ranking process of dam planning sites containing incomplete information in Fuzzy TOPSIS (Technique for Order of Preference by Similarity to Ideal Solution) application.
Sustainability 13 01458 g002
Figure 3. Location of the proposed dam sites in South Korea.
Sustainability 13 01458 g003
Figure 4. Histograms of missing information generation with two distributions: (a) uniform distribution; (b) normal distribution.
Sustainability 13 01458 g004
Figure 5. Fuzzy positive-ideal solution (FPIS) box plots of the proposed sites based on four categories: (a) national preservation, (b) endangered species, (c) water quality, and (d) toxic environment.
Sustainability 13 01458 g005
Figure 6. FNIS box plots of the proposed sites based on four categories: (a) national preservation, (b) endangered species, (c) water quality, and (d) toxic environment.
Sustainability 13 01458 g006
Figure 7. Box plots of the closeness coefficient (CC) for the proposed dam sites in different river basins with two different missing information generation methods for (a) the entire rivers, (b) the Han River, (c) the Geum River, and (d) the Nakdong River.
Sustainability 13 01458 g007
Figure 8. Priority rankings of suitable proposed dam sites in different basins based on two data generation methods. Black dots denote the mean of the generated results for (a) the entire rivers, (b) the Han River, (c) the Geum River, and (d) the Nakdong River.
Sustainability 13 01458 g008
Figure 9. Selection of suitable dam planning sites by basin with Fuzzy TOPSIS for (a) the entire rivers, (b) the Han River, (c) the Geum River, and (d) the Nakdong River.
Sustainability 13 01458 g009
Table 1. Potential dam planning sites for SEA in the LPDC.
BasinSite NameSite ID
Han RiverSooip stream 1HS1
Sooip stream 2HS2
Dal stream 1HD1
Dal stream 2HD2
Geum RiverBocheong stream 1GB1
Bocheong stream 2GB2
Nakdong RiverIm streamNI
Mansoo streamNM
Gohyun streamNG
Hoenggye streamNH
Table 2. Assessment objectives of the proposed dam sites.
ObjectivesMonitoring Indicators
National Preservation (NP)
  • Natural preservation, and historic and scenic preservation
Endangered Species (ES)
  • Water: amphibians and reptiles, benthic macroinvertebrates, and fish
  • Land: birds, mammals, insects, and plants
Water quality (WQ)
  • TP, TN, COD, and BOD
  • Stream water quality assessment for investigation results
Toxic Environment (TE)
  • Abandoned mines in dam basins (assessment of potential soil and water pollution)
Table 3. Monitoring data and fuzzy indicators for the national preservation objective.
BasinsSite IDNatural PreservationHistoric and Scenic PreservationFuzzy Set
(Natural Preservation)
Fuzzy Set
(Historic and Scenic Preservation)
Han RiverHS1Demilitarized ZoneJigyeon FallsHM
HS2Demilitarized ZoneDutayeon FallsHM
HD100VLVL
HD2Songnisan National ParkYongchu FallsVHM
Geum RiverGB100VLVL
GB200VLVL
Nakdong RiverNIJirisan National ParkYongyudam PondVHM
NMJirisan National ParkSilsangsa TempleVHH
NGNo DataNo DataNo Data (NP1)No Data (NP2)
NHNo DataNo DataNo Data (NP3)No Data (NP4)
Table 4. Monitoring data and fuzzy sets for the endangered species objective.
BasinsSite IDMonitoring DataFuzzy Sets
InvIFARBMPInvIFARBMP
Han RiverHS100302211VLVLVHVLVHVHVH
HS200301211VLVLVHVLMVHVH
HD10010212VLVLLVLVHMVL
HD20020119VLVLHVLMMVH
Geum RiverGB10000100VLVLVLVLMVLVL
GB20000000VLVLVLVLVLVLVL
Nakdong RiverNI0010210VLVLLVLVHMVL
NM0010125VLVLLVLMVHM
NG0000001VLVLVLVLVLVLVL
NH0000011VLVLVLVLVLVLVL
Note: Inv: invertebrates, I: insects, F: fish, AR: amphibians and reptiles, B: birds, M: mammals, P: plants.
Table 5. Monitoring data and fuzzy sets for the water quality objective.
BasinsSite IDMonitoring Data (mg/L)Fuzzy Set
TPTNCODBODTPTNCODBOD
Han RiverHS10.0011.3241.480.32VLLML
HS20.0041.2451.50.3VLLMVL
HD10.032.4842.810.81MMHM
HD20.0272.5462.130.76MMMM
Geum RiverGB10.0080.8631.220.52VLVLLL
GB20.0572.5812.340.8VHMHL
Nakdong RiverNI0.0444.4593.690.71HVHVHL
NM02.9113.30.45VLHVHL
NG0.0161.1192.581.58LLHVH
NH0.0580.9012.291.09VHLHH
Table 6. The toxic environment indicator and fuzzy sets.
BasinsSite IDsThe Number of Abandoned MinesFuzzy Set
Han RiverHS13VL
HS21VL
HD120L
HD278HL
Geum RiverGB1No DataNo Data (TC1)
GB22VL
Nakdong RiverNI4VL
NM2VL
NGNo DataNo Data (TC2)
NHNo DataNo Data (TC3)
Table 7. Fuzzy numbers for the relative importance of criteria.
ImportanceAbbreviationMembership Function
Very LowVL(1, 1, 3)
LowL(1, 3, 5)
MediumM(3, 5, 7)
HighH(5, 7, 9)
Very HighVH(7, 9, 9)
Table 8. Fuzzy numbers for the relative importance of weights.
ImportanceAbbreviationMembership Function
Very PoorVL(1, 1, 3)
PoorL(1, 3, 5)
FairM(3, 5, 7)
GoodH(5, 7, 9)
Very GoodVH(7, 9, 9)
Publisher’s Note: MDPI stays neutral with regard to jurisdictional claims in published maps and institutional affiliations.

