Abstract
To complement the current studies of risk assessment on water sources which seldom consider the distribution effects of multiple risk sources concentration, and improve the efficiency of water source supervision, this study establishes a method system for risk assessment of water sources and regulatory rating evaluation under the distribution effects of multiple risk sources concentration. The method system includes: (1) utilizing the single-risk source impact index to characterize the risk impact degree of the single-risk source on the water source, the index calculation method of single-risk source impact considers the risk degree and the distribution location of risk source; (2) using the multiple risk sources impact index to characterize the risk impact degree of the multiple risk sources on the water source, the index calculation method of multiple risk sources considers the impact index of single-risk source, the number of risk sources, and the distribution concentration of multiple risk sources; (3) the environmental risk assessment and regulatory rating evaluation method consider multiple risk sources impact index, anti-risk ability of water source, and the importance of water source. This method system has been applied to the environmental risk assessment and regulatory rating of eight water sources along the Nanjing Yangtze River, with excellent achievements. As the results reveal, eight water sources suffer 437 risk impacts from 175 risk sources, 69.04% of which are low-risk impacts and 13 are high-risk impacts. Longtan water source suffers the most risk impacts of 86, among which eight are high-risk impacts. The impacts of multiply-risk sources on the eight water sources are high-risk impacts. The impact index of multiple risk sources increases from the upstream water sources to the downstream water sources, reaching the maximum value of 5.267 at the most downstream Longtan water source. Though the environmental risk and supervision rating of Longtan water source is high, those of other water sources are rated as medium.
1. Introduction
In recent years, the water pollution accidents of water sources in China happen frequently [1,2], and the security situation of water supply is more and more serious, which are mainly triggered by the continuous increase of fixed risk sources (hereinafter referred to risk sources) of the surrounding industrial enterprises, sewage treatment plants, and docks with the economic development. To ensure the safe distance between risk source and water source, the risk sources distribution around the water sources becomes more and more concentrated, making the environment risk of water sources higher and higher. Therefore, to prevent water pollution accidents in water sources, the research on risk assessment of water sources has attracted increasing attention of Chinese scholars and policy makers.
So far, the studies on risk assessment of water sources have mainly focused on water quality risks [3]. For example, taking the drug concentration in water as the object, Houtman et al. [4] assessed the health risks of drinking water from three water plants in 2014 based on the two-year monitoring data of raw water from Rhine River, Meuse River, and Polder River in Netherlands. Ahmad et al. [5] assessed the radon activity concentration and toxic elements in the drinking water source in Sungai Petani City, Kedah, Malaysia. By monitoring the content of heavy metals and bacterial pathogens in different types of water sources in Malakand, Pakistan, in 2016, Nawab et al. [6] assessed the health risks of the water sources. After measuring 12 metal elements in 46 water samples from the drinking water sources of Luhun Reservoir, Cong-cong et al. [7] discussed the distribution characteristics of metal elements in the water, and assessed the risk of metals in the water on human health via the health risk assessment model. Moreover, people’s concern for water quality is regarded as an important part of water resources management [8], and thus people’s environmental risk perception of water source has become the research focus of some scholars. For instance, Withanachchi et al. [9,10] assessed the risk perception of local farmers on Mashavera River in Georgia and proposed the application of a comprehensive risk assessment model combining public risk perception with technical assessment. Ochoo et al. [11] also investigated and studied the correlation between the public’s perception of drinking water quality and health risk and the actual water quality. The water quality risk assessment and the public’s risk perception usually only evaluates the pollution factors of water body and the aesthetic properties of water, but pollution factors harming human body mainly comes from risk sources [12]. Hence, the risk assessment of water sources should consider the impacts of risk sources, and provide reference for the risk management and pollution control of water sources through evaluating the hazard rating of risk sources on water sources. For western developed countries, their economic structures exert little impact on the environment and they have formed perfect risk control systems for risk sources, such as the Source Water Assessment and Protection Program of the United States [13,14], and a monitoring and grading framework for New Zealand drinking-water source-draft of New Zealand [15]. Therefore, in terms of water quality risk assessment, few studies on risk assessment of water sources consider the impact of risk sources in developed countries [16].
With the improvement of the environmental awareness of the Chinese government and the society, the risk assessment of water sources under the impacts of risk sources has attracted more and more attention from the Chinese government and scholars [17]. In addition, due to the rapid development of computer technology and computational fluid dynamics, some mature and reliable software for water-environment mathematical models, such as MIKE [18,19,20], DELFT3D [21], and WASP [22], emerged. Therefore, many scholars adopt water-environment mathematical models to simulate the sudden pollution accidents at the risk sources to assess the risk degree of water sources, which is called the quantitative evaluation method [23]. For instance, Zhuang et al. [24] constructed a two-dimensional unsteady model for the Yangtze River to simulate how Nanjing enterprises illegally discharge pollution in the Yangtze River, in order to measure the impact degree of common pollutants such as COD and NH3-N on the water sources of Nanjing section of the Yangtze River after the accident. Employing a two-dimensional steady water quality model to quantify the accident impact range of risk source pollution, Ma et al. [25] established a method system for risk source identification and risk rating determination of the water sources, which was further applied in risk assessment for the water sources of a chemical industrial park of Nanjing. After establishing two-dimensional tidal current mathematical model of the Yangtze River Estuary, Song et al. [26] utilized the “oil particle” tracking technology based on the Euler–Lagrange system to simulate the impact of the oil spill accident of the Yangtze River Estuary on the intake of water source of Xisha, Shanghai under different working conditions. Though the quantitative assessment method can simulate indexes of the time when the pollution zone reaches the water intake, the pollution duration of the water intake, and the exceed multiple of pollutants at the water intake to accurately reflect the impact degree of the water source, there are still some problems such as randomness of accident probability and uncertainty of strong accident source. Considering that the characteristics of the risk source such as risk management ability, the production technology level, industry type, the production, and wastewater discharge complexity can indirectly reflect the accident probability of the risk source and accident severity, some scholars indirectly evaluate the risk degree of the water source under the impact of risk sources through the risk source characteristics and the water source features, which is known as the qualitative evaluation method [23]. For example, while considering assessing the risk impact of risk source via indexes like industry types, wastewater discharge amount, sewage discharge amount, sewage outlet position, and the occurrence of pollution accidents, Yan et al. [27] also consider factors like the natural conditions and the management level of the water source to evaluate the water sources of Shanghai. Sun et al. [28] conducted risk assessment for the water source of the main stream of the Yangtze River based on the vulnerability of water source and the hazards of toxic substances. Considering the distance between the risk source and the water source, and combining the environmental quality of the water source and the water resource security of the water source, Du [29] implemented risk assessment for different selection schemes for water sources in a northern Chinese city, so as to determine the optimal scheme. Taking factors like the distance between the risk source and the water source, and the scale of the risk source into account, Wang et al. [30] conducted risk assessment for the water source of Shenzhen Reservoir. However, either applying the qualitative or quantitative evaluation method, the researchers have ignored that the concentration distribution of multiple risk sources will significantly increase the probability of a water pollution accident and accident damage [31], resulting in greater risk impact on water sources. Therefore, how to effectively carry out risk assessment research of the water source under the impact of the concentration distribution of multiple risk sources is what the current risk assessment needs to solve, which is of certain theoretical significance for compensating the shortage of the current water environment risk assessment research, and one of the research directions for the diversified development of water source risk assessment.
The Yangtze River is not only an important source of water supply in Nanjing, but also an industrial economic corridor of Nanjing. Crowded with the risk sources of enterprises directly discharging wastewater, the sewage plants and the docks along the River, the Nanjing water sources along the River suffer concentrated distribution of risk sources and frequent pollution accidents. Hence, taking the Nanjing section of the Yangtze river as an example, this paper aims to improve the efficiency of water regulation, and conduct the research and application of the risk assessment and regulatory rating of the water source under the impact of the distribution concentration of multiple risk sources.
2. Research Area
Located in the Yangtze River Delta region of the eastern China, Nanjing (31°14′ N–32°36′ N, 118°22′ E–119°14′ E) is an important node city between the East Coastal Economic belt and the Yangtze River Economic Belt. The Yangtze River in Nanjing section is about 95 km, which is a vital water source for the social and economic development of Nanjing. The water distribution along the River includes eight water sources like Jiajiang water source (NJ01), Yanziji water source (NJ02), Baguazhou left branch water source (NJ03), Pukou water source (NJ04), Jiangning Zihuizhou water source (NJ07), Longtan water source (NJ08), Baguazhou mainstream stand-by water source (NJ06B), and Qiaolin stand-by water source (NJ05B). The total design water withdrawals are 1.1925 billion t/a, supplying over 93.77% of the water of Nanjing. In addition, under the influence of moderate intensity tide, the Nanjing section of the Yangtze River is a tidal section, with two tidal peaks and valleys appearing at the water level each day, among which the high tide lasts for about 6 h and the low tide lasts for about 18 h.
According to the Pollution Source Census Data of Jiangsu province in 2013–2017 (provided by Environmental Protection Department of Jiangsu Province) and dock data of the Nanjing section of the Yangtze River (provided by Jiangsu Maritime Bureau), as well as the field investigation, it is found that there are 42 sewage discharge points of industrial enterprises, 117 docks, and 16 sewage discharge points of sewage treatment plants along the coast of the Yangtze River in Nanjing section, reaching 175 in total. Specifically, the sewage discharge amount of 42 industrial enterprises is 3.165 million t/d, among which the wastewater discharge amount of 20 high-risk industrial enterprises like petrochemical, chemical, and pharmaceutical enterprises is 229,700 t/d. The total berthing capacity of 117 docks is 3,168,000 t, among which the total berthing capacity of 30 docks for hazardous chemicals and oil products is 412,000 t. The wastewater from 16 sewage treatment plants is domestic sewage, with the discharge amount over 2000 t/d, and the total discharge amount is 1.329 million t/d. The main discharged pollutants include COD, NH3-N, TN, and TP. The specific locations of water sources and risk sources are shown in Figure 1.
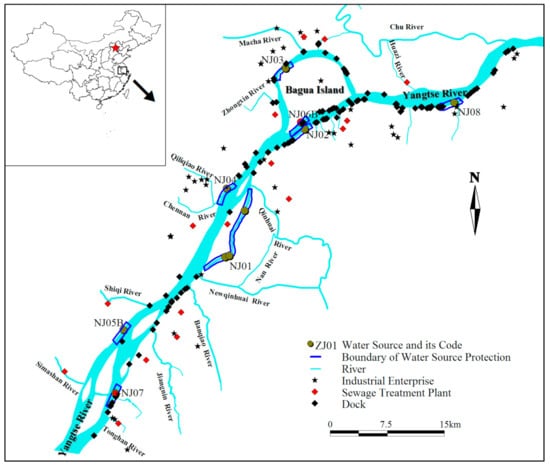
Figure 1.
Distribution locations of water sources and risk sources in the study area.
3. Methodology
The environmental risk of water sources mainly comes from the risk sources around the water source, referring to the risks released by the surrounding risk sources, which forms risk impact on the water sources. In addition, there is usually concentration distribution of multiple risk sources around the water sources, and thus the risk impact of risk sources on water sources should be the impact of the concentration distribution of multiple risk sources on the water sources (hereinafter referred to as multiple risk sources impact). However, the anti-risk capabilities of the hydrology and water quality conditions of the water source, as well as risk supervision and emergency response ability, can reduce the multiple risk sources impact to a certain extent. In addition, the regulatory rating of water sources depends on the environmental risk degree of water sources and the importance of water sources to local economic life. Therefore, by comprehensively considering the multiple risk sources impact, the anti-risk ability of water sources, and the importance of water sources, this paper establishes an assessment model to evaluate and determine the environmental risk and regulatory rating of water source. The evaluation model is as follows:
in which NWER, NMRI, NAR, ESL, and NI are the standard values reflecting the environmental risk of water sources, the multiple risk sources impact, the anti-risk ability of water sources, the environmental supervision degree of water sources, and the importance of water sources, respectively.
After determining the risk impact of a single risk source on the water source (hereinafter referred to as the single-risk source impact), this paper calculates the multiple risk sources impact, and then considers the anti-risk ability of the water sources, and the importance of the water sources, and finally evaluates and determines the environmental risk and regulatory rating of the water sources under the multiple risk sources impact. The detailed evaluation process is illustrated in Figure 2.
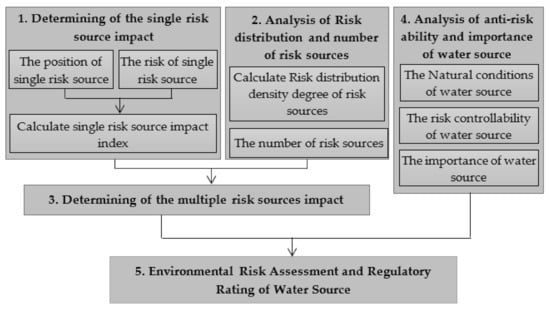
Figure 2.
Flow chart of the risk assessment and regulatory rating of water sources.
3.1. Methods for Determining the Single-Risk Source Impact Index
The risk released by risk sources refers to the probability and severity of pollution accidents. Under normal circumstances, if the risk source is close to the water source, the impact degree of the risk source on the water source will be the single-risk source impact index (hereinafter referred to as SrsRI) which should be equal to the risk of the risk source. With the increase of their distance, SrsRI will be less. Therefore, SrsRI also presents certain sensitivity to the relative position between the risk source and water source. This paper utilizes the risk of risk sources represented by risk index of risk source (RIRS) and position sensitivity of risk source to the water source to determine SrsRI. Referring to the research achievements of Wang et al. [32], the specific calculation formula is as follows:
where SRIi denotes the SrsRI of the ith risk source, with the maximum value of 4; Ki refers to the RIRS of the ith risk source, with the maximum value of 4; and LRi is the sensitivity coefficient (with the maximum value of 1) of the risk source position of the ith risk source, reflecting the relative position between the risk source and the water source.
3.1.1. Methods for Determining SrsRI
Risk sources, especially dock sources, which suffer problems like randomness of pollution accidents and difficulty in determining accident pollutant discharge, are difficult to conduct quantitative risk assessment based on the water environment mathematical model. Recently, a risk index has become an effective tool in the field of water quality monitoring and risk assessment. For example, Jones [33] designed a simple risk index by collecting wastewater treatment license applications, trade effluent licenses, traffic data, rainfall data, and census data, for the occurrence of priority substances in the wastewater treatment plant effluent. Yang et al. [34] used the potential ecological risk index to reflect the pollution hazards of heavy metals in the sludge of four major sewage treatment plants in Nanchang City, China. Zhang et al. [35] designed the three-phase spatial comprehensive ecological risk index to reflect the comprehensive risk of environmental pollution caused by five kinds of toxic heavy metals to the water phase, biological phase, and solid phase of Songhua River, China. As the risk degree of risk sources can be indirectly reflected by the characteristics of risk sources and the effectiveness of risk index in the risk assessment field, this study adopts the Comprehensive Index Method [36] to determine RIRS. The specific steps are as follows:
(1) According to the influencing factors of RIRS, this paper establishes the risk assessment index system of risk sources, where the index weight is determined by an analytic hierarchy process (AHP), as shown in Table 1.

Table 1.
Risk assessment index system for risk sources [37].
(2) According to the risk grading criteria of the assessment indexes (as shown in Table 1), the assessment index risk degree is determined and assigned, which is divided into four categories: extremely low risk, medium risk, and high risk, corresponding to four risk values: 1, 2, 3, and 4, respectively;
(3) The index weight and index risk value are utilized to conduct weighted sum and determine RIRS.
According to RIRS, the risk rating threshold values of the single-risk source shown in Table 2 are referenced to determine the risk rating of the single-risk source.
Table 2.
Risk grading and risk impact grading criteria for risk source.
3.1.2. Methods for Determining the Sensitivity Coefficient of Risk Sources
After the pollutants are discharged from the risk sources flow through the drainage pipe to the sewage outlet and enter the water, they will diffuse and migrate with the water flow, affecting the water supply safety of the water source. In addition to the longitudinal migration and flow of pollutants along the length of the river, there is also a certain diffusion and migration process along the width of the river. Hence, if the risk source is on the opposite side of the water source, it will also have a certain impact on the water source. Moreover, in the tidal reach, the pollutants released by risk sources will also have a certain impact on the upstream water source due to the upwelling of the tide. In summary, this paper determines the sensitivity of the risk source to the location of the water source from the following four aspects: the drainage pipe length between the risk source to the sewage outlet, the longitudinal distance from the risk source outlet to the water source intake, the lateral distance from the risk source outlet to the water source intake, and the upstream and downstream relationship between the sewage outlet and the water source intake. According to the research results of Zhou et al. [38], the specific calculation formula is as follows:
in which Li represents the sensitivity coefficient of land migration distance; Xi and Yi are the sensitivity coefficients of the longitudinal and lateral distances of the ith risk source respectively, with the maximum value of 1; Di means the sensitivity coefficient of the upstream-downstream between the ith risk source and the water source; and LRi has the same meaning as above.
Referring to the relevant regulations of Technical Guideline for Delineating Source Water Protection areas (HJ/T338-2018) [39] and the research achievements of Ma [25] that “the land range of risk assessment for river-type water sources is within 5 km outside the banks”, this paper sets that when the migration distance of the pollutants is within 1 km of the drainage pipelines, the sensitivity coefficient of land migration distance Li will be 1. When it exceeds 1 km, the value of Li should reduce with the increase of land migration distance of pollutants. When the migration distance is more than 5 km, Li will be 0. The specific calculation formula is as follows:
where li denotes the length of the drainage pipe from the risk source to its outlet (km), and Li has the same meaning as above.
According to the regulations of Technical Guideline for Delineating Source Water Protection (HJ/T338-2018) [39], “risk sources are forbidden in the first-level and second-level protection areas for water sources, and risk sources must not be constructed or expanded in the expectant protection areas” and the regulations of Environmental Protection Guideline of Centralized Drinking Water Sources [23], “the risk source investigation area surrounding the water source is 20 km upstream of the second-level protection areas for water sources”, the calculation standard for Xi and Yi values is as follows: for the risk sources in the expectant protection areas for water sources, both Xi and Yi values can be considered as 1. For the risk sources outside the expectant protection areas, the farther they are from the protection areas, their Xi and Yi values will be smaller. When the risk sources are located beyond 20 km upstream or 10 km downstream of the second-level protection area, Xi will be 0. As shown in Figure 3, with the shoreline of the intake and the vertical line of the intake to the River as the vertical and horizontal projection reference lines, respectively, this paper conducts vertical projection for the two projection reference lines of the position of the risk source outlet SOi, and thus the projection positions of SOxi and SOyi of the risk source in the x and y directions can be obtained. Furthermore, according to the projection positions and the distance to the expectant protection area, the values of Xi and Yi can be determined.
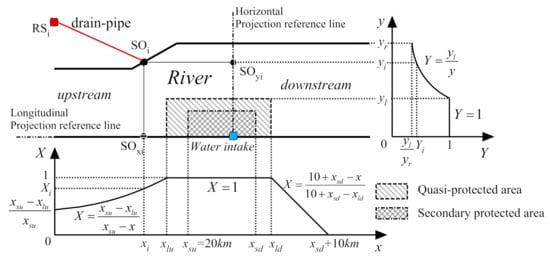
Figure 3.
The schematic diagram for calculating the sensitivity coefficients of risk sources in both lateral and longitudinal positions.
As shown in Figure 3, with 20 km of the upstream lateral shoreline for the second-level protection area as the original point, this paper calculates the value of Xi according to the distance xi from the projected position SOxi to the original point. The calculation formula is as follows:
where xlu and xld refer to the distance (km) from the upstream and downstream boundaries of the expectant protection area for water sources along the x-direction to the original point, respectively; xsu and xsd respectively denote the distance (km) from the upstream and downstream boundaries of the second-level protection area for water sources along the x-direction to the original point. xi and Xi have the same meaning as above.
As shown in Figure 3, the location of the water source intake is the original point and the Yi value is calculated according to the distance yi from the projected location SOyi to the original point as follows:
where yl and yr are the width of the expectant protection area and the river width (km) at the intake of water sources respectively; yi and yi have the same meaning as above.
For tidal river, the risk source outlet in the downstream of water sources only forms a risk impact on the water sources when the flow is negative, which has a smaller risk impact on water sources compared with the risk source outlet in the upstream of water sources. The sensitivity coefficient of the upstream–downstream positions of risk sources can be reflected by the positive and negative flow duration at the outlet of the risk sources. The specific formula is as follows:
in which TF and TO respectively represent the duration of positive and negative flow of water sources; Xi and Xld have the same meaning as above.
3.2. Methods for Determining Multiple Risk Sources Impact Index
Industrial safety accidents are an important inducer of environmental pollution accidents [40]. If risk sources are intensively distributed, and RIRS of each risk source is large, safety accidents such as fire and explosion of individual risk sources are likely to trigger continuous safety accidents of multiple risk sources, which in turn will cause continuous environmental pollution accidents. The denser the risk source distribution is and the higher the RIRS of each risk source is, the denser the risk distribution of risk sources will be, the greater the possibility of continuous pollution accidents will be, and the greater the impact of multiple risk sources on the water source will be. Moreover, the more risk sources around the water source area there are, the greater the risk impact of each risk source on the water source will be, and the greater the impact of multiple risk sources will be. Therefore, as the above analysis reveals, the following factors should be considered in determining the impact degree of multiple risk sources, which means multiple risk sources risk index (MrsRI): (1) the number of risk sources around the water source; (2) the general situation of SrsRI; (3) risk distribution density degree of multiple risk sources. According to the research results of Zhou et al. [38], the specific calculation formula is as follows:
where MRI denotes the multiple risk sources impact index; n means the number of risk sources; and SRIi refer to the average SrsRI of risk sources and the SrsRI of the ith risk source, respectively, which can reflect the SrsRI of the single risk sources around the water source. In addition, 4 means the maximum value that SrsRI can reach; C indicates the risk distribution density index of multiple risk sources (RDIMrs), reflecting the risk distribution density of multiple risk sources, with the maximum value of 1; N means the risk sources quantity index (MrsQI), reflecting the risk increment caused by the increase of the risk source number around the water source, with the maximum value of 1; NMRI is the standard value of MrsRI, which is determined by MRI transformation based on the high-risk level threshold value 3 of MrsRI.
The impact rating of multiple risk sources is determined based on MrsRI, and the rating standard is determined according to the risk grading criteria of risk source, as shown in Table 3.
Table 3.
Impact rating criteria of multiple risk sources.
3.2.1. Quantity Index of Risk Sources
If other influencing factors are not considered, the larger the quantity of risk sources around the water source is, the greater the risk impact on the water source area will be. When the risk source quantity is small, the increase of risk source quantity will strengthen the risk impact on water sources. However, with the increase of risk source quantity, the risk impact on water sources will be smaller and smaller. As the survey reveals, the average risk source quantity around 136 provincial water sources in Jiangsu province is 13. According to the above description, the calculation principle for MrsQI can be determined: when the surrounding risk source quantity is less than 13, MrsQI will conduct linear increase with the increase of risk source quantity, but, when it is more than 13, the increment will be smaller and smaller. The detailed calculation formula is as follows:
where N and n have the same meaning as above.
3.2.2. The Risk Distribution Density Index of Multiple Risk Sources
RDIMrs can be represented by the respective RIRS and the spacing between each two risk sources. The larger the RIRS is and the smaller the spacing is, the greater the risk distribution density index of the two risk sources will be. It can be learned from the above analysis that the maximum value of RIRS, which characterizes the risk degree of risk sources, is 4. Therefore, the ratio of RIRS to 4 can be utilized to indirectly represent the relative possibility of risk accidents in a single risk source. For the distance between risk sources, the Basic Requirements of Safety Technology for Enterprise Handling Hazardous Chemicals Business(GB 18265-2019) [41], approved and promulgated by the State Administration for Market Regulation and the Standardization Administration of China, stipulates, “the distance between the warehouse of explosives and the protected target should be at least 1 km”. In addition, according to relevant provisions of Technical Guidelines for Environmental Risk Assessment on Projects (HJ/T169 2018) [42], Wang et al. [32] determine that the unit impact radius of hazardous chemicals is 3–5 km. Hence, this paper sets that, when the distance between risk sources is within 5 km, the risk source distribution will be relatively concentrated. If a safety accident happens to one of the risk sources, it may lead to continuous safety accidents, with a risk chain between the risk sources. When the risk chain is within 1 km, the risk sources are densely distributed. If a safety accident happens to one of the risk sources, the probability of continuous safety accident is 1. When the distance exceeds 1 km, the probability decreases with the increase of the distance. When the distance exceeds 5 km, the distribution of risk sources is not concentrated, and the possibility of continuous accidents of risk sources is 0, without a risk chain between risk sources. According to the above analysis, the calculation formula of RDIMrs is as follows:
where m denotes the number of existing risk chains; Wi refers to the distribution density of risk sources at both ends of the ith risk chain, with the maximum value of 1; Di means the length of the ith risk chain (km); Kiu and Kid are RIRS of risk sources at both ends of the ith risk chain, respectively, reflecting the risk degree of risk sources. 4 indicates the maximum RIRS that the risk source can reach; C has the same meaning as above.
3.3. The Anti-Risk Ability and Importance Assessment of Water Sources
3.3.1. The Anti-Risk Ability of Water Sources
Natural conditions like the water quality, and hydrology of water sources will directly strengthen or weaken the risk impact of risk sources on the water sources. For instance, the anti-risk ability of water sources with fine natural conditions is better than that of water sources with poor natural conditions.
The water quality reflects the environmental quality of the water source. This paper adopts the water qualification rate to represent the water quality of the water sources. Water qualification rate refers to the ratio of water quality data at various monitoring points of the water source that reaches III class. The higher water qualification rate reflects the better environmental quality of the water source and the stronger anti-risk ability.
The hydrological conditions reflect the water diffusion capacity of the water source. The stronger the diffusion capacity is, the stronger the self-purification capacity of the water will be and the stronger the anti-risk ability will be. Referring to the research results of “the Water Environmental Risk Assessment and Early Warning Technology Demonstration in the Taihu Basin”, a special water project of the “12th Five-Year Plan”, and the Technical Guidelines for Environmental Impact Assessment—Surface Water Environment (HJ 2.3-2018) [43], this paper characterizes the hydrological conditions of river-type water sources with the average flow over the years.
The natural conditions of water sources vary greatly, and the artificial controllability is poor. Therefore, the anti-risk ability of water natural conditions is limited. Relatively, the risk controllability of water source regulatory department is highly controllable. A management department with strong risk control capabilities can effectively reduce the risk impact of surrounding risk sources, reduce pollution accident probability, and weaken the impact degree of pollution accidents on water sources.
Risk control of water sources should include prevention in advance and post-action control. The former is represented by daily supervision capacity of water sources, while the latter is characterized by emergency capacity of water sources after a pollution accident occurs.
Referring to the relevant environmental protection files like Environmental Protection Guidelines for Centralized Drinking Water Sources [23], Standards for Constructing Environmental Emergency Capability of the National Environmental Protection Departments [44], Measures for Emergency Management of Emergent Environmental Incidents [45], and considering maneuverability, this paper utilizes commanding and monitoring equipment qualification rate, personnel scale qualification rate, personnel training employment rate, automatic monitoring capacity coverage, monitoring indicators completion rate, daily supervision, and case enforcement rate to characterize the regulatory ability of water sources, and uses the completion rate of the isolation protection project, the water supply guarantee rate of the standby water source, the emergency equipment, the material guarantee rate, and the improvement rate of the emergency plan to represent the emergency capacity of the water source.
The methods for determining the characteristic values of each evaluation index of the above anti-risk ability of water sources are shown in Table 4.
Table 4.
Methods for determining the evaluation index characteristic values of the anti-risk ability of water sources and the index weight.
Besides the average flow over the years, the index characteristic values of the anti-risk ability of water sources are between 0–1, which can be directly identified as the standard values. The characteristic value of the average flow over the years can be converted into the standard value by normalizing the average flow over the years. The analytic hierarchy process (AHP) is adopted to determine the weight of each evaluation index (refer to Table 4), and then the index evaluation method is employed to evaluate the anti-risk ability of water sources. The specific calculation formula is as follows:
in which NAR denotes the standard value of anti-risk ability of water sources, with the maximum value of 1; ARIi and Wi refer to the standard values and weights of the i-th assessment index of the anti-risk ability of the water source, respectively. ARI2 means the standard value of the average flow over the years, and AF is the characteristic value of the average flow over the years.
3.3.2. The Importance of Water Sources
Water sources are an important guarantee for local economic development and people’s life, which can be most directly reflected by the water supply and serving population of water sources. Therefore, this paper adopts these two indicators to reflect the importance of water sources to local economic life. Through investigating water sources, the water supply and service population can be determined. Similarly, the characteristic values of water supply and service population are normalized first, and then the index evaluation method is employed to determine the standard value of the importance of water sources. The weight of both indexes is 0.5. The specific calculation formulas are similar to Formulas (14) and (15), which will not be listed here.
3.3.3. Anti-Risk Ability and Importance Rating of Water Sources
According to the relevant provisions of Technical Guidelines for Environmental Impact Assessment—Surface Water Environment (HJ/T 2.3-2018) [43], and Interim Measures for the Construction Standardization Acceptance of Environmental Emergency Capacity of National Environmental Protection Departments [47] and relevant research achievements of Pan [48], the anti-risk ability of the water source and the rating thresholds of risk evaluation indexes can be determined. Based on the relevant research achievements of Du et al. [29] and Zhang et al. [49], the importance of water sources and rating threshold values of evaluation indexes can be determined. Subsequently, the index evaluation method is adopted to determine the anti-risk ability of the water sources and the importance rating standards (see Table 5), so as to identify the anti-risk ability and importance rating of water sources.
Table 5.
Anti-risk ability and importance of water sources rating standards.
3.4. Environmental Risk Assessment and Regulatory Rating of Water Sources
Based on MrsRI standard value, anti-risk standard value, and importance standard value of water sources, this paper utilizes Formulas (1) and (2) to calculate the standard values of the environmental risk and environmental supervision degree of water sources.
According to the rating thresholds of multiple risk sources impact, the anti-risk ability and the importance of water sources listed in Table 3 and Table 5, this paper employs Formulas (1) and (2) to calculate environmental risk and regulatory rating criteria of water sources as shown in Table 6, which determines the environmental risk level and regulatory rating of water sources.
Table 6.
Environmental risk and regulatory rating criteria of water sources.
4. Results and Discussion
4.1. Calculation Results of Single-Risk Source Impact Index
Referring to the evaluation indexes listed in Table 1, this study investigates and evaluates 175 risk sources, applies the Comprehensive Index Method [36] for RIRS calculation, and determines the risk rating of risk sources according to Table 2. As the results reveal, of the 175 risk sources, the numbers of the high-, medium- and low-risk sources are 32, 126, and 17, respectively. The high-risk sources mainly include 16 pollution treatment plants and oil and chemical docks. Moreover, 11 high-risk docks are not equipped with emergency ability for environmental pollution accidents, which is mainly reflected in no pollution prevention equipment or installation of automatic water quality monitor. As the berthing capacity are more than 40,000 t, and the production equipment is not advanced, the RIRS of the five docks njm47, njm83, njm85, njm89, and njm90 is the highest (3.389) of the high-risk sources. For reasons of high pollution industrial nature, complicated drainage water quality, low production craft level, and inadequate emergency preventive measures and water quality monitoring facilities, though there are only five high-risk industrial enterprises, their RIRS is higher than most high-risk docks and sewage treatment plants. Due to the high wastewater discharge amount of risk sources 271 and 2001 (not less than 2000 t/d), it has the second-highest RIRS (3.359) in all risk sources. For 16 sewage treatment plants which mainly treat domestic sewage, the complexity of the water quality is relatively low, and they have a certain ability of water quality monitoring. Therefore, although they are high-risk sources, most of the RIRS values are less than 3.1, except a small part of sewage treatment plants with large sewage discharge amount, exceeding 3.2 in their RIRS. In general, the RIRS of sewage treatment plants is a little lower than high-risk docks and high-risk enterprises. The calculation results of high-risk sources are shown in Table 7.
Table 7.
RIRS calculation results of high-risk sources.
According to information provided by the Jiangsu Environmental Protection Department and the Nanjing Environmental Protection Bureau, there were 112 key wastewater monitoring enterprises in Nanjing in 2018, of which 24 were within 5 km of the Yangtze River coastline. As shown in Figure 4, by comparing the above 25 enterprises with the 21 high-risk sources listed in Table 8, excluding the docks, it was observed that 18 of the 21 high risk sources were the key wastewater monitoring enterprises in Nanjing in 2018, accounting for 87.5% of the above 24 enterprises. In addition, the 11 high-risk terminals were mostly related to the 25 key wastewater monitoring enterprises. For example, the docks belonging to Jinling Petrochemical Company (271) include njm47, njm83~njm85, njm89, and njm127. By comparison, it can be seen that the high-risk sources identified in this paper have a good fit with the key wastewater monitoring enterprises in Nanjing, which provides a basis for reasonably determining the risk impact index.
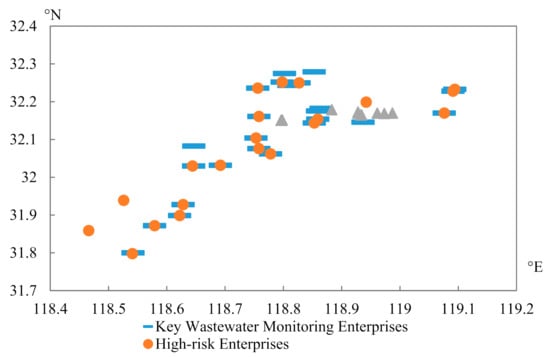
Figure 4.
Comparison of the locations of high-risk sources and key wastewater monitoring enterprises.
Table 8.
Calculation results of high-risk impact rating of risk sources.
Based on the relative positions of each water source to surrounding risk sources, this paper calculates the location sensitivity coefficient of the risk source to the nearby water source, and further calculates the SrsRI of each risk source to its water source by considering the risk source RIRS. As calculation results in Figure 5 reveal, the number of surrounding risk sources of Yanziji and Baguazhou standby water sources is the largest, reaching 65, while that of Jiangning water source is the smallest, which is 23. In the meantime, as the adjacent water sources are close, some risk sources can impact multiple water sources. Therefore, eight water sources suffer 437 risk impacts from 175 risk sources, a total of 437 risk impacts formation, of which high-, medium- and low-risk impacts are 13, 122, and 301, respectively. By comparing RIRS and SrsRI of the risk sources around each water source, this study finds that, due to the influence of the relative position between the risk sources and the water sources, the SrsRI is significantly smaller than RIRS in most risk sources. Consequently, although 90.29% of the 175 risk sources are high- or medium-risk sources, 69.04% of the formed 437 risk impacts are low-risk impacts.
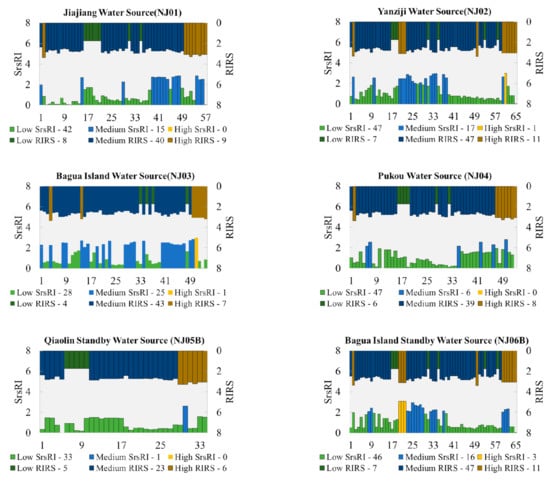
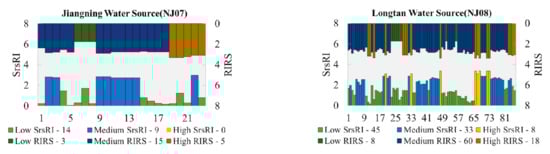
Figure 5.
Comparison of RIRS and SrsRI of risk sources around water sources.
The calculation results of 13 high-risk impacts is shown in Table 8. By comparing Table 7 and Table 8, it can be found that, due to the concentrated distribution of eight high-risk docks along 10 km upstream Longtan water source and three high-risk docks in the second-level protection area of Baguazhou mainstream stand-by water source, the position sensitive coefficient of 11 high-risk docks is 1, forming high-risk impact on the related water sources. Sixteen sewage treatment plants are evenly distributed on both sides of Nanjing section of Yangtze River, and the outlets of most sewage plants into the River are on the other side or downstream of the water source near them; even if they are located in the upstream bank, the distance is long. In addition, the RIRS of most sewage plants is only slightly larger than 3. Hence, only the two sewage treatment plants W003 and W010 form high-risk impacts on their nearby water sources. The SrsRI of the sewage treatment plant W010 is only 3. Although the RIRS of the five high-risk enterprises is generally high, they do not form high-risk impacts on their water sources, because sewage migration distance on land is long or the sewage discharge outlet is located downstream of their nearby water sources.
4.2. Calculation Results of Multiple Risk Sources Impact Index
The risk chain can be determined according to the distribution location of risk sources around each water source, and then the RDIMrs of risk sources around each water source can be calculated based on the RIRS and the distance between risk sources at both ends of the risk chain, namely the length of the risk chain. The calculation results are drawn in the order from upstream to downstream (as shown in Figure 6 and Figure 7).
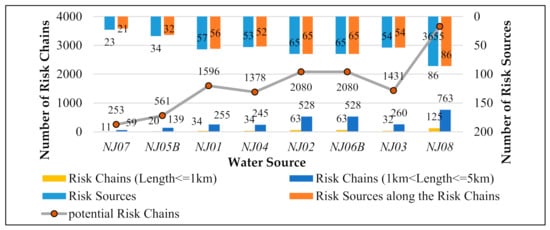
Figure 6.
Quantity change trend chart of the risk chains around water sources.
Figure 7.
Calculation results of RDIMrs around water sources.
As Figure 6 reveals, the number of risk sources and risk chains around each water source generally tends to increase from the upstream to downstream water sources, which is consistent with the situation in which the enterprises and docks along the Nanjing Section of the Yangtze River are mainly distributed along the downstream shoreline. Around Jiangning (NJ07), Qiaolin standby (NJ05B), Jiajiang (NJ01), and Pukou (NJ04) water sources of the upstream River, there are 1–2 risk sources, which cannot form a risk chain with the adjacent risk sources. However, the surrounding risk sources of other water sources can form risk chains with the adjacent risk sources. The number of risk sources around Longtan water source is the largest, and thus its number of potential risk chains may reach up to 3655, though the actual risk chains are the most, reaching 888. By comparing the average spacing of risk sources around water sources, it is found that the average spacing of Jiangning (NJ07), Qiaolin standby (NJ05B), Jiajiang (NJ01), and Pukou (NJ04) water sources (about 9 km) is smaller than that of other water sources (over 10 km). Hence, the ratio of the actual formed risk chain to the potential risk chain around the four water sources is about 28%, which is larger than that of other water sources (18.10–24.30%).
As Figure 7 reveals, the average length of risk chain around each water source is between 2.5–2.9 km, while the average RIRS of risk sources on the risk chain is about 2.64. Therefore, the RDIMrs around each water source is small, ranging from 0.34 to 0.4, with little difference. As the distribution of risk sources around Jiangning water source is relatively concentrated, which is reflected in its average distance between risk sources (8.42 km) and the average length of risk chain (2.53 km) which are both the smallest, and the average RIRS of risk sources on the risk chain that is rarely different from other water sources. Therefore, the RDIMrs of risk sources around Jiangning water source is 0.398, larger than those of other water sources.
According to the number of risk sources, the risk impact of risk sources on water sources, and the risk distribution density of multiple risk sources, this paper calculates the impact degree of multiple risk sources on each water source (Figure 8). From Figure 8, it can be observed that the Yangtze River, equipped with many enterprises and docks, is an important economic corridor of Nanjing, and thus the MrsQI around the eight water sources along the River is large, and the MrsQI is greater than 0.95 except the Jiangning water source. As Longtan water source suffers the greatest risk impacts from the surrounding risk sources (the Mean-SrsRI is 1.895), the number and value of high-risk impact as well as the MrsQI is also the largest. Therefore, the Longtan water source suffers the greatest multiple risk sources impact, with MrsRI of 5.267. The MrsRIs of other water sources are all less than 5, while the Qiaolin standby water source suffers weak single-risk source impacts from surrounding risk sources (Its Max-SrsRI and Mean-SrsRI are the lowest among the eight water sources). Hence, it also suffers the weakest multiple risk sources impact, with its MrsRI of 3.757. Generally, the downstream water sources suffer greater multiple risk sources impact than the upstream water sources.
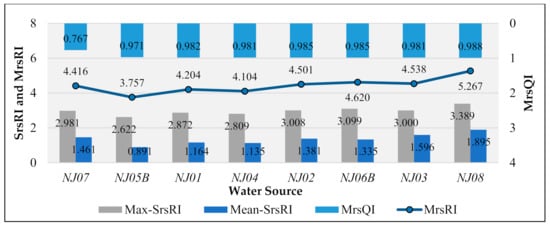
Figure 8.
Calculation results of MrsRI around water sources.
4.3. Research Results on the Anti-Risk Ability and Importance of Water Sources
According to the environment bulletin of Nanjing City from 2010 to 2018, the water quality of the eight water sources along the Nanjing section of the Yangtze River reaches the III-class water standard, with 100% water qualification rate. Considering that there are no large tributaries flowing in the Jiangsu section of the Yangtze River, the annual average flow of the eight water sources is set as 28600 m3/s by referring to that of Datong Hydrologic Station in the upstream of the Jiangsu section of the Yangtze River [50]. Based on the field investigation results and the current situation of emergency reserve of the water sources along the Nanjing section of the Yangtze River, the characteristic values of the daily regulation ability and emergency response ability of the eight water sources along the Nanjing section of the Yangtze River are all 100%. The water intake quantity and service population of each water source are shown in Table 9.
Table 9.
Characteristic values of importance index for water sources.
4.4. Environmental Risk of Water Sources and Regulatory Rating Results of Water Sources
According to the survey results, the characteristic values of annual average flow, water supply quantity, and service population of water sources are converted into standard values. Considering other characteristic values of assessment indexes for anti-risk ability of water sources, the standard values reflecting the anti-risk ability and the importance of water sources are calculated by employing index evaluation method, converting MrsRI to standard value. Based on the above standard values, the risk standard value and regulatory standard values of water sources are calculated, and then the environmental risk level and regulatory rating of water sources are determined by referring to Table 6. The calculation and results are shown in Table 10.
Table 10.
Results for the environmental risk level and regulatory rating of water sources.
As Table 10 reveals, the MrsRI of multiple risk sources around the eight water sources along the Nanjing section of the Yangtze River is greater than 3, leading to the MrsRI standard values becoming larger than 1, which belongs to high-risk impact. However, the Nanjing Waterworks Sector has perfect regulation and emergency ability on water sources, forming a strong level of anti-risk ability for various water sources. Therefore, after comprehensively considering that the strong anti-risk ability can weaken the impacts of multiple risk sources, other water sources belong to medium-risk, except the high-risk Longtan water source. As the districts along the Yangtze River are the core economic and population areas of Nanjing city, 5 of the 8 water sources along the Yangtze River are rated as strong importance considering the water supply quantity and the number of service population. Taking water source risk and water source importance into account, the regulatory level of Longtan water source (NJ08) is rated high, while that of the other seven water sources are medium, but regulation standard values of the Jiangning (NJ07), Jiajiang (NJ01), Yanziji (NJ02), and Baguazhou left branch water source (NJ03) are close to a high rating. Therefore, the water source management department should strengthen the corresponding regulation.
5. Conclusions and Suggestions
5.1. Conclusions
This paper proposes a methodology for determining the environmental risk and regulatory rating of water sources which considers the risk impact of the concentrated distribution of surrounding multiple risk sources on water source. The system comprises: (1) Considering the risk degree of risk sources and the position of risk sources relative to water sources, this paper proposes the risk impact degree of a single risk source on the water source, namely the calculation method of SrsRI. (2) Comprehensively considering factors such as SrsRI, MrsQI, and RDIMrs, the paper puts forward the risk impact of the aggregation distribution of multiple risk sources on water sources, namely the calculation method of MrsRI. (3) By investigating the natural conditions, regulatory ability and emergency capacity of water sources, this study utilizes the index evaluation method to determine the anti-risk ability of water sources, and determines the importance of water sources through considering the factors like water supply and service population of water sources. (4) Finally, the environmental risk level and regulatory rating of water sources can be determined by comprehensively considering the multiple risk sources impact, anti-risk ability, and the importance of water sources. By applying this methodology to the environmental risk assessment and regulatory rating determination of eight water sources in the Nanjing section of the Yangtze River, it is found that the method system can effectively determine the environmental risk level and regulatory rating of water source, which can provide a basis for the regulatory efficiency of water source for the supervision department of water sources in Nanjing.
5.2. Suggestions
(1) As 11 high-risk docks form high-risk impacts on Longtan and Baguazhou mainstream water sources, water source regulators should focus on their risk regulation, and urge them to install an automatic water quality monitor as well as pollution prevention equipment like oil containment booms and oil absorption machines, so as to improve their sensitivity and emergency capacity of high-risk docks to the sudden water pollution accidents such as the leakage of dangerous chemicals and oil. In the meantime, considering the seriousness of the consequences for the leakage of dangerous chemicals and oil, regulators should also regularly inspect and assess the rationality and safety of the daily operation mode, personnel safety operation, and emergency capacity of high-risk docks, in order to reduce the possibility of water pollution accidents due to operational errors, controlling the water pollution possibility at the water sources of Longtan and Baguzhou mainstream at source.
(2) Although five high-risk enterprises have not formed high-risk impacts on water sources, water regulators should still require them to enhance production technology level, and construct industrial water treatment facilities, so as to reduce their wastewater emissions, the complexity of water quality and the possibility of water pollution accidents. At the same time, regulators should also supervise and urge them to install the automatic water quality monitor and simultaneously upload the monitoring data to the online regulatory platform of regulatory section, so as to prevent the secret discharge of sewage and wastewater.
(3) Strengthen the daily inspection for the risk sources around the five water sources of Longtan (NJ08), Jiangning (NJ07), Jiajiang (NJ01), Yanziji (NJ02), and Baguazhou left branch (NJ03) listed in Table 10, especially the Longtan water source. Meanwhile, to prevent the continuous security accidents triggered by explosion and fire, each risk source, especially the dock storage areas for dangerous chemicals and oil, should be equipped with complete and effective fire and explosion prevention facilities, and strengthen safety management and personnel training, so as to reduce the possibility of safety accidents. In addition, the fire control facilities and devices should be proper and reliable, improving emergency rescue capabilities for safety accidents, and the safety accidents should be controlled in the initial stage, lowering the possibility of water pollution accidents.
(4) Regulators should construct a database for dangerous chemicals and oil products, so as to grasp the storage of dangerous chemicals and oil products, the volume of goods loaded and unloaded, the physicochemical properties, the environmental impacts, and emergency measures of the enterprises and docks along the Yangtze River in real time. In the meantime, regulators should strengthen the cooperation with departments of customs, maritime, and transportation so that they can share information of freight volume and transport terminals of dangerous chemicals and oil products at the Nanjing section, even the Jiangsu section of the Yangtze River to the database, expecting to implement real-time and full-process monitor and prevention of the dangerous chemicals and oil products with strong harm and wide accident impact range.
Author Contributions
Q.Z. carried out the calculation and drafted the manuscript. J.Z. and J.W. made the contributions on surveying the information of water sources and risk sources; Y.N. made the contributions on analysis and doing graphics. All authors have read and agreed to the published version of the manuscript.
Funding
Natural Science Foundation of the Anhui Higher Education Institutions of China (Grant No. KJ2019A0706), Program for Excellent Talents in University of Anhui Province of China (Grants No. gxyqZD2019075), the Innovation Project of “Six Excellence, One Top” Excellent Talents Training (Grant No. 2019zyrc102), and the Talent Research Startup Fund of Tongling University (Grant No. 2017tlxyrc06).
Data Availability Statement
The data presented in this study are available on request from the corresponding author. The data are not publicly available due to privacy agreement.
Conflicts of Interest
The authors declare no conflict of interest.
References
- Chen, F.; Wang, L.C.; Wu, W.Y.; Jiang, H.T.; Chen, G.H. Statistical Analysis of Emergency Water Pollution Incidents in China Urban Water Sources during 2006–2012. J. Shanghai Univ. Electr. Power 2014, 30, 62–70. (In Chinese) [Google Scholar]
- Ji, L.; Liu, J.; Li, Z.W.; Pan, B.Z.; Sun, M. Accidents of Water Pollution in China in 2011–2015 and Their Causes. J. Ecol. Rural Environ. 2017, 33, 775–782. (In Chinese) [Google Scholar]
- Yang, T.Q.; Yu, Y.H.; Liu, H.Y. Environmental risk assessment and prevention of drinking water source of Hongfeng Lake in Guizhou. Environ. Prot. Technol. 2015, 21, 23–29. (In Chinese) [Google Scholar]
- Houtman, C.J.; Kroesbergen, J.; Teunissen, K.L.; Lekkerkerker-Teuniss, K.; van der Hoek, J.P. Human health risk assessment of the mixture of pharmaceuticals in Dutch drinking water and its sources based on frequent monitoring data. Sci. Total Environ. 2014, 496, 54–62. [Google Scholar] [CrossRef]
- Ahmad, N.; Jaafar, M.S.; Alsaffar, S.M. Study of radon concentration and toxic elements in drinking and irrigated water and its implications in Sungai Petani, Kedah, Malaysia. J. Radiat. Res. Appl. Sci. 2015, 8, 294–299. [Google Scholar] [CrossRef]
- Nawab, J.; Khan, S.; Ali, S.; Sher, H.; Rahman, Z.; Khan, K.; Tang, J.F.; Ahmad, A. Health risk assessment of heavy metals and bacterial contamination in drinking water sources: A case study of Malakand Agency, Pakistan. Environ. Monit. Assess. 2016, 188, 1–12. [Google Scholar] [CrossRef] [PubMed]
- Yu, C.C.; Zhao, W.T.; Gao, X.F.; Cheng, S.G.; Ma, P.T. Distribution Characteristics and Health Risk Assessment of Metals in Drinking Water Sources from the Luhun Reservoir. Environ. Sci. 2018, 39, 89–98. (In Chinese) [Google Scholar]
- Bohnet, I.C. Lessons learned from public participation in water quality improvement planning: A study from Australia. Soc. Nat. Resour. 2015, 28, 180–196. [Google Scholar] [CrossRef]
- Withanachchi, S.S.; Kunchulia, I.; Ghambashidze, G.; Al Sidawi, R.; Urushadze, T.; Ploeger, A. Farmers’ perception of water quality and risks in the mashavera river basin, georgia: Analyzing the vulnerability of the social-ecological system through community perceptions. Sustainability 2018, 10, 3062. [Google Scholar] [CrossRef]
- Withanachchi, S.S. Sustainable Water Resource Management for a Safe Food System in Georgia: A Study of Water Quality Governance, Focusing the Mashavera River Basin. Ph.D. Thesis, Faculty of Organic Agricultural Sciences of the University of Kassel, Kassel, Alemanha, 2018. Available online: https://kobra.uni-kassel.de/handle/123456789/2018092556441 (accessed on 29 December 2020).
- Ochoo, B.; Valcour, J.; Sarkar, A. Association between perceptions of public drinking water quality and actual drinking water quality: A community-based exploratory study in Newfoundland. Environ. Res. 2017, 159, 435–443. [Google Scholar] [CrossRef]
- Van Leeuwen, F.X.R. Safe drinking water: The toxicologist’s approach. Food Chem. Toxicol. 2000, 38, S51–S58. [Google Scholar] [CrossRef]
- U.S. EPA. States must prioritize drinking water protection efforts: EPA issuing source. Assessment guidance. Water Qual. Prof. 1997, 6, 124. [Google Scholar]
- U.S. EPA. State Source Water Assessment and Protection Programs Guidance, Final Guidance. 1997. Available online: http://bases.bireme.br/cgi-bin/wxislind.exe/iah/online/?IsisScript=iah/iah.xis&src=google&base=REPIDISCA&lang=p&nextAction=lnk&exprSearch=93270&indexSearch=ID (accessed on 15 November 2020).
- Zhu, D.S.; Zhang, J.Y.; Cheng, H.G.; Geng, L.H. Security assessment of urban drinking water sources Ⅰ: Indicator system and assessment method. J. Hydraul. Eng. 2010, 7, 778–785. (In Chinese) [Google Scholar]
- Liu, Y.; Zheng, B.H.; Wan, J. Risk Assessment for Drinking Water Sources of C City: A Case Study. Res. Environ. Sci. 2009, 22, 52–59. (In Chinese) [Google Scholar]
- Zhang, Y.X.; Sun, S.J.; Cui, P. The digital research of Liaoyuan regulating dam water source emergency environmental accidents emergency management. J. Northeast Norm. Univ. (Nat. Sci. Ed.) 2017, 49, 157–162. [Google Scholar]
- Girbaciu, A.; Girbaciu, C.; Rosu, S. Water Quality Modeling of Bega River Using Mike 11. Int. J. Remote Sens. 2016, 3, 533–536. [Google Scholar]
- Liang, J.; Yang, Q.; Sun, T. MIKE 11 model-based water quality model as a tool for the evaluation of water quality management plans. J. Water Supply Res. Technol.-Aqua 2015, 6, 708–718. [Google Scholar] [CrossRef]
- Paliwal, R.; Patra, R.R. Applicability of MIKE 21 to assess temporal and spatial variation in water quality of an estuary under the impact of effluent from an industrial estate. Water Sci. Technol. 2011, 9, 1932–1943. [Google Scholar] [CrossRef]
- Nekouee, N.; Hamidi, S.A.; Roberts, P.J.W.; Schwab, D.J. A Coupled Empirical-Numerical Model for a Buoyant River Plume in Lake Michigan. Water Air. Soil Pollut. 2015, 226, 412. [Google Scholar] [CrossRef]
- Kannel, P.R.; Gan, T.Y. Application of WASP for Modelling and Management of Naphthenic Acids along Athabasca River, Alberta, Canada. Water Air. Soil Pollut. 2013, 224, 1764. [Google Scholar] [CrossRef]
- Ministry of Ecology and Environment of People’s Republic of China. Environmental Protection Guidelines for Centralized Drinking Water Sources. 2012. Available online: http://www.mee.gov.cn/gkml/hbb/bgt/201204/W020120409380130983040.pdf (accessed on 15 November 2020). (In Chinese)
- Zhuang, W.; Li, W.X.; Zhou, J.; Zhao, S. Early Warning System for Sudden Water Pollution Incidents in Water Source Areas in Lower Reaches of the Yangtze River. J. Ecol. Rural Environ. 2010, 26, 34–40. (In Chinese) [Google Scholar]
- Ma, Y.; Peng, J.F.; Song, Y.H.; Wang, C.R. Study on the classification method of environmental risk for sudden accidents in drinking water sources. Acta Sci. Circumst. 2012, 32, 1211–1218. (In Chinese) [Google Scholar]
- Song, Z.K.; Cheng, H.Q.; Liu, C.X.; Jiang, Y.P.; Ji, N.; Yang, Z.Y. Numerical Simulation of Oil Spill (Accident) and Its Influence on Water Source Area in Changjiang Estuary. Res. Environ. Yangtze Basin 2013, 8, 1055–1063. (In Chinese) [Google Scholar]
- Yan, Z.C. Environmental Risk Assessment of Shanghai Drinking Water Sources. Environ. Sci. Technol. 2012, 35, 322–325. (In Chinese) [Google Scholar]
- Sun, H.L.; Liu, W.J.; Wen, Y.; Yao, R.H.; Sun, Y.H. Study on environmental risk assessment and managements of drinking water sources of Yangtze River main stream. Yangtze River 2016, 47, 6–8. (In Chinese) [Google Scholar]
- Du, D.Z.; Meng, X.L.; Ma, F. Site selection assessment for river drinking source water of a city in northern. China Environ. Sci. 2012, 32, 359–365. (In Chinese) [Google Scholar]
- Wang, Y.X.; Yin, K.H.; Lin, G.S.; Peng, S.H. Environmental risk assessment for the urban drinking water sources: Methodology and case study. J. Saf. Environ. 2014, 14, 316–320. (In Chinese) [Google Scholar]
- Pan, S.H.; Dou, Z.; Li, Y.; Shi, L. Evaluation of domino effect in fire accidents in storage tank area based on graph model. China Saf. Sci. J. 2013, 29, 83–89. (In Chinese) [Google Scholar]
- Wang, X.H.; Chen, S.; Qin, H.X.; Guan, P. Zoning of Urban Environment Risk Based on Accident Risk Sources—A Case Study of Nanjing. Res. Environ. Yangtze Basin 2016, 3, 453–461. (In Chinese) [Google Scholar]
- Jones, L.; Styles, D.; Kinsella, B.; Lawlor, A.; Furey, A.; Regan, F. Development of a risk index for use in water quality monitoring. Water Conserv. Sci. Eng. 2017, 1, 209–221. [Google Scholar] [CrossRef]
- Yang, T.; Hang, H.J.; Lai, F.Y. Pollution hazards of heavy metals in sewage sludge from four wastewater treatment plants in Nanchang. Trans. Nonferrous Metals Soc. China 2017, 10, 143–153. [Google Scholar] [CrossRef]
- Zhang, Y.; Zhou, J.; Gao, F.J.; Zhang, B.J.; Ma, B.; Li, L.Q. Comprehensive ecological risk assessment for heavy metal pollutions in three phases in rivers. Trans. Nonferrous Metals Soc. China 2015, 10, 3436–3441. [Google Scholar] [CrossRef]
- Meng, X.J.; Zhang, Y.; Yu, X.Y.; Bai, J.H.; Chai, Y.Y.; Li, Y.T. Regional environmental risk assessment for the Nanjing Chemical Industry Park: An analysis based on information–diffusion theory. Stoch. Environ. Res. Risk Assess. 2014, 28, 2217–2233. [Google Scholar] [CrossRef]
- Luo, H.P.; Pang, Y.; Luo, J.; Xie, R.R.; Wang, H. Water environment risk assessment of Taizhou Three Waterworks drinking water source area. J. Hohai Univ. (Nat. Ed.) 2015, 43, 114–120. (In Chinese) [Google Scholar]
- Zhou, Q.; Pang, Y.; Wang, X.; Wang, X.; Niu, Y.; Wang, J. Determination of Key Risk Supervision Areas around River-Type Water Sources Affected by Multiple Risk Sources: A Case Study of Water Sources along the Yangtze’s Nanjing Section. Sustainability 2017, 9, 283. [Google Scholar] [CrossRef]
- Ministry of Ecology and Environment of People’s Republic of China. Technical Guideline for Delineating Source Water Protection Areas (HJ/T338-2018). 2018. Available online: http://www.mee.gov.cn/ywgz/fgbz/bz/bzwb/jcffbz/201803/W020180322408213299531.pdf (accessed on 15 November 2020). (In Chinese)
- Wang, Y.W.; Qian, Y.; Zhang, W.; Zhang, J.; Zhang, Y.C. Systematic Identification Method for Secondary Environmental Risk. Environ. Sci. Technol. 2009, 12, 205–208. (In Chinese) [Google Scholar]
- Standardization Administration of the PRC. Basic Requirements of Safety Technology for Enterprise Handling Hazardous Chemicals Business (GB 18265-2019). 2019. Available online: http://c.gb688.cn/bzgk/gb/showGb?type=online&hcno=3C6EE5CB45D981B9BCCD2E08CAC57277 (accessed on 15 November 2020). (In Chinese).
- Ministry of Ecology and Environment of People’s Republic of China. Technical Guidelines for Environmental Risk Assessment on Projects (HJ/T169 2018). 2018. Available online: http://www.mee.gov.cn/ywgz/fgbz/bz/bzwb/other/pjjsdz/201810/W020181026519881869834.pdf (accessed on 15 November 2020). (In Chinese)
- Ministry of Ecology and Environment of People’s Republic of China. Technical Guidelines for Environmental Impact Assessment—Surface Water Environment (HJ2.3-2018). 2019. Available online: http://kjs.mee.gov.cn/hjbhbz/bzwb/other/pjjsdz/201810/W020181026518440498872.pdf (accessed on 15 November 2020). (In Chinese)
- Ministry of Ecology and Environment of People’s Republic of China. Standards for Constructing Environmental Emergency Capability of the National Environmental Protection Departments. 2010. Available online: http://www.mee.gov.cn/gkml/hbb/bwj/201101/W020110105548010807430.pdf (accessed on 15 November 2020). (In Chinese)
- Ministry of Ecology and Environment of People’s Republic of China. Measures for Emergency Management of Emergent Environmental Incidents. 2010. Available online: http://www.mee.gov.cn/gkml/hbb/bl/201504/t20150429_299852.htm (accessed on 15 November 2020). (In Chinese)
- Ministry of Ecology and Environment of People’s Republic of China. Technical Specifications Requirements for Monitoring of Surface Water and Waste Water. 2002. Available online: http://www.mee.gov.cn/image20010518/3589.pdf (accessed on 15 November 2020). (In Chinese)
- Ministry of Ecology and Environment of People’s Republic of China. Interim Measures for the Construction Standardization Acceptance of Environmental Emergency Capacity of National Environmental Protection Departments. 2012. Available online: http://www.mee.gov.cn/gkml/hbb/bgt/201206/W020120614363594782283.pdf (accessed on 15 November 2020). (In Chinese)
- Pan, J. Study on Comparison and Selection, Demonstration of Emergency Water Sources of Changzhou City. Yellow River 2015, 3, 54–57. (In Chinese) [Google Scholar]
- Zhang, Z.J.; Ye, M.; Zhang, K. Watershed-scale environmental risk assessment for typical accidental water pollution accidents in the east of Guangdong Province. J. Saf. Environ. 2018, 4, 1532–1537. (In Chinese) [Google Scholar]
- Zhang, E.F.; Chen, X.Q.; Wang, X.L. Water discharge changes of the Changjiang River downstream Datong during dry season. J. Geogr. Sci. 2003, 3, 355–362. [Google Scholar]


Publisher’s Note: MDPI stays neutral with regard to jurisdictional claims in published maps and institutional affiliations. |
© 2021 by the authors. Licensee MDPI, Basel, Switzerland. This article is an open access article distributed under the terms and conditions of the Creative Commons Attribution (CC BY) license (http://creativecommons.org/licenses/by/4.0/).