Abstract
Assessment of fish stock status is generally required for fisheries management, which is difficult when the data are limited. The length-based Bayesian Biomass (LBB) approach is a powerful and new method, where only the length-frequency data are used for estimating the status of fisheries resources. Here, we applied the LBB method to assess the status of seven commercially valuable marine fishes from the northern tip of the Bay of Bengal (BoB), Bangladesh. These species were Lepturacanthus savala, Pampus argenteus, Nemipterus japonicas, Nemipterus randalli, Ilisha filigera, Saurida tumbil, and Upeneus sulphurous. The current relative biomass (B/B0) ratios were smaller than the BMSY/B0 in five stocks, except for N. japonicas and N. randalli, and this indicates that, of the seven populations assessed, two are grossly overfished, three are overfished, and two are healthy stocks. Moreover, the length at first capture (Lc) was lower than the optimal length at first capture (Lc_opt) in all seven populations, which indicates growth overfishing, suggesting that increasing the mesh sizes would be beneficial. The present findings confirm that Bangladesh’s coastal water fishery resources are declining. More specific targeted management measures should be taken to recover the country’s marine fishery resources.
1. Introduction
Bangladesh’s coastal and marine environment is endued with a warm tropical climate and heavy rainfall, enriched with nutrients from the land, producing one of the most highly enriched ecosystems in the world [1,2]. These rich coastal and marine ecosystems host a broad range of biodiversity, with around 511 marine species of fish, crustaceans, mollusks, mammals, seaweeds, etc. [3]. With the recent settlement of maritime border disputes with neighboring countries Myanmar and India in 2012 and 2014, a new era has begun in marine resources planning and management in Bangladesh. The country’s economy supported by marine resources, dubbed Blue Economy, has generated thrust in the marine sectors, including marine fisheries. Many surveys were carried out to examine the status of marine fishery resources between the 1970s and 1980s. Still, there is a lack of comprehensive knowledge on the biological and ecological aspects of Bangladesh’s coastal and marine fisheries. Recently, after a protracted pause since 1999, the marine fisheries research survey within the Bay of Bengal (BoB) started with the newly acquired R.V. Meen Sandhani in 2016. Since then, the research vessel has carried out shrimp and demersal fish surveys over Bangladesh’s shelf sea. These surveys generated highly accurate distribution, relative abundance, and biological data on the most available fish, shrimp, crab, and cephalopod species. A total of 344 species of fish, including sharks, rays and skates; 45 species of shrimps, crabs and lobsters; and 14 species of cephalopods were captured and identified up to species level. Additionally, 50 fish specimens were identified up to the genus level, making up 457 varieties [4,5].
At present, the world is concerned about the sustainability of marine fisheries due to the rapid increase in fishing pressure and arbitrary exploitation, causing negative consequences for ecosystems and societies as well [6]. This case is getting worse, particularly within developing countries where proper management tools, in addition to political will, are lacking and pervasive illegal fishing of juvenile and brood fishes is the governing features of the fisheries [7,8,9]. This worst-case scenario of the stocks provides the impetus for the articulation of useful management tools that specialize in the participation of all concerned stakeholders to achieve the conservation of ecosystems and optimum yields to sustain livelihoods and sustainable food supply [9,10]. Further, an efficient management plan encompasses management tools, including efforts control, minimum mesh size regulations for nets, and the setting of maximum allowable catch limits [11,12]. Considering this knowledge about the stock condition and its response to the current degree of removal is essential for both users and managers for the sustainable exploitation of the fishery [7,13,14]. The coastal fisheries sector of the BoB has not been rationally harvested. Instead, the resources are over-exploited, and as a result, the fish stocks have declined. The larger-bodied and generally more valuable species groups show depletion and overfishing, which became generally incidental catches, i.e., not directly targeted by fishermen [4,5]. Hence, for the effective rebuilding and sustainable management of marine fishery resources in Bangladesh, reliable fish stock assessment and, therefore, robust management approaches should be taken immediately.
The majority of stock assessment models are intended to use fisheries-independent data sets for estimating fisheries and population-related reference points, such as catch-at-age data and biomass estimates from scientific resource surveys [15]. However, in Bangladesh, only a few groups of commercially harvested stocks have been assessed due to data and expertise limitations. This is comparable to many countries of the world, where the research in fishery resources has been languishing. Responding to the present issue, two types of basic methods were developed for estimating the stock, where fishery data are limited. Estimation of the Maximum Sustainable Yield (MSY) along with related biological references by using catch statistics and additional data was the first approach [16,17]. Another approach was to inference the growth, mortality, and thus the response of the populations to exploitation by using length-frequency (LF) data [18,19,20]. Due to the advantage of the second approach that length-frequency data can be acquired more cheaply and comfortably, LF-dependent methods are the favorable approach in many circumstances.
LBB is an efficient estimate of the length-based Bayesian biomass (LBB) method for the study of data on the length-frequency of exploited fish populations or invertebrates in which all relevant parameters are synchronously calculated using the Monte Carlo Markov Chain (MCMC) Bayesian approach [21]. In this context, the LBB method has been applied to seven important commercially harvested fish populations using only their LF data from the Bay of Bengal, Bangladesh water as biological reference points for future research and the proper management of the country’s fishery resources.
2. Materials and Methods
2.1. Data Sources
The samples were collected during the three survey seasons from November 2016 to March 2019 from the coastal and marine waters of Bangladesh (Figure 1). Typically, the survey is carried out from November to April each year following the standard operating procedures under the supervision of the Department of Fisheries, Bangladesh. The shelf sea of Bangladesh between 10 m and 200 m depth has been divided into four depth zones, namely inshore (10–40 m), mid-shore (40–80 m), offshore (80–100 m), and deep offshore (100–200 m). Additionally, the total survey area between 10 to 200 m has been divided into 3 × 3-nautical-mile squares.
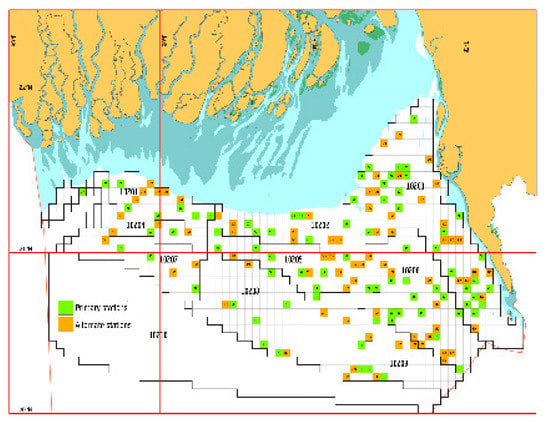
Figure 1.
Primary and alternate sampling stations in a typical survey season.
Each of the 80 (Figure 1) designed randomly selected stations were visited and sampled by a 30 min haul using the trawl net with a cod end mesh size of 30 mm, maintaining hauling speed at around 3 knots. The length and width of the boat were 37.8 and 9.20 m, respectively. The power, gross tonnage and speed of the engines were 1400 hp, 363 tons and around 10 nautical mile/hour, respectively. For taxonomic identification and length measurement, the specimens were taken to the on-board wet laboratory. There were no discards; each fish, shrimp, crab, and cephalopod species was identified to the finest taxonomic degree possible and subsequently sampled to determine the total number, length distribution, and individual weights. If the catch volume is large, based on species size it may be quantitatively subsampled; otherwise, the whole catch was sampled. Biological data such as the recorded species composition, length-weight, and length-frequency data were entered into the survey data management software (NANSIS). For each individual fish of the sample, the fork and, in some cases, total length were measured to the nearest millimeter and the bodyweight to the nearest 0.1 g. In the present study, we analyzed the length-frequency data of the seven most abundant and commercially important fish species (Table 1) from the northern tip of the BoB, Bangladesh.

Table 1.
Prior and basic information of the seven fish species.
In the present study, the analysis was performed in the R statistical environment by using the R-code (LBB_33a.R) to analyze the LF data, which was developed by Froese et al., 2019 [22] and was downloaded from http://oceanrep.geomar.de/44832/.
2.2. Description of the LBB Method
The new LBB estimator approach is a powerful method which is used for estimating the stock status by analyzing the length-frequency data from the exploited fishery [21,23]. This method works for species which grow throughout their lives, as generally most of the commercially valuable fishes and invertebrates do, where only the length-frequency data are required as input. Approximation of various parameters from LF data by this method represents the population in question, together with the Linf, Lc, relative natural and fishing mortality [21,24]. Further, only the basic formulas have been presented here, and for the complete information, see [21].
It is assumed in the LBB method that the growth in length follows the Von Bertalanffy (1938) growth equation as the form given by Beverton and Holt (1957) [25,26], that is:
where Lt denotes length at age t, Linf is asymptotic length, K is the growth coefficient, and t0 indicates the theoretical age of fish at zero (0) length.
When the fish become fully selected to the gear, the total mortality (Z =M + F) function which, relative to the growth coefficient (K) is indicated by the right portion curvature in the catch samples, can be expressed by:
where NL indicates the number of survivors at length L and NLstart shows the number at length Lstart.
Usually, the fishing gears have typical selection curves; in the LBB trawl, type selection was assumed, i.e., not catching the very young individuals. This type of selectivity of the gear can be explained as follows:
where SL indicates the fraction of individuals at the length L that are retained by the gear, and alpha (α) is the steepness of the ogive, which describes the length-based selectivity of the gear [21].
Combination and rearrangement of the above Equations (1)–(3) make as follows:
and
where Li refers to the number of individuals at the length i, Li-1 is the number at the previous length, C the number of individuals who are vulnerable to the fishing gear, and all other parameters are as previously mentioned [21].
Finally, the subsequent equation explains the framework for the approximation of stock status from Linf, F/K, M/K, and Lc [27]. At first, given the Linf estimation and M/K, Lopt, i.e., the size of fish at which cohort biomass becomes the maximum, can be estimated from Equation (6) below:
The mean length at first capture, which makes a maximum catch and biomass (Lc_opt), can be obtained from the following equation, based on Equation (6) and the given fishing pressure (F/M):
The Lc_opt estimations are used below for calculating a proxy for the relative biomass, which can produce the MSY [21].
The estimated result of the F/M > 1 confirms the overfished condition of the stock, while estimation of the B/B0 < 0.5 indicates the extremely low condition of the current biomass. The Lmean/Lopt and Lc/Lc_opt ratios were below unity, which suggests the truncated length structure and capturing of too small individual species. Similarly, the 95th percentile length and asymptotic length L95th/Linf ratio was close to unity (>0.9), indicating that at least some large fish species were still present.
The estimated outputs of LBB, relative biomass, and the length at first capture (Lc) can be used in the management of data-limited stocks directly: if the relative stock size B/B0 < BMSY/B0, fishing pressure or catch should be reduced. If the parameter mean length at first capture Lc < Lc_opt, this suggests that fishing should start at larger sizes.
3. Results
The LBB method was used to analyze seven fish stocks in the coastal areas from the northern tip of the Bay of Bengal. For these seven fish stocks, the basic information and priors (Linf, Lc, Z/K, M/K, F/K, and α) have been presented in Table 1 and the results are in Figure 2. Detailed information for the estimated parameters is given in Table 2. The research outputs of seven fish species by the LBB method in the waters of the Northern Part of the Bay of Bengal are presented below.
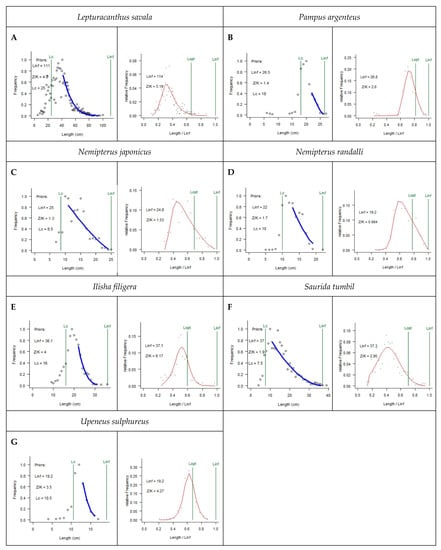
Figure 2.
Graphical findings (A–G) of LBB method for the seven commercially harvested marine fishes from the Bay of Bengal (BoB), Bangladesh. Lc is the length at first capture, Linf is the limit body length of this species, and Lopt denotes the length at which the maximum sustainable catch is obtained.
Table 2.
Estimated results of seven fish species for 2017 to 2019 length-frequency (LF) data by length-based Bayesian biomass (LBB) method.
Savalani Hairtail: Lepturacanthus savala (Cuvier, 1829)
Savalani hairtail, commonly known as Ribbon fish and locally called “Churimach”, is one of the most abundant species in the BoB, Bangladesh’s marine waters. This species is distributed in the Indo-West Pacific region, and it is a commercially valuable fish in the marine waters of Bangladesh. The current estimate of F/M = 2.0 confirms that savalani hairtail is overfished, while the estimate of B/B0 = 0.11 indicates that the current biomass of this species is extremely low. The findings of L95/Linf = 0.81 imply the poor presence of large individuals, and the output (0.57) of the Lmean and Lopt ratio along with the Lc/Lc_opt = 0.40 also support this statement; both of these ratios are below unity, which suggests a truncated length structure and exploitation of too small individuals (Figure 2A).
Silver pomfret: Pampus argenteus (Euphrasen, 1788)
Silver pomfret is one of the most valuable and high-priced fishes of the Bay of Bengal, Bangladesh. This species is distributed in the Indo-West Pacific and Northeastern Atlantic region [28]. Estimation of the F/M = 2.7 confirms that this species suffers overfishing, and the estimated ratio of the current relative to unexploited biomass (B/B0) = 0.18, indicating the extremely low current biomass of this species. The estimate of L95/Linf = 0.97, suggesting the presence of at least some large individuals in the stock (Figure 2B).
Japanese threadfin bream: Nemipterus japonicus (Bloch, 1791)
Japanese threadfin bream is one of the most abundant species among the available threadfin breams in the Bay of Bengal, Bangladesh [29]. The estimated F/M and B/B0 values were 0.14 and 0.79, respectively. Estimation of the L95/Linf = 0.97 suggests that at least some large species are still present (Figure 2C).
Randall’s threadfin bream: Nemipterus randalli (Russell, 1986)
Randall’s threadfin bream is a widespread species in the Western Indian Ocean region, including the east and west coast of India as well as in Pakistan. The output values of F/M and B/B0 were 0.13 and 0.83, respectively, which indicates that fishing intensity may not be the prime cause for the decreasing biomass of this species. In addition, the estimation of L95 and Linf ratio = 0.99 suggests that at least some large individuals are still present (Figure 2D).
Big eye shad: Ilisha filigera (Valenciennes, 1847)
The big eye shad Ilisha filigera (Valenciennes, 1847), which is commonly known as “Chowkkha Ilish” on the Bangladesh coast, is distributed in the Indo-Pacific. The estimated parameter F/M and B/B0 ratios are 2.0 and 0.2, indicating that overfishing has depleted this species (Figure 2E).
Greater lizardfish: Saurida. tumbil (Bloch, 1795)
Greater lizardfish is one of the most abundant and important species among the available lizardfish in the northern tip of the Bay of Bengal, and it is distributed in the Indo-Pacific region, including east to Southeast Asia. The estimated parameter F/M (0.99) and B/B0 (0.25) ratios from the current study indicate the high fishing intensity (Figure 2F) and low biomass of this species. Likewise, the estimated parameters Lmean/Lopt (0.63) and Lc/Lc_opt (0.45) are below unity, also supporting this statement.
Yellow goatfish: Upeneus sulphureus (Cuvier, 1829)
In general, yellow goatfish (locally referred to as “Sonali bata”) are more abundant and caught in large numbers by bottom or shrimp trawl fishing [30]. This species is distributed over an intensive area of the seabed, in depths up to 100 m [29]. The estimated parameters F/M and B/B0 were =1.0 and =0.38, which indicates the high fishing pressure and low biomass of this species (Figure 2G). On the other hand, the values of the parameters Lc95/Linf, Lmean/Lopt and Lc/Lc_opt were 0.94, 1.1, and =1.1, respectively, which are close to 1 (>0.9), suggesting the existence of large-sized fishes in this stock.
4. Discussion
To estimate stock status and the exploitation rate, the size composition data (LF) of commercial fisheries have long been used [18,26]. By using the length-frequency data, these methods can either be used in fishery management directly in data-limited fisheries or produced prior for other models related to the stock estimation [17]. In the current analysis of LF data, the parameters Lmean/Lopt were below unity in six out of the seven stocks, and the same findings from the Lc/Lc_opt ratios indicate truncated length structure and the capture of very young individuals. Similarly, the estimated ratio L95th/Linf was adjacent to unity (>0.9) in five out of seven species, suggesting the presence of at least some large fishes in those five stocks. On the other hand, an estimated smaller ratio of B/B0 than BMSY/B0 in seven stocks except in N. japonicas and N. randalli indicates the overfishing of five stocks under this study. Furthermore, the average relative biomass was 0.37 for the seven species, indicating stocks declining at a rate of 63%. In Table 3, a comparative discussion of the present findings with relevant other research has been shown. It has been revealed that some studies have been carried out on fishery resource assessments on the coast of Bangladesh, where no recent assessment reports have been found for N. randalli in this area. Most of the findings of other species from various reports were consistent with the current study, with some exceptions in the case of I. filigera and S. tumbil, that there was overfishing of the fishery resources in this area.
Table 3.
Comparative discussion of the present findings with other relevant research.
The finding of grossly overfished for L. savala was confirmed by the results of [31,32], where they found that the species was overfished based on survey data such as the present study (Table 3). However, the finding of not overfished conditions from [33] study might be due to the use of different meshed gear landing data in their analysis. As the survey data are more reliable than the poorly managed commercial landing data, our recommendation was to reduce the fishing pressure for L. savala in the northern tip of the Bay of Bengal, especially for the small-sized individuals. For P. argenteus, our findings corresponded with other research findings such as Fanning et al., 2019, where the biomass dynamics model was used to assess the resource of this stock in the northern tip of the Bay of Bengal, with the result indicating overfishing (Table 3). The results (overfishing conditions) published by Khan et al. in 2003 are very much consistent with the findings of the present study. That is why it is important to reduce fleet growth and size wisely in order to maintain this stock sustainably. In our study, the findings recommended that I. filigera is suffering from overfishing pressure with low biomass. However, [35] showed the optimum fishing pressure (Table 3) for this stock, which might be due to the nature of the data and their collection system. As the fishery survey data are more reliable, on the basis of present findings, we strongly recommend reducing the fishing intensity on this stock by limiting the number of fleets. Similarly, for S. tumbil our study found the overfished condition (Table 3), whereas [31] found optimally fished stock in that period. This might be due to the long interval (about 20 years) before data comparing with the present study data (2017–2019). For the U. sulphureus, our results corresponded with other research findings [36], where yield-per recruit analysis was used to assess the stock in this area, which indicated overfishing (Table 3). These results are more similar to the findings obtained by [31], where they also found overfishing conditions. However, N. japonicas and N. randalli showed different results, suggesting that these stocks are in a healthy condition (Table 3). Similar results for N. japonicas were found with other research findings published by [34], where the author mentioned this as healthy stock. Unfortunately, there is hardly any research on the resource assessment of N. randalli in coastal areas of Bangladesh. That is why no detailed information is available regarding this stock so far. Therefore, for the stock assessment of N. randalli in this area, this study might be the first analysis.
5. Conclusions
Five out of the seven stocks studied in this analysis are overfished species in the northern tip of the Bay of Bengal and are trending toward declining. Similarly, based on our findings, we concluded that the length at first capture was smaller than the Lc_opt in all seven stocks, suggesting that large mesh size would be beneficial. Because the current management system is allowing excessive fishing efforts on the coast of Bangladesh, this causes long-term overfishing, resulting in structural changes in fishery resources in the marine waters of Bangladesh. In this situation, species-specific size limits should be provided by management authorities along with enforcement of the mesh sizes specification for different fishing gear (net) to help rebuild the population of the stock. However, the implementation of increased mesh sizes may be challenging [20]. Therefore, we suggest reducing the fishing intensification by controlling the number, catch duration and type of fishing fleets in Bangladesh’s coastal and marine waters. As the LBB method only requires the length-frequency data to assess the fishery resources in a particular zone, it makes the problem easy for the resources lacking available data. However, the application of the LBB method combined with other models may increase the reliability of the valuable findings.
Author Contributions
M.A.A.-M., S.R.C., M.S.U., and K.M.S.N. were responsible for collecting and processing the data; M.A.A.-M. analyzed the data under the supervision of Q.L. and made the preliminary draft. R.S. contributed to the analysis. All authors contributed to the editing of the submitted manuscript. All authors have read and agreed to the published version of the manuscript.
Funding
The first author would like to express appreciation to The Chinese Scholarship Council (CSC) and SOA (State Oceanic Administration) for sponsorship during his doctoral degree. This work is supported by the basic research fund of the Ocean University of China (201562030).
Informed Consent Statement
Not applicable.
Data Availability Statement
Data is not publicly available due to restrictions imposed by the local laws.
Acknowledgments
The authors are grateful to the Department of Fisheries, Government of Bangladesh, for making this work possible. The authors also express sincere gratitude to L. Paul Fanning (FAO, Fisheries advisor) for his invaluable support to data processing. We also express our cordial thanks to Al Mamun, Md. Farhan Tazim, Mohammed Rashed Pervej and all other scientists, lab mates and staffs who contributed to the data collection and processing.
Conflicts of Interest
The authors declare no conflict of interest.
References
- Hossain, M.S. Biological aspects of the coastal and marine environment of Bangladesh. Ocean Coast. Manag. 2001, 44, 261–282. [Google Scholar] [CrossRef]
- Islam, M.S. Perspectives of the coastal and marine fisheries of the Bay of Bengal, Bangladesh. Ocean Coast. Manag. 2003, 46, 763–796. [Google Scholar] [CrossRef]
- Jahan, K.M.; Belton, B.; Viswanathan, K.K. Communication strategies for managing coastal fisheries conflicts in Bangladesh. Ocean Coast. Manag. 2014, 92, 65–73. [Google Scholar] [CrossRef]
- Shamsuzzaman, M.M.; Islam, M.M.; Tania, N.J.; Al-Mamun, M.A.; Barman, P.P.; Xu, X. Fisheries resources of Bangladesh: Present status and future direction. Aquac. Fish. 2017, 2, 145–156. [Google Scholar] [CrossRef]
- Fanning, P.; Chowdhury, S.R.; Uddin, M.S.; Al-Mamun, M.A. Marine Fisheries Survey Reports and Stock Assessment 2019 Based on R/V Meen Sandhani Surveys from 2016 to 2019; Bangladesh Marine Fisheries Capacity Building Project, Department of Fisheries, Ministry of Fisheries and Livestock: Matshya Bhaban, Ramna, Dhaka, Bangladesh, June 2019. Available online: http://mfsmu.fisheries.gov.bd/site/download/03cb42dc-8a4f-4dd3-a08943e 5f5bcf61b (accessed on 29 September 2020).
- Mora, C.; Myers, R.A.; Coll, M.; Libralato, S.; Pitcher, T.J.; Sumaila, R.U.; Zeller, D.; Watson, R.; Gaston, K.J.; Worm, B. Management effectiveness of the world’s marine fisheries. PLoS Biol. 2009, 7, e1000131. [Google Scholar] [CrossRef] [PubMed]
- Froese, R. Keep it simple: Three indicators to deal with overfishing. Fish Fish. 2004, 5, 86–91. [Google Scholar] [CrossRef]
- Spaet, J.L.; Thorrold, S.R.; Berumen, M.L. A review of elasmobranch research in the Red Sea. J. Fish Biol. 2012, 80, 952–965. [Google Scholar] [CrossRef]
- Jabado, R.W.; Spaet, J.L. Elasmobranch fisheries in the Arabian Seas Region: Characteristics, trade and management. Fish Fish. 2017, 18, 1096–1118. [Google Scholar] [CrossRef]
- Jabado, R.W.; Al Ghais, S.M.; Hamza, W.; Shivji, M.S.; Henderson, A.C. Shark diversity in the Arabian/Persian Gulf higher than previously thought: Insights based on species composition of shark landings in the United Arab Emirates. Mar. Biodiv. 2015, 45, 719–731. [Google Scholar] [CrossRef]
- Ye, Y.; Cochrane, K.; Bianchi, G.; Willmann, R.; Majkowski, J.; Tandstad, M.; Carocci, F. Rebuilding global fisheries: The World Summit goal, costs and benefits. Fish Fish. 2013, 14, 174–185. [Google Scholar] [CrossRef]
- Bell, J.D.; Watson, R.A.; Ye, Y. Global fishing capacity and fishing effort from 1950 to 2012. Fish Fish. 2017, 18, 489–505. [Google Scholar] [CrossRef]
- Hussain, M.G.; Hoq, M.E. (Eds.) Sustainable Management of Fisheries Resources of the Bay of Bengal. Support to Sustainable Management of the BOBLME Project, Bangladesh Fisheries Research Institute. 2010 Mar. Available online: https://www.researchgate. net/profile/M_G_Hussain/publication/283509739_Sustainable_Management_of_Fisheries_Resources_of_the_Bay_of_Bengal/links/563c7f9a08ae405111a9d6ca/Sustainable-Management-of-Fisheries-Resources-of-the-Bay-of-Bengal.pdf (accessed on 29 September 2020).
- Martell, S.; Froese, R. A simple method for estimating MSY from catch and resilience. Fish Fish. 2013, 14, 504–514. [Google Scholar] [CrossRef]
- Methot, R.D., Jr.; Wetzel, C.R. Stock synthesis: A biological and statistical framework for fish stock assessment and fishery management. Fish. Res. 2013, 142, 86–99. [Google Scholar] [CrossRef]
- Schaefer, M.B. Some aspects of the dynamics of populations important to the management of the commercial marine fisheries. Inter Am. Trop. Tuna Comm. Bull. 1954, 1, 23–56. [Google Scholar] [CrossRef]
- Froese, R.; Demirel, N.; Coro, G.; Kleisner, K.M.; Winker, H. Estimating fisheries reference points from catch and resilience. Fish Fish. 2017, 18, 506–526. [Google Scholar] [CrossRef]
- Pauly, D.; Morgan, G.R. Length-Based Methods in Fisheries Research; World Fish: Penang, Malaysia, 1987. [Google Scholar]
- Pauly, D. Beyond our original horizons: The tropicalization of Beverton and Holt. Rev. Fish Biol. Fish. 1998, 8, 307–334. [Google Scholar] [CrossRef]
- Liang, C.; Pauly, D. Growth and mortality of exploited fishes in China’s coastal seas and their uses for yield-per-recruit analyses. J. Appl. Ichthyol. 2017, 33, 746–756. [Google Scholar] [CrossRef]
- Froese, R.; Winker, H.; Coro, G.; Demirel, N.; Tsikliras, A.C.; Dimarchopoulou, D.; Scarcella, G.; Probst, W.N.; Dureuil, M.; Pauly, D. A new approach for estimating stock status from length frequency data. ICES J. Mar. Sci. 2018, 75, 2004–2015. [Google Scholar] [CrossRef]
- Froese, R.; Winker, H.; Coro, G.; Demirel, N.; Tsikliras, A.C.; Dimarchopoulou, D.; Scarcella, G.; Probst, W.N.; Dureuil, M.; Pauly, D. A Simple User Guide for LBB (LBB_33a.R). 2019. Available online: http://oceanrep.geomar.de/44832/ (accessed on 11 October 2020).
- Wang, Y.; Wang, Y.; Liu, S.; Liang, C.; Zhang, H.; Xian, W. Stock assessment using LBB method for eight fish species from the Bohai and Yellow Seas. Front. Mar. Sci. 2020. [Google Scholar] [CrossRef]
- Froese, R.; Winker, H.; Coro, G.; Demirel, N.; Tsikliras, A.C.; Dimarchopoulou, D.; Scarcella, G.; Probst, W.N.; Dureuil, M.; Pauly, D. On the pile-up effect and priors for Linf and M/K: Response to a comment by hordyk et al. on “A new approach for estimating stock status from length-frequency data. ICES J. Mar. Sci. 2019, 76, 461–465. [Google Scholar] [CrossRef]
- von Bertalanffy, L. A quantitative theory of organic growth (inquiries on growth laws. ii). Hum. Biol. 1938, 10, 181–213. [Google Scholar] [CrossRef]
- Beverton, R.J.H.; Holt, S.J. On the Dynamics of Exploited Fish Populations; Ministry of Agriculture, Fisheries and Food, Series II, XIX; Fishery Investigations: London, UK, 1957; p. 533. [Google Scholar]
- Froese, R.; Winker, H.; Gascuel, D.; Sumaila, U.R.; Pauly, D. Minimizing the impact of fishing. Fish Fish. 2016, 17, 785–802. [Google Scholar] [CrossRef]
- Fish Base, Computer Generated Distribution Maps for Pampus argenteus (Silver pomfret), with Modelled Year 2050 Native Range Map Based on IPCC RCP8.5 Emissions Scenario, Version 10/2019. Available online: www.aquamaps.org (accessed on 11 October 2020).
- Khan, M.G.; Mustafa, M.G.; Humayun, N.M. Estimation of growth and mortality rates for the yellow lined goat fish, Upeneus sulphureus Cuvier in the Bay of Bengal. Bangladesh J. Zool. 1987, 15, 1–8. [Google Scholar]
- Mustafa, M.G.; Ali, M.S. Population dynamics and management of the goat fish Upeneaus sulphureus from the Bay of Bengal. Bangladesh J. Fish Res. 2004, 8, 71–81. [Google Scholar]
- Khan, M.A.A.; Sada, N.U.; Chowdhury, Z.A. December. Status of the demersal fishery resources of Bangladesh. In Assessment, Management and Future Direction of Coastal Fisheries in Asian Countries; Silvestre, G., Garces, L., Stobutzki, I., Ahmed, M., Valmonte-Santos, R.A., Luna, C., Lachica-Aliño, L., Munro, P., Christensen, V., Pauly, D., Eds.; WorldFish Center Conference Proceeding: Dhaka, Bangladesh, 2003; Volume 67, pp. 63–82. Available online: https://books.google.co.uk/books?hl=en&lr=&id=JzW4DQAAQBAJ&oi=fnd&pg=PA63&dq=Stats+of+the+Demersal+fishery+resources&ots=kJ6uwDCp_W&sig=TwLRmLUaeKWXhGdAU7wFWVBO0#v=onepage&q=Status%20of%20the%20Demersal%20fishery%20resources&f=false (accessed on 10 October 2020).
- Mustafa, M.G. Population Dynamics of Penaeid Shrimps and Demersal Finfishes from Trawl Fishery in the Bay of Bengal and Implication for the Management. Ph.D. Thesis, Department of Zoology, University of Dhaka, Dhaka, Bangladesh, 1999. Available online: https://scholar.google.co.uk/scholar?hl= en&as_sdt=0%2C5&q=mustafa+1999+Bay+of+Bengal&oq=Mustfa%2C+1999#d=gs_cit&u=%2Fscholar%3Fq%3Dinfo%3AhU5Sv4VxscYJ%3Ascholar.google.com%2F%26output%3Dcite%26scirp%3D0%26hl%3Den (accessed on 14 October 2020).
- Shahriar Nazrul, K.M.; Mamun, A.; Al-Mamun, M.A.; Barua, S.; Uddin, M.S. Population Dynamics Study of Ribbonfish, Lepturacanthus savala from the North-Eastern Tip of Bay of Bengal. Glob. J. Sci. Front. Res. E Mar. Sci. 2018, 18, 40–47. [Google Scholar]
- Ashraful, H.A. Population dynamics of five commercially important marine fishes in north-eastern part of the Bay of Bengal. In Information on Bangladesh Fisheries Fish Week; Department of Fisheries: Dhaka, Bangladesh, 1999; Available online: https://scholar.google.co.uk/scholar?hl=en&as_sdt=0%2 C5&q=Ashraful+1998+Bay+of+Bengal&btnG= (accessed on 10 October 2020).
- Mamun, A.; Nazrul, K.M.S.; Al-Mamun, M.A.; Barua, S.; Ali, S.M.H. Study on growth, mortality and length-weight relationship of big eye shad (ilisha filige-ra) captured from south-east coast of Bangladesh. Int. J. Pure Appl. Zool. 2019, 7, 28–30. [Google Scholar] [CrossRef]
- Akter, M.; Sharifuzzaman, S.M.; Shan, X.; Rashed-Un-Nabi, M. Reproduction, Growth, Mortality and Yield of the Goatfish Upeneus sulphureus in Northern Bay of Bengal, Bangladesh. J. Ichthyol. 2020, 60, 441–452. [Google Scholar] [CrossRef]


Publisher’s Note: MDPI stays neutral with regard to jurisdictional claims in published maps and institutional affiliations. |
© 2021 by the authors. Licensee MDPI, Basel, Switzerland. This article is an open access article distributed under the terms and conditions of the Creative Commons Attribution (CC BY) license (http://creativecommons.org/licenses/by/4.0/).