3.1. Environmental Dimension Results
The characterization results of various impact categories based on the function unit (FU), i.e., 1 MT crude palm oil applying the Eco-Indicator 99 method are shown in
Table 2. Based on the results, it can be seen that the impact categories with significant impacts were from climate change, respiratory inorganics, carcinogens, land use, and fossil fuels in both selected mills. This is similar to the work by [
14,
34] who reported that fossil fuels, respiratory inorganics, climate change, and acidification/eutrophication were the significant impact categories. The use and production of fertilizers in the plantation phase were the main impact of the fossil fuel and respiratory inorganic categories. This result is consistent with the findings of [
44] study on the determination of the environmental impact of the biodiesel production. Moreover, the boiler emissions from the mill were the other main impact of respiratory inorganics. This result is consistent with the findings of [
45,
46]. For the carcinogens impact category, the results found that Cadmium, Arsenic, Chromium VI, and Particulates were the main carcinogens that were likely to be released into the air from the crude palm oil production. This result is consistent with [
47] findings who determined that the environmental impacts of the biodiesel from three waste oils. The major impact of the land use category came from the fresh fruit bunch (FFB) production at the plantation phase. The climate change category impacts can be associated with the emission of greenhouse gases such as carbon dioxide and methane which caused the phenomena of global warming (see
Supplementary Appendix SB1).
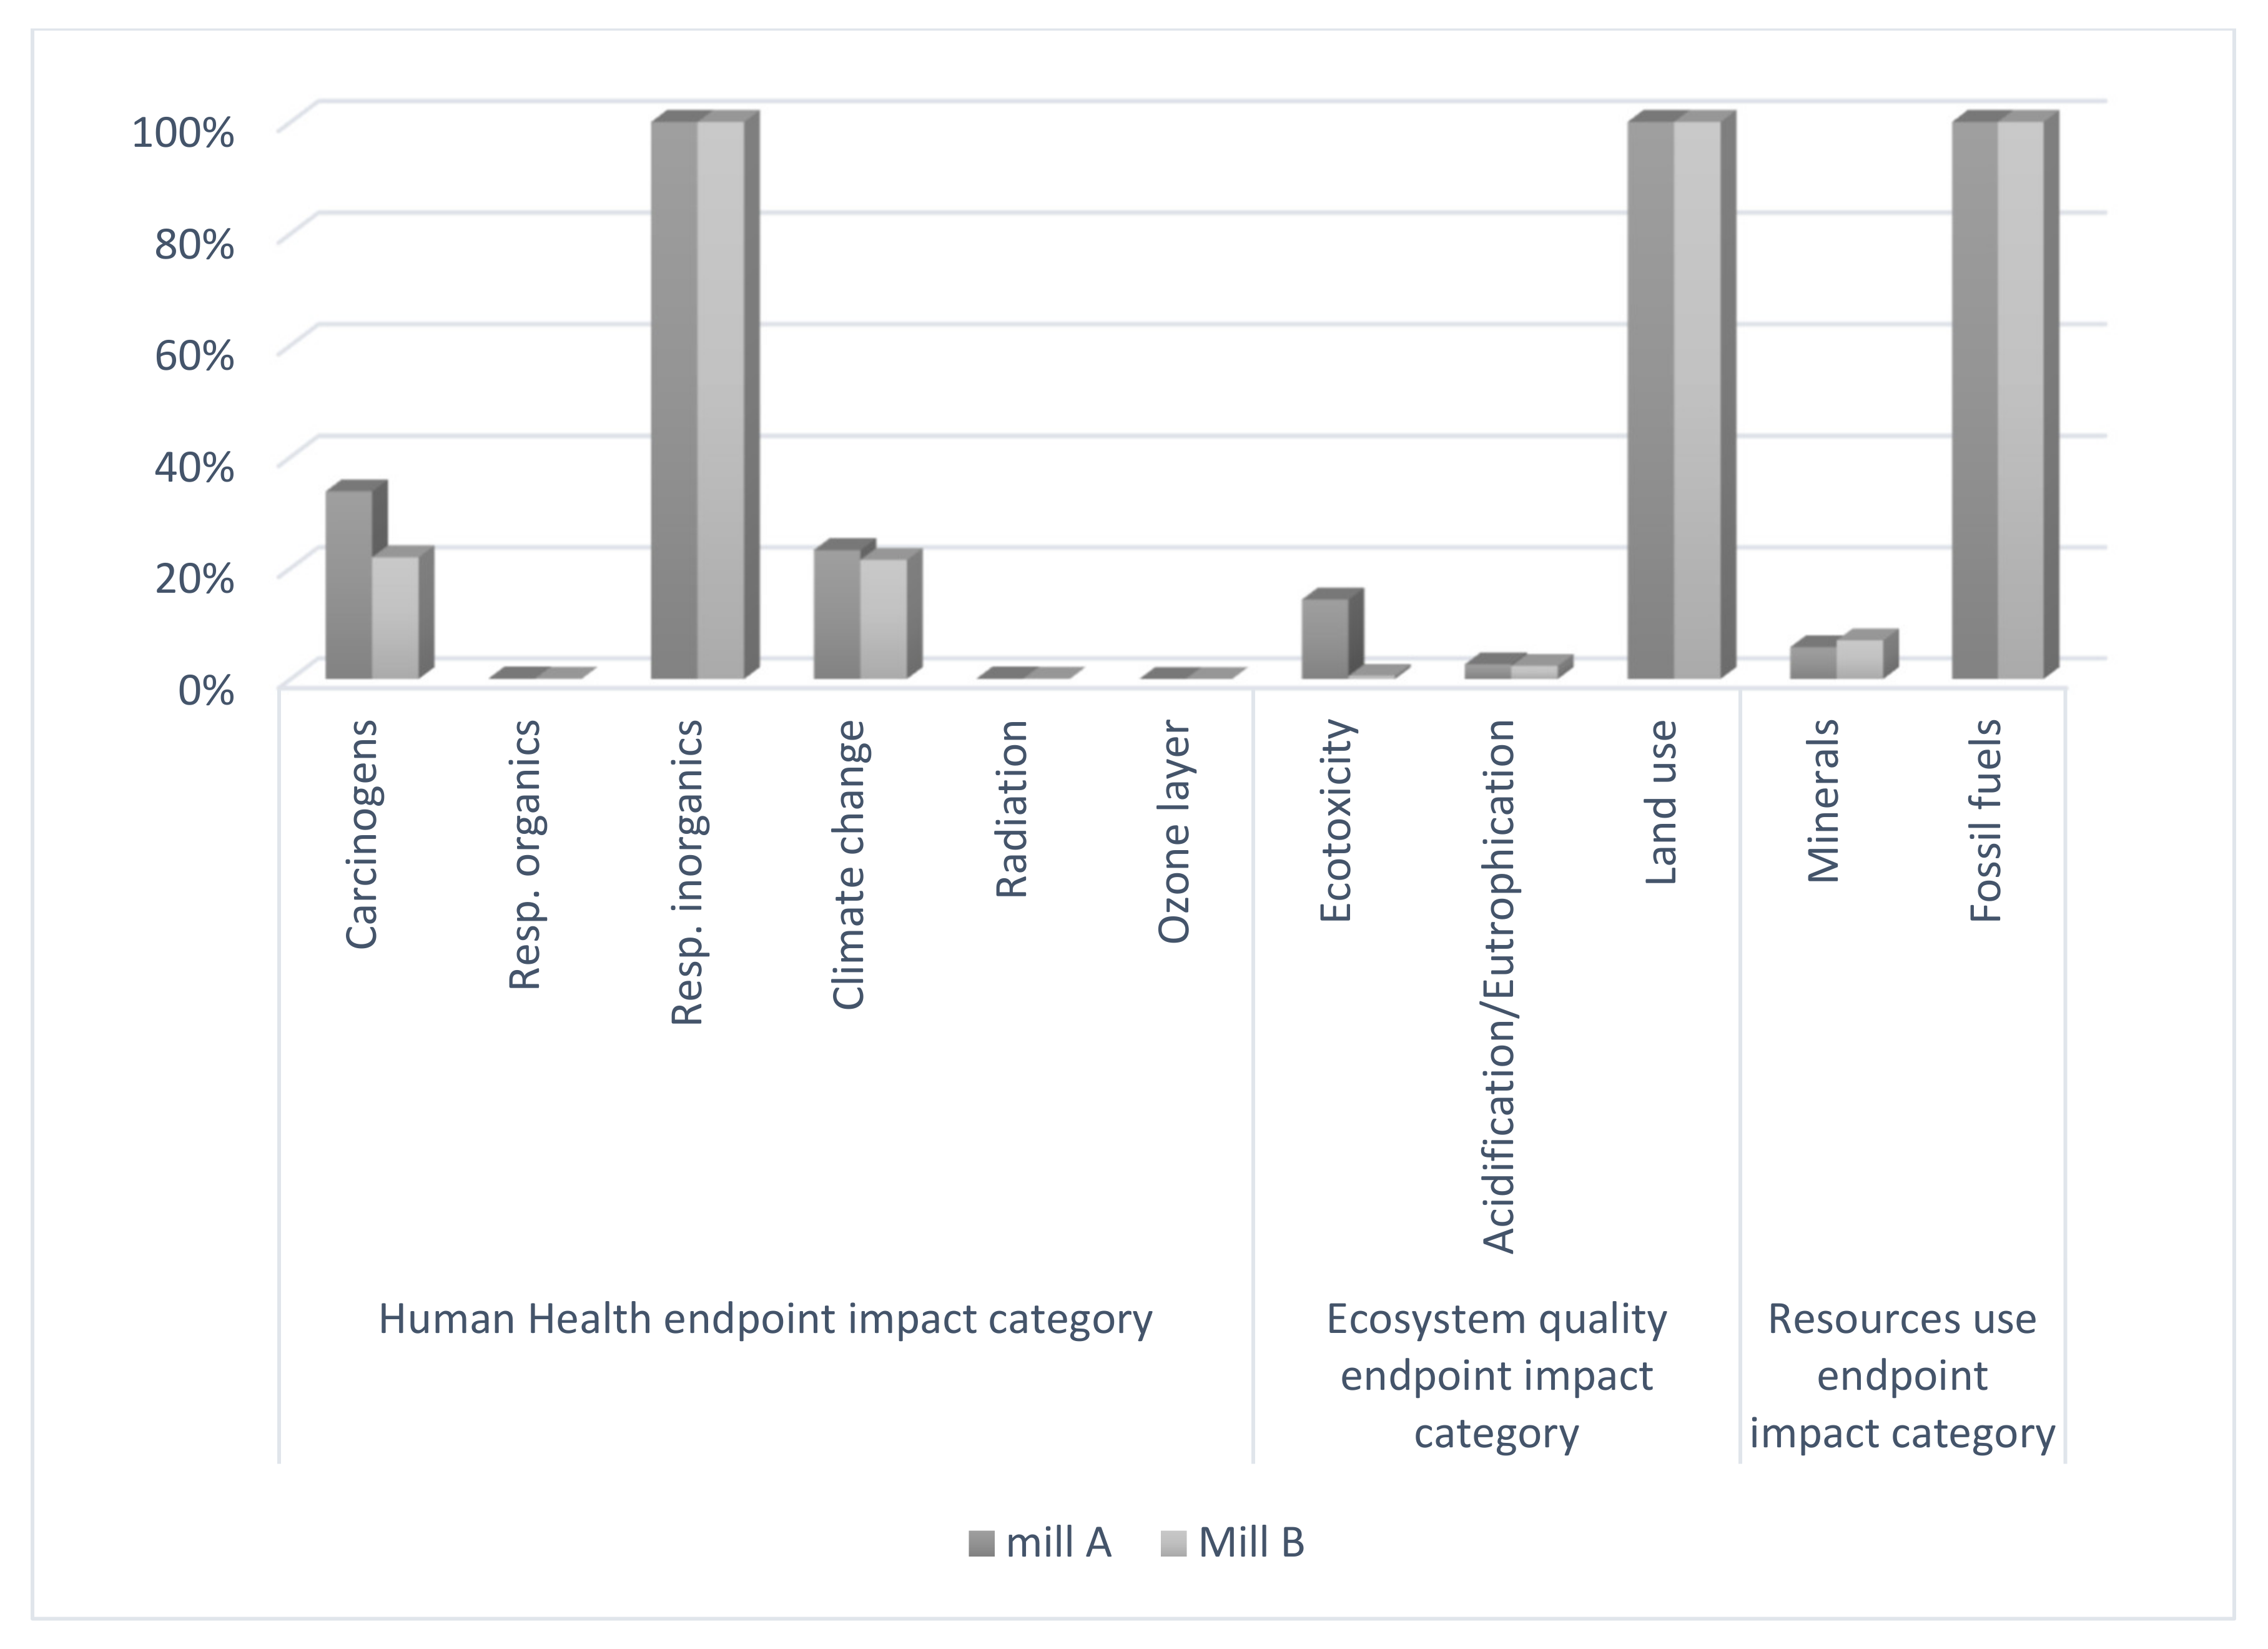
However, in order to obtain a clear overview of the subcategory that contributed most to the environmental damage, the subcategories obtained from the characterization step were expressed in percentages (%). The methodology used to calculate the percentages for environmental dimension based on the calculation described by [
42] but in this study, the percentages were evaluated by comparing the subcategory values under the same impact category, so the subcategory that has the highest value under the same impact category has a contribution of 100% and the other subcategories obtained a proportional percentage. The results for mill A showed that for human health endpoint impact category, respiratory inorganic was assigned 100% to the damage substances emitted because it had the highest total amount (757 DALY) of such substances that caused human health endpoint impact category, while 23.24 (176 DALY) and 33.81% (256 DALY) of the substances were emitted from climate change and Carcinogens subcategories, respectively. This result is consistent with the outcomes of [
36,
46]. Moreover, land use was assigned 100% to the damage substances emitted. It had the highest amount (2.11 × 10
9 pdf*m2yr) of such substances emitted into the environment that belonged to the ecosystem quality endpoint impact category, while 2.64% (5.61 × 10
7 pdf*m2yr) and 14.33% (3.04 × 10
8 pdf*m2yr) of the substances were emitted from acidification/eutrophication and ecotoxicity subcategories, respectively. Regarding resources use endpoint impact category, the substances emitted (9.25 × 10
8 MJ surplus) was 100% of the substances emitted into the environment from fossil fuels, while 5.74% (5.31 × 10
7 MJ surplus) of the substances emitted were from the minerals subcategory.
For mill B, respiratory inorganics had 100% allocation to the damage substances emitted because it had the highest total value (453 DALY) of such substances emitted into the environment that related to the human health endpoint impact category, while 21.45% (97.2 DALY) and 21.94% (99.42 DALY) of the substances were emitted from climate change and carcinogens subcategories, respectively. For the damage to the ccosystem quality endpoint impact category, land use had 100% assigned to the damage substances emitted because it had the highest total value (1.97 × 10
9 pdf*m2yr), while the slight percentage was assigned to the damage substances emitted from acidification/eutrophication and ecotoxicity subcategories. Considering the resources use endpoint impact category, the substances emitted (3.10 × 10
8 MJ surplus) were 100% of the substances emitted into the environment from fossil fuels, while 6.96% (2.16 × 10
7 MJ surplus) of the substances was emitted from the minerals subcategory. However, the damage substances emitted from subcategories such as, radiation, ozone layer, and respiratory organics were given a small percentage for both mills.
Figure 2 shows the outcomes of the environmental impacts percentage of the two selected plantation-based mills.
The results in
Table 2 show that Mill A has the highest environmental impact in all categories; this is because this based plantation mill has a larger plantation area than Mill B. Thus, it requires more use of fertilizers and pesticides and more diesel, power, and water consumption to produce the FFB. In addition, Mill A has the higher mill capacity than Mill B and it requires more amount of FFB to produce the CPO. Thus, it generates more waste, such as shell, fiber, and empty fruit bunch EFB and causes more gas emission from the stack.
3.2. Economic Dimension Results
For LCC, initial investment cost, operational and maintenance costs, and the end of life cost were considered when evaluating the economic impacts of the crude palm oil production. Initial investment costs involve the plants’ instrumentation and equipment and the required land area. The operational and maintenance cost refers to the cost incurred among the operational and maintenance phase, which considers the cost of operational and maintenance, fuel, water consumption, supervision, chemical energy used, administration, and transportation. Maintenance costs also involve costs related to sanitation service. The end of life cost refers to the costs associate with solid biomass waste collection, waste-water treatment, and disposal inspections costs.
The following formula [
48] was used in this study to calculate the inventory cost data.
where: CF—the cash flows that can be obtained in the year t, n—the number of years in the study period, r—real discount rate applied to adjust cash flows and bring them to an existing value.
As presented in
Table 3, the initial investment cost was the major contributor of the LCC for both mills and this is due to the raw materials (fresh palm fruits) cost, which was 22,687,104.024 RM/MT for mill A and 85,500,000 for mill B. This is in line with the study by [
14] who reported that the cost of fresh palm fruits contributed to 88% of the total production costs. These costs are followed by machine costs, which were 6,162,542.90 RM/MT and 29,815,563.07 RM/MT for both mills, respectively. The operational cost indicates that the cost was incurred during the operational phase. The major contributor item for this phase was the production process costs which were 9,579,606.07 RM/MT for mill A and 8,395,810 RM/MT for mill B. This is followed by the labor costs, which were 8,936,940 RM/MT for mill A and 6,186,192 RM/MT for mill B. For the maintenance costs, the machinery maintenance costs were the major contributor at mill A, which were 7,269,084 RM/MT, followed by the costs of management which were 5,996,004 RM/MT. On the other hand, management costs were the major contributor at mill B with the amount (12,264,000 RM/year). This is followed by the costs of machinery maintenance which was 2,196,000 RM/year.
However, the sanitation service costs were negligible for both mills. Based on these evaluations, the total cost of crude palm oil production through the year 2019 was 67,439,327.3 RM and 149,972,519 RM for mill A and mill B, respectively. The end of life phase was the lowest contributor phase of LCC where it was 188,908.65 for mill A and 52,105.62 for mill B. However,
Table 3 shows the total cost and their respective contributions as well as the crude palm oil production payback period (PBP). The cost category percentages were obtained by dividing the amount of each cost impact category by the total cost and then multiplying the outcomes by 100. The high percentage of cost impact category refers to the passive impact for this impact category on the overall economic impact. The payback period for the two mills was found to be 3.6 years and 2 years for mill A and mill B. This result, being less than one-third of the 10 year project life, showed that the project is financially viable. Moreover, the NPV value was positive for both mills.
Since the based plantation mill A has a larger plantation area and mill capacity than Mill B, it presents the highest economic impacts. Mill A has the highest operation costs because it requires a higher number of workers, and more costs of fertilizers, electricity, fuel, and water. Moreover, it presents higher maintenance and the end of life costs because this mill needs more costs for machinery maintenance, sanitation service, waste treatment, and water disposal.
3.3. Social Dimension Results
The impact category for workers aimed to cover the social impacts on crude palm oil production such as job satisfaction, fair salary, health and safety, discrimination/equal opportunities, and social benefits/social security.
Table 4 shows the results of all the related subcategories for workers expressed in percentages. There were 529 respondents for both mills, and the percentage for each indicator was obtained by dividing the answers for the indicator given by the stakeholder by the total number of respondents. The average of these results was taken to obtain the percentage of the subcategories. As shown in
Table 4, all social indicators had almost different percentages. Job satisfaction reflects the satisfaction of workers on the task given and the relationship with their supervisor. Similar to the study by [
49], the study found that most workers were satisfied with their work at the palm oil based plantation mills, 92.5% of workers at mill A and 90% at mill B were satisfied with their work. The study showed that the high percentage of workers’ satisfaction showed that the mills provided good working treatment and conditions for their workers.
Based on the findings for the fair salary subcategory, the workers at both the plantation-based mills were satisfied with their current wages, where the satisfaction of the wages paid by the organization was 89.05% and 87.3% at mill A and mill B, respectively. This finding was supported by the findings of other studies [
3,
4], where the employment with companies had led to an overall positive change to workers’ livelihoods. The next subcategory assessed in this study was the health and safety. The results revealed that the workers were fully aware of the procedures to follow in case of an emergency/accident. The results also showed that the mills took immediate actions whenever accidents happened. In addition, the mills provided the necessary protective equipment to the workers. This is supported by a similar study conducted by [
16]. Most of the workers stated that they were satisfied with the health and safety in their workplace. Based on the finding, it is worth noting that there was not any gender, racial, political, nationality, training, or social class discrimination.
Moreover, the mill does not discriminate against the workers in terms of development and training, promotional opportunities, holidays, working hours, access to physical facilities at the workplace, and medical facilities from the mills. This means that the discrimination percentage in both mills was extremely low. This is confirmed by a similar studies carried out by [
16,
18] who stated that, the discrimination does not become a significant issue in the palm oil mills. The majority of the workers at mill A and only 89% of the workers at mill B were exhibited high level of satisfaction regarding social security organization (SOCSO) scheme. Most of the workers enjoyed social benefits that they received from the mills. These results were similar to the findings of [
17]. The impact category for the local community aimed to cover social impacts on crude palm oil production such as safe and healthy living condition, culture and heritage, local community involvement, and local community job opportunities.
Table 5 shows the results in percentages of all the related subcategories for the local community. Based on the questionnaires, 99.2% of the respondents were satisfied with their community and considered it a healthy community. The reason for this high percentage could be due to the programs and regulations that the mills had in place to reduce pollution in the area.
Moreover, 98.14% of the respondents noted that there were no serious social problems among the local community. The results of the questionnaire also revealed that the mills provided social and religious programs to raise the aesthetics, recreation, and values for the local community. The mills also created culturally specific activities to strengthen intercultural dialogue. In spite of these contributions of the mills, 68% of the respondents were satisfied with the way the management of mills dealt with the cultural and heritage conservation issues such as demographic change, the life style, and the local culture. The results obtained showed that the majority of the workers in the mills and plantations were from the local community. The mills also frequently held collaborative activities that engaged the people in the local community. These activities strengthened relations between the mills and the community. This result is similar to the findings of [
17] who reported that the manufacturing companies always involved the local community in their activities. The respondents who stated that the mills contributed to the local development in consultation with the local community was 99.6%.
3.4. Sustainability Assessment Results
For the environmental dimension, the increase in the environmental indicators percentage means that it is a negative impact for these indicators on the total environmental impact. Thus, the scale of the environmental scores were determined as 4 points for 0–20%, 3 points for 21–40%, 2 points for 41–60%, 1 point for 61–80%, and 0 points for 81–100%. As shown in
Table 6, the percentage for land use, respiratory inorganic, and fossil fuels subcategories were 100%. Thus, these subcategories were signed with the score 0. The percentage for climate change and carcinogens subcategories was in the range 21–40%. Therefore, theses subcategories were signed with the score 3. The other subcategories were in the range 0–20%. Thus they were signed with the score 4. However, the scores for land use, respiratory inorganics, and fossil fuels subcategories were the least scored with the score of 0 point for mill A and mill B. The scores for climate change and carcinogens subcategories were 3 points at both the mills. In contrast, the other impact categories such as radiation, respiratory organics, ecotoxicity, ozone layer, minerals, and acidification/eutrophication had more positive impacts with a score of 4 at mill A and mill B.
However, to obtain the total score for the environmental impact, the subcategories scores under the same impact category level were averaged. Then, the impact categories scores were averaged and this average score was assigned to the total environmental impact. This simplify the indicators aggregation into a single number. The total environmental scores for mill A and mill B were 2.5 points.
For the economic dimension, Scores from 0 to 4 were assigned to each cost impact category based on the percentage of contribution given
Table 7. For economic indicators, the increase in the economic indicators percentage means that there is negative impact for these indicators on the total economic impact. However, the initial investment cost impact category had the lowest rating which was 2 points at mill A and 1 point at mill B while the operating cost impact category received a higher score with 3 points at mill A and 4 points at mill B. The most positive impacts were end-of-life cost and maintenance costs impact categories with a score of 4 points each. To obtain the total score for the economic impact, the subcategories scores under the same impact category level were averaged. Then, the impact categories scores were averaged and this average score was assigned to the total economic impact. This facilitated the aggregation of the indicators into a single number. The total economic score for both mill A and mill B was 3.25 points.
For the social dimension, most of the indicators scored by workers for aspects such as satisfaction in wages, work satisfaction, the safety risk of the system, presence of protective equipment, health and safety awareness, the presence of discrimination, presence of equal opportunity and the presence of social security were expressed as good level of satisfaction and the scores of these indicators were reflected in the range between 3.8 and 4, while the indicators such accident/injury and the social benefits were classified in the least level of satisfaction. Thus, the mills need to improve these indicators to achieve the sustainability of the product. For the local community stakeholder, the local community involvement subcategory was the only category with a score of 4.
The scores for healthy and safe living conditions and respect for cultural heritage subcategories were 3.5 points and 3.9 points, respectively. The local community job opportunities subcategory had the least score with 3.2 points. This means that these subcategories need pressing improvement. However, once the scores of all impact categories were obtained, the scores for the impact categories under the same dimension were averaged to get the total score for the dimension. The results presented for the scores for the three dimensions at mill A and mill B were not different, which were 2.5, 3.25 points and 3.7 points for environmental, economic, and social dimensions, respectively. The combined inventory results for the impact categories under the proposed scoring system as well as the total scores obtained for the three dimensions are showed in
Table 8.


