1. Introduction
With the development of society and the economy, urbanization is an inevitable trend and a hot research topic. According to a United Nations (UN) report, the global urban population exceeded the rural population for the first time in 2007 and will increase to 68% of the total global population by 2050 [
1]. The expansion rate of construction land is an important indicator to measure urban sprawl and evaluate the urban ecological environment [
2]. The simulation of land-use changes and related urban spatial patterns by setting different scenarios is an effective means to explore the process of urban development, providing insights into better adjusting and optimizing urban planning, and helping cities to achieve their future urban construction goals.
In the past few decades, domestic and foreign researchers created many different mathematical models to simulate and predict future land-use development, such as the system dynamic model [
3,
4], Markov chain model [
5], cellular-automata (CA) model [
6], conversion of land-use and its effects (CLUE) [
7], agent-based model (ABM) [
8], future land-use simulation (FLUS) [
9], and geographical simulation and optimization systems (GeoSOS) [
10]. Among the different models, CLUE is widely adopted to simulate urban sprawl, land-use/-cover changes, and food safety applications. Verburg [
11] optimized CLUE by further improving its simulation speed, accuracy, and convenience of operation, and they proposed the CLUMondo model, which proved effective in many applications, such as simulating global agricultural landscape changes [
12] and multiscale land-use/-cover changes [
13,
14,
15,
16]. These simulation results can also provide useful references to better design policies and incentives to foster greater sustainability on both the global and regional scale.
Mega-sports events are short-term liquidity activities held in a fixed period. While attracting a great number of tourists, holding these events also requires huge economic investments, resulting in long-term and profound impacts on the building environment, economy, and political opportunities of the host city [
17,
18]. Mega-sports events of sufficient scale and scope affect the whole economy and receive sustained global media attention [
19,
20]. In addition to the objective benefits to the host city, these include contributing to the promotion of urban regeneration [
21], enhancing its international status, repositioning itself in the global tourism market, and gaining an advantage over competitors [
22]. For example, they provide the host city with opportunities to improve its urban planning and development, thus accelerating the process of urbanization [
23]. The combination of major events and urban planning vigorously promotes urban spatial-structure adjustments, improves the urban environment, and accelerates the pace of urban renewal and transmission [
24]. Most promoting effects of holding mega-sports events are related to land-use, such as urban infrastructure, especially transportation network construction [
25]. This requires the host city to build new venues and traffic lines, and also to reconfigure urban governance planning and strategic development plans, influencing both the city and its citizens [
26]. In previous success cases, such as the Sydney Olympics in 2000 and the London Olympics in 2012, they have successfully transformed the hosting of mega-events into positive drivers of urban development, particularly in terms of infrastructure improvements, urban regeneration, and city branding [
22,
27]. However, related works focused more on the qualitative evaluation and analysis of driving factors. Combined with the land-use model, our study can better quantitatively simulate and analyze the influence of mega-sports events on urban spatial development.
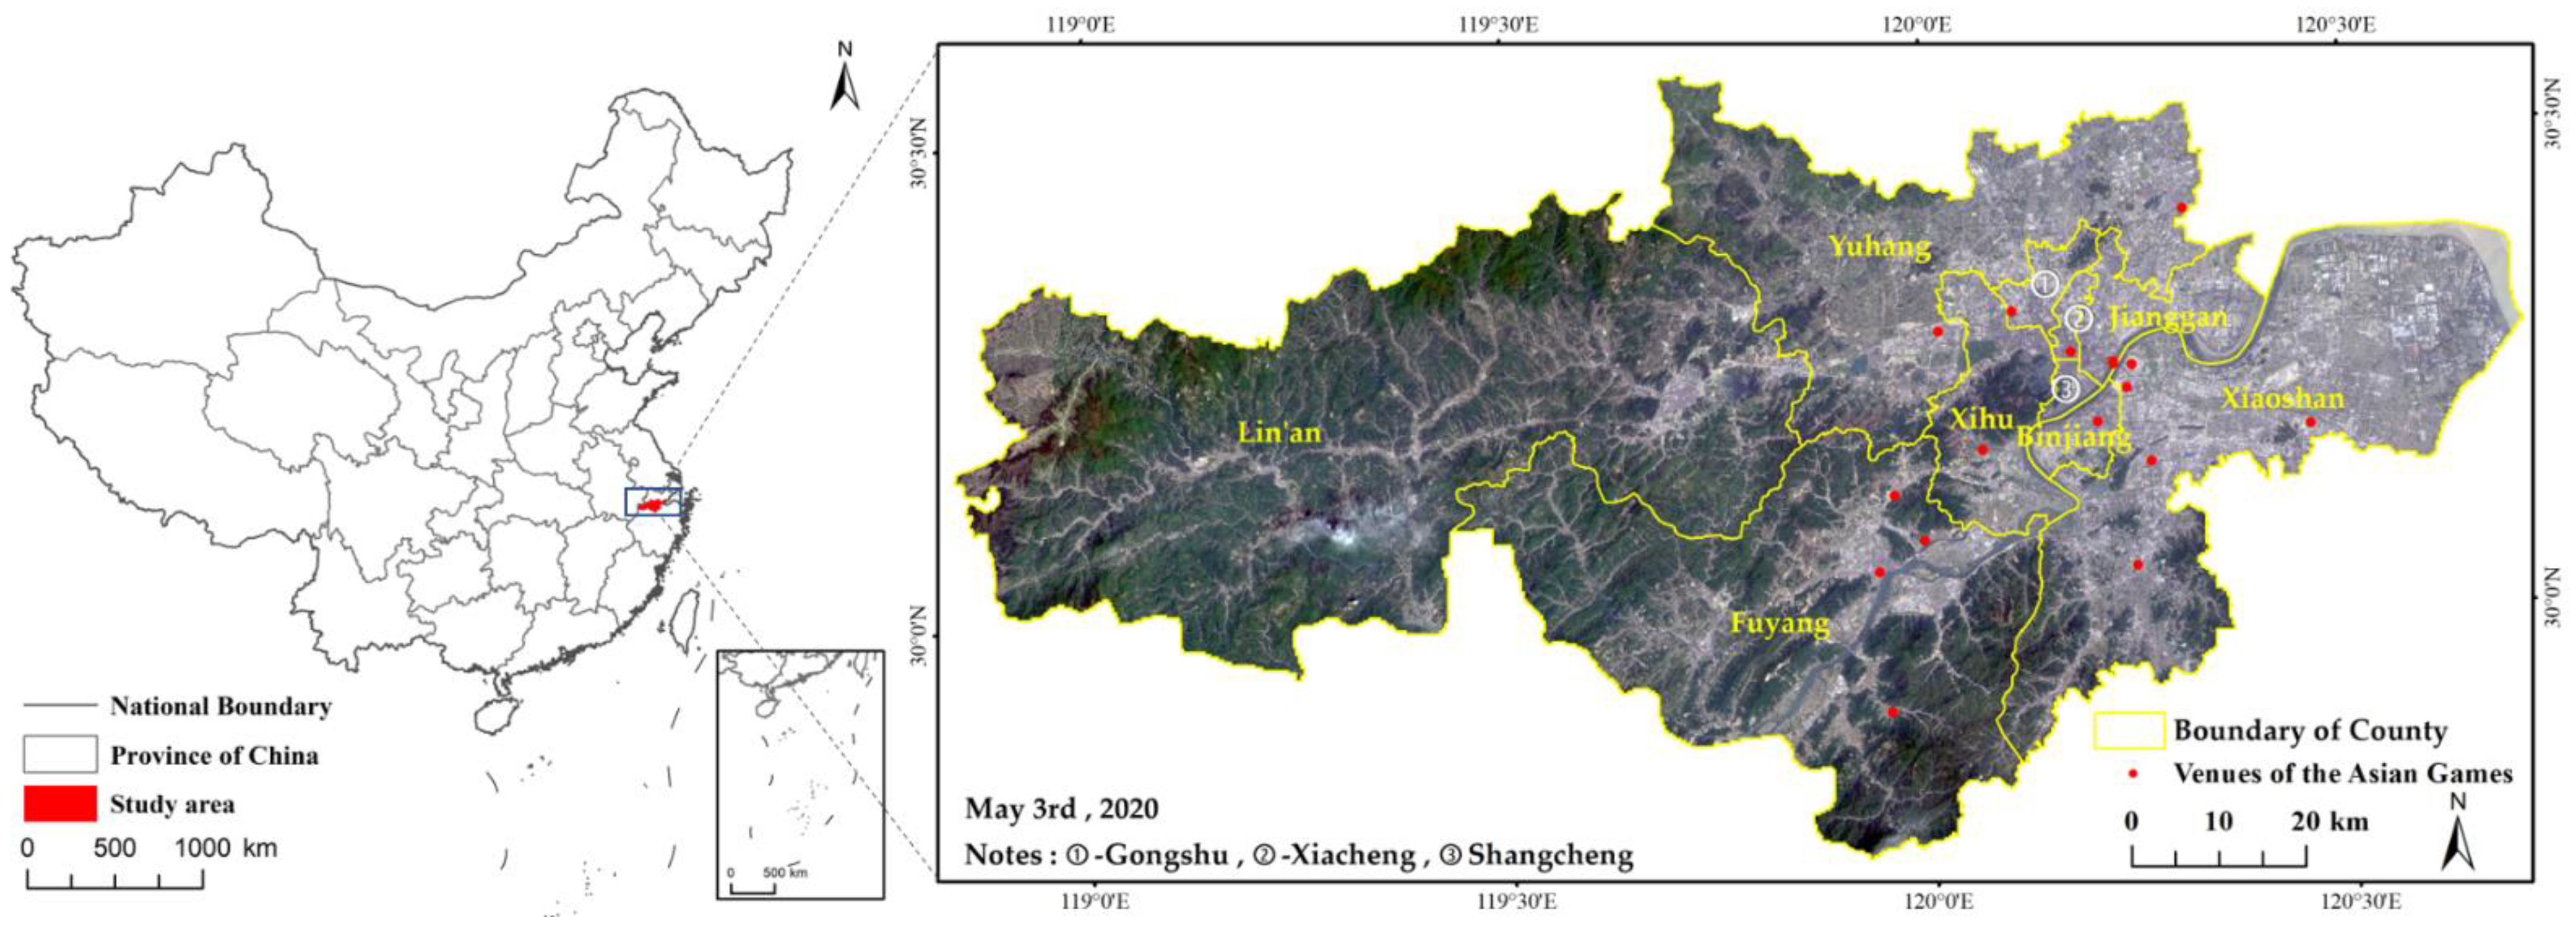
Taking the 19th Asian Games Hangzhou 2022 (AGH) as a case study, we used a scenario-based model (CLUMondo) to simulate and predict the urban spatial structure under two different scenarios (natural development and AGH-driven development), then we analyzed the potential influencing factors. Our objectives were to (1) monitor historical land-use changes from 2005 to 2020; (2) simulate 2025 Hangzhou land-use changes under the two scenarios; and (3) explore the characteristics of urban land growth, spatial structure, and its driving factors. Our study helps to reveal the influence and driving mechanism of mega-sports events such as AGH on the urban spatial structure of a host city, and it provides the theoretical basis for urban planning and future development in Hangzhou. Furthermore, it is a useful reference for the development planning of other cities hosting mega-sports events.
3. Methods
This study comprises three parts, namely, CLUMondo model simulation, urban-expansion analysis, and driving-factor analysis (
Figure 3). First, to build up the CLUMondo model, driving factors were properly selected, model parameters were set, and the urban spatial structure was simulated under different scenarios of natural development and AGH-driven development, respectively. Next, differences between two developing scenarios were analyzed on the basis of indices of urban land-expansion intensity, centroid, and dispersion. Lastly, we discussed the impact of direct driving factors (e.g., venues and supporting facilities, and public transport land) and indirect driving factors (e.g., socioeconomic factors, policy and planning) on urban spatial development.
3.1. CLUMondo Construction and Setup
CLUMondo is a dynamic and spatially intuitive land-use model, which is the latest addition in the series of models that started as the Conversion of Land Use and its Effects modelling framework (CLUE) [
31]. It is an empirical land-use model based on location-suitability analysis that combines the spatiotemporal dynamic competition and interaction dynamic simulation of land-use systems [
32]. This model can be divided into the nonspatial demand module and spatial display allocation module, of which the former generates the needed transformation on the system level, such as construction land area and grain output; the latter reveals land-use changes in a specific location of the study area [
12]. In this model, external system input is the demand; the allocation algorithm supported by the user interface determines the final allocation result. Specific settings of parameters were as follows.
(1) Adding exclusion layers. Area restriction files can be used to indicate where land-use changes are not allowed. Xixi Wetland and West Lake Scenic Area are natural protected areas in Hangzhou [
33], so they are considered as restricted development areas in the model.
(2) Driving-factor selection and validation. Natural geographical elements (e.g., topography) primarily determine land-use/-cover types, and they affect anthropogenic activities, which further influence the conversion of land use patterns and the probability of land use change; socioeconomic factors (e.g., traffic, economy, and population) and relevant policies (e.g., government planning) accelerate the process of land-use/-cover changes. All these elements are land-use change-related driving factors. More importantly, the drivers required by the model either remain relatively stable or change in a jump rather than an incremental manner over the study period [
34]. According to the location factors selected by Liu et al. [
35] and Gong et al. [
36], considering data collinearity, availability, and quantification [
37], we selected 10 driving factors, listed in
Table 1.
(3) Conversion resistance and conversion matrix. The conversion-resistance coefficient is related to the reversibility of land-use change, the value of which is in the range of 0 (easy to convert) to 1 (irreversible), and it is determined for each land-use type on the basis of the conversion law and expert knowledge of the past few years [
38]. The conversion matrix is used to determine whether the current land-use type can be converted, and to which other types it can be converted, where 0 means that conversion is not allowed, 1 that it is allowed, and 10X that the type of land use can be changed after a certain number of years, shown in
Table 2, with rows “from” and columns indicating “to”.
(4) Land-use demand calculation. Land-use demand restricted the simulation to meet the total demand of all types of land-use demand, which is relatively independent of the model itself. We often use the historical-trend extrapolation method to calculate recent land-use demand. Taking the land-use data of 2005, 2010, and 2015 as the basic data sources, the linear interpolation method was used to simulate the land-use condition of each year and predict its future land use.
3.2. Logistic Regression Analysis
One of the advantages of CLUMondo is its internal logistic regression analysis model that combines the locations of each land-use type with the map of driving factors. The model was established as below (Equation (1)) by selecting driving factors for each land-use type with the highest correlation and the probability relationship between them [
39,
40]:
where
is the probability of grid cell
i converting to a certain land-use type;
represents all driving factors; and
is the regression coefficients calculated by logistic regression analysis between each land-use type and its driving factors.
We used CLUMondo to conduct regression analysis among 6 land-use types and 10 driving factors, listed in
Table 3, to explore the relationship between each dependent variable (a certain land-use type) and multiple independent ones (all driving factors). The area under curve (AUC) is an index to measure accuracy, where the closer the value is to 1, the better regression is. AUC values of six land-use types were all greater than 0.75, indicating that our regression results were accurate.
3.3. Land-Use Model Validation
In this section, we used the 2010 land-use classification map as the input to CLUMondo, properly set model parameters (shown in
Table 1 and
Table 2), and simulated the 2015 land-use map (
Figure 4). Then, by comparing the simulation results (i.e., 2015 land-use map under the natural-development scenario) and the true land-use classification map (i.e., 2015 land-use classification results), we evaluated the accuracy of our model by calculating a confusion matrix, as shown in
Table 4. The results show that the simulation accuracy was high for cultivated land, forestland, grassland, water area, and construction land, with producer accuracy of 81.30%, 91.68%, 88.68%, 97.61%, and 85.79%, respectively. However, the simulation accuracy of unused land was relatively low due to its irregular distribution and relatively small area, which is easy to convert to other land-use types and thus hard to predict.
3.4. Future Development Scenario Setup
In order to reveal land-use changes under different conditions, we designed two scenarios, natural development and AGH-driven development, to simulate future changes. (1) Natural-development scenario: no policy intervention was involved; we calculated the rate of land-use changes on the basis of urban development in the past 10 years (2005–2015) and used this rate to run the following simulations. (2) AGH-driven development scenario: Hangzhou was selected as the host city of 2020 AGH in 2015, and the government thus reissued the Hangzhou Urban Master Plan (2016 revised version) [
41] and published the Hangzhou Railway Hub Plan (2016–2030) [
42]. AGH is an opportunity for Hangzhou to accelerate the pace of transportation construction (e.g., 4 vertical and 5 horizontal expressways, and 10 subway lines), new city construction (e.g., Asian Games village, Hangzhou CBD, and Future Science and Technology City) and talent introduction (e.g., West Lake University). Hangzhou also vigorously promoted its urbanization process, with much land planned as construction land and given priority to construct livelihood facilities (such as green spaces and parks). To this end, the annual growth rate of construction land from 2015 to 2020 increased by 0.5% due to AGH compared to that of the 10 previous years.
3.5. Urban Land Expansion Intensity and Difference
The urban expansion intensity index (UEI) refers to the urban expansion intensity in different periods, with its value reflecting corresponding urban expansion situations [
43]. The greater the UEI value is, the more intensive and faster urban expansion would be, as per Equation (2):
where UEI represents urban expansion intensity;
represent urban land area in time
and
respectively; and
represents the time interval between
and
.
By calculating the area-weighted centroid changes of urban construction land, we can further analyze the law of the development and changes of the urban landscape, and the key trends of urban construction. The calculation of centroids was performed according to Equation (3) [
44]:
where
and
are the centroid coordinates of urban construction land weighted by area;
and
are the centroid coordinates of the
patch of certain urban construction land;
is the area of the
patch; and
n is the total number of patches of urban construction land.
We used the spatial statistics tool in ArcGIS software to calculate the dispersion of urban construction land [
45], where the standard circle represents a single summary measure of the distribution of elements around the center; the smaller the radius is, the more concentrated urban distribution would be. The standard deviation ellipse measures the spatial distribution trend of a group of data, and the direction of the long axis represents spatial distribution with the maximal discrete direction. The flattening was calculated from dividing the difference between the major axis and the minor axis by the major axis; the larger the value is, the more obvious the directivity appears.
4. Results
4.1. Land-Use Spatial Structure and Changes
The classification results in
Figure 2 show the distribution pattern of different land-use types. For example, the city center is dominated by construction land; most of the eastern and northeastern regions are cultivated land, while the southern and western regions are forestland; Qiantang River passes through the city from northeast to southwest and flows through central built-up areas. The expansion of built-up areas is obvious and mainly comes from the replacement of cultivated land, which gradually expanded from the northwestern bank of the Qiantang River to the southeastern bank. We calculated the area of different land-use types in different years on the basis of classification results (
Figure 5), which showed that forestland and grassland rarely changed in the past 15 years; the water area decreased rapidly from 2005 to 2010. This is due to the proximity of the northeastern area of Xiaoshan District to the estuary of the Qiantang River. There are lots of beach resources, formed by the sedimentation of sand from Qiantang River; thus, it has been an important area of reclamation since the last century [
46]. During these five years, the reclamation remained very visible, with a large portion converted to cultivated land, followed by a lower decreasing rate. However, the land-use changes of cultivated and construction land are most obvious through the whole ground-feature change process, with cultivated land constantly decreasing and construction land increasing. As a result, cultivated-land area decreased from 2333.54 km
2 (in 2005) to 1963.58 km
2 (in 2020), while construction land increased from 702.29 km
2 (in 2005) to 1170.51 km
2 (in 2020). Cultivated land decreased at an annual rate of 1.36% from 2010 to 2015, and further to 1.90% from 2015 to 2020. Here, we did not consider the annual reduction rate of cultivated land in the first five years (2005–2010) since it had a large area of reclamation and expansion in this period. However, construction land area increased at an annual rate of 3.30% from 2005 to 2015 and accelerated to 3.80% from 2015 to 2020. In these five years, the total area of construction land increased by nearly 200 km
2, which was mainly converted from cultivated land.
4.2. Scenario Simulation Results
We used CLUMondo to simulate the land-use map of 2025 under two different scenarios on the basis of the historical trend of land-use changes from 2005 to 2015 and from 2015 to 2020 (
Figure 6), with the corresponding area statistics shown in
Table 5. In the two scenarios, construction land densely occupied the city center, and it continuously expanded by replacing cultivated land.
During the period of 2015–2025 under the natural development scenario, forestland, grassland, and water area generally showed a decreasing trend, where the total reduction in cultivated land was 319.41 km2, and the increase in construction land was 352.60 km2, the positions of which coincided with each other. Regarding the AGH-driven scenario, the law of urban growth was similar to that of the natural development scenario, but the expansion rate of construction land and the decreasing rate of cultivated land were higher. During these 10 years, cultivated land was estimated to decrease by 446.31 km2, and construction land to increase by 441.07 km2, where main areas for construction land expansion were similar to those in the natural development scenario, but land growth in the districts of Binjiang and Xiaoshan was more intense due to the setting of venues and villages for AGH. The trend of outward expansion from existing construction land was more obvious. Changes in forestland, grassland, and water area were also different. Grassland area decreased at a slow rate from 2005 to 2015, but increased from 2015 in terms of both the 2020 classification results and the 2025 simulation results. However, the areas of forestland and water area slightly increased in 2025 compared to in 2020, which was completely the opposite under the natural development scenario. Land-use change driven by AGH was more remarkable than that under the natural development scenario.
4.3. Change Detection Results
Figure 7 shows the spatial pattern of different land-use changes from 2005 to 2025, which indicates both the reduction in cultivated land and the increase in construction land. From 2005 to 2015, cultivated land area continuously decreased, and the decrease rate was even higher from 2010 to 2015, mainly concentrated in the periphery of the Xihu, Jianggan, Gongshu, and Binjiang districts and the areas near Xiaoshan International Airport in Xiaoshan district; Lin’an district also showed a small area reduction in its center. On the other hand, the increase in construction land was mostly consistent with the decrease in cultivated land, and there was a strong correlation between them. Under the natural development scenario from 2015 to 2025, cultivated land scattered around existing construction land decreased, while the increase in construction land was mainly concentrated in the eastern part of the Yuhang and Binjiang districts, the central and western regions of Xiaoshan (bordering with Binjiang), and the center of Lin’an. Compared to cultivated land, the increase in construction land was more regular, with few patches. The changing trend under the AGH-driven scenario was similar but more drastic, especially in Binjiang and Xiaoshan, where construction land increased more and faster, expanding along both sides of the Qiantang River.
4.4. Urban Land Expansion Intensity and Difference
The intensity of urban land expansion increased, and urbanization development accelerated. From 2005 to 2010, the intensity index of urban land expansion was the lowest, with a UEI value of 2.88%; in the next five years (2010–2015), the UEI value increased to 4.18%. Due to the rapid development of the city, urban construction land increased rapidly. Specifically, construction land grew 100.98 km2 from 2005–2015 and 167.97 km2 from 2010–2015. According to the simulation results, from 2015 to 2025, the UEI value was 3.63% under the natural development scenario, which is slightly lower than that of the 10 previous years, 3.83%; under the AGH-driven scenario, with more rapid growth of urban construction land, the intensity index was the highest, with a UEI value of 4.54%.


