1. Introduction
The 2015 Paris Agreement saw most nations commit to limiting global warming to well below 2 °C above pre-industrial levels by ensuring a balance of greenhouse gas (GHG) sources and sinks in the second half of this century [
1]. This will require rapid reductions in GHG emissions in excess of current international mitigation commitments [
2]. Yet, despite increased mitigation efforts from a range of actors, global emissions increased in subsequent years prior to the COVID-19 pandemic [
3]. Subnational and non-state action can complement, catalyse, and reinforce national climate action, helping governments go further and act faster to reduce emissions, potentially realigning emissions with a Paris Agreement-compatible trajectory [
4].
Corporate actors are increasingly disclosing information on their carbon emissions and committing to different forms of climate action including commitments on renewable energy, energy efficiency, carbon pricing, protection of land and investment in green bonds. CDP (formerly the Carbon Disclosure Project) is a not-for-profit organisation providing support for company and city level environmental impact disclosure. In 2019, 8361 companies, representing over 50% of global market capitalisation, disclosed climate change information through CDP, compared with just 220 in 2003 [
5], suggesting significant growth in corporate reporting. However, much of this increased disclosure has been criticised for “corporate-centric”, “self-laudatory” reporting with “disclosure for the sake of disclosure”, and performance primarily assessed against self-referential indicators that provide an inadequate assessment of true sustainability [
6]. A key question arising from the corporate climate action literature is whether target-setting practices are ‘symbolic’ or ‘substantive’ [
7]. With the mainstreaming of corporate climate disclosure and target setting, there has been an associated shift towards evaluating the quality and effectiveness of these commitments [
8]. These criticisms have prompted a recent move towards context-based approaches to corporate sustainability [
6] with the use of absolute environmental sustainability assessment methods [
9] and resilience-based targets [
10,
11]. Such approaches link corporate targets with wider ecological system limits, such as planetary boundaries [
12]. One prominent example of such an approach is the science-based targets initiative (SBTi) [
13] which seeks to align corporate carbon reduction targets with global decarbonisation objectives.
The SBTi is a joint initiative from the World Wide Fund for Nature (WWF), the World Resources Institute (WRI), UN Global Compact and CDP, first launched in 2014. The initiative encourages corporations to set carbon reduction targets aligned with pathways that have a high probability of restricting global warming to below 2 °C above pre-industrial levels (from October 2019 this has become “well below 2 °C” for new entrants with a preference for 1.5 °C). These corporate ‘science-based targets’ (SBTs) are developed using a common set of resources and target-setting methodologies, then independently assessed and approved by a technical advisory group. The historic development of the initiative and target setting is discussed further in
Section S1 of the Supplementary Materials.
Although there is an extensive body of academic literature on the role of corporate actors in delivering climate mitigation, the SBTi specifically has received little attention to date. Many studies evaluate the discrete impact of reporting standards or schemes, with particular emphasis on the contribution of the CDP [
14,
15,
16], both to empirical emissions performance and to normative concepts such as transparency [
15]. A key concern is the correlation, or lack of correlation, between the ambition of target setting and emissions performance, with many noting the apparent mismatch between target ambition and scientific requirements for emissions reductions [
7,
17]. Bjørn et al. [
12] suggest that only a minority of companies make any reference to ecological limits in their reporting, and there is a prevailing sense that most corporate targets are in line with climate
policy rather than climate science [
18]. This renders the lack of evidence on the effectiveness of the SBTi a critical research gap.
As of 1 July 2020, only 21 publications indexed in Scopus contained references to ‘science-based targets’ in their title, abstract or keywords. A further 46 search results include the term in other fields. Of those using the phrase in a relevant context, only a handful directly address the topic (see
Supplementary Materials Section S1.2 for further details here). None of these studies provide a broad quantitative assessment of progress against established SBTs to date. Such an assessment requires additional data collection, as current sustainability rating schemes do not contain sufficient information to fully determine corporate performance against climate goals [
19]. One study in particular calls for greater empirical evidence to evaluate the role of SBTs as an emerging corporate climate governance tool [
20].
Although much has been done to publicise the increasing uptake of corporate SBTs, the initiative does not monitor progress against the approved targets, with companies left to self-reporting and disclosure through schemes such as CDP. Though CDP tracks the number of companies adopting SBTs and indicates the number of companies intending to set SBTs in the coming 2 years, they do not provide a collective assessment of progress against existing SBTs (though many companies individually report progress against their target in their CDP disclosure). Several independent initiatives such as the Transition Pathway Initiative and the Arabesque S-Ray tool also provide benchmarking and frameworks for evaluating progress [
21,
22], and the recent launch of a CDP ‘temperature ratings’ investor benchmarking tool is evidence of growing interest in how well company portfolios align with long-term warming signals [
23]. However, there remains a critical gap in the lack of target-setting schemes which are fully integrated with a strong monitoring, reporting and verification (MRV) component. To the authors’ knowledge, there has been no public attempt to demonstrate whether current SBTs are on track. This paper, therefore, reviews the progress of early adopters towards meeting their SBT.
The principal research question of the current paper is: ‘Are companies on track to achieve emissions reductions consistent with their science-based targets?’ Supplementary questions of importance are: ‘Is target achievement influenced by the scope of the target, or the target metric used?’; ‘Is target achievement a sign of strong action or poor ambition?’ and ‘How could the reporting of targets be improved?’ The analysis is limited to an assessment against the targets as set through the SBTi. This study does not assess the target-setting methodology or whether this aligns with national or global decarbonisation pathways. Nor does this study examine broader impacts (e.g., social), equity or governance issues, such as those identified by Walenta [
20]. These considerations will be best addressed by further studies.
Section 2 begins by reviewing uptake of SBTs to date.
Section 3 sets out the means by which the authors gathered and classified data on the earliest adopters to determine progress against their SBT.
Section 4 presents a summary of progress made by early adopters.
Section 5 discusses common issues encountered.
Section 6 outlines limitations to this study and areas for further research. Finally,
Section 7 summarises key conclusions.
3. Materials and Methods
3.1. Data Gathering
To assess the progress of early adopters of SBTs, the authors conducted a review between February and July 2020. The review started by considering all 92 companies that had approved SBTs prior to the end of February 2018. This cut off was chosen to include all companies reporting at least two years of progress against their SBT. The authors used public sources such as company annual reports, corporate social responsibility (CSR) websites and CDP responses to compile emissions data for each company corresponding to their target metrics. The complete dataset can be accessed as part of the
Supplementary Materials. The dataset includes information on each company’s target (short description, baseline year, target year, functional unit, reporting scope, etc.), the data sources from which emissions totals were obtained, as well as a range of
supplementary information (e.g., latest CDP score, sector and country), and notes on assumptions made, where required, and reasons given for outliers. Additional data on annual operating revenue and total employees from the ORBIS database [
38] was also used to provide context. Challenges experienced in data gathering are discussed in the
Supplementary Materials Section S2. Some of the information will now differ from that published on the SBTi website, where companies have revised their targets in the period between data collection and publication. For instance, Colgate Palmolive Company revised their targets to align with a 1.5 °C trajectory subsequent to the analysis presented here.
3.2. Target Classification and Terminology
For the purposes of this review, a common terminology was adopted as follows. Where a company set a SBT using a number of different metrics, each was considered as a separate target. Consequently, one company with a single SBT could have a number of targets. For instance, “HUBER + SUHNER Group commits to reduce Scope 1 and 2 GHG emissions per added value 30% by 2025 from a 2015 base-year. HUBER + SUHNER Group also commits to reduce Scope 3 GHG emissions per added value 30% by 2025 from a 2015 base year.” This is considered to be one SBT comprised of two targets.
The authors classified the targets as primary, secondary, or tertiary (not to be confused with Scopes 1, 2 and 3), depending on their relative importance or coverage of a company’s emissions. In the HUBER + SUHNER example, the Scope 1 and 2 emissions target is considered primary, and the Scope 3 target secondary. However, a primary target could feasibly be a Scope 3 target if this comprised the majority of a company’s emissions, for instance in a telecommunications or other service-based firm. Primary and secondary targets were generally quantifiable emission reduction targets, whilst tertiary targets were often commitments which were difficult to quantify or focused solely upon supplier engagement. Tertiary targets often took the place of Scope 3 emission reduction targets, as a means of influencing value chain emissions where a company may not have had capacity to conduct a full Scope 3 inventory. For instance, train operator Thalys initially committed to “engage with maintenance management suppliers to formulate more explicit targets” in order to reduce 50% of the company’s Scope 3 emissions. This classification of targets into primary, secondary and tertiary groups allows an assessment of company progress in a manner that prevents a company that has set multiple targets for different parts of their operation from impacting the results more than a company that has adopted a single target to capture all emissions. Therefore, the results for primary targets better represent company achievement of the most important targets and offers a valuable assessment of progress.
Primary and secondary targets were set using either absolute or intensity metrics. A range of functional units for intensity-based targets were observed, and these were grouped into economic intensity targets (e.g., metric tonnes CO2e per £ of GVA) and physical intensity targets (e.g., metric tonnes CO2e per litre of product sold).
3.3. Assessment of Progress Against Target
In some instances, companies explicitly stated or plotted progress against their SBT trajectory in their reporting, though this was rare. In most cases, it was necessary to compare the reported emissions against an assumed linear reduction trajectory from the baseline year to the first target year (e.g., if a company reported a SBT to 2025 from a 2015 baseline alongside a longer-term target for 2050, progress was assessed against a linear reduction trajectory from 2015 to 2025). This was considered a reasonable assumption as SBT trajectories are typically translated into linear reduction rates as part of the target development process. For context, current minimum linear reduction rates for new entrants aligned with 1.5 °C or well below 2 °C are 4.2% and 2.5%/annum, respectively [
29].
Companies were then deemed to be behind target if emissions had increased or reductions to the most recent reporting year were less than would have been required by a linear or stated trajectory. Companies were deemed to have had their target achieved if reductions to the most recent reporting year exceeded required reductions in the target year (e.g., if a company targeted reductions of 45% by 2025 but had already achieved reductions of 55% by 2019). It should be noted that this does not mean the company will necessarily achieve its target in the long term, as emissions could go up in subsequent years. If reductions to the most recent reporting year matched or exceeded the required reduction trajectory but had not yet achieved their ultimate target, then a company was deemed to be on target.
In all cases, the authors also tried to catalogue emissions in the reporting year in which the company had their SBT approved. The intention behind this being to determine the share of the target that had already been met prior to target validation. However, it was not possible to gather this information in all cases, if, for example a company revised its reporting methodology in a subsequent year to SBT setting and did not restate emissions for preceding years (with the exception of the baseline year).
3.4. Final Sample Description
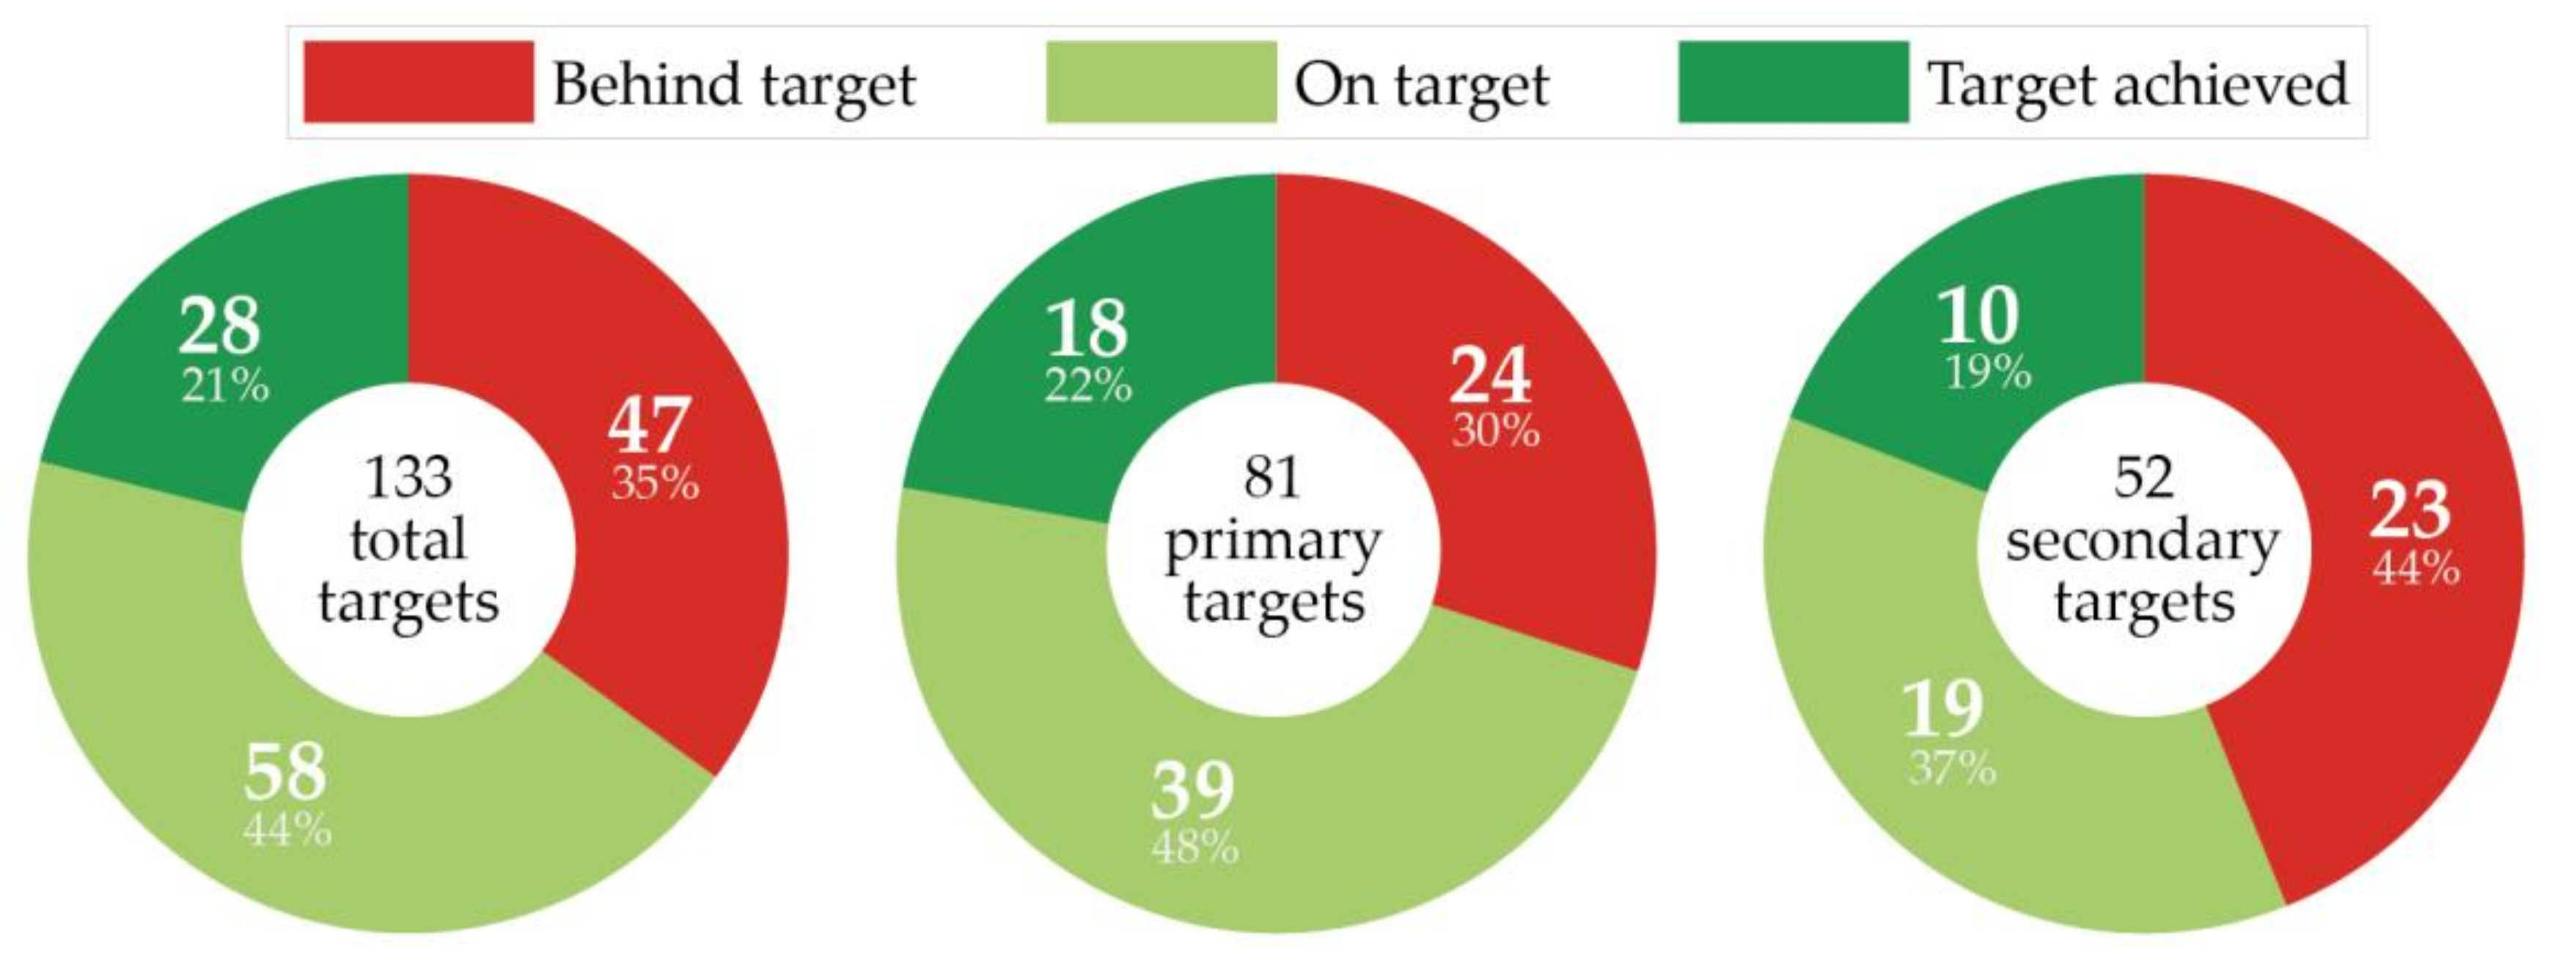
The final sample set consists of 133 primary and secondary targets from 81 companies, summarised in
Figure 3 below. In total, 2 of the 92 companies in the original sample were omitted as the company had been involved in a merger, meaning that their original targets were no longer valid. A further nine companies were omitted as there was not sufficient data available on their targets to include the company in the analysis. These were classified into 81
primary and 52
secondary targets. In total, 35 targets use intensity-based metrics and 98 use absolute metrics. Of the 35 intensity-based metrics, 26 were physical and 9 economic. A total of 35 different metrics were used—reflecting a broad mix of physical products, preferred reporting units and currencies. The target scopes are summarised in
Table 1 below. A variety of baseline years were adopted, amongst which 2015 was the most common (35% of sample targets). Similarly, a variety of mid- and long-term target years were adopted, of which 2030 was the most common (35% of longer-term target dates). In addition to these primary and secondary targets, 22 tertiary targets were identified from 15 companies, though only a minority of these were reported against. The companies in the final sample have a combined annual turnover exceeding
$1.8 trillion and employ over 5.9 million workers. The following section summarises headline progress against the targets. Full results from the review are available in the
Supplementary Materials Section S4.
3.5. Methodological Limitations
A key limitation to the findings is in attributing the emissions reductions by companies to participation in the SBTi. That is, there are questions of the true additionality of SBTs, where reductions may not have been solely motivated by the scheme. The real contribution of the SBTi to mitigation may then be variable between firms, and beyond the scope of this assessment to determine. Additionally, data on the early adopters may not be representative of firms now adopting SBTs. Successive revisions to the criteria as well as ongoing learning processes in carbon disclosure could enable late adopters to more effectively set and progress against SBTs, as has been the case with companies better performing in CDP ratings. As noted regarding the gap between commitment and approval, it may also be the case that companies are awaiting specific sector guidance before developing/validating their targets, leading to possible misrepresentation of which sectors are ‘leading’ and which appear less committed. For example, October 2020 saw the release of sector-specific guidance for financial institutions, a sector which has had a notable gap between commitments and target approval (
Figure 2). In other words, participation may have been delayed due to the need for more targeted support. The linear assumption of progress is a further limitation on the result, as is the sample size. These factors are discussed further in the
Supplementary Materials (Section S3).
The information included in the analysis is correct to the best interpretation of the authors and is available in full in the
Supplementary Materials Dataset. If you note any errors requiring correction, please get in touch. The authors welcome proposed methodological refinement and replication of this study. It may be particularly informative to repeat this assessment after companies have had a longer period to embed their SBT.
5. Discussion
The principle aim of this paper is to assess whether companies that have set science-based targets are in-line to achieve these targets, given their progress to date. Overall, 21% of targets have already been achieved, and 44% are on target, with 35% behind target (see
Figure 4). Half of companies were on target (or had achieved) all their targets, with 23% of companies being behind on all targets (shown in
Figure 5). It is, therefore, evident that the majority of targets are set to be achieved, given current progress.
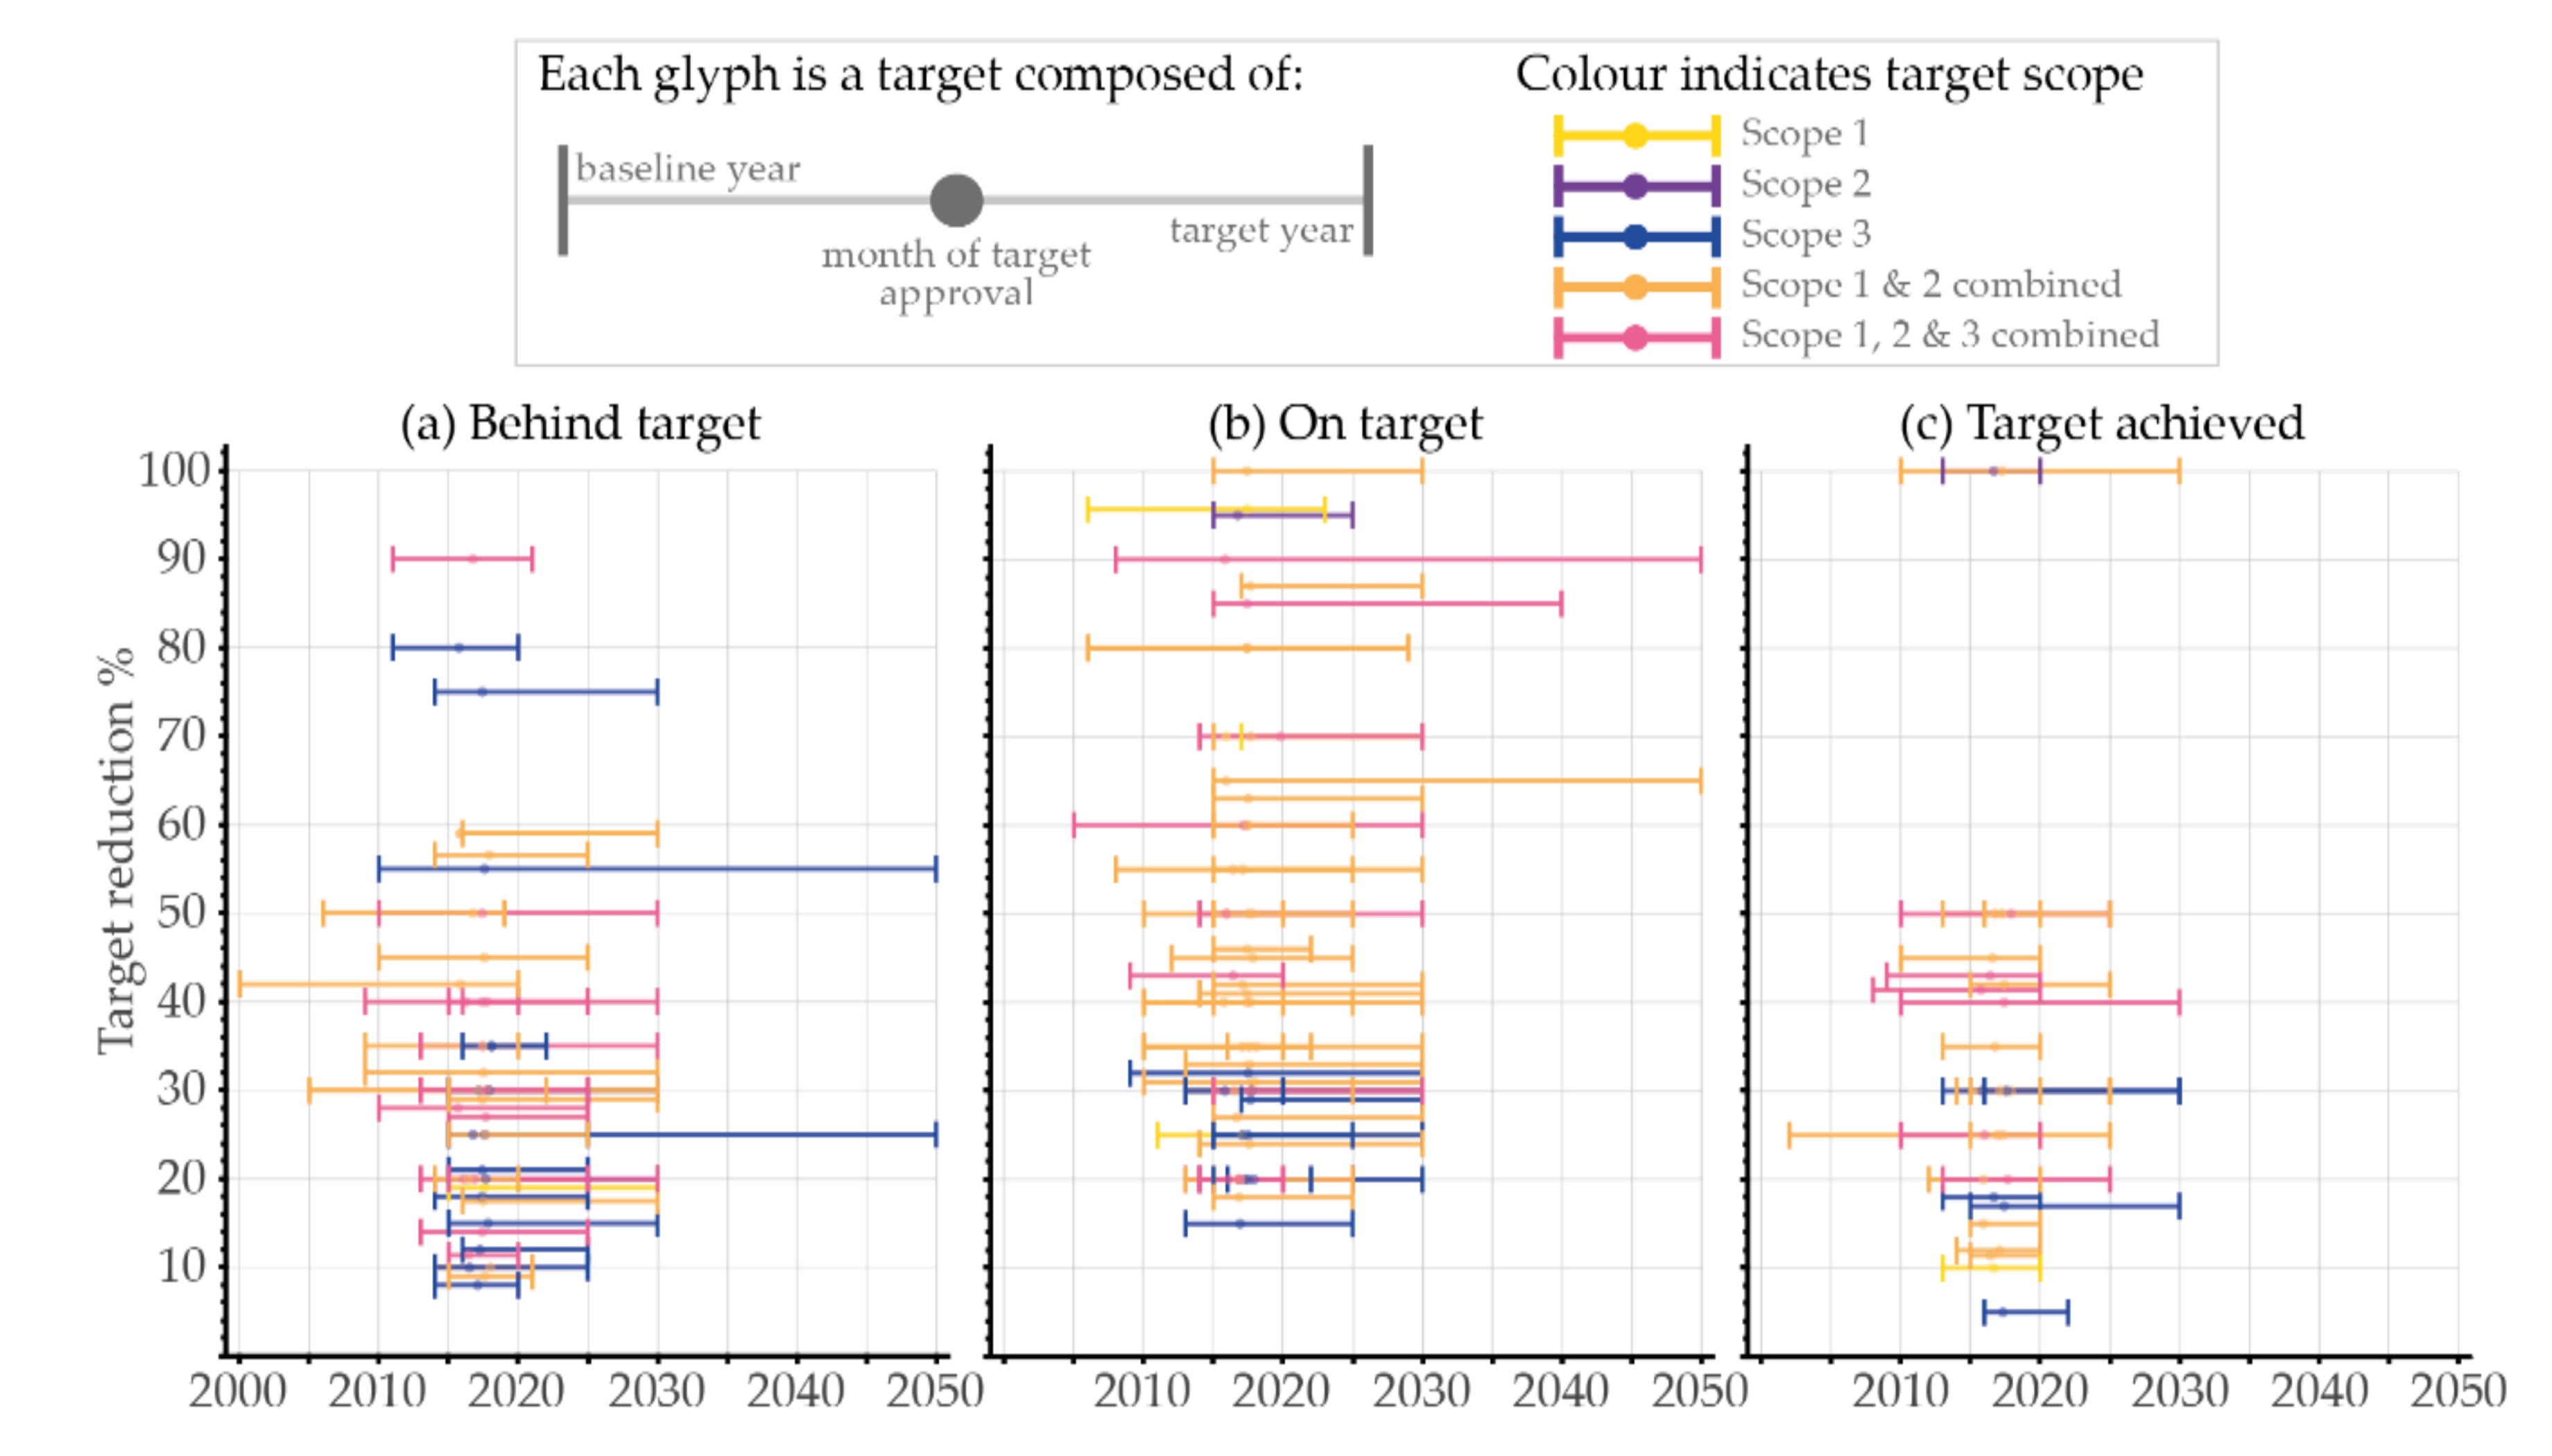
Whether a target is in-line to be (or already) achieved, is strongly influenced by the scope of emissions covered. Targets that include Scope 3 emissions are more likely to be behind target. In total, 75% of targets that do not include Scope 3 emissions are on target or achieved, this drops to 52% when Scope 3 targets are included (see
Table 3). This difference was found to be statistically significant. Companies have been less successful in reducing emissions for which they are indirectly responsible. Reducing emissions embodied in a company’s purchases and influencing suppliers to the company, or consumers of its products, to reduce their emissions appears more challenging in comparison to changing internal operations. It may also be the case that alternative low-carbon options for some Scope 3 emissions (e.g., business travel) are not being pursued. No significant differences in target progress were observed for absolute versus intensity-based target metrics. In addition, companies that were on target or had achieved targets with economic intensity metrics had also reduced absolute emissions. The authors expected intensity targets may be used for companies to continue to increase absolute emissions as they grew, whilst claiming progress in emissions reduction. It is heartening that this is not the case. The major limitation with the findings presented here is the assumption of linear progression towards the target. In the absence of additional information, this is the most reasonable assumption. However, some companies could claim (perhaps rightfully) that although they might be behind target under this linear assumption, they still expect to meet their final target given their future plans. It should be noted, however, that due to the importance of cumulative emissions, targets will be less effective if a larger proportion of reductions occur later in the target period.
This assessment of target progress leads to a broader consideration of whether being on target, or having achieved a target, indicates strong action or poor ambition from a company. The SBTi is a relatively young initiative (launched in 2014) and 18% of targets have been achieved at the time of this assessment (i.e., in the reporting prior to July 2020), with many achieved within a calendar year of target approval. Given the significant progress towards many of these targets within the year of target approval, highlighted in
Figure 10, this raises questions about how challenging these targets were and whether the initiative has caused any additional action at these companies. There are a number of plausible explanations for this early achievement of a target. A company may have delivered significant emissions reduction during the initiative’s target validation period or within the months following approval. A company may have subsequently updated emissions data for preceding years (for example, utilising additional supplier information or corrected factors), or, in some instances, the target may have been approved despite it already having been achieved because it was in line with the required reduction rates. Whilst version 2.0 of the validation criteria the SBTi states that “targets that have already been achieved by the date they are submitted to the SBTi are not acceptable” [
37], it is unclear whether this criterion was applied to the earliest adopters, particularly in the case of secondary targets. Many of the targets are fairly short term, with a median target year of 2025 across all targets. Short-term targets may result in more immediate action than a challenging long-term target. However, it is still unclear whether in cases of early target achievement the SBTi has inspired rapid action, or rewarded historic achievement.
The approval of a company’s target by the SBT scheme is a recognition of the alignment of the company target with wider science-based targets. However, there is still the opportunity for companies to show different levels of ambition having met the criteria for acceptance within the scheme. Given the variation in baseline year, target year, emissions scope, metric adopted and the unknown in terms of action of the company before the baseline year, it is not possible to make precise statements about the ambitiousness of one company’s target in comparison to another company. However, the large spread in terms of the percentage reduction in each target indicates the variation of ambition in broad terms. Introducing standard criteria for target setting could increase comparability between companies. For example, requiring that there is a consistent choice of base year would mitigate the effect of companies deliberately choosing a year with favourable emissions. In practice, this could mean that all companies validating a target in the same year would have the same baseline year, unless given specific exceptional circumstances, improving comparability within the scheme. This could avoid the potential case of companies ‘gaming’ their targets to maximise headline reductions.
The task of collating data for the current study gave the authors an insight into the various reporting practices of the companies involved in the SBTi. Whilst company targets are listed on the SBTi website, the reporting of target metrics is not undertaken by the organisation and, in the current work, required data gathering from the reporting documents of individual companies. Reporting practices were variable in terms of the clarity, and how (and whether) the target metrics were transparently reported. In total, 35 of 168 targets (21%) had to be excluded from the current study as there was not sufficient publicly available information to assess target progress. Additionally, a number of the targets that were included required considerable effort in gathering sufficient data for this assessment. In the best case, a metric was clearly reported by the company (in an annual sustainability report or similar, with a downloadable data file being optimal) with a clear time series showing the metric for previous years, including, importantly, the value of the metric in the base year. The following points indicate common departures from this best practice.
The metric is clearly reported for the year of the corporate report, but for previous years, earlier reports must be used. In addition to being more time intensive to collect data from multiple sources, there may be concerns about the consistency of the data between reporting years, as methodology may be revised.
Progress towards the target is given in relative terms, with the absolute figure for the base year metric not available in the most recent report, giving similar concerns regarding methodological consistency as above. In the worst cases, the absolute value of the base year metric was not available.
It is not clear which metric is the correct target metric. This can be due to a lack of clarity in the target-setting document or the annual reporting. For example, Scope 2 emissions may be reported in location-based and market-based terms, with the target only referring to Scope 2 emissions.
The metric is not directly reported but constituent parts are. For example, in the case that the target metric is intensity based, absolute values need to be combined to calculate the target metric. In the worst cases additional sources, including those not directly produced by the company, are needed. For example, economic output data must be collected from a separate source. Concerns about consistency again arise here.
The annually reported metrics include the effect of offsets, which are not allowable under the SBTi guidance.
The target metric and/or the base year information is not reported through any publicly available source.
If the SBTi required specific reporting, rather than general disclosure, it could increase the effectiveness of the scheme. Although the initiative represents enhanced rigor in the process of target review and validation, without a mandatory reporting framework, there is no penalty for lack of progress against a target. This could result in weaker corporate action where there is no financial or even reputational risk associated with non-compliance and, with the lack of transparency, it could be accused of greenwashing. There may be a desire to avoid an additional reporting burden on companies, or concern that publicly reporting targets could discourage companies joining if they risk not achieving targets. However, such a requirement may inspire stronger action in those that do join through a competitive element.
If the SBTi is averse to collating and reporting company progress itself, another option is for the scheme to require participants to adhere to reporting guidelines that would considerably improve the reporting practices. It is recommended that companies indicate where their target progress will be reported (for most this is currently an annual report or an area of their website), and that in this location there exists, grouped together and signposted as, SBT metrics:
A clear stating of the current target(s). The units used should avoid any ambiguity.
Annual results reported in the same metric as the target(s) from the baseline year of the target to the most recent year available. This should not exist only as a chart, but must include numerical data, which shows absolute values, not only relative changes.
If methodology or other updates occur all historic data should be revised to allow an assessment of target progress.
Optionally, an indication of progress against a planned trajectory (here a chart would be acceptable).
It is assumed that any company which is seriously participating in the SBTi would already be recording this data internally to monitor progress and so there is no additional burden on the companies in collecting data. Such an addition to the scheme could also have the added benefit of discouraging the setting of targets in inappropriate or less meaningful metrics. This requirement could also discourage the participation of companies who desire the reputational benefits of a science-based target, but do not intend to undertake related action.
It was unclear whether a primary objective of SBTi was to broaden or improve the quality of participation in emissions reduction activities, but as a voluntary initiative there are key constraints to what is achievable. There is a limited capacity for advanced voluntary initiatives to broaden participation, given the trend for disproportionately attracting those companies already engaged in CSR activities and with the capacity to conduct emissions inventories. The significant proportion of the sample already highly graded by CDP would support that the SBTi has limited reach in widening the types of companies participating in voluntary emissions reduction activities. The SBTi’s own research found that of a sample of the world’s 70 ‘largest publicly listed corporate emitters’, only 5 had a target based in climate science [
1] (pp. 6–7), but 81% of the top 500 global companies by size had some kind of emissions reduction target as of 2014 [
1] (p. 3). From this, it can be seen that since most major companies have emissions targets in place, the SBTi’s most valuable role comes in converting these targets to be consistent with the climate science consensus. In April 2020, the initiative announced the development of a streamlined target-setting route for small- and mid-sized companies (SMEs) [
39]. At a surface level, this intent to broaden participation by overcoming resource, technical skills and other capacity constraints in businesses with under 500 employees is a key advance, since such companies could cumulatively pose a significant source of emissions. However, at the time of writing, this is yet to lead to significant numbers of SMEs engaging with the SBTi. Additionally, the companies currently involved are dominated by those based in Europe (see
Supplementary Materials Section S1.3). Therefore, in widening the reach of the scheme, more geographic diversity should be sought.
6. Areas for Future Research
Although beyond the scope of the current analysis, there are a number of research questions which would contribute towards the ongoing evaluation of the effectiveness of the SBTi, in itself and as a framework for voluntary action. Re-evaluation of the sample companies on a longitudinal basis would be valuable in assessing progress, particularly after the new 1.5 °C SBTi target-setting criteria have been more widely adopted. This would also allow comparative analysis of the performance and ambition of new entrants against existing participants.
Building on this largely quantitative analysis, there is also scope for qualitative work in this area. Further research could identify the reasons companies give for participating in the initiative and whether this has changed their practices, in order to better understand corporate motivations. This could valuably be carried out using a case study and interview-based approach. Many of the companies within the sample either represented the parent group of a number of subsidiaries, or were themselves subsidiaries. Another area of qualitative interest could be in the processes of target setting within conglomerates, and whether top-down frameworks with cascading targets are imposed, or if there is independence in each of the subsidiary groups to account for diverse regional operations.
The extent to which targets cover the largest sources and scopes of the company’s emissions would also be a valuable question for further research. For instance, the largest proportion of a company’s emissions may be Scope 3, but their primary SBT may only address scopes 1 and 2. This would require extensive secondary analysis, which was not in the initial remit of this study. Indexed data on company performance against sector and regional averages would also allow more nuanced comparison of progress, but at present this data is currently limited and not readily accessible.
A key area for future analysis would be in how targets align with pre-existing national commitments. The majority of companies signed up to the SBTi are located in wealthy Annex I nations, to whom the principle of common but differentiated responsibility and respective capacity (CBDR&RC) demands a higher level of ambition compared with the global average. Given that many SBTi targets are set using the global IEA 2017 Energy Technology Perspectives scenarios, for firms located in Annex I nations, targets aligned with these scenarios are unlikely to be consistent with national responsibilities for mitigation as defined by the Paris Agreement or recently strengthened Nationally Determined Contributions. For an SBT to be considered as aligned with 1.5 °C, an annual decarbonisation rate of 4.2% must be achieved [
29]. This is significantly lower than some assessments of the required decarbonisation rates of Annex 1 countries, under the ‘CBDR&RC’ principle in the Paris Agreement [
40]. Assessing whether company commitments are behind or beyond the level of ambition established in national mitigation frameworks would help to clarify whether appropriate levels of responsibility are being shared internationally, and how the company commitments contribute to global mitigation when aggregated.
This raises a further question regarding whether corporate voluntary initiatives, such as the SBTi, displace or discourage direct government action towards achieving national mitigation targets. Literature exploring voluntary environmental initiatives has questioned the extent that firms pre-empt government regulation with less-costly voluntary action, aiming to discourage government action [
41]. The limitations of the SBTi highlighted in this paper should prompt further research exploring how the SBTi interacts with government policy making to mitigate corporate GHG emissions.
7. Conclusions
This review of the progress of early adopters in meeting their SBT has shown that the majority of targets assessed are on track at the current rate of progress, with 21% of targets already achieved and only 23% of companies behind on all targets (see
Figure 5).
Target achievement did appear to be influenced by the choice of target scope, although not of target metric. We find a statistically significant difference in progress between those targets including Scope 3 and those for Scope 1 and/or 2 only (see
Table 3), suggesting that target progress is somewhat dependent on target design and that companies may have less control over emissions for which they are only indirectly responsible. This is also reflected in the number of companies setting a qualitative target to address Scope 3 emissions. However, we found no statistically significant difference in the progress of companies employing intensity based as opposed to absolute target metrics. Of those targets that had already been achieved, many were short term. This questions whether target achievement is a function of strong action or weak ambition, and whether participation in the SBTi has driven the reductions or whether the reductions were incidental to participation. It is difficult to attribute emissions reductions to involvement in the SBTi since there is no counterfactual evidence. It was also found that targets that had been achieved made use of an earlier baseline year, potentially rewarding historic emissions reductions and suggesting that the choice of baseline year could be a significant determinant of target progress.
Regardless of the quantifiable effectiveness debate around the SBTi, the initiative has a key agenda-setting role in its development of a context-based target-setting methodology. However, it is arguable that, without a mandatory reporting component, the initiative does not represent a substantive tool for achieving these greater levels of ambition, and poses no penalties for lack of progress against a target. Reporting practices across the companies assessed were highly variable and often of poor quality. Integrating a robust reporting requirement to the SBTi could improve transparency, consistency, and confidence in the validity of corporate involvement in such voluntary schemes. It could also improve the comparability of targets and facilitate more accurate assessments of progress.
Although it is possible that a reporting dimension could discourage current and potential participants, we argue that any company substantively interested in committing to emissions reductions would already be recording such data internally. Therefore, a stronger, standardised reporting process would pose no significant additional administrative burden to involvement. We identify that reporting target progress could be improved in several ways, for instance by requiring participants to conform to reporting guidelines and/or clearly stating where they will be reporting progress. Linear progress against the stated targets was a key assumption of our analysis, and therefore companies should indicate where their planned trajectory of reductions is expected to be non-linear. Standardisation of the target-setting process, for instance in requiring the use of a particular baseline year, would similarly level the playing field in terms of the relative ambition of commitments.
Whilst the initiative sets a high level of ambition for companies, it does raise the question of whether involvement in the SBTi could defer or delay action on the part of national governments with regards to corporate emissions. Voluntary action is often viewed as a form of anticipatory action against future regulation. As previously highlighted, the majority of participating companies are located in jurisdictions (i.e., Europe and North America) which under the principle of common but differentiated responsibility should be acting further and faster to reduce their emissions. This raises the question of whether corporate voluntary initiatives such as the SBTi displace the incentive for national governments to regulate business emissions and whether the SBTi only drives the minimal level of ambition. Such questions could valuably be addressed by further research.
As the scheme grows, more companies participate, and the time series of available data increases, it may be possible to perform additional longitudinal analysis. In providing access to the dataset underpinning this work, we encourage other researchers to build on this contribution as future data becomes available. There is also scope for further qualitative work in identifying motives for participation, and whether this has changed corporate practice.
This analysis has highlighted that whilst most SBTs are indeed ‘on target’, this is, to an extent, subject to the design of the target in question (i.e., scope and base year). Standardising a target-setting process could improve the comparability of the commitments made. Similarly, integrating a reporting requirement to the initiative could improve effectiveness and signal that the commitments made are ‘substantive’ rather than ‘symbolic’ [
7]. This would enhance the critical role of the SBTi in aligning corporate carbon reduction with action towards global decarbonisation.


