Article

Community Perception and Communication of Volcanic Risk from the Cotopaxi Volcano in Latacunga, Ecuador

by
Juan Camilo Gomez-Zapata
1,2,*,
Cristhian Parrado
3,
Theresa Frimberger
4,
Fernando Barragán-Ochoa
5,6,
Fabio Brill
7,8,
Kerstin Büche
9,
Michael Krautblatter
4,
Michael Langbein
10,
Massimiliano Pittore
1,11,
Hugo Rosero-Velásquez
12,
Elisabeth Schoepfer
10,
Harald Spahn
13 and
Camilo Zapata-Tapia
14,15
1
Seismic Hazard and Risk Dynamics, Helmholtz Centre Potsdam GFZ German Research Centre for Geosciences, 14473 Potsdam, Germany
2
Institute for Geosciences, University of Potsdam, 14469 Potsdam, Germany
3
Grupo FARO, Quito 170518, Ecuador
4
Landslide Research Group, Technical University of Munich, 80333 Munich, Germany
5
Asociación de Profesionales de Gestión de Riesgos de Ecuador, Quito 170519, Ecuador
6
Instituto de Altos Estudios Nacionales, Quito 170135, Ecuador
7
Hydrology, Helmholtz Centre Potsdam GFZ German Research Centre for Geosciences, 14473 Potsdam, Germany
8
Institute for Environmental Science and Geography, University of Potsdam, 14476 Potsdam-Golm, Germany
9
Geomer GmbH, 69126 Heidelberg, Germany
10
German Remote Sensing Data Center (DFD), German Aerospace Center (DLR), 82234 Oberpfaffenhofen, Germany
11
EURAC Research, 39100 Bolzano, Italy
12
Engineering Risk Analysis Group, Technical University of Munich, 80333 Munich, Germany
13
Independent Consultant, 26689 Apen, Germany
14
College of Social Sciences and Humanities, Universidad San Francisco de Quito, Quito 170901, Ecuador
15
GADPC, Gobierno Autónomo Descentralizado Provincial de Cotopaxi, Latacunga 050101, Ecuador
*
Author to whom correspondence should be addressed.
Sustainability 2021, 13(4), 1714; https://doi.org/10.3390/su13041714
Submission received: 31 December 2020 / Revised: 29 January 2021 / Accepted: 1 February 2021 / Published: 5 February 2021
(This article belongs to the Special Issue Risk-Informed Sustainable Development in the Rural Tropics)

Abstract

:
The inhabitants of Latacunga living in the surrounding of the Cotopaxi volcano (Ecuador) are exposed to several hazards and related disasters. After the last 2015 volcanic eruption, it became evident once again how important it is for the exposed population to understand their own social, physical, and systemic vulnerability. Effective risk communication is essential before the occurrence of a volcanic crisis. This study integrates quantitative risk and semi-quantitative social risk perceptions, aiming for risk-informed communities. We present the use of the RIESGOS demonstrator for interactive exploration and visualisation of risk scenarios. The development of this demonstrator through an iterative process with the local experts and potential end-users increases both the quality of the technical tool as well as its practical applicability. Moreover, the community risk perception in a focused area was investigated through online and field surveys. Geo-located interviews are used to map the social perception of volcanic risk factors. Scenario-based outcomes from quantitative risk assessment obtained by the RIESGOS demonstrator are compared with the semi-quantitative risk perceptions. We have found that further efforts are required to provide the exposed communities with a better understanding of the concepts of hazard scenario and intensity.

1. Introduction

An active volcanic environment is prone to produce cascading and compound natural hazards. Cascading hazards comprise a primary hazard triggering a secondary one [1], whilst compound hazards refer to events (not necessary interdependent) events whose spatiotemporal footprints overlap (i.e., they occur almost simultaneously and affect the same or neighbouring locations) [2]. For instance, increasing volcanic activity can occur in company with seismic activity and continuous gas emissions and lightning and ultimately trigger lava flow, pyroclastic density currents, tephra (including volcanic ash and ballistics), debris avalanches (sector collapse), tsunami (for submarine volcanoes or at the seaside), and lahars [3]. Syneruptive lahars (also called primary lahars) can happen due to glacier melting during a volcanic eruption, whilst secondary lahars are commonly triggered by heavy rainfalls [4,5]. The forecast of cascading and/or compound volcanic hazards is very diverse and with time dependencies. Models are heavily tailored towards the specific volcanic system [6]. To explore the possible consequences before the actual occurrence of the events, risk scenarios are instrumental for risk communication practises. A risk scenario, as stated in [7], is considered as a situation picture in which a hazardous event with a certain probability would occur and cause some damage. The appropriate communication of risk scenarios can ultimately contribute to territory planning, response planning, design of evacuation routes, and enhancing overall preparedness.
Consequences of volcanic events can be severe, especially when the affected community is not well prepared. One of the most widely known examples of physical damage on assets and human losses due to a lack of effective risk communication occurred during the 1985 eruption of Nevado del Ruiz volcano in Colombia, during which 25,000 people died due to primary lahars [8,9,10]. However, volcanoes do not only affect the communities in their proximities, but have also generated systemic infrastructure failures and cascading effects (cascading effects can be defined as the disruptions consequent upon the preceding event that can have an acting large-scale across sectoral boundaries [11]) on a large-scale. A clear example of this type of effect occurred during the eruption of the Eyjafjallajökull volcano in Iceland. During two months in 2010, about 100,000 flights between Europe and North America were cancelled due to the sustained ash emission, causing more than $1.7 billion losses in lost revenues for airlines [12]. A further example of volcanic multi-hazard risk is the 2018 eruption of the Anak Krakatau volcano in Indonesia, which induced its own flank collapse, triggering a tsunami that resulted in the death of 430 people mostly in the western area of Java Island [13]. A tsunami threat from the Krakatau volcano was not unknown, since a similar historical event happened in 1883. However, it was not taken up in a broader discussion on how to deal with such a risk scenario [14].
Monitoring of volcanic activity has been significantly improved in recent years through denser and more widespread networks [15,16]. Moreover, there have been increasing research activities on the interaction between volcanic hazards (e.g., [17,18]). However, the impacts caused by volcanic hazards are rarely assessed in a comprehensive manner due to the lack of worldwide unified exposure models [19] and the scarce damage data collection on the exposed assets needed to constrain vulnerability models [6]. These difficulties are even more pronounced in a multi-risk context, where there is still a gap in the investigation of the interactions at the vulnerability level [20]. Hence, only a few examples of quantitative damage assessment have been reported in the scientific literature (e.g., [21,22]). Furthermore, there is a lack of tools for simulating representative volcanic scenarios in order to analyse the extent and spatial distribution of the expected consequences, needed for decision making and planning. Therefore, scenario-based approaches for a volcanic multi-hazard risk environment are not always available or might not be effectively communicated to the exposed communities before the occurrence of a volcanic crisis [23]. On the one hand, setting up these methods in a consistent scenario-based approach is a challenging task on its own. On the other hand, effectively communicating the potential direct damages and losses and the associated likely disruptions of critical infrastructure is also a daunting task, which in turn depends on the availability of scenario-based risk outcomes.
Rural communities of economically developing countries are particularly prone to encounter more difficulties throughout every single step of the multi-hazard risk chain (e.g., [24,25]). The social vulnerability perception of rural inhabitants might not be always taken into consideration by the local planners, partially due to their remoteness, i.e., typical large distances from the main urban centres [26], or socio-economic factors such as their alphabetization level [27], poor access to information systems, or even the basic lack of knowledge of what potential hazards may impact their communities [28]. These characteristics are common in areas exposed to volcanic hazards. In 2015, roughly 415 million people, most of them located in rural areas, lived within a 100 km radius from the 220 active volcanoes listed in the NOAA Significant Volcanic Eruption Database [29]. Hence, rural communities worldwide are more prone to suffer damaging effects from volcanic eruptions [30]. These consequences are not only expected to impact individual components such as buildings [31] and agricultural fields [32], but also critical infrastructure (e.g., power networks, roads, and water supply systems) for which the evaluation of systemic vulnerability is also required (e.g., [33,34]).
Cascading effects may further drastically change the health quality, as well as economic and social activities of the exposed communities [35]. For example, the continuous emissions of volcanic ashes can interrupt agro-industrial activities, which are the most typical source of income of rural communities [36]. These communities may also experience low serviceability of lifeline networks [37] and/or suffer from physical isolation from neighbouring communities, e.g., due to damaged bridges. Only in a few cases, the cascading effects due to volcanic eruptions have been analysed in a systematic manner [38]. Therefore, there is an urgent need to effectively communicate the scientific results of a volcanic risk assessment while simultaneously addressing the social perception and understandings, by the exposed communities, of different risk factors [39]. As stated in [40], clear risk communication in all the components of a multi-risk chain (i.e., hazards, exposure, and physical and systemic vulnerabilities) with the directly exposed communities, local decision-makers, and planners is fundamental to construct more resilient communities.
Although community participation is considered an essential component of effective resilience planning to natural hazard-risks [41,42], only in recent years some studies have integrated scientific approaches with the active participation of the community, local planners, decision-makers, and actors of the civil society (e.g., [43,44,45,46,47]). The specific community perceptions of vulnerability and risk related to volcanic hazards have been investigated in former works (e.g., [48,49,50,51]) through “top-down” approaches. In [52], it has been suggested that scientists should have a transversal role and a stronger presence in the communication of volcanic hazards and risks from “bottom-up” approaches. To the best of the authors’ knowledge, these practices have been documented in a few works for rural communities (i.e., [53,54]). Hence, we realise that there is still significant work to be carried out to strengthen the risk-informed communities exposed to volcanic hazards. With this background, we present throughout this work an integrative framework between scientific approaches that study the possible damaging effects from volcanic scenarios with the local knowledge and social risk perceptions. The study area of Latacunga, capital of the Cotopaxi province in Ecuador, with mainly rurally composed communities, and exposed to the Cotopaxi volcano has been investigated in order to enhance a risk-informed community and awareness and contribute to increasing their resilience.

2. Framework and Objectives

Volcanic eruptions pose an enormous risk to Ecuador, because most of the exposed human settlements in the central and northern highlands are situated less than 25 km from an active volcano. Cities previously affected by volcanic eruptions include Quito, Latacunga, Salcedo, Cayambe, Ibarra-Otavalo, Ambato, Riobamba, and Baños [55]. Lahars have been among the deadliest volcanic hazards, but the emission of volcanic ash has been more frequent in the Ecuadorian Andes [56]. Ash falls do not only have direct consequences on the inhabitants’ health and on the exposed infrastructure, but also on agriculture and animal husbandry, which is particularly important for the rural communities in Ecuador. Ash falls have hit the rural communities settled in the vicinity of the most active Ecuadorian volcanoes (i.e., Tungurahua, Reventador, Sangay, and Cotopaxi). Moreover, poverty, marginality, and high inequality of the exposed communities coexist with their physical and systemic vulnerabilities [57].

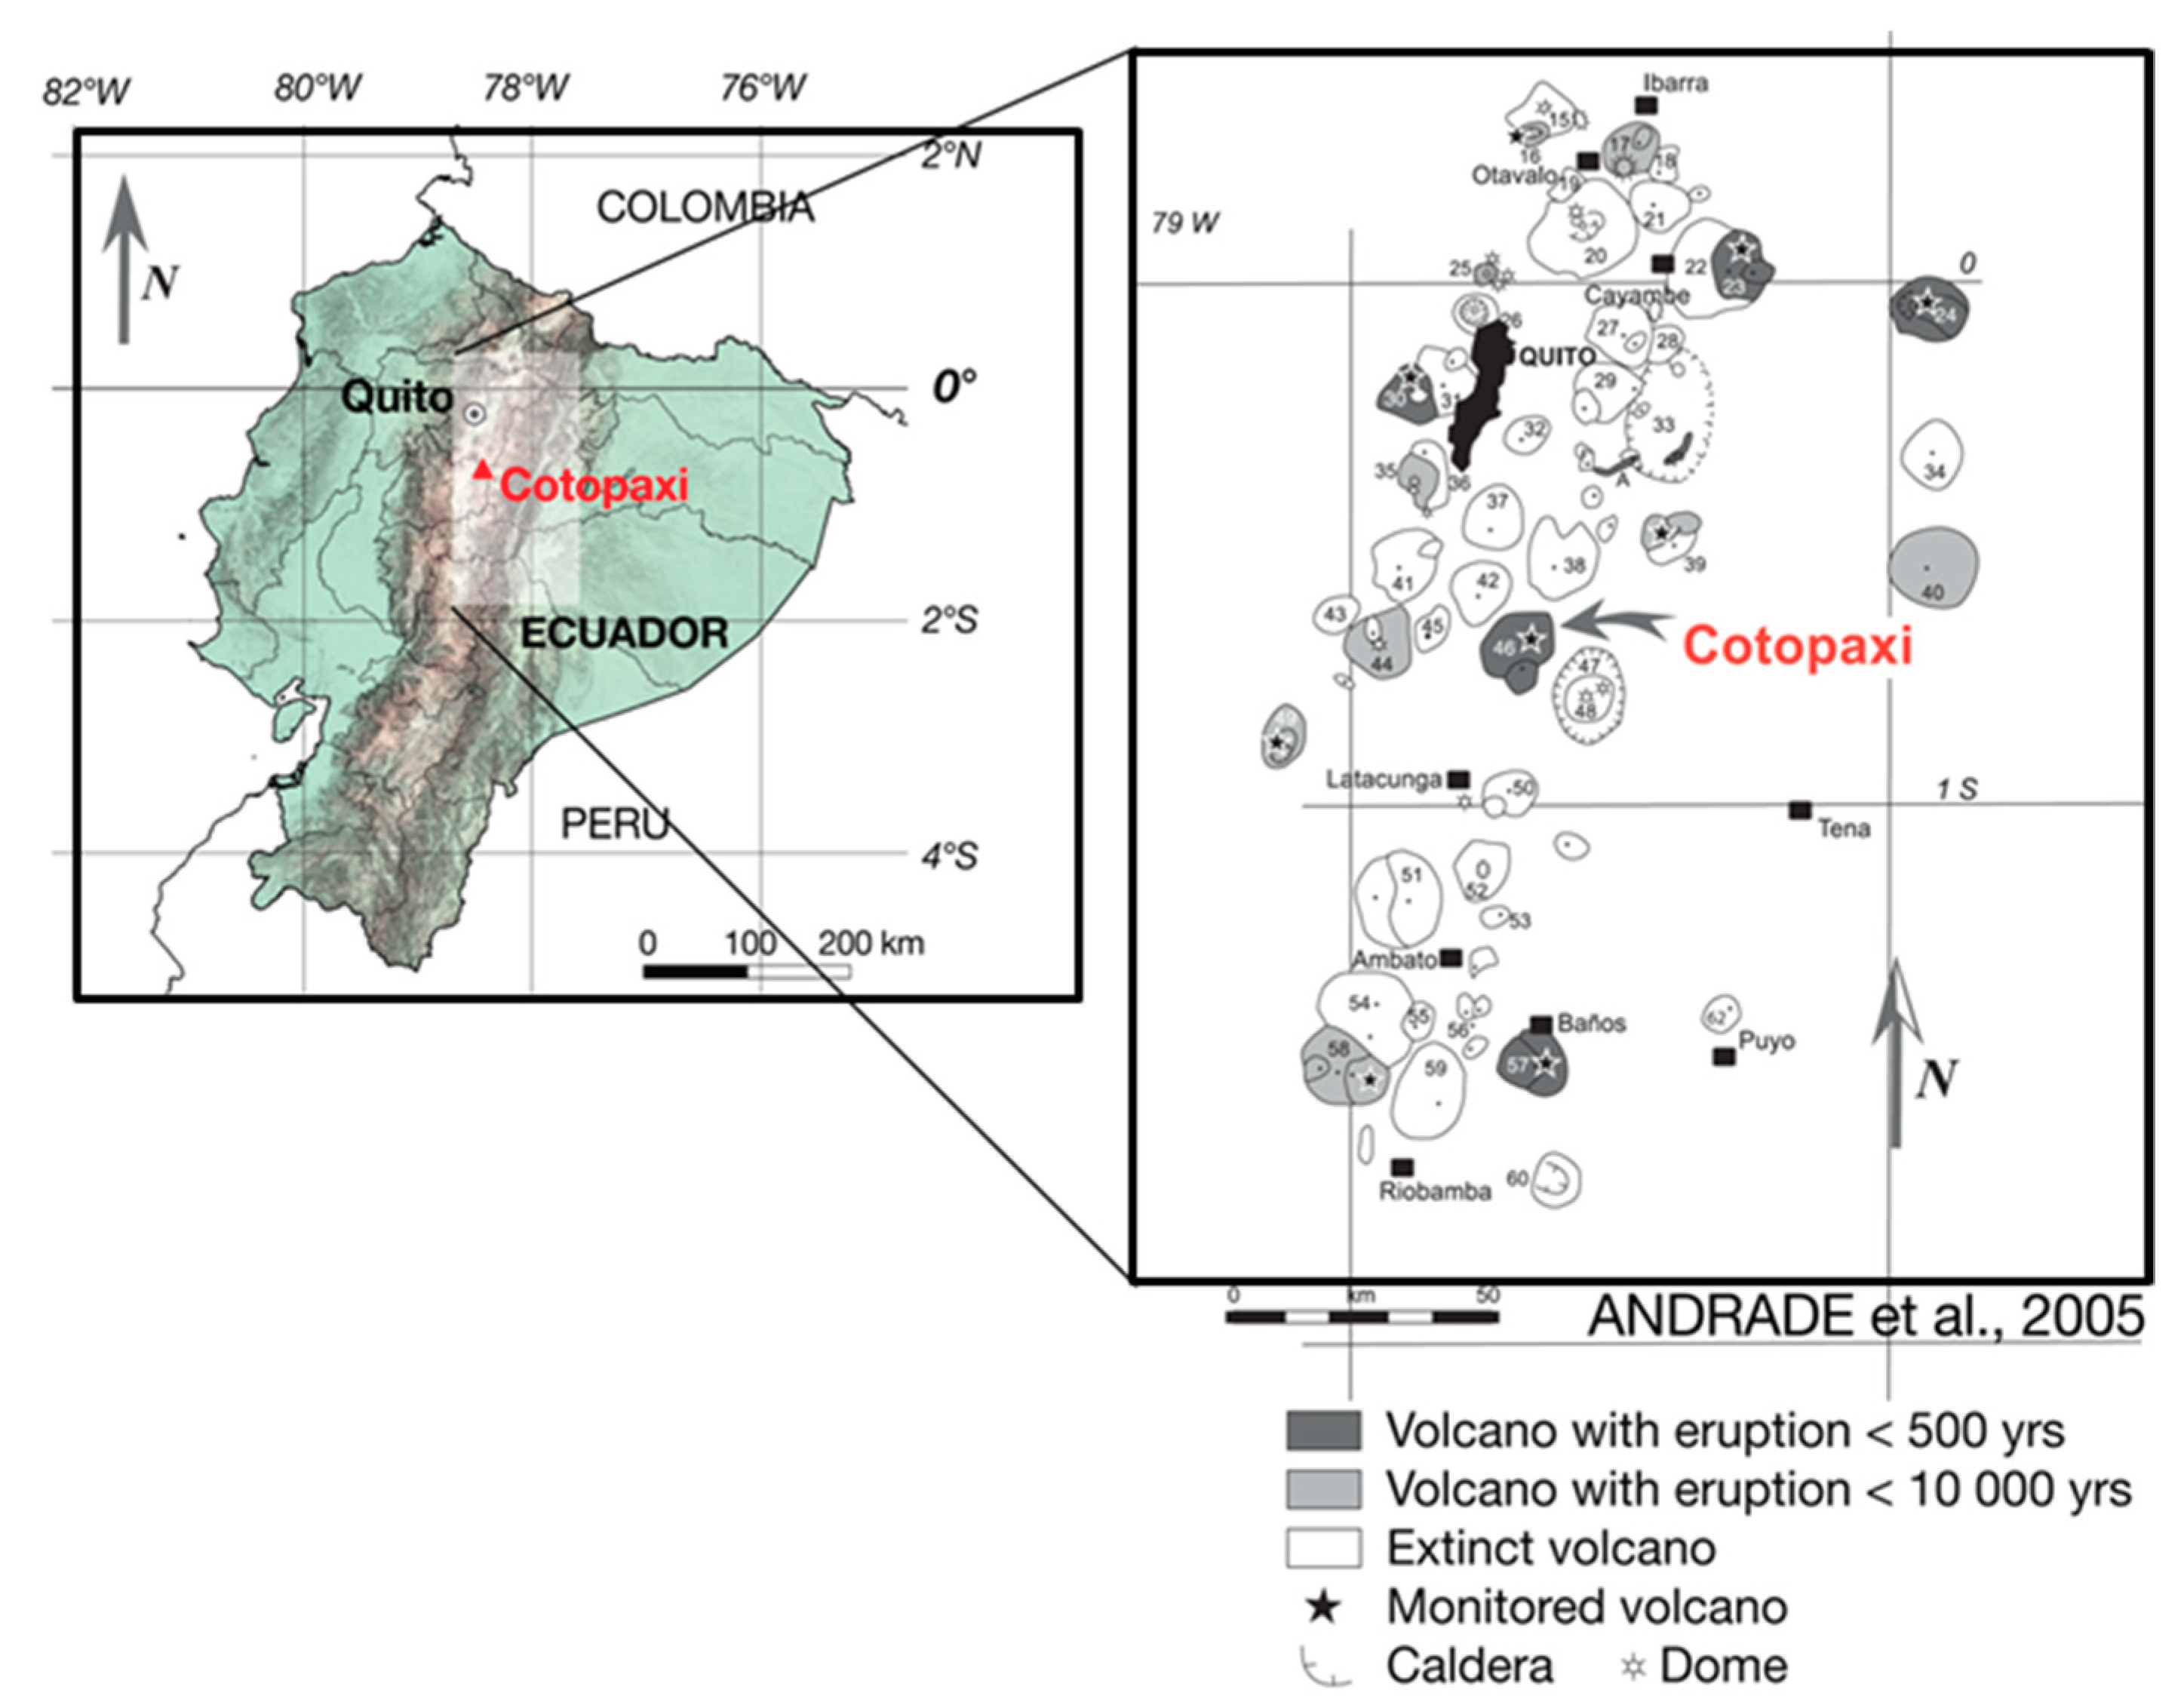
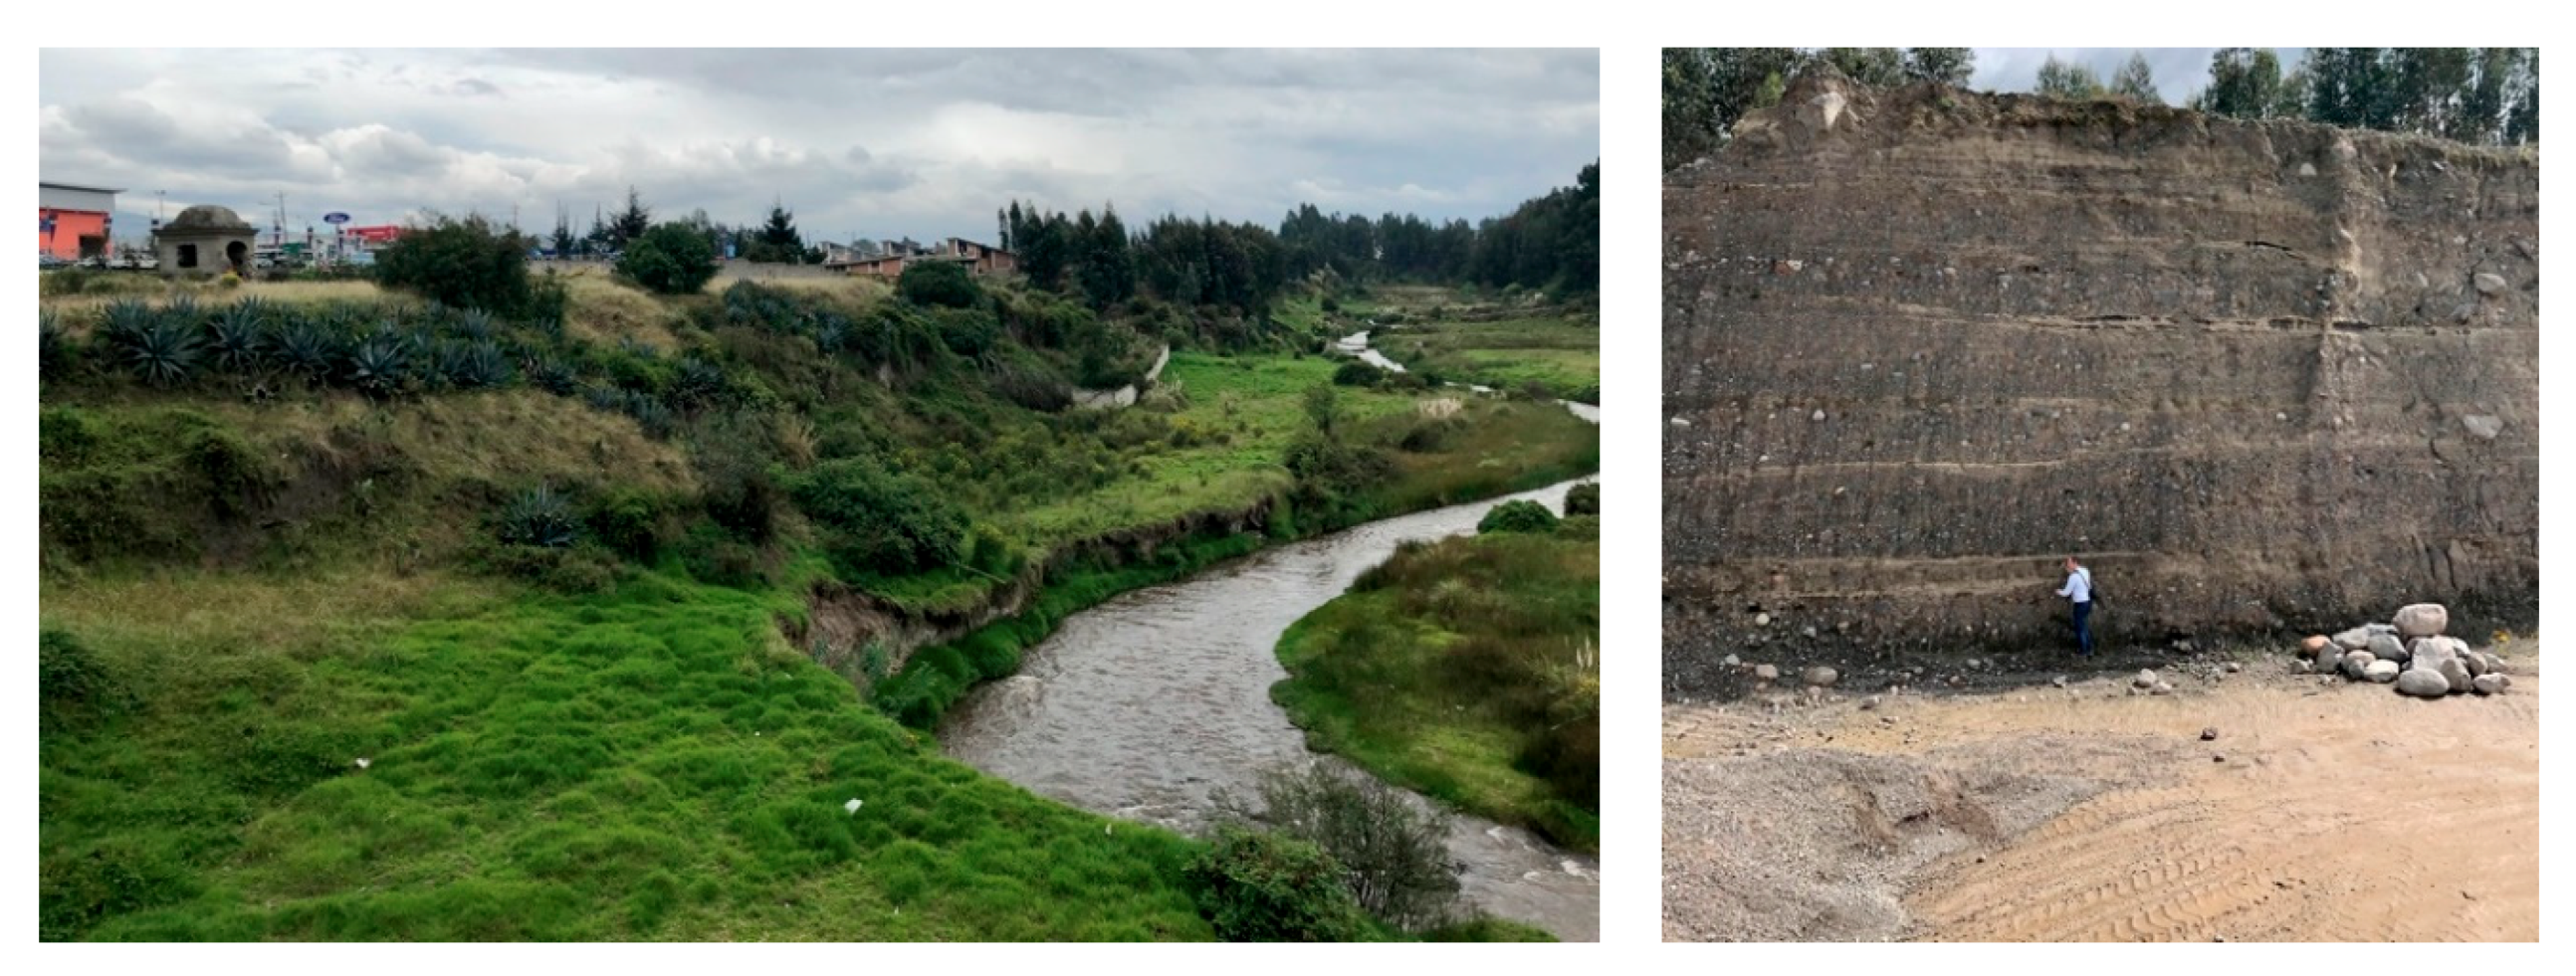
2.1. Description of the Study Area

The Cotopaxi volcano is an active stratovolcano (5897 m.a.s.l) located in the Cordillera Real of the Ecuadorian Andes (Figure 1) and is covered by an extensive, but diminishing glacier cap. Cotopaxi is one of the most dangerous volcanoes worldwide [58] with average recurrence intervals for eruptions between 117–147 years [59]. It can produce syneruptive lahars triggered by explosive eruptions, which can travel hundreds of kilometres [60]. Three drainage systems originate on Cotopaxi (Figure 2), which have all been inundated by lahars in prehistoric times [61]. However, only the northern and southern drainage systems are densely populated: The largest urban agglomeration encountered by the northern system is “El Valle de Los Chillos” (with about 400,000 inhabitants) in the vicinity of southern Quito, whilst the southern drainage system encounters the Latacunga canton (with about 300,000 inhabitants). The last major eruption of the Cotopaxi volcano in the historical records occurred in 1877. It induced syneruptive lahars that severely affected the proximal rural communities [62], with more than 1000 deaths registered, and caused a severe economic crisis [63]. If a similar scenario occurred nowadays, the social and economic consequences would be far more catastrophic due to the high population density and the central importance of Latacunga and the Cotopaxi region for the economic development of the country [58].
Latacunga is the largest city of the Latacunga canton (second Ecuadorian administrative division) and it is the capital of the Cotopaxi province (first division). It is located at a 14 km distance from the Cotopaxi volcano. For the year 2020, and based on the population projections of the National Institute of Statistics and Censuses [65], the city has an inferred population of approximately 205,600 inhabitants, with a major rural composition (59.8%). The last peak of volcanic activity of the Cotopaxi volcano occurred in mid-April 2015 and lead to a crisis in risk management in Latacunga and neighbouring municipalities [66]. Firstly, an increase in the seismic activity of the volcano was accompanied by the emission of sulphur dioxide and ash fall for some weeks [56]. Subsequently, authorities and local press communicated to the inhabitants of the communities in the vicinity of the Cotopaxi volcano that it was necessary to evacuate their homes promptly due to the imminent occurrence of lahars [66]. This generated social chaos due to the ignorance of the evacuation routes, the uncontrolled behaviour of the citizens (due to generalised fear of looting), as well as a very low level of trust in government representatives [67]. Eventually, the 2015 activity never surpassed a magnitude VEI 2 and no large syneruptive lahar flows occurred [68]. The lesson learned from this experience was the need for adequate evacuation protocols and local authorities with an understanding of the complexity of the risk in the area. Moreover, it was realized how important it is for citizens to understand their own social, physical, and systemic vulnerability [68].
Latacunga is settled on ancient and recent geological materials formed by volcanic material. Some of the most representative and better-exposed stratigraphic formations of ancient ashes and lahar deposits originated from the previous volcanic activity of the Cotopaxi volcano were visited (Figure 3) with the guidance of experts from the Geophysical Institute of the National Polytechnic School (IG-EPN (Instituto Geofísico de la Escuela Politécnica Nacional (Quito, Ecuador))) and the Decentralized Autonomous Government of the Province of Cotopaxi (GADPC (GADPC, Gobierno Autónomo Descentralizado Provincial de Cotopaxi, Latacunga, Ecuador)). Some of these deposits are from pre-historical times, whilst the shallower ones date from the 1877 event that destroyed Latacunga [70]. Official maps of the Geological and Energy Research Institute (IIGE) and IG-EPN [71] were used during the field reconnaissance. This field trip was relevant to visualize the geological characteristics of the study area, as well as to strengthen the cooperation and idea exchanges with the local experts.
Latacunga is not only exposed to the natural hazards imposed by the Cotopaxi volcano, but also to other geodynamic (e.g., landslides and earthquakes) and hydro-climatologic hazards (e.g., frosts and droughts). As reported in [72], there has been an intensification in the variability of precipitations, droughts, and frosts in Latacunga. This has been evidenced in the period between the years 1981–2014, during which the average air temperature has increased about 0.8 °C. These ongoing phenomena related to climate change have generated negative consequences mainly in the rural area and in agriculture areas [72].

2.2. Objectives

The understanding of disaster risk based on the independent investigation of their dimensions, hazards, exposure, and vulnerability, guided by a multi-hazard risk approach with risk-informed decision-makers, is the key advice of the Sendai Framework for Disaster Risk reduction (2015–2030) [73]. Having in mind the aforementioned limitations on volcanic risk assessment as well as the lack of exploration tools for risk communication, two initiatives, namely the programme “Sustainable Intermediate Cities—CIS” and the research project “Multi-Risk Analysis and Information System Components for the Andes Region—RIESGOS” have been working in Latacunga, Ecuador, with the aim of increasing awareness and preparedness and enhancing the coping capacities of the communities exposed to the Cotopaxi volcano. The particular objectives of this integrative study are:
  • Presenting a comprehensive risk communication process, from scenario-based volcanic risk analysis along with active participation of the exposed communities, while also investigating the risk perception of the exposed communities.
  • Providing a recent measurement of spatially distributed risk perception in the Cotopaxi area (results from the CIS questionnaire)
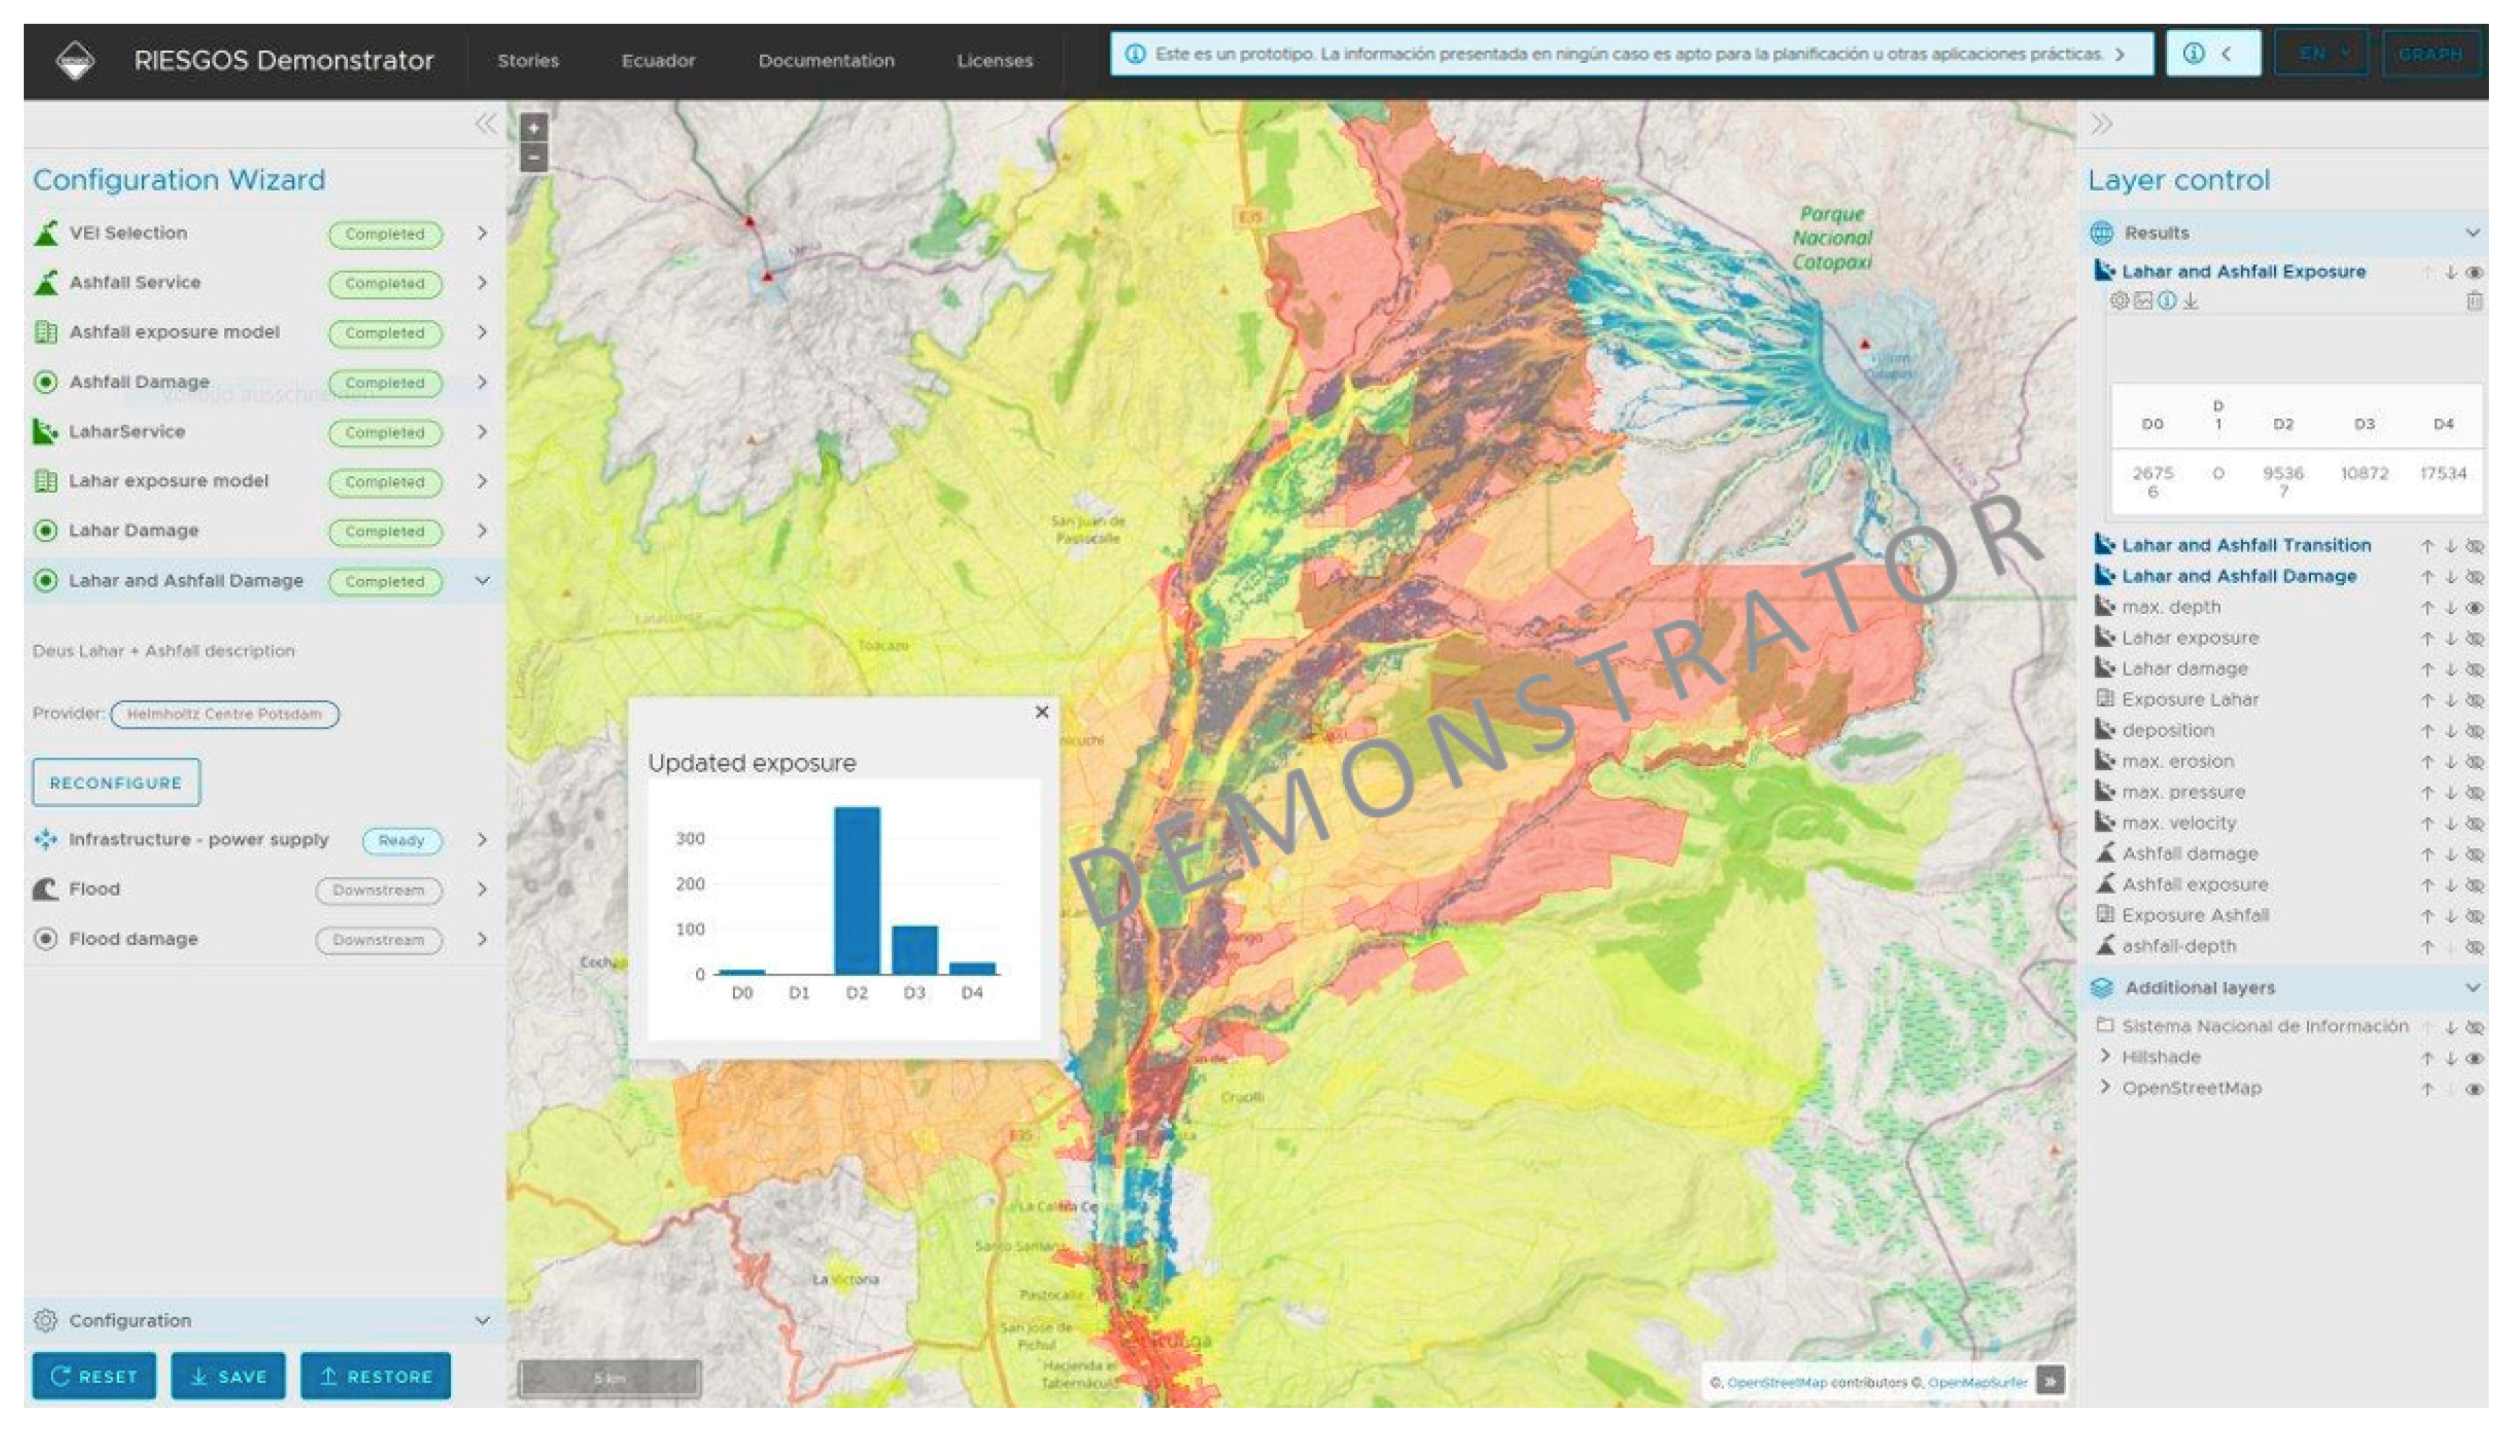
  • Testing the applicability of the RIESGOS demonstrator, a decentralized web-service architecture that allows for integrating local expert knowledge and locally designed models in a scenario-based multi-risk analysis, for the purpose of interactive communication
  • Merging the results of 2 and 3 to investigate how well the simulated quantitative risk matches the subjectively perceived risk in a common area.

3. Materials and Methods

An integrative framework between scientific approaches and risk communication practices with the exposed society has been set up in Latacunga (Ecuador) by two different initiatives, (1) the CIS (Sustainable Intermediate Cities) programme and (2) the RIESGOS project (Multi-risk analysis and information system components for the Andes region).

3.1. The CIS Programme: The Creation of a Local Laboratory to Evaluate the Social Perception of Risk and Resilience

“The Latacunga Laboratory: Risk management, resilience, and adaptation to climate change (Laboratorio Urbano de Latacunga: Gestión de riesgos, resiliencia y adaptación al cambio climático)” has been created within the CIS programme, as part of the joint initiatives of GIZ (“Deutsche Gesellschaft für Internationale Zusammenarbeit”) and Grupo FAR (Ecuadorian NGO (https://grupofaro.org/ (accessed on 1 January 2021)). The creation of so-called resilience observatories for exposed communities to natural hazards is a relatively new trend [45,74]. Similarly, the Latacunga Laboratory seeks to contribute to the risk management to natural hazards that are likely to occur in the territory, while aiming to contribute in the long-term to the development of the city embracing its urban–rural ties. With that goal, initial contributions related to social risk perceptions have been documented in [75] as a joint effort between the Latacunga Laboratory, the local government, academic institutions, and local actors.

3.1.1. Comparative Analysis of the Social Risk Perception Factors to Natural Hazards and the Spatial Distribution of Volcanic-Related Risk Factors

We conducted a survey by means of a custom-designed questionnaire, a fundamental tool for acquiring information on public knowledge of the community [76]. It is composed of a series of multiple-choice questions in Spanish. The survey was carried out in the field and online to collect data about the individual knowledge, attitudes, and risk perceptions of the inhabitants of Latacunga. The online survey was promoted on social media and was available on the official website of the CIS Latacunga Laboratory (https://latacungaresiliente.com/ (accessed on 1 January 2021)) for a month. In the meantime, the field survey was carried out only in the urban agglomeration of Latacunga. The collected data is used for two main objectives: (1) as input to perform the semi-quantitative method proposed in [77] that ranks the social perception of volcanic risk factors (i.e., hazard recurrence, exposure, vulnerability, and resilience) among other natural hazards likely to occur in the study area (i.e., earthquakes, drought, frost, floods, and landslides), and (2) to map the spatial distribution of volcano-related risk perception into comprehensive categories (i.e., easily understandable by the exposed communities).
A design of the field surveying site was carried out. According to the last official census available [65] and population projections by the survey elaboration date (September 2019), 50,442 inhabitants over the age of 18 years were considered as qualified informants. In order to get a statistically representative sample, a confidence level of 95% and a margin of error of 5% were selected. On this basis, we estimated that a sample for the field surveys not smaller than 380 inhabitants had to be selected. Considering 10% additional surveys, a final sample size of 420 people was chosen. The population density (Figure 4a) was used to constrain the spatial distribution of the field surveys within the urban blocks with a residential occupancy (Figure 4b). The surveys were carried out by 55 students of the ISTC (Instituto Superior Tecnológico Cotopaxi) in September 2019.
It is worth mentioning that, on the one hand, some drawbacks have been found when the community perception of exposure, vulnerability, and resilience are independently addressed for large-scale studies [78,79]. On the other hand, there have been also reported benefits of this separation for mapping the social risk perception to natural hazards (e.g., [80,81]) when bottom-up approaches are carried out. Therefore, we have decided to independently investigate the social perceptions towards these components through separated questions. The Likert scale is used in this context to obtain a quantifiable level of perception of each risk factor. An integer numerical score (1, 2, or 3) is assigned to every possible answer. Although the passage from a qualitative perception to an index can be questioned, several recent studies have shown the usefulness of the Likert scale [82,83,84,85,86]. Notably, in [87], it was found to provide a good compromise between the quality of the information collected and the accessibility to respondents, while the bias in responses decreases, and there is consistency across different measurements and research domains of disaster risk reduction.
Subsequently, the average is computed for every question to obtain the perception of every component. These values are inputs to the computation of the risk perception pre-index through the use of Equation (1), where P stands for “perception”. An example subset of the questions is presented in Table A1 (Appendix A). The questions and answers were validated by local risk management experts from the Association of Risk Management Professionals of Ecuador (Asociación de Profesionales de Gestión de Riesgos de Ecuador, APGR).
P ( R i s k ) = ( P ( H a z a r d ) × P ( E x p o s u r e ) × P ( V u l n e r a b i l i t y ) P ( R e s i l i e n c e ) )
The numerator of Equation (1) can have a maximum possible value of 27, whilst the minimum for the resilience term in the denominator is 1. Therefore the maximum risk perception value that this method admits is 27. The values in the range from 1–27 form a “pre-index”. To obtain a more comprehensive numerical value, a “reduced index” in the 0–3 range is obtained through the application of Equation (2).
R e d u c e d   i n d e x = l o g 3 ( p r e i n d e x   v a l u e )
The relations between the “pre-index” and the “reduced index” is shown in Figure 5. For mapping purposes an “equal interval” classification for the reduced index scale is introduced with five classes of length 0.6 for finally presenting the spatialized perception of every risk factor in a compressive manner to the community. The calculated results for every answered question at each survey location (Figure 4b) are used to map the spatial distribution of the perception of hazard recurrence, exposure, vulnerability and resilience, and the risk index (computed with Equation (1). Subsequently, they were interpolated through the use of the ordinary kriging geostatistical algorithm [88].

3.2. The RIESGOS Project: Iterative Simulation Improvement and Enhanced Communication

The idea of constructing a web-tool, the RIESGOS demonstrator, as a decentralised and intraoperative environment for the exploration of the consequences in Latacunga from different volcanic hazard scenarios was proposed to the local stakeholders who participated in four participative workshops. Two of them were held in Latacunga (7 December 2018; 25 November 2019) in the headquarters of GADPC (Decentralized Autonomous Government of the Cotopaxi Province) and two workshops took place in Quito on 11 December 2018, and on 27 November 2019, respectively. The participants ranged from research partners, representatives of the rural municipalities (parishes) of the Cotopaxi province, public authorities, environment secretaries, actors of the civil society such as local representatives of agriculture associations, and urban and rural leaders. Similarly, as recently presented in [46], the workshops were used as a means to implement a user-centred iterative approach, seeking a continuous redesign of the RIESGOS demonstrator that has been guided by the needs of potential users and practical applicability. This has been ensured by a comprehensive analysis of user requirements (e.g., open-source, user-friendly graphical user interface and transferability).

3.2.1. The RIESGOS Demonstrator Tool for Quantitative Multi-Risk Analysis

The iteratively constructed RIESGOS demonstrator for a multi-risk information system is based on a modular and scalable concept in which the different hazards, the related exposure models, and vulnerability schemas are each represented by one individual web service. These independent and distributed web-services (managed and maintained by individual research institutions) are based on the quantitative methodologies developed within the RIESGOS framework for multi-risk analysis (i.e., [69,89,90,91,92,93,94]). Therefore, their integration into the RIESGOS demonstrator simulates the multi-risk environment of Latacunga. This modular approach offers the possibility to integrate different web services into already existing system environments.
Currently, the graphical user interface of the demonstrator can be accessed from a web browser only by users with special rights. The main screen of the graphical user interface is divided into three main display areas: the central map window, the configuration wizard for the control of each web service to the left, and the results panel to the right (e.g., see Figure 6). The code of the graphical user interface (RIESGOS frontend) is openly published on GitHub (https://github.com/riesgos/dlr-riesgos-frontend (accessed on 1 January 2021)). The use of standardized web services such as geospatial web services defined by the Open Geospatial Consortium (OGC) allows users accessing open and flexible multi-risk information and data products. Web-services and exposed data resources can be accessed using a variety of means from a simple command-line tool, over a web browser, to existing graphical user interfaces of public authorities and companies, which are equipped with a map user. OGC web services allow all kinds of geospatial functionality out-of-the-box including data access, data display, styling, and processing. Web services can easily be integrated into existing clients. The providers of web services define their products, display options, and configuration items. More details of this integrative process are reported in [94]. Through the clear separation in competencies between web services and user-interface, modularity and scalability are increased.
Precomputed hazard models of ash-falls and lahars are displayed by the RIESGOS demonstrator after the selection of a scenario in terms of the expected for an eruption of the Cotopaxi volcano. Local probabilistic ashfall models for the Cotopaxi volcano generated by the IG-EPN (following the method of [95] with 20-year observation of wind flow directions) are currently integrated as twelve explorative scenarios. They are represented by isolines (Figure A1). The lahar models described in [69] are incorporated, showing the maximum possible values of five physical properties (i.e., flow velocity, flow depth, pressure, erosion, and deposition (see Figure A2).
The exposure model provides the input to calculate the direct losses over residential building portfolios classified in specific building classes for every hazard. An example for lahar-building classes is depicted in Figure A3. These models were constrained through the use of taxonomic characteristics available in the official cadastral dataset of the GADPC (Gobierno Autónomo Descentralizado Provincial de Cotopaxi, Latacunga, Ecuador), such as roof and wall materials, and the proportions of the predominant building materials suggested for Latacunga in [96]. No further details are provided on the manner the building exposure models were constructed, since this is out of the scope of this paper.
The vulnerability analysis of the typical residential buildings is performed using representative building exposure models with their respective fragility functions and suitable economical consequence models. Specifically, this approach is an extension of the Performance-Based Earthquake-Engineering (PBEE) method developed by [97], which has more recently been adapted to other kinds of natural hazards. The fragility model proposed in [98] is used in lahar fragility, whilst the one in [99] is used in ash fall fragility for typical residential buildings that can be encountered in the study area. The demonstrator ultimately obtains the spatial distribution of damage and losses per individual hazard, plus the option of obtaining the cumulative damage and losses due to the action of both hazardous events using the novel method outlined in [90]. Some examples are depicted in Figure 6 and Figure A4. No further technical details are provided, because it is out of the scope of this work. Furthermore, the demonstrator enables the visualization of the areas that might potentially get disconnected from different networks and thus the identification of cascading effects on the economic activity. The method of implementation in the systemic vulnerability analysis applied in this case is similar to the one proposed in [100]. This information can be related with census data for estimating the population that might be affected by a blackout [101]. One example of this process is depicted in Figure A5 for the interruption probabilities of the electrical power network due to the impact of a lahar.

4. Results

4.1. The Recognition of the Latacunga Local Laboratory by the Local Actors of the Community

“The Latacunga Laboratory: Risk management, resilience, and adaptation to climate change” has strengthened its presence in the territory through several continuous participative activities that are aligned with the objectives mentioned in Section 3.1. For instance, the Laboratory has been recently working in materialising initiatives that were proposed by local entrepreneurs. One of them is currently working on the recovery of “Relatos de una erupcion” (Tales of an eruption), which works on rescuing the historical memory of what happened in the eruption of the Cotopaxi volcano in 1877. This has been carried out through audio-visual stories that are told by direct descendants who survived this event. This initiative enhances co-responsibility and respect for historical memory. The oral transmission of this information is an important input to generate awareness. Details about these initiatives can be found in the Latacunga Laboratory website (https://latacungaresiliente.com/rescate-de-la-memoria-historica-de-la-erupcion-del-volcan-cotopaxi/ (accessed on 1 January 2021)).

Comparative Analysis of the Social Risk Perception Factors to Natural Hazards and the Spatial Distribution of Volcanic-Related Risk Factors

The method described in Section 3.1.1 was applied to rank the volcanic risk perception for the most densely populated area in Latacunga conurbation. Making use of the 420 processed surveys as input data, the social perception to the recurrence of hazards, exposure, vulnerability, and resilience for six natural hazards likely to occur in Latacunga (i.e., earthquakes, volcanic eruptions, droughts, frosts, landslides, and floods) has been investigated. This is presented in the form of the comparative matrix shown in Table 1, which reports the mean values (for all the surveys) related to the perception of every component, as well as the computed risk index for every considered hazard. The higher the value, the greater the perception of risk. In the case of resilience, the interpretation is the opposite: the higher the value, the higher perception of resilience after a hazardous event.
The greatest concern among the inhabitants of Latacunga is their own perceived vulnerability to volcanic hazards. Remarkably, their resilience after a volcanic event scores the lowest value. This implies the community is aware that they would have great difficulty (or impossibility) to recover from the related damages. It is worth noticing that despite the fact that in the questionnaires there was no distinction made in terms of the type of volcanic hazards (lahar, ash fall/tephra fall, or ballistics) or in terms of their intensity, the collective imaginary always tended to associate the occurrence of a destructive lahar as “the volcanic hazard”. Most likely, the oral transmission of the experiences of the survivors from the 1877 event has permeated the mental construction of their descendants.
The mean results in terms of the percentage for the answered questionnaire that makes up the field and online surveys are depicted in Table A2. Contrary to the field survey, the online surveys score large values in the basic knowledge and reconnaissance of their exposed environment (i.e., evacuation routes, emergency committee, the existence of initiatives for risk reduction). The field surveys express that 64% of the inhabitants consider the volcanic related hazards as events that are likely to happen in the city within their lifetimes. Furthermore, 86% answered that they believe an eventual eruption of the Cotopaxi volcano would cause very serious damaging effects to the city. Likewise, 75% considered they will have very serious impacts directly on their families and themselves. 25% of the population considers that recovery from a serious volcanic event would be impossible, whilst 57% think it would be difficult to overcome. Regarding knowledge, 67% of the population know safe places in the event of a possible disaster, while 61% know evacuation routes. However, only 34% ensure there are emergency plans in their neighbourhood. Half of the respondents do not even know if they live in a volcanic hazard zone. Additionally, 56% of the field-surveyed inhabitants and 69% of the online-respondents consider they would have rapid reaction capacities. Finally, ~42% of the population talks about how to act in case of emergency with their families.
Every answer of the 420 field surveys was spatially distributed onto the survey locations (Figure 4). Their associated numerical values of the Likert scale were interpolated through the use of the ordinary kriging geostatistical algorithm [88]. Subsequently, every numerical value is converted to the equivalent categories presented in Figure 5. The spatially explicit categories represent the social perception of volcanic hazard recurrence, exposure, vulnerability, and resilience in the study area. They are respectively depicted in Figure 7a–d. The former factors are integrated through Equation (1) to generate Figure 7e, which represents the semi-quantitative volcanic risk perception index proposed in [77]. In general terms, the perceptions of hazard recurrence, exposure, and vulnerability are quite similar. However, in the central–easternmost and northernmost zones, there is a high perception of hazard recurrence, a very low perception of resilience, and a moderate perception of vulnerability, whilst in the southernmost part (where the Cutuchi River flows), the four assessed factors show high and very high values that ultimately lead to a generalized “very high” category in the volcanic risk index. This is contrary to what is observed in the central–western and northern parts. Due to the increasing distances from the main drainages, there is a strong anti-correlation between the higher resilience levels (reddish areas) and the other risk factors. Hence, despite the last volcanic crisis in 2015, there is still a generalised very low perception among the inhabitants that they cannot suffer any direct impact or damaging effect after increasing volcanic activity, because they consider the occurrence of lahars (within their lifetimes) to be impossible. Clearly, the inhabitants of that sector are not aware of the large intensities the Cotopaxi volcano can achieve (e.g., a Plinian activity (VEI > 4) in Figure 2).

4.2. The Commnuication of the Scenario-Based Risk Assessment Concept with Local Stakeholders

During the four RIESGOS participative workshops, the invited stakeholders expressed interest in understanding the impacts of an extreme volcanic eruptions on the exposed elements such as buildings and critical infrastructure. Brainstorming exercises were carried out during the two first workshops. The participants were invited to imagine a future potential eruption with the emission of ash fall and occurrence of lahars. Thereafter, based on their perspectives and local knowledge, it was asked which physical, systemic, and cascading damaging effects they would expect on their built environment, infrastructure systems, and socioeconomic activities.
Some basic concepts of the probabilistic method, as an open-source web-service assesses the vulnerability of the exposed residential buildings (see Section 3.2.1), were presented to the local stakeholders. Due to the iterative approach used in constructing the demonstrator, some of the details that have been presented in this work as methods are actually the initial outputs of the first participative workshops. In this regard, the adaptability of “foreign” lahar vulnerability models (i.e., not developed for Ecuador) in the study area (e.g., [21,31,102]) was initially discussed with the representatives of the scientific local institutions. Due to the absence of locally developed ash fall vulnerability models for the residential buildings in the surroundings of the Cotopaxi volcano, the use of vulnerability models for the southern Colombian Galeras volcano [99] was perceived suitable to be implemented in the risk calculations rather than the fragility functions frequently developed for other areas (e.g., Italy [103]). With this feedback, the web-tool was redesigned. This is an example of how the engagement of local participants can improve both the technical development of quantitative methods (by agreeing on a proper model) as well as the understanding of such methods by the community.
Possible cascading effects that would occur in the case of critical infrastructure failure were debated. For instance, the participants realised that assessing the vulnerability of electric networks to ash falls and lahars is fundamental because of the further consequences on daily social and economic activities. However, the most debated topic was the reliability of the road system that, in the case of failure, may induce physical disruption and affect evacuation and emergency response during a volcanic crisis. Other public infrastructures that would be affected by Cotopaxi’s lahars include the Army headquarters “Brigada Patria”, Latacunga hospital, and the new penitentiary [58]. The interest in relocating some of the exposed assets was discussed.
“Hands-on” sessions took place during the two last workshops. The participants could experience on their own the use of the RIESGOS demonstrator. They selected different scenarios to visually compare every hazard footprint and intensity (i.e., for ash fall and lahars) as well as their associated risk outcomes on residential buildings and electric power networks. This was done through the selection of individual and successive hazard scenarios addressing cumulative damage. During the “hands-on” session, the participants recognized the potential of the demonstrator as an exploration tool for risk communication.

5. Discussion

The CIS and RIESGOS projects have independently addressed the domain of risk communication in Latacunga (Ecuador) at different geographical scales. The investigation and mapping of the perception of volcanic risk factors led by the Latacunga Laboratory (created by CIS) was carried out in a focused area (urban area) due to the necessity of having control points (where field-surveys were carried out) for a further geostatistical interpolation process, whilst, in the framework of the RIESGOS project, the construction of the hazard, exposure, and vulnerability approaches for scenario-based multi-risk calculations have been carried out at the canton level. Despite that, the community perceptions of the entire canton and province can be assessed in the future through field surveys for other urban centres (e.g., Pujili, Saquisili, and Salcedo), a meaningful spatially explicit perception of volcanic risk factors could only be mapped for the urban centres. This is because, due to the scattered location of the residential buildings in the rural areas, conventional geostatistical interpolation algorithms would carry significant bias in the results. For the commonly investigated area by RIESGOS and CIS, we can see that the exposed community recognise that they are under a variable level of risk regarding volcanic events depending on their location. These perceptions match the lahar footprints from the scenarios with higher probabilities of occurrence (VEI < 3). However, for larger intensities, (e.g., lahar footprints from a VEI > 4 scenario, see Figure 2b), we observe a mismatch with the spatially explicit community perceptions of volcanic risk factors (Figure 7). For instance, the easternmost areas of the urban centre of Latacunga show low and very low reconnaissance of volcanic risk factors due to their increasing distance respect to the main drainages. The inhabitants of that particular sector have perceived as impossible the occurrence of and suffering from consequences of lahars. The ignorance of the lahar footprints expected from these large intensity scenarios means that the concepts of “safe place” and evacuation routes are not applicable for either. These results should not be interpreted as fixed or permanent, but they rather constitute a temporal reading of the collective mental construction of the inhabitants at the time the surveys were carried out. Nevertheless, considering that the community is placed in ancient lahar deposits, as well as the relatively short time since the last 2015 volcanic crisis, one can realise that from the comparison of the respective outcomes arises the need to prioritize some zones where further divulgation activities should be made in the future regarding the possible scenarios and intensities that the Cotopaxi volcano can actually produce.
The formulated questions comprised in the survey forms are locally revised by experts from the APGR while paying attention to the use of collectively known terminology and the cultural characteristics of the community. In this work, we have implemented a simple numerical expression (Equation (1)) that equally ranks the risks factors of the different volcanic risk factors. This selection carries epistemic uncertainties. For instance, a customisation weighting schema to each factor, the selection of the median or mode instead of the mean value (herein adopted), together with a broader range in the Likert scale (e.g., 1 to 7 as explored in [104]) could be alternative approaches to be compared or even integrating each other into condition trees as proposed in [105]. The selection of the Likert scale to rank the answers and ultimately map the community perceptions implied an ordinal scale that was further converted into a nominal one based on the “equal-scale” (Equation (2)). This decision was made because, since the methods and results are aimed to be divulged, the categories have been found to be comprehensive, easily understandable, and culturally accepted by the community. Although the Likert scale has been extensively and recently used to successfully assess the community perception (e.g., [82,83,84,85,86]), there are several limitations in its adoption. For instance, as stated in [87], this kind of scale, despite maximizing the reliability of answers, also sacrifices the level of detail. However, it should be noted that through the simple possible answers related to the vulnerability perception and the nominal categories, we are only proposing a very simple categorization. More robust approaches that have addressed spatial multi-criteria analysis (as presented in [106]) have shown the impact of addressing diverse socioeconomic variables that we have not addressed in in our approach. A similar situation occurs with the resilience perception, which as discussed in [24], can be decomposed into very heterogeneous variables in economically developed countries.
Therefore, we are not claiming that our results related to the community perception of risk factors are exhaustive, but instead, they should be used as a basis for developing more complex analyses in future stages. For instance, even though we have already observed clear behaviour differences between the responses from online and field surveys, with explicitly designed survey and accounting variables such as work location, alphabetisation level, and economic activity, we could in the future classify the population into different social groups and find similarities and differences in their behaviour within a social environment to carry out more sophisticated methods, as proposed in [107]. Thereby, for each group, we could expect different reactions to a future volcanic crisis and then propose particular resilience practices. However, these kinds of approaches will largely depend on the data availability, which is particularly difficult in the rural tropics [25,57].
As described in recent participative experiences to assess the community perception to natural hazards (e.g., [45,47]) we have also experienced that the workshops carried out were allowed to go beyond a simple exchange of information. They paved the way for a better divulgation of concepts such as triggering and cascading hazards, dynamic vulnerability, cumulative damage, and cascading effects. These understandings in turn facilitated the knowledge flows and feedback acquisition to continuously design the RIESGOS demonstrator guided by increasingly risk-informed decision-makers. With this bottom-up iterative approach in the web-tool design, we are following the suggestions of the Sendai Framework for Disaster Risk Reduction (2015–2030) [73]. The outcomes of the demonstrator are not static hazard maps that are delivered to the exposed population from top-down approaches (e.g., [48,49,50]), but rather scenario-based online computations that can dynamically change based upon the continuous integration of local datasets and models.
During the “hands-on” sessions, the potential users perceived the RIESGOS demonstrator to intended prompt risk communication processes. For the study area, only hazard models have been typically available, and the few risk outcomes obtained in the past have been reported in tables and not in a spatially explicit manner [58]. Therefore, this work is providing the community with the availability of scenario-based risk models based on the vulnerability of the exposed elements in graphical and user-friendly interphase, which is an added value for the local community. The integrated scenario-based lahar footprints per VEI [69] and the locally developed probabilistic ash falls models [95] are themselves useful outcomes for civil protection and local-planners. They can be used to identify which human settlements and agricultural plantations might be affected or even discuss the relocation of some of the exposed components of critical infrastructure. Although we have not accounted for the conditional probabilities between triggering and cascading hazards as proposed in [17], we have instead presented fixed risk scenarios. For such a purpose, the demonstrator is served by a novel method that calculates and disaggregates the cumulative damage when there are interactions at the vulnerability level. In the specific volcanic context, although the concept of dynamic vulnerability had been already theoretically sketched in the work of [108], to the best of the authors’ knowledge, we have first presented an example case of cumulative damage for risk-informed communities exposed to compound and cascading volcanic hazards. This is an innovative approach that not only contributes to reducing the generalized gap in the interactions at the vulnerability level [35], but also to communicating the results to the local stakeholders. With these contributions, the potential users could identify the most vulnerable areas for further mitigation strategies. It is worth mentioning that, since the RIESGOS demonstrator is currently not an operational tool, but rather shows the scientific and technological capabilities, the economic loss estimations for every exposure geo-cell (where residential buildings are aggregated) should not be used as definitive results. Therefore, due to the underlying uncertainties in these results, there is still the permanent necessity pointed out in [39,52] of having expert local users and scientists who can analyse and effectively communicate this information.
The technology transfer of the activities included in the CIS and RIESGOS programmes is highly relevant. The modular software architecture is particularly relevant for this aspect, for which the databases and methodologies of local Ecuadorian institutions may be ultimately integrated. However, the applicability of the demonstrator in the long-term will depend on how the local authorities will “give life” to the initiative, considering the local legal aspects. For future communication initiatives, due to the intrinsic interoperative sequence of inputs and outputs, the demonstrator can be a pedagogic tool to divulge multi-risk situations as similarly carried out by audio-visual approaches (e.g., [53,109]). Nevertheless, these kinds of local actors should be the first ones to understand the aforementioned concepts of “scenario” and “intensity” within the multi-risk chain, and most importantly, that they can be further contrasted with future and continuous spatially explicit social risk perceptions monitoring initiatives.

6. Conclusions

We have presented an integrative framework of qualitative community risk perceptions (carried out by the CIS Latacunga Laboratory) and scenario-based quantitative multi-hazard risk assessment (developed by the RIESGOS project). These initiatives have jointly worked on comprehensive volcanic risk communication processes in Latacunga, a city with a mainly rurally composed population, exposed to volcanic hazards from the Cotopaxi volcano.
Online and field surveys were carried out to rank the volcanic risk factors to investigate the individual knowledge and attitudes in Latacunga. Only the geo-located interviews in the field were used to map the community risk perceptions and to calculate a spatially explicit risk perception index through a semi-quantitative approach.
The participative workshops allowed the potentially affected communities to identify how their exposed assets, depending on their physical and systemic vulnerabilities, would be differently affected by several volcanic hazard scenarios. The iteratively customised RIESGOS demonstrator proved to be a useful tool for the communication of quantitative risk scenarios, raising the awareness of potentially affected population for the concept of scenarios and intensity. Its outcomes facilitate discussions among the participants on topics such as relocation of critical infrastructure elements. The demonstrator is not only enhancing the awareness of the communities, but also the user involvement in its development, improving the quality of the software. Although the development of the CIS and RIESGOS methodologies started independently, the respective outcomes of this collaborative work has allowed identifying areas where risk perception and scenario-based risk models are in disagreement. Thus, the need to continue assessing the social risk perception along with future risk communication efforts in the Cotopaxi region is highlighted.

Author Contributions

Conceptualization: J.C.G.-Z., M.P., and C.P.; methodology: M.P., C.P., E.S., F.B.-O., and H.S.; software: M.L.; validation: T.F., C.Z.-T., and C.P.; formal analysis: J.C.G.-Z., F.B.-O., and C.P.; investigation: T.F., F.B., K.B., and M.K.; resources: C.Z.-T.; data curation: J.C.G.-Z., M.L., and H.R.-V.; writing—original draft preparation: J.C.G.-Z., M.L., and C.P.; writing—review and editing: T.F., F.B., and J.C.G.-Z.; visualization: T.F., F.B.-O., and M.L.; supervision: H.S.; project management: E.S. All authors have read and agreed to the published version of the manuscript.

Funding

The research and development project RIESGOS (Grant No. 03G0876) is funded by the German Federal Ministry of Education and Research (BMBF) as part of the funding programme “CLIENT II—International Partnerships for Sustainable Innovations”. The development of the Latacunga Laboratory: Risk management, resilience and adaptation to climate change (within the program “Sustainable Intermediate Cities—CIS) is funded by the Deutsche Gesellschaft für Internationale Zusammenarbeit (GIZ) programme of the GIZ Federal Ministry for Economic Cooperation and Development of Germany (BMZ).

Institutional Review Board Statement

Not applicable.

Informed Consent Statement

Informed consent was obtained from all subjects involved in the study.

Data Availability Statement

The data presented in this study are available on request from the corresponding author. The data are not publicly available due to the continuous development of the RIESGOS demonstrator and community risk perception carried out by GIZ.

Acknowledgments

The authors want to express their gratitude to the 55 students from Instituto Superior Tecnológico Cotopaxi (ISTC) who carried out the field surveys, as well as to all the participants of the workshops and the inhabitants in Latacunga who replied the surveys. Thanks to Daniel Straub (TUM), Jörn Lauterjung, Heidi Kreibich, and Fabrice Cotton (GFZ) for their advice during the elaboration of this work. Special thanks to Benjamin Bernard and Sebastian Averdunk (TUM) for the ash fall simulations inputs, as well as to Daniel Andrade and Patricia Mothes (IG-EPN) for the valuable feedback throughout the development of this work. Thanks to Daniela de Gregorio (UNINA), Roberto Torres-Corredor (SGC), Susanna Jenkins (EOS), and Robin Spence (Cambridge A.R) for having kindly provided sets of ash fall fragility functions. Thanks to Karl Heinz Gaudry (GIZ/CIM), Martin Cordovez Dammer, Marta Correa, and Edwin León (IIGE) for the discussions about critical infrastructure and cascading effects during the former volcanic crisis in the study area during the author’s visits to Ecuador. Thanks to Hugo Yepes, Pablo Palacios, Jose Marrero, and Juan Carlos Singaucho (IG-EPN) for the feedback about exposure modelling and loss visualization. Thanks to Dorothea Kallenberger (GIZ), Ana Patricia (Grupo FARO), and Cristopher Velasco (president of the APGR) for having supported the research of the community risk perception study in Latacunga. Thanks to Luis Chasi for leading the initiative “Relatos de una erupcion”. Thanks to Diego Molina (GADPC) for promoting discussions about the social risk perception of the local actors of the Cotopaxi province during the workshops held in Latacunga. Thanks to all SENESCYT and SNGER for the co-organization of the workshops held in Quito. Special thanks to Nils Brinkmann and Matthias Rüster (GFZ) for having participated in the construction of some of the computer codes implemented in this work.

Conflicts of Interest

The authors declare no conflict of interest. The funders had no role in the design of the study; in the collection, analyses, or interpretation of data; in the writing of the manuscript; or in the decision to publish the results.

Appendix A

Table A1. Example of the procedure for calculating the risk perception pre-index.
QuestionsAnswer OptionsQuantitative ScoreAnswerValue TransformationPerception of Risk FactorPre-Index of Risk Perception (in the Scale 1–27)
EarthquakeVolcanoesDroughtFrostLandslidesFloodsEarthquakeVolcanoesDroughtFrostLandslidesFloods
Perception of hazard recurrenceCertainly yes3xxxx x3333 3 P ( Hazard ) 2.8312.60
It might occur2 x 2
Impossible1
Perception of their impactsVery serious3xx x33 3 P ( Vulnerability ) 2.5
Moderate2 xxx 222
No effects 1
Perception of their effects to your family Direct3xx x x33 3 3 P ( Exposure ) 2.67
Indirect2 x x 2 2
No effects1
Perception of recovery from themImpossible 1xx x11 1 P ( esilience ) 1.5
Difficult2 xxx 222
Likely 3
Table A2. Questionnaire within the survey to assess the social risk perception to volcanic risk in the urban area of Latacunga. The mean values of the entire survey are reported. Adapted after [75].
QuestionsPossible AnswerType of Survey (%)
OnlineFieldAggregated
%   P ( Hazard ) . Perception of volcanic hazards recurrence. Do you think a volcanic eruption (from the Cotopaxi) can occur?Certainly yes54.4363.6162.04
It might occur44.3034.2936.01
Impossible1.272.091.95
%   P ( Vulnerability ) . How do you consider the effects after a volcanic eruption would be?Very serious91.3685.5686.56
Moderate8.6412.8612.12
No effects0.001.571.30
%   P ( Exposure ) . How do you consider the effects after a volcanic eruption would impact your family and yourself?Very serious81.4875.3976.46
Moderate17.2822.5121.60
No effects1.232.091.94
%   P ( resilience ) . How do you consider the recovery process from the effects after a volcanic eruption?Impossible11.1124.8722.46
Difficult58.0257.3357.45
Likely30.8617.8020.09
Do you know if your home is in a volcanic hazard zone?Yes69.7045.8049.70
No32.154.250.3
Are there emergency plans in your neighbourhood?Yes19.7536.6533.69
No38.2739.2739.09
Do not know41.9824.0827.21
Are there safe places in the vicinity where you live? (in case of a volcanic eruption)Yes69.1466.4966.95
No16.0518.8518.36
Do not know14.8114.6614.69
Are there evacuation routes to safe sites?Yes70.3760.4762.20
No8.6421.4719.22
Do not know20.9918.0618.57
Is there an emergency committee in your neighbourhood?Yes9.8832.9828.94
No46.9135.3437.37
Do not know43.2131.6833.69
Do you know if there are initiatives, actions, or works to reduce the risks from volcanic eruptions in Latacunga?Yes66.7056.3058.10
No33.3043.7041.90
Do you think you are capable of having a fast react during a volcanic eruptions?Yes69.1053.1055.90
No30.9046.9044.10
How often do you talk to your family about how to behave in the event of an emergency?Never0.0017.6314.66
Rarely23.3841.0538.07
Sometimes50.6522.8927.57
Usually25.9718.4219.69
Figure A1. Example of the graphical representation of the spatially distributed ash fall intensities as isolines in the RIESGOS demonstrator (as of December 2020) from a previously selected VEI. The thickness values are displayed. Once a point within the isolines is clicked, the expected load (kPa) value is also shown.
Sustainability 13 01714 g0a1
Figure A2. Example of the graphical representation of the footprint and intensities of the lahars in the RIESGOS demonstrator (as of December 2020) from a previously selected VEI. On the top-right side of the window, the outputs of the lahar simulation are listed (i.e., lahar flow velocity, flow depth, pressure, erosion, and deposition).
Sustainability 13 01714 g0a2
Figure A3. Example of the graphical representation of the residential building exposure model in the RIESGOS demonstrator (as of December 2020). It is represented into aggregation areas based on the official rural and urban administrative divisions of Latacunga. There are displayed the quantities of every ash fall risk oriented building class proposed in [99] within a selected area.
Sustainability 13 01714 g0a3
Figure A4. Example of the graphical representation of damage state distribution due to the combined effect of ash falls and lahar scenarios in the RIESGOS demonstrator (as of December 2020) calculated using the method proposed in [90], [92].
Sustainability 13 01714 g0a4
Figure A5. Example of the visualization of the expected interruption probabilities in the RIESGOS demonstrator (as of December 2020) of the electrical power network due to the action of a lahar scenario.
Sustainability 13 01714 g0a5

References

  1. Gill, J.C.; Malamud, B.D. Hazard interactions and interaction networks (cascades) within multi-hazard methodologies. Earth Syst. Dyn. 2016, 7, 659–679. [Google Scholar] [CrossRef] [Green Version]
  2. Pescaroli, G.; Alexander, D. A definition of cascading disasters and cascading effects: Going beyond the “toppling dominos” metaphor. Planet Risk 2015, 3, 58–67. [Google Scholar]
  3. Ward, P.J.; Blauhut, V.; Bloemendaal, N.; Daniell, J.E.; de Ruiter, M.C.; Duncan, M.J.; Emberson, R.; Jenkins, S.F.; Kirschbaum, D.; Kunz, M.; et al. Review article: Natural hazard risk assessments at the global scale. Nat. Hazards Earth Syst. Sci. 2020, 20, 1069–1096. [Google Scholar] [CrossRef] [Green Version]
  4. Cando-Jácome, M.; Martínez-Graña, A. Determination of primary and secondary lahar flow paths of the Fuego volcano (Guatemala) using morphometric parameters. Remote Sens. 2019, 11, 727. [Google Scholar] [CrossRef] [Green Version]
  5. Mothes, P.A.; Vallance, J.W. Chapter 6—Lahars at Cotopaxi and Tungurahua Volcanoes, Ecuador: Highlights from stratigraphy and observational records and related downstream hazards. In Volcanic Hazards, Risks and Disasters; Shroder, J.F., Papale, P., Eds.; Elsevier: Boston, MA, USA, 2015; pp. 141–168. ISBN 978-0-12-396453-3. [Google Scholar]
  6. Merz, B.; Kuhlicke, C.; Kunz, M.; Pittore, M.; Babeyko, A.; Bresch, D.N.; Domeisen, D.I.V.; Feser, F.; Koszalka, I.; Kreibich, H.; et al. Impact forecasting to support emergency management of natural hazards. Rev. Geophys. 2020, 58, e2020RG000704. [Google Scholar] [CrossRef]
  7. Li, M.; Wang, J.; Sun, X. Scenario-based risk framework selection and assessment model development for natural disasters: A case study of typhoon storm surges. Nat. Hazards 2016, 80, 2037–2054. [Google Scholar] [CrossRef]
  8. Lowe, D.R.; Williams, S.N.; Leigh, H.; Connort, C.B.; Gemmell, J.B.; Stoiber, R.E. Lahars initiated by the 13 November 1985 eruption of Nevado del Ruiz, Colombia. Nature 1986, 324, 51–53. [Google Scholar] [CrossRef]
  9. García, C.; Mendez-Fajury, R. If I understand, i am understood: Experiences of volcanic risk communication in Colombia. In Observing the Volcano World: Volcano Crisis Communication; Fearnley, C.J., Bird, D.K., Haynes, K., McGuire, W.J., Jolly, G., Eds.; Springer International Publishing: Cham, Swizterland, 2018; pp. 335–351. ISBN 978-3-319-44097-2. [Google Scholar]
  10. Pierson, T.C.; Janda, R.J.; Thouret, J.-C.; Borrero, C.A. Perturbation and melting of snow and ice by the 13 November 1985 eruption of Nevado del Ruiz, Colombia, and consequent mobilization, flow and deposition of lahars. J. Volcanol. Geotherm. Res. 1990, 41, 17–66. [Google Scholar] [CrossRef]
  11. Pescaroli, G.; Alexander, D. Critical infrastructure, panarchies and the vulnerability paths of cascading disasters. Nat. Hazards 2016, 82, 175–192. [Google Scholar] [CrossRef] [Green Version]
  12. Bolić, T.; Sivčev, Ź. Eruption of Eyjafjallajökull in Iceland: Experience of European Air Traffic Management. Transp. Res. Rec. 2011, 2214, 136–143. [Google Scholar] [CrossRef]
  13. Walter, T.R.; Haghighi, M.H.; Schneider, F.M.; Coppola, D.; Motagh, M.; Saul, J.; Babeyko, A.; Dahm, T.; Troll, V.R.; Tilmann, F.; et al. Complex hazard cascade culminating in the Anak Krakatau sector collapse. Nat. Commun. 2019, 10, 4339. [Google Scholar] [CrossRef] [PubMed]
  14. Lauterjung, J.; Spahn, H. Tsunami Hazard and Its Challenges for Preparedness. Available online: https://www.thejakartapost.com/academia/2019/01/08/tsunami-hazard-and-its-challenges-for-preparedness.html (accessed on 16 December 2020).
  15. Poland, M.P.; Anderson, K.R. Partly cloudy with a chance of lava flows: Forecasting volcanic eruptions in the twenty-first century. J. Geophys. Res. Solid Earth 2020, 125, e2018JB016974. [Google Scholar] [CrossRef]
  16. Biass, S.; Scaini, C.; Bonadonna, C.; Folch, A.; Smith, K.; Höskuldsson, A. A multi-scale risk assessment for tephra fallout and airborne concentration from multiple Icelandic volcanoes—Part 1: Hazard assessment. Nat. Hazards Earth Syst. Sci. 2014, 14, 2265–2287. [Google Scholar] [CrossRef] [Green Version]
  17. Zuccaro, G.; Cacace, F.; Spence, R.J.S.; Baxter, P.J. Impact of explosive eruption scenarios at Vesuvius. J. Volcanol. Geotherm. Res. 2008, 178, 416–453. [Google Scholar] [CrossRef]
  18. Marzocchi, W.; Garcia-Aristizabal, A.; Gasparini, P.; Mastellone, M.L.; Di Ruocco, A. Basic principles of multi-risk assessment: A case study in Italy. Nat. Hazards 2012, 62, 551–573. [Google Scholar] [CrossRef]
  19. Pittore, M.; Wieland, M.; Fleming, K. Perspectives on global dynamic exposure modelling for geo-risk assessment. Nat Hazards 2017, 86, 7–30. [Google Scholar] [CrossRef]
  20. Gallina, V.; Torresan, S.; Critto, A.; Sperotto, A.; Glade, T.; Marcomini, A. A review of multi-risk methodologies for natural hazards: Consequences and challenges for a climate change impact assessment. J. Environ. Manag. 2016, 168, 123–132. [Google Scholar] [CrossRef]
  21. Zuccaro, G.; De Gregorio, D. Time and space dependency in impact damage evaluation of a sub-Plinian eruption at Mount Vesuvius. Nat. Hazards 2013, 68, 1399–1423. [Google Scholar] [CrossRef]
  22. Gehl, P.; Quinet, C.; Le Cozannet, G.; Kouokam, E.; Thierry, P. Potential and limitations of risk scenario tools in volcanic areas through an example at Mount Cameroon. Nat. Hazards Earth Syst. Sci. 2013, 13, 2409–2424. [Google Scholar] [CrossRef] [Green Version]
  23. Doyle, E.E.H.; McClure, J.; Paton, D.; Johnston, D.M. Uncertainty and decision making: Volcanic crisis scenarios. Int. J. Disaster Risk Reduct. 2014, 10, 75–101. [Google Scholar] [CrossRef] [Green Version]
  24. Ran, J.; MacGillivray, B.H.; Gong, Y.; Hales, T.C. The application of frameworks for measuring social vulnerability and resilience to geophysical hazards within developing countries: A systematic review and narrative synthesis. Sci. Total Environ. 2020, 711, 134486. [Google Scholar] [CrossRef] [PubMed]
  25. Li, X.; Li, Z.; Yang, J.; Li, H.; Liu, Y.; Fu, B.; Yang, F. Seismic vulnerability comparison between rural Weinan and other rural areas in Western China. Int. J. Disaster Risk Reduct. 2020, 48, 101576. [Google Scholar] [CrossRef]
  26. Papathoma-Koehle, M.; Maris, F.; Fuchs, S. Remoteness and austerity: A major driver of vulnerabilities to natural hazards. In Proceedings of the EGU General Assembly Conference Abstracts, Online, 4–8 May 2020; p. 1577. [Google Scholar]
  27. Parham, M.; Teeuw, R.; Solana, C.; Day, S. Quantifying the impact of educational methods for disaster risk reduction: A longitudinal study assessing the impact of teaching methods on student hazard perceptions. Int. J. Disaster Risk Reduct. 2020. [Google Scholar] [CrossRef]
  28. Papathoma-Köhle, M.; Schlögl, M.; Fuchs, S. Vulnerability indicators for natural hazards: An innovative selection and weighting approach. Sci. Rep. 2019, 9, 15026. [Google Scholar] [CrossRef]
  29. National Geophysical Data Center; World Data Service (NGDC/WDS) NCEI/WDS Global Significant Volcanic Eruptions Database. NOAA National Centers for Environmental Information. Available online: https://www.ngdc.noaa.gov/hazard/volcano.shtml (accessed on 8 May 2020).
  30. Pesaresi, M.; Ehrilich, D.; Kemper, T.; Siragusa, A.; Florcyk, A.; Freire, S.; Corbane, C. Atlas of the Human Planet 2017. Global Exposure to Natural Hazards; EUR 28556 EN; European Comission: Luxembourg, 2017. [Google Scholar]
  31. Jenkins, S.F.; Spence, R.J.S.; Fonseca, J.F.B.D.; Solidum, R.U.; Wilson, T.M. Volcanic risk assessment: Quantifying physical vulnerability in the built environment. J. Volcanol. Geotherm. Res. 2014, 276, 105–120. [Google Scholar] [CrossRef]
  32. Craig, H.; Wilson, T.; Stewart, C.; Villarosa, G.; Outes, V.; Cronin, S.; Jenkins, S. Agricultural impact assessment and management after three widespread tephra falls in Patagonia, South America. Nat. Hazards 2016, 82, 1167–1229. [Google Scholar] [CrossRef]
  33. Wilson, G.; Wilson, T.M.; Deligne, N.I.; Blake, D.M.; Cole, J.W. Framework for developing volcanic fragility and vulnerability functions for critical infrastructure. J. Appl. Volcanol. 2017, 6, 14. [Google Scholar] [CrossRef] [Green Version]
  34. Wilson, T.M.; Stewart, C.; Wardman, J.B.; Wilson, G.; Johnston, D.M.; Hill, D.; Hampton, S.J.; Villemure, M.; McBride, S.; Leonard, G.; et al. Volcanic ashfall preparedness poster series: A collaborative process for reducing the vulnerability of critical infrastructure. J. Appl. Volcanol. 2014, 3, 10. [Google Scholar] [CrossRef] [Green Version]
  35. Terzi, S.; Torresan, S.; Schneiderbauer, S.; Critto, A.; Zebisch, M.; Marcomini, A. Multi-risk assessment in mountain regions: A review of modelling approaches for climate change adaptation. J. Environ. Manag. 2019, 232, 759–771. [Google Scholar] [CrossRef] [PubMed]
  36. Thompson, M.A.; Lindsay, J.M.; Wilson, T.M.; Biass, S.; Sandri, L. Quantifying risk to agriculture from volcanic ashfall: A case study from the Bay of Plenty, New Zealand. Nat. Hazards 2017, 86, 31–56. [Google Scholar] [CrossRef]
  37. Deligne, N.I.; Horspool, N.; Canessa, S.; Matcham, I.; Williams, G.T.; Wilson, G.; Wilson, T.M. Evaluating the impacts of volcanic eruptions using RiskScape. J. Appl. Volcanol. 2017, 6, 18. [Google Scholar] [CrossRef] [Green Version]
  38. Scaini, C.; Biass, S.; Galderisi, A.; Bonadonna, C.; Folch, A.; Smith, K.; Höskuldsson, A. A multi-scale risk assessment for tephra fallout and airborne concentration from multiple Icelandic volcanoes—Part 2: Vulnerability and impact. Nat. Hazards Earth Syst. Sci. 2014, 14, 2289–2312. [Google Scholar] [CrossRef] [Green Version]
  39. Doyle, E.E.H.; McClure, J.; Johnston, D.M.; Paton, D. Communicating likelihoods and probabilities in forecasts of volcanic eruptions. J. Volcanol. Geotherm. Res. 2014, 272, 1–15. [Google Scholar] [CrossRef]
  40. Thomalla, F.; Boyland, M.; Johnson, K.; Ensor, J.; Tuhkanen, H.; Gerger Swartling, Å.; Han, G.; Forrester, J.; Wahl, D. Transforming development and disaster risk. Sustainability 2018, 10, 1458. [Google Scholar] [CrossRef] [Green Version]
  41. Horney, J.; Nguyen, M.; Salvesen, D.; Tomasco, O.; Berke, P. Engaging the public in planning for disaster recovery. Int. J. Disaster Risk Reduct. 2016, 17, 33–37. [Google Scholar] [CrossRef] [Green Version]
  42. Kwok, A.H.; Paton, D.; Becker, J.; Hudson-Doyle, E.E.; Johnston, D. A bottom-up approach to developing a neighbourhood-based resilience measurement framework. Disaster Prev. Manag. Int. J. 2018, 27, 255–270. [Google Scholar] [CrossRef] [Green Version]
  43. Lévy, J. Science + Space + Society: Urbanity and the risk of methodological communalism in social sciences of space. Geogr. Helv. 2014, 69, 99–114. [Google Scholar] [CrossRef] [Green Version]
  44. Pescaroli, G. Perceptions of cascading risk and interconnected failures in emergency planning: Implications for operational resilience and policy making. Int. J. Disaster Risk Reduct. 2018, 30, 269–280. [Google Scholar] [CrossRef] [Green Version]
  45. Heinzlef, C.; Robert, B.; Hémond, Y.; Serre, D. Operating urban resilience strategies to face climate change and associated risks: Some advances from theory to application in Canada and France. Cities 2020, 104, 102762. [Google Scholar] [CrossRef]
  46. Gill, J.C.; Malamud, B.D.; Barillas, E.M.; Guerra Noriega, A. Construction of regional multi-hazard interaction frameworks, with an application to Guatemala. Nat. Hazards Earth Syst. Sci. 2020, 20, 149–180. [Google Scholar] [CrossRef] [Green Version]
  47. Fleming, K.; Abad, J.; Booth, L.; Schueller, L.; Baills, A.; Scolobig, A.; Petrovic, B.; Zuccaro, G.; Leone, M.F. The use of serious games in engaging stakeholders for disaster risk reduction, management and climate change adaption information elicitation. Int. J. Disaster Risk Reduct. 2020, 49, 101669. [Google Scholar] [CrossRef]
  48. Jóhannesdóttir, G.; Gísladóttir, G. People living under threat of volcanic hazard in southern Iceland: Vulnerability and risk perception. Nat. Hazards Earth Syst. Sci. 2010, 10, 407–420. [Google Scholar] [CrossRef] [Green Version]
  49. Paton, D.; Smith, L.; Daly, M.; Johnston, D. Risk perception and volcanic hazard mitigation: Individual and social perspectives. J. Volcanol. Geotherm. Res. 2008, 172, 179–188. [Google Scholar] [CrossRef]
  50. Bronfman, N.C.; Cisternas, P.C.; López-Vázquez, E.; Cifuentes, L.A. Trust and risk perception of natural hazards: Implications for risk preparedness in Chile. Nat. Hazards 2016, 81, 307–327. [Google Scholar] [CrossRef]
  51. Leonard, G.S.; Stewart, C.; Wilson, T.M.; Procter, J.N.; Scott, B.J.; Keys, H.J.; Jolly, G.E.; Wardman, J.B.; Cronin, S.J.; McBride, S.K. Integrating multidisciplinary science, modelling and impact data into evolving, syn-event volcanic hazard mapping and communication: A case study from the 2012 Tongariro eruption crisis, New Zealand. J. Volcanol. Geotherm. Res. 2014, 286, 208–232. [Google Scholar] [CrossRef]
  52. Pierson, T.C.; Wood, N.J.; Driedger, C.L. Reducing risk from lahar hazards: Concepts, case studies, and roles for scientists. J. Appl. Volcanol. 2014, 3, 16. [Google Scholar] [CrossRef] [Green Version]
  53. Hicks, A.; Armijos, M.T.; Barclay, J.; Stone, J.; Robertson, R.; Cortés, G.P. Risk communication films: Process, product and potential for improving preparedness and behaviour change. Int. J. Disaster Risk Reduct. 2017, 23, 138–151. [Google Scholar] [CrossRef]
  54. Armijos, M.T.; Phillips, J.; Wilkinson, E.; Barclay, J.; Hicks, A.; Palacios, P.; Mothes, P.; Stone, J. Adapting to changes in volcanic behaviour: Formal and informal interactions for enhanced risk management at Tungurahua Volcano, Ecuador. Glob. Environ. Chang. 2017, 45, 217–226. [Google Scholar] [CrossRef] [Green Version]
  55. Lupiano, V.; Chidichimo, F.; Machado, G.; Catelan, P.; Molina, L.; Calidonna, C.R.; Straface, S.; Crisci, G.M.; Di Gregorio, S. From examination of natural events to a proposal for risk mitigation of lahars by a cellular-automata methodology: A case study for Vascún valley, Ecuador. Nat. Hazards Earth Syst. Sci. 2020, 20, 1–20. [Google Scholar] [CrossRef] [Green Version]
  56. Bernard, B.; Battaglia, J.; Proaño, A.; Hidalgo, S.; Vásconez, F.; Hernandez, S.; Ruiz, M. Relationship between volcanic ash fallouts and seismic tremor: Quantitative assessment of the 2015 eruptive period at Cotopaxi volcano, Ecuador. Bull. Volcanol. 2016, 78, 80. [Google Scholar] [CrossRef]
  57. Frontuto, V.; Dalmazzone, S.; Salcuni, F.; Pezzoli, A. Risk Aversion, Inequality and Economic Evaluation of Flood Damages: A Case Study in Ecuador. Sustainability 2020, 12, 68. [Google Scholar] [CrossRef]
  58. Rodriguez, F.; Toulkeridis, T.; Sandoval, W.; Padilla, O.; Mato, F. Economic risk assessment of Cotopaxi volcano, Ecuador, in case of a future lahar emplacement. Nat. Hazards 2017, 85, 605–618. [Google Scholar] [CrossRef]
  59. Barberi, F.; Coltelli, M.; Frullani, A.; Rosi, M.; Almeida, E. Chronology and dispersal characteristics of recently (last 5000 years) erupted tephra of Cotopaxi (Ecuador): Implications for long-term eruptive forecasting. J. Volcanol. Geotherm. Res. 1995, 69, 217–239. [Google Scholar] [CrossRef]
  60. Hall, M.; Mothes, P. The rhyolitic–andesitic eruptive history of Cotopaxi volcano, Ecuador. Bull. Volcanol. 2008, 70, 675–702. [Google Scholar] [CrossRef]
  61. Sierra, D.; Vasconez, F.; Andrade, S.D.; Almeida, M.; Mothes, P. Historical distal lahar deposits on the remote eastern-drainage of cotopaxi volcano, Ecuador. J. South Am. Earth Sci. 2019, 95, 102251. [Google Scholar] [CrossRef]
  62. Aguilera, E.; Pareschi, M.T.; Rosi, M.; Zanchetta, G. Risk from Lahars in the Northern Valleys of Cotopaxi Volcano (Ecuador). Nat. Hazards 2004, 33, 161–189. [Google Scholar] [CrossRef]
  63. Doocy, S.; Daniels, A.; Dooling, S.; Gorokhovich, Y. The human impact of volcanoes: A historical review of events 1900–2009 and systematic literature review. PLoS Curr. 2013, 5. [Google Scholar] [CrossRef] [PubMed]
  64. Andrade, D.; Hall, M.; Mothes, P.; Troncosco, L.; Eissen, J.-P.; Samaniego, P.; Efred, J.; Ramon, P.; Rivero, D.; Yepes, H. Los Peligros Volcánicos Asociados con el Cotopaxi; Los peligros volcánicos en el Ecuador; IG-EPN: Quito, Ecuador, 2005. [Google Scholar]
  65. INEC. Censo de Poblacion y Vivienda. Estadisticas de Vivienda y Hogares; Estadisticas de Vivienda y Hogares: Quito, Ecuador, 2010. [Google Scholar]
  66. Czerny, M.; Czerny, A. Urbanisation processes in zones threatened by volcanic activity: The case of Latacunga at the foot of Cotopaxi in Ecuador. Misc. Geogr. 2020, 24, 183–192. [Google Scholar]
  67. Christie, R.; Cooke, O.; Gottsmann, J. Fearing the knock on the door: Critical security studies insights into limited cooperation with disaster management regimes. J. Appl. Volcanol. 2015, 4, 19. [Google Scholar] [CrossRef] [Green Version]
  68. Mothes, P.A.; Ruiz, M.C.; Viracucha, E.G.; Ramón, P.A.; Hernández, S.; Hidalgo, S.; Bernard, B.; Gaunt, E.H.; Jarrín, P.; Yépez, M.A.; et al. Geophysical footprints of Cotopaxi’s unrest and minor eruptions in 2015: An opportunity to test scientific and community preparedness. In Volcanic Unrest: From Science to Society; Gottsmann, J., Neuberg, J., Scheu, B., Eds.; Springer International Publishing: Cham, Switzerland, 2019; pp. 241–270. ISBN 978-3-319-58412-6. [Google Scholar]
  69. Frimberger, T.; Andrade, D.; Weber, D.; Krautblatter, M. Modelling future lahars controlled by different volcanic eruption scenarios at Cotopaxi (Ecuador) calibrated with the massively destructive 1877 lahar. Print Earth Surf. Process. Landf. 2020. [Google Scholar] [CrossRef]
  70. Pistolesi, M.; Cioni, R.; Rosi, M.; Cashman, K.V.; Rossotti, A.; Aguilera, E. Evidence for lahar-triggering mechanisms in complex stratigraphic sequences: The post-twelfth century eruptive activity of Cotopaxi Volcano, Ecuador. Bull. Volcanol. 2013, 75, 698. [Google Scholar] [CrossRef]
  71. Mothes, P.; Espin, P.; Hall, M.; Vasconez, F.; Sierra, D.; Andrade, D. Mapa Regional De Amenazas Volcánicas Potenciales del Volcán Cotopaxi, Zona Sur. Mapa de Peligros; Instituto Geofisico de la Escuela Politenica Nacional y el Instituto Geografico Militar: Quito, Ecuador, 2016. [Google Scholar]
  72. Heifer Fundation. Páramos de Cotopaxi y Cambio Climático. Experiencias Campesinas de Adaptación al Cambio Climático; Fundación Heifer: Quito, Ecuador, 2018. [Google Scholar]
  73. UNISDR. Sendai Frameworkfor Disaster Risk Reduction2015–2030; United Nations International Strategy for Disaster Reduction: Sendai, Japan, 2015. [Google Scholar]
  74. Heinzlef, C.; Barocca, B.; Leone, M.; Glade, T.; Serre, D. Resilience issues and challenges into built environments: A review. Nat. Hazards Earth Syst. Sci. Discuss. 2020, 2020, 1–35. [Google Scholar]
  75. Grupo FARO; Asociación de Profesionales de Gestión de Riesgos de Ecuador, and Instituto Superior Tecnológico Cotopaxi. Percepción social del riesgo en la ciudad de Latacunga; Grupo FARO: Quito, Ecuador, 2020; Available online: https://grupofaro.org/portfolio/estudio-de-percepcion-social-del-riesgo-en-la-ciudad-de-latacunga/ (accessed on 26 November 2020).
  76. Bird, D.K. The use of questionnaires for acquiring information on public perception of natural hazards and risk mitigation—A review of current knowledge and practice. Nat. Hazards Earth Syst. Sci. 2009, 9, 1307–1325. [Google Scholar] [CrossRef]
  77. Carreño, M.L.; Cardona, O.D.; Barbat, A.H. Sistema de Indicadores Para la Evaluación de Riesgos; Centre Internacional de Mètodes Numèrics en Enginyeria (CIMNE): Barcelona, Spain, 2005; ISBN 84-95999-70-6. [Google Scholar]
  78. Kelman, I. Lost for words amongst disaster risk science vocabulary? Int. J. Disaster Risk Sci. 2018, 9, 281–291. [Google Scholar] [CrossRef] [Green Version]
  79. Shaw, K. “Reframing” Resilience: Challenges for planning theory and practice. Plan. Theory Pract. 2012, 13, 299–333. [Google Scholar]
  80. Weichselgartner, J.; Kelman, I. Geographies of resilience: Challenges and opportunities of a descriptive concept. Prog. Hum. Geogr. 2014, 39, 249–267. [Google Scholar] [CrossRef] [Green Version]
  81. Sajjad, M.; Chan, J.C.L.; Kanwal, S. Integrating spatial statistics tools for coastal risk management: A case-study of typhoon risk in mainland China. Ocean Coast. Manag. 2020, 184, 105018. [Google Scholar] [CrossRef]
  82. Oláh, J.; Virglerova, Z.; Popp, J.; Kliestikova, J.; Kovács, S. The assessment of non-financial risk sources of SMES in the V4 countries and Serbia. Sustainability 2019, 11, 4806. [Google Scholar] [CrossRef] [Green Version]
  83. Frazier, T.G.; Wood, E.X.; Peterson, A.G. Residual risk in public health and disaster management. Appl. Geogr. 2020, 125, 102365. [Google Scholar] [CrossRef]
  84. Wuni, I.Y.; Shen, G.Q.; Osei-Kyei, R.; Agyeman-Yeboah, S. Modelling the critical risk factors for modular integrated construction projects. Int. J. Constr. Manag. 2020, 1–14. [Google Scholar] [CrossRef]
  85. Marín-Monroy, E.A.; Trejo, V.H.; de la Pena, M.A.O.R.; Polanco, G.A.; Barbara, N.L. Assessment of socio-environmental vulnerability due to tropical cyclones in La Paz, Baja California Sur, Mexico. Sustainability 2020, 12, 1575. [Google Scholar] [CrossRef] [Green Version]
  86. Cano, A.M.; Sagredo, R.R.; García-Carrión, R.; Garcia-Zapirain, B. Social impact assessment of HealthyAIR tool for real-time detection of pollution risk. Sustainability 2020, 12, 9856. [Google Scholar] [CrossRef]
  87. Pescaroli, G.; Velazquez, O.; Alcántara-Ayala, I.; Galasso, C.; Kostkova, P.; Alexander, D. A likert scale-based model for benchmarking operational capacity, organizational resilience, and disaster risk reduction. Int. J. Disaster Risk Sci. 2020, 11, 404–409. [Google Scholar] [CrossRef]
  88. Issaks, E.H.; Srivastava, R.M. An Introduction to Applied Geostatistics; University Press: Oxford, NY, USA, 1989. [Google Scholar]
  89. Rosero-Velásquez, H.; Straub, D. Representative Natural Hazard Scenarios for Risk Assessment of Spatially Distributed Infrastructure Systems. In Proceedings of the 29th European Safety and Reliability Conference (ESREL 2019), Hannover, Germany, 22–26 September 2019. [Google Scholar]
  90. Langbein, M.; Gomez-Zapata, J.C.; Frimberger, T.; Brinckmann, N.; Torres-Corredor, R.; Andrade, D.; Zapata-Tapia, C.; Pittore, M.; Schoepfer, E. Scenario- based multi- risk assessment on exposed buildings to volcanic cascading hazards. In Proceedings of the EGU General Assembly Conference Abstracts, Online, 4–8 May 2020; p. 19861. [Google Scholar]
  91. Brill, F.; Pineda, S.P.; Cuya, B.E.; Kreibich, H. A data-mining approach towards damage modelling for El Niño events in Peru. Geomat. Natural Hazards Risk 2020, 11, 1966–1990. [Google Scholar] [CrossRef]
  92. Gomez-Zapata, J.C.; Pittore, M.; Brinckmann, N.; Shinde, S. Dynamic physical vulnerability: A Multi-risk Scenario approach from building- single- hazard fragility- models. In Proceedings of the EGU General Assembly Conference Abstracts, Online, 4–8 May 2020; p. 18379. [Google Scholar]
  93. Pittore, M.; Zapata, J.C.G.; Brinckmann, N.; Weatherill, G.; Babeyko, A.; Harig, S.; Mahdavi, A.; Proß, B.; Velasquez, H.F.R.; Straub, D.; et al. Towards an integrated framework for distributed, modular multi-risk scenario assessment. In Proceedings of the EGU General Assembly Conference Abstracts, Online, 4–8 May 2020; p. 19097. [Google Scholar]
  94. Brinckmann, N.; Pittore, M.; Rüster, M.; Proß, B.; Gomez-Zapata, J.C. Put your models in the web—less painful. In Proceedings of the EGU General Assembly Conference Abstracts, Online, 4–8 May 2020; p. 8671. [Google Scholar]
  95. Tadini, A.; Roche, O.; Samaniego, P.; Guillin, A.; Azzaoui, N.; Gouhier, M.; de’ Michieli Vitturi, M.; Pardini, F.; Eychenne, J.; Bernard, B.; et al. Quantifying the Uncertainty of a coupled plume and tephra dispersal model: PLUME-MOM/HYSPLIT simulations applied to andean volcanoes. J. Geophys. Res. Solid Earth 2020, 125, e2019JB018390. [Google Scholar] [CrossRef]
  96. Yepes-Estrada, C.; Silva, V.; Valcárcel, J.; Acevedo, A.B.; Tarque, N.; Hube, M.A.; Coronel, G.; María, H.S. Modeling the residential building inventory in South America for seismic risk assessment. Earthq. Spectra 2017, 33, 299–322. [Google Scholar] [CrossRef]
  97. Cornell, C.A.; Krawinkler, H. Progress and challenges in seismic performance assessment. Peer Cent. News 2000, 3, 1–3. [Google Scholar]
  98. Mavrouli, O.; Fotopoulou, S.; Pitilakis, K.; Zuccaro, G.; Corominas, J.; Santo, A.; Cacace, F.; De Gregorio, D.; Di Crescenzo, G.; Foerster, E.; et al. Vulnerability assessment for reinforced concrete buildings exposed to landslides. Bull. Eng. Geol. Environ. 2014. [Google Scholar] [CrossRef]
  99. Torres-Corredor, R.A.; Ponde-Villarreal, P.; Gomez-Martinez, D.M. Vulnerabilidad física de cubiertas de edificaciones de uso de ocupación normal ante caídas de ceniza en la zona de influencia del Volcán Galeras. Bol. Geol. 2017, 39, 2. [Google Scholar]
  100. Crucitti, P.; Latora, V.; Marchiori, M. Model for cascading failures in complex networks. Phys. Rev. E 2004, 69, 045104. [Google Scholar] [CrossRef] [Green Version]
  101. Poljanšek, K.; Bono, F.; Gutiérrez, E. Seismic risk assessment of interdependent critical infrastructure systems: The case of European gas and electricity networks. Earthq. Eng. Struct. Dyn. 2012, 41, 61–79. [Google Scholar] [CrossRef]
  102. Thouret, J.-C.; Antoine, S.; Magill, C.; Ollier, C. Lahars and debris flows: Characteristics and impacts. Earth-Sci. Rev. 2020, 201, 103003. [Google Scholar] [CrossRef]
  103. Jenkins, S.F.; Phillips, J.C.; Price, R.; Feloy, K.; Baxter, P.J.; Hadmoko, D.S.; de Bélizal, E. Developing building-damage scales for lahars: Application to Merapi volcano, Indonesia. Bull. Volcanol. 2015, 77, 75. [Google Scholar] [CrossRef]
  104. Croasmun, J.; Ostrom, L. Using likert-type scales in the social sciences. J. Adult Educ. 2011, 40, 19–22. [Google Scholar]
  105. Beven, K.J.; Aspinall, W.P.; Bates, P.D.; Borgomeo, E.; Goda, K.; Hall, J.W.; Page, T.; Phillips, J.C.; Simpson, M.; Smith, P.J.; et al. Epistemic uncertainties and natural hazard risk assessment—Part 2: What should constitute good practice? Nat. Hazards Earth Syst. Sci. 2018, 18, 2769–2783. [Google Scholar] [CrossRef] [Green Version]
  106. Armaș, I.; Gavriș, A. Social vulnerability assessment using spatial multi-criteria analysis (SEVI model) and the Social Vulnerability Index (SoVI model)—A case study for Bucharest, Romania. Nat. Hazards Earth Syst. Sci. 2013, 13, 1481–1499. [Google Scholar] [CrossRef] [Green Version]
  107. Moscato, V.; Picariello, A.; Sperli, G. An emotional recommender system for music. IEEE Intell. Syst. 2020. [Google Scholar] [CrossRef]
  108. Zuccaro, G.; De Gregorio, D.; Leone, M.F. Theoretical model for cascading effects analyses. Int. J. Disaster Risk Reduct. 2018, 30, 199–215. [Google Scholar] [CrossRef]
  109. Mercorio, F.; Mezzanzanica, M.; Moscato, V.; Picariello, A.; Sperli, G. DICO: A Graph-DB framework for community detection on big scholarly data. IEEE Trans. Emerg. Top. Comput. 2019. [Google Scholar] [CrossRef]
Figure 1. Location of the main volcanic systems in the Ecuadorian Andes highlighting the location of the Cotopaxi volcano and Latacunga. Modified after [64].
Sustainability 13 01714 g001
Figure 2. (a) Location of the Cotopaxi volcano and the main drainages and populated centres. (b) Estimated lahar footprints in the southern drainage system from three scenarios as function of the VEI (Volcanic Explosivity Index). (c) Brief description of the eruption scenarios expected at Cotopaxi in terms of the VEI. Modified after [64,69].
Sustainability 13 01714 g002
Figure 3. (Left): Channel of the Cutuchi River in the city centre of Latacunga. An old textile factory is visible, which has been buried up to the forth story by the 1877 lahar. (Right): Thick sequence of lahar deposits, scoria flow deposits, and tephra beds exposed in a quarry along the Rio Saquimala close to Mulalo. (Photos: Theresa Frimberger, 2018).
Sustainability 13 01714 g003
Figure 4. (a) Population qualified for the survey to evaluate the social risk perception in the urban centre of Latacunga. (b) Sites to survey within the residential buildings. Modified after [75].
Sustainability 13 01714 g004
Figure 5. Graphical scale and correspondence between the pre-index value and the reduced index.
Sustainability 13 01714 g005
Figure 6. Example of the graphical representation of loss distribution due to ash fall scenario in the RIESGOS demonstrator (as of December 2020) from a previously selected VEI. Reddish and greenish aggregation areas representing higher and lower values, respectively. On top of these results, the lahar model (with the same VEI) is displayed as input to calculate the cumulative damage over the same geo-cells exposed to both perils.
Sustainability 13 01714 g006
Figure 7. Spatial representation of the perception of volcanic hazards in the urban centre of Latacunga in terms of (a) recurrence; (b) exposure level; (c) vulnerability; (d) resilience; (e) risk index calculated using the former components as inputs. Modified after [75].
Sustainability 13 01714 g007aSustainability 13 01714 g007b
Table 1. Hazard matrix and perception of risk factors towards natural hazards in the urban area of Latacunga.
Risk FactorsPerception of Hazard RecurrencePerception of ExposurePerception of VulnerabilityPerception of ResiliencePerception of Risk
Scale: 0–3Scale: 1–27
Natural HazardVolcanoes2.612.732.831.9310.45
Earthquakes2.582.752.771.989.93
Frost2.622.272.142.385.35
Drought2.332.272.232.325.08
Floods2.002.052.042.273.68
Landslides1.992.052.082.293.71
Publisher’s Note: MDPI stays neutral with regard to jurisdictional claims in published maps and institutional affiliations.

