Article

Risk Management for Defense SoS in a Complex, Dynamic Environment

1
Department of Industrial Engineering and Management, Ariel University, Ariel 40700, Israel
2
HIT—Holon Institute of Technology, Faculty of Management of Technology, Holon 50810201, Israel
*
Author to whom correspondence should be addressed.
Sustainability 2021, 13(4), 1789; https://doi.org/10.3390/su13041789
Submission received: 14 December 2020 / Revised: 29 January 2021 / Accepted: 1 February 2021 / Published: 7 February 2021
(This article belongs to the Section Sustainable Management)

Abstract

:
Identifying and assessing risk is one of the most important processes in managing complex systems and requires careful consideration. The need for an effective, efficient approach to risk management is considerably more important for defense industries, because they are exposed to risk in the early stages of development. This paper uses heterogeneity and homogeneity analysis between risk factors with Cochran’s Q test and multidimensional scaling in order to present the complexity of the risk factors relevant to defense systems of systems (SoSs), and it proposes a methodology for identifying, analyzing, and monitoring the risks that they face. Findings from an in-depth analysis of 46 classified defense SoSs shows a need to focus on three main risks faced by defense projects: insufficient human resources, changes in the original specifications, and lack of other (nonhuman) resources. The paper also presents some recommendations for minimizing risk factors in defense SoSs.

1. Introduction

Defense systems of systems (SoSs) can be defined as a collection of systems that exchange information and interact synergistically. Defense SoSs are characterized by the unique challenges facing the complexity of their systems, which must be developed rapidly using daring innovation and technological ingenuity. Moreover, in the defense arena, SoSs must meet sophisticated challenges on the battlefield.
Unlike projects in a stable environment, defense SoSs are characterized by a dynamic environment in which managers must react quickly and organizations must be flexible to respond. Technology, consumer requirements, laws and regulations, political leaders, and international conditions are all changing rapidly and dramatically in the defense arena. Moreover, in the defense highly complex environment, there are many variables that are hard to identify and measure. In this complex environment, small changes in one factor can produce a major change in another. Conditions of instability and complexity in the defense arena intensify the impact of systematic risk management of defense SoSs.
Defense SoSs require a systematic management of risks, which limits risk disruptions and their propagation throughout the systems. Therefore, risk management is one of the most important areas that must be considered when managing defense SoSs.
All systems have some level of inherent risk because of the uncertainty that accompanies any new endeavor. In defense industries, a riskier system leads to a higher payoff. Thus, risk is sometimes beneficial because it has the potential to increase profits.
Successful management of defense SoSs requires functioning in a dynamic, rapidly changing reality, in which risk assessment and prioritization may present complex challenges.
The purpose of this article is to define and examine the risks faced by classified defense SoSs. The outcomes from the study can help project managers and systems engineers of these and similar SoSs minimize delays and reduce risks.

2. Literature Review

The Project Management Institute includes risk management as a key process defined in the Project Management Body of Knowledge (PMBOK). Project risk management includes the following processes: conducting risk management planning, identification, analysis, response planning, and risk control. The objectives of project risk management are to increase the likelihood and impact of positive events and decrease the likelihood and impact of negative events in any given project [1].
The literature includes several suggestions for describing the process of risk management. For example, Fairley [2] presented seven steps: (1) identify risk factors; (2) assess risk probabilities and effects; (3) develop strategies to mitigate identified risks; (4) monitor risk factors; (5) invoke a contingency plan; (6) manage the crisis; (7) recover from the crisis.
Boehm [3] described a process with two main phases: risk assessment, which includes identification, analysis, and prioritization, and risk control, which includes risk management planning, risk resolution, and risk monitoring planning, tracking, and corrective action. Similar to Deming’s quality improvement cycle (plan, do, check, act), Kliem and Ludin [4] suggested a four-phase process (identification, analysis, control, and reporting). According to International Organization for Standardization 31000, risk management creates and protects value [5].
Several popular risk management analysis techniques have been reported in the literature, including Monte Carlo simulation [6], analytical hierarchy process [7,8], and fuzzy set theory [8,9]. There is much evidence in the literature that using risk management tools when managing a project creates value for its outcome and success [10,11,12]. On the other hand, some researchers did not find any effect [13] or found that the effect was negligible [14,15]. Moreover, many studies are dedicated to the application of project management in specific sectors; thus, the practices and techniques they present are not necessarily applicable to risk management of projects in other fields [16,17,18,19,20,21,22,23,24,25,26,27].
The identification of risk factors might be influenced by the sector and area of the project. For example, the key risk factors of public–private partnership (PPP) projects are divided into two categories. The first includes risk factors that have powerful, independent influences, such as delays in government approval, government credit, and imperfect legal and regulatory systems. The second category includes risk factors that are highly variable and easily influenced, such as completion risks, insufficient revenue in the market, and fee changes [28].
Ameyaw and Chan [29] mentioned other risks factor such as market/revenue risks, financial risks, relationship risks, and social risks. According to Lessard [30], risk management requires systematic management of risks that are generated within each link in the chain and, more importantly, in the interfaces among links in order to limit disruptions and their propagation throughout the system. Effective management of risk, therefore, requires a systems thinking approach—understanding how systems influence one another within a whole.
According to Naaman [31], the risk management process has become an inseparable part of management procedures for defense projects, for which uncertainty management is one of the main challenges of ongoing project planning and management. Moreover, in response to dangerous events, such as plane crashes or takeoff failures, safety requirements in the defense industry are strict, rigorous, and demanding.
The PMBOK guide [1] distinguished between risk and uncertainty. A risk is an unplanned event that may affect one or some of project objectives if it occurs. Conversely, uncertainty refers to a condition where the future events are not known.
Figure 1 shows that, at the beginning of the project, the cost of changes is low; costs go up the more the project advances. At the same time, we can see that the effect of uncertainty and risk at the beginning of the project is higher; the more the project advances, the more these values decrease [1].
There are two types of uncertainty in complex projects such as defense projects:
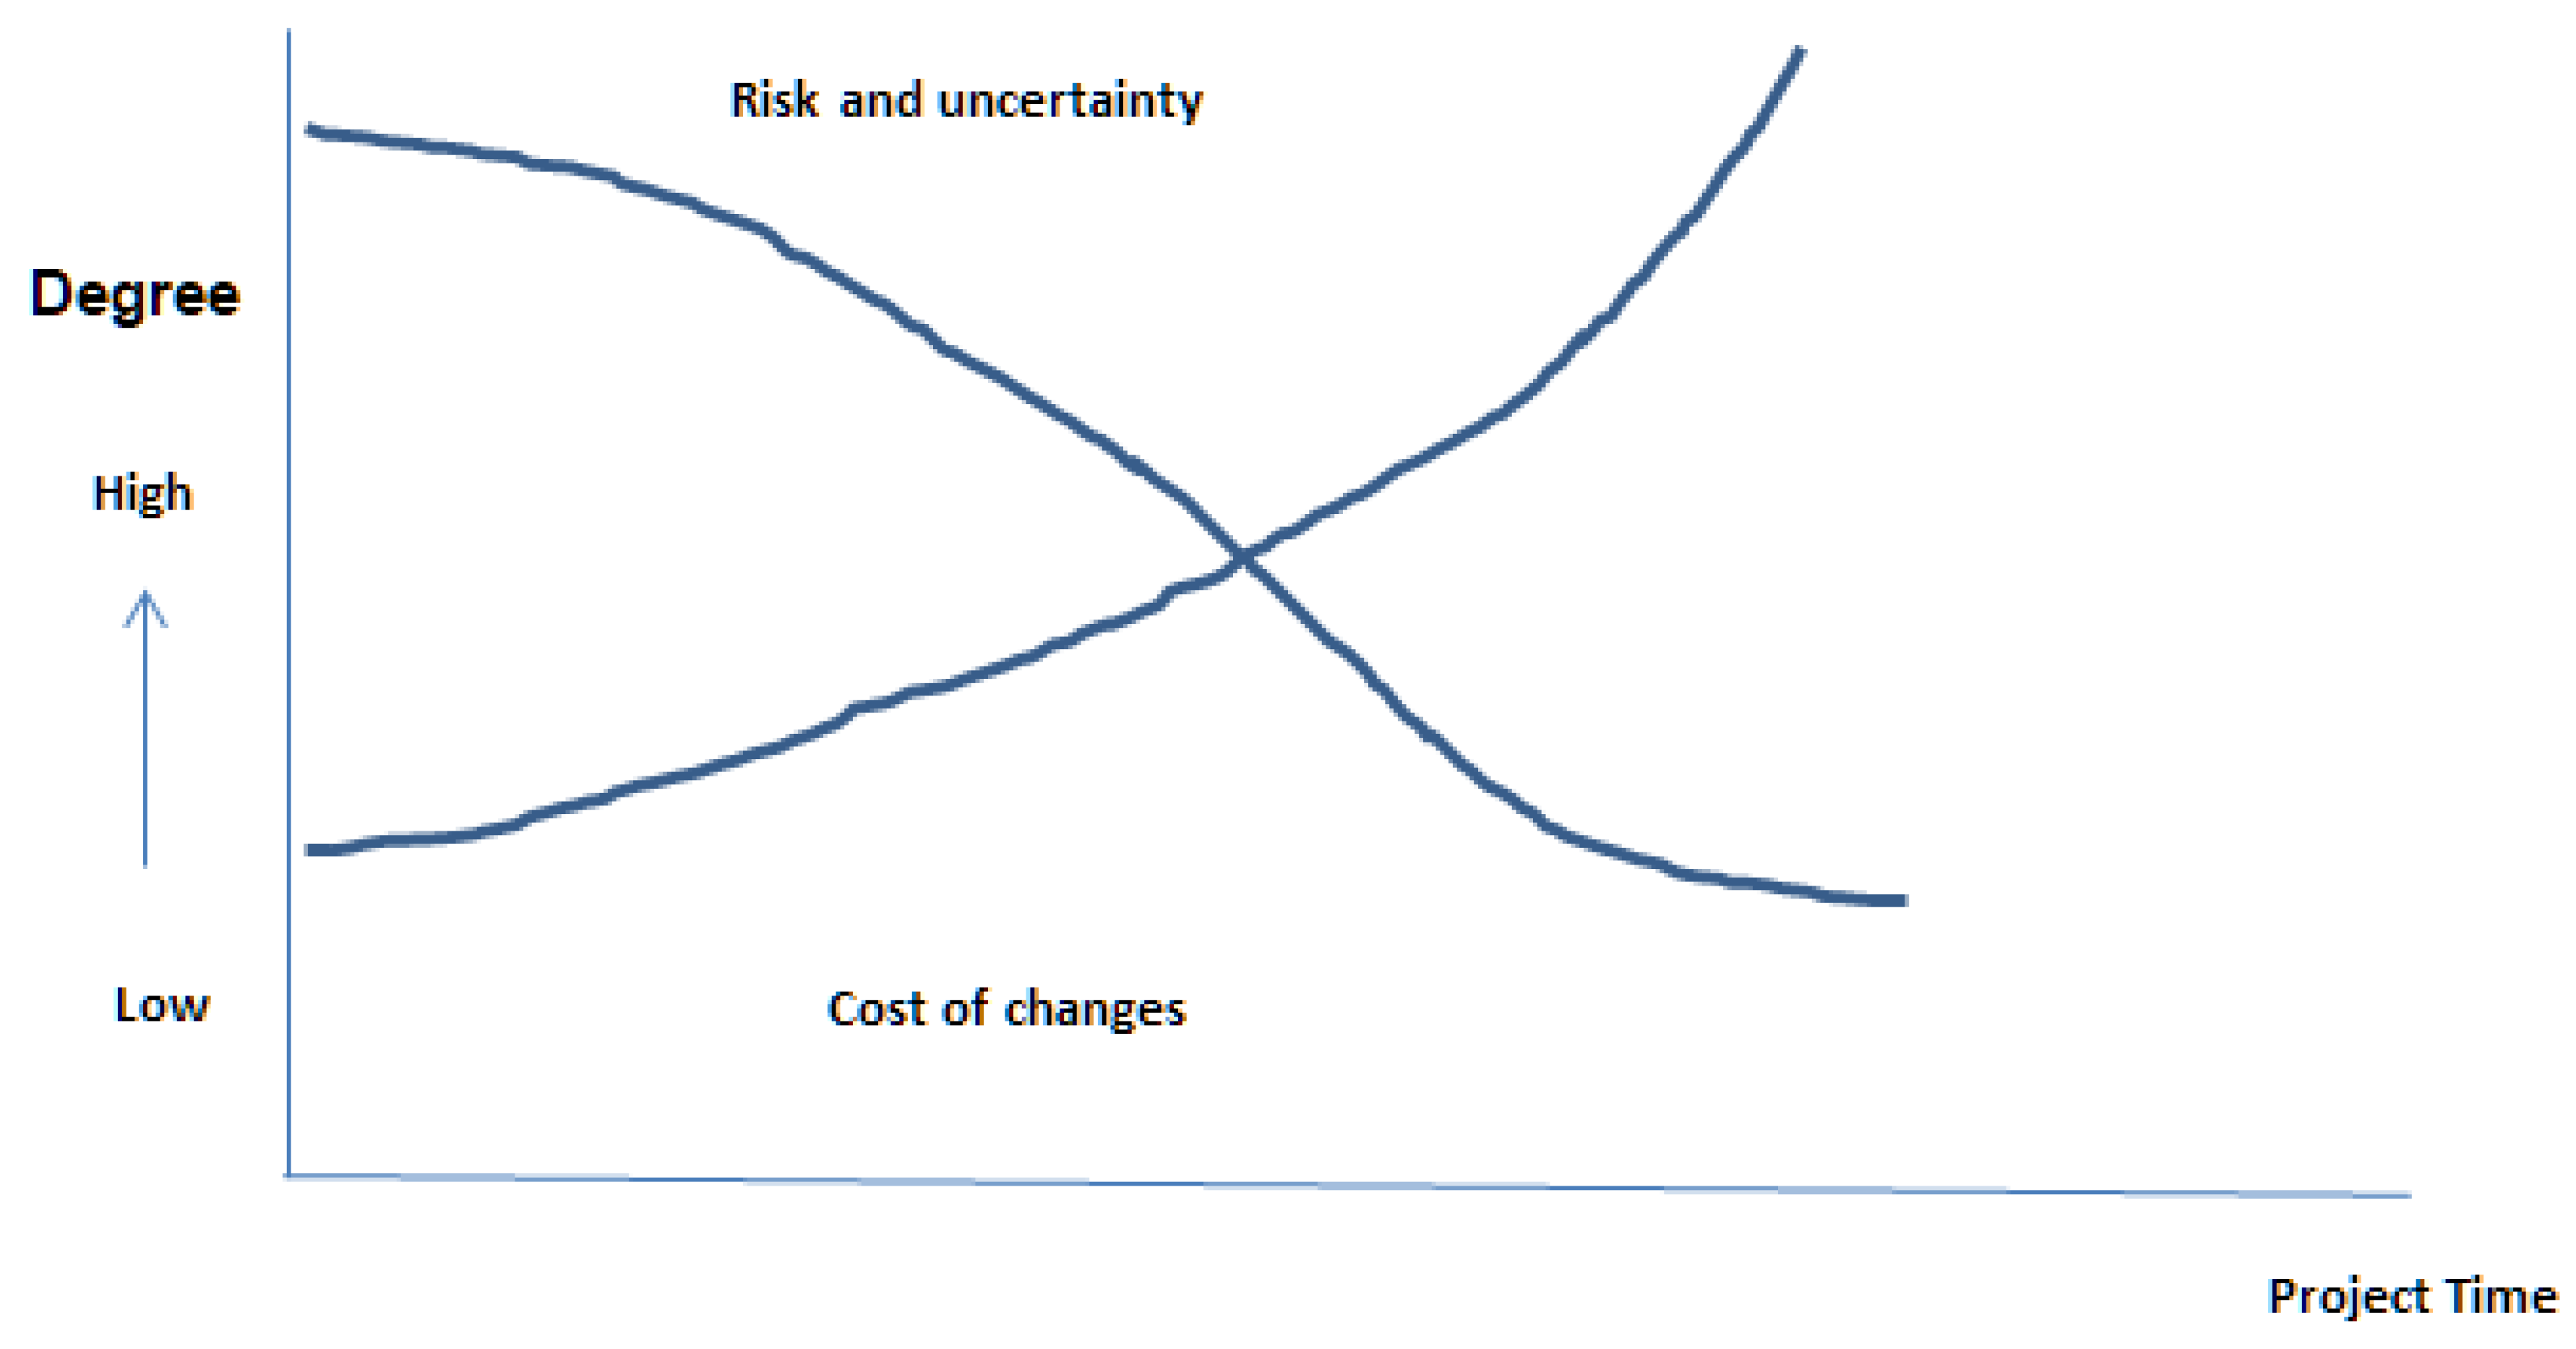
  • Uncertainty that can be predicted in advance: It is possible to cope with this type of uncertainty by using an organized methodology, as presented in PMBOK [1]. For every stage of the project, there is an organized process that includes determining the project’s leading players, and defining inputs and outputs. Risks that stem from uncertainty may be managed making a plan to minimize them.
  • Uncertainty that cannot be predicted in advance: In response to this possibility, buffers are defined in the schedule, budget, and statement of work (SOW), which provide leeway for dealing with unexpected changes.
According to ISO standards [5], there are certain limitations on projects managed under constraints such as timeframes for project completion, human resources, and activities that are dependent on the results of other activities. Wang [32] defined risk as a factor or action that might occur unexpectedly and, as a result, cause physical harm, damage assets, or delay the timetable. Risk is measured according to the likelihood of occurrence, the technical, programming, or managerial level, and the amount of potential damage that could result from the failure to prevent its occurrence.
Engineering projects are frequently characterized by extensive scope and budget; in many cases, they include manufacturing for a specific customer according to specific needs. These characteristics intensify the importance of the risk management process, because every unplanned event that occurs, which was not considered from the outset, could potentially have significant effects on the project’s success and compliance with requirements [33].
According to Naaman [31], the risk management process in defense projects includes five stages:
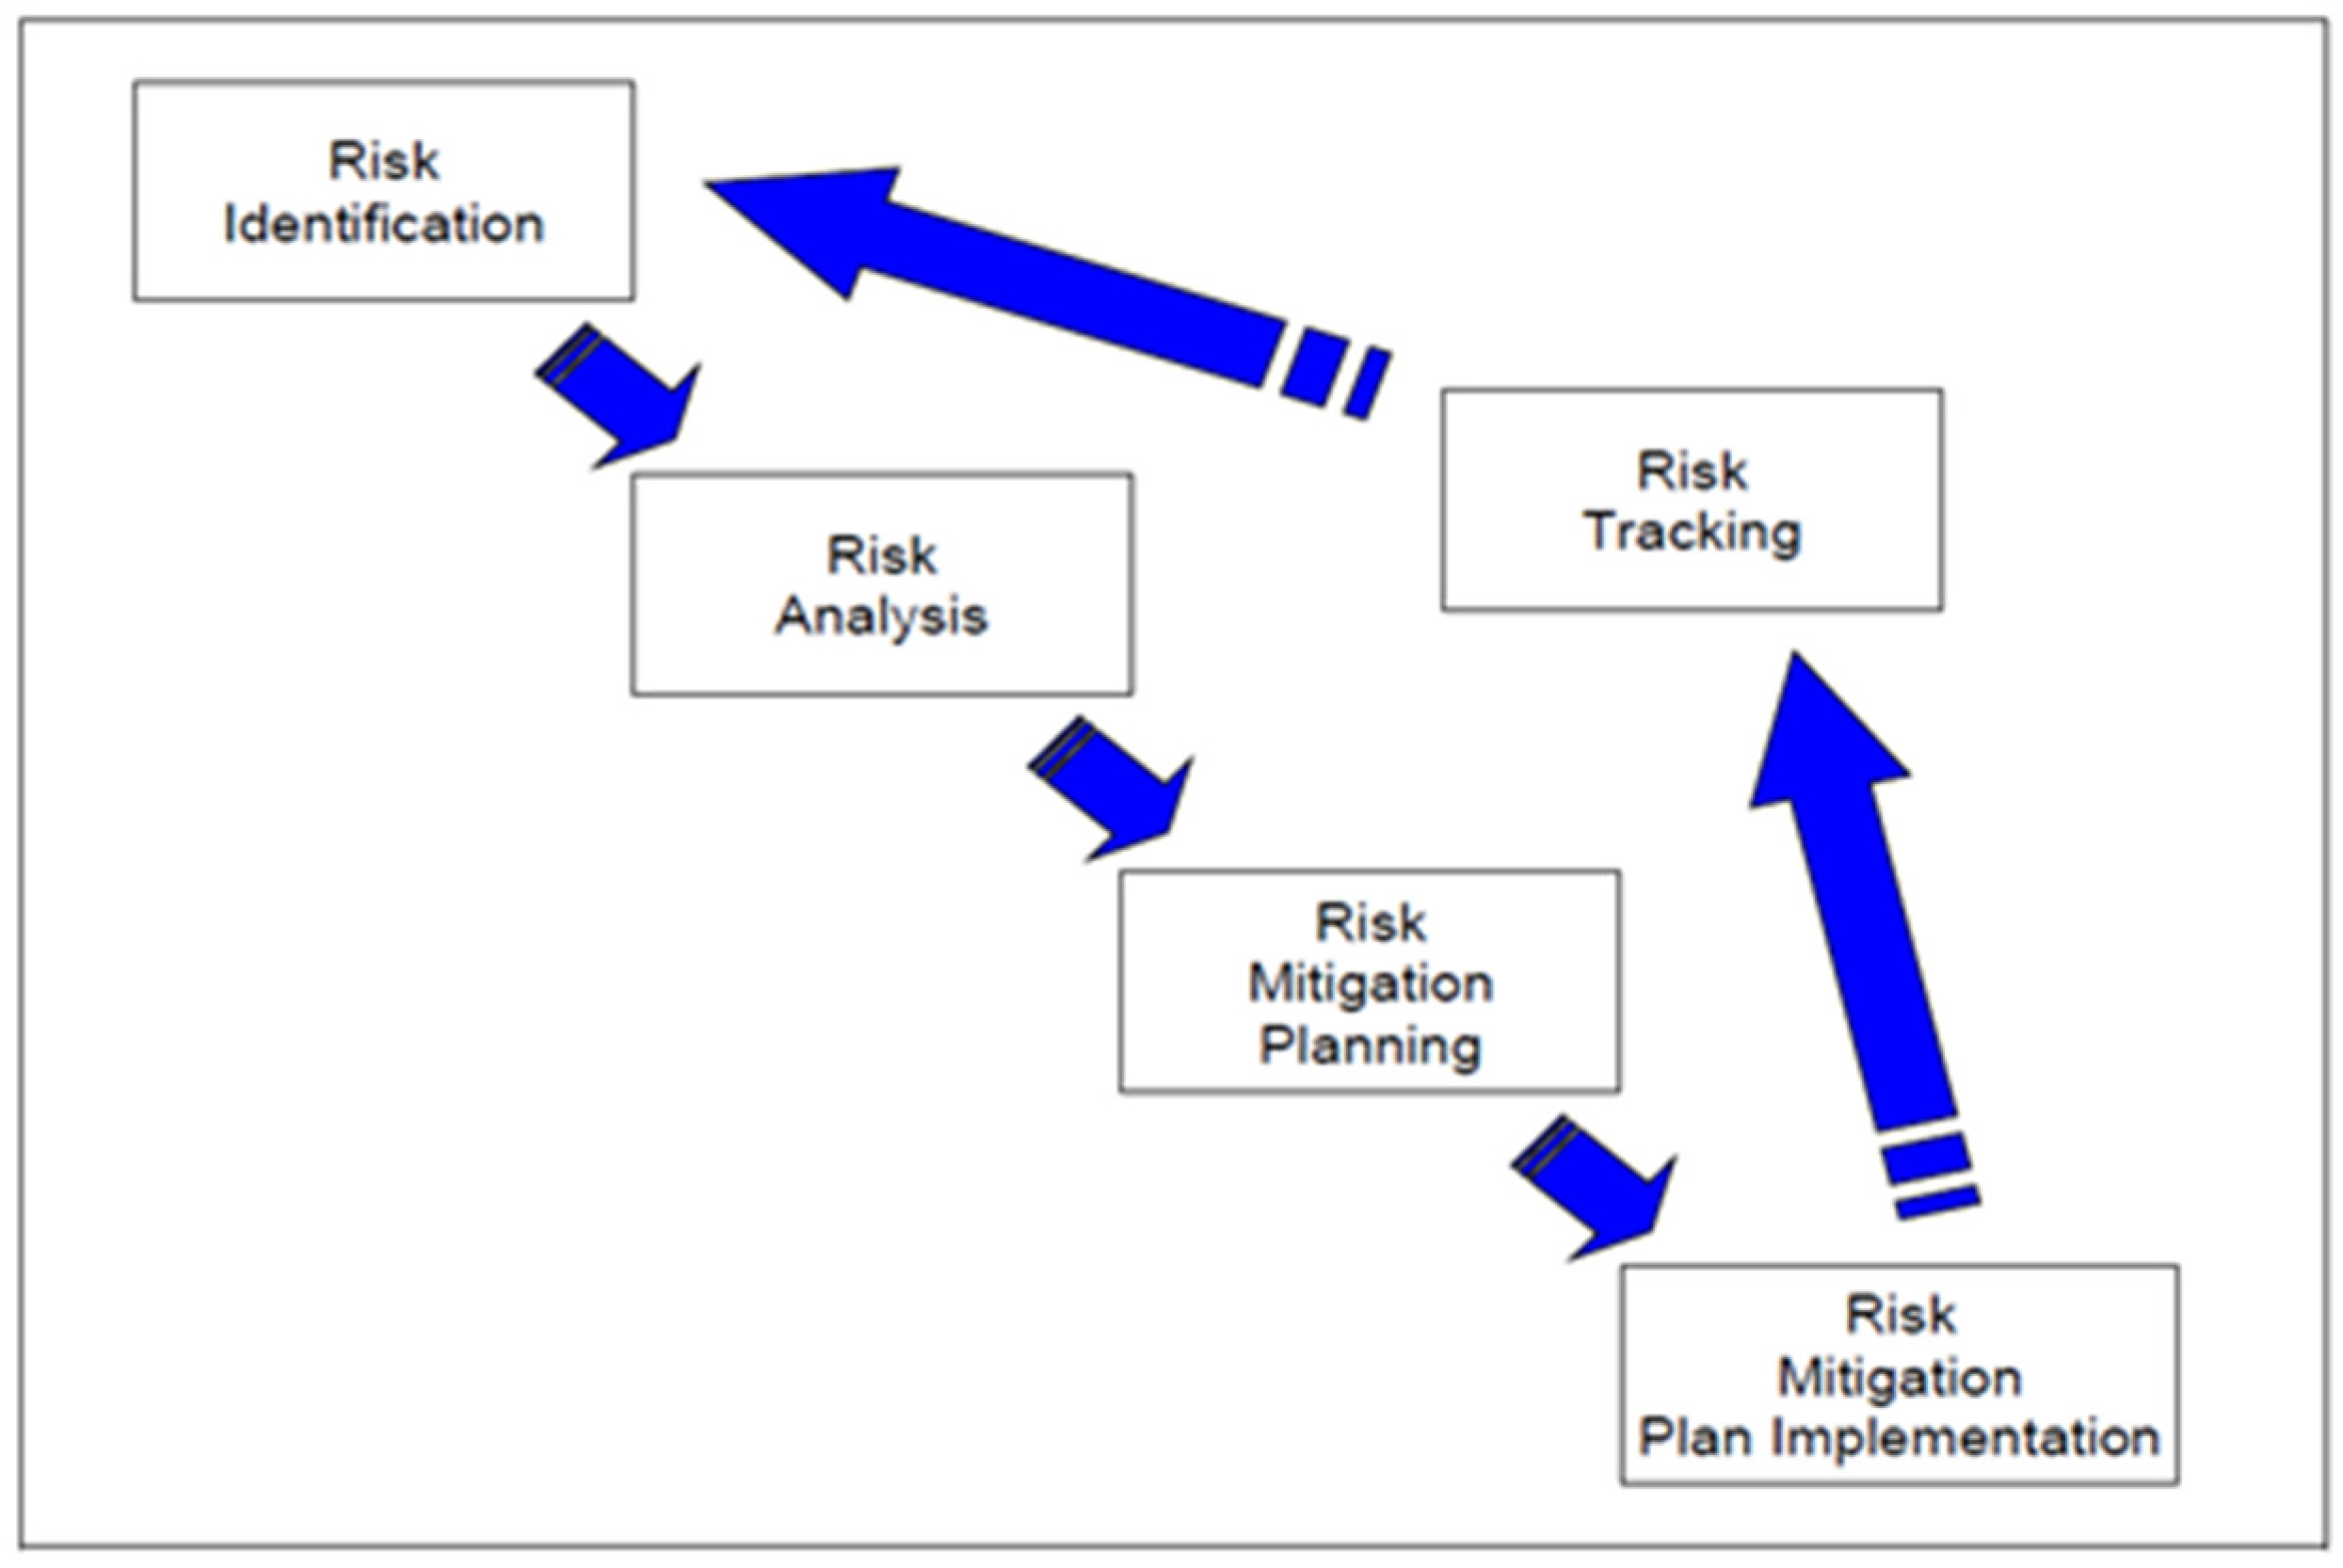
  • Identifying risks using brainstorming;
  • Analyzing the meaning and level of each risk, including assessments of severity, probability, and risk level;
  • Risk factor analysis and defining responses, including a contingency plan;
  • Risk presentation for authorization purposes;
  • Monitoring and remeasuring the risk, including ongoing risk supervision.
The United States (US) Department of Defense (DoD) [34] defined risk management as an interactive process, as shown in Figure 2.
The PMBOK [1] presents six ways to cope with project risks, which are similar for many types of projects:
  • Risk survey—the goal of a risk survey is to reach an agreement about the risk level and ways to cope with each risk factor;
  • Preemptive action—to be carried out in advance, usually at the earliest possible stage, with the goal of minimizing occurrence of the risk to the lowest possible level;
  • Mitigation action—an action that should be carried out immediately upon the occurrence of a risk, with the goal of minimizing the extent of the damage caused;
  • Corrective action—an action that must be carried out after the risk occurs, with the goal of returning the situation to its pre-risk state;
  • Transferring the risk—transferring responsibility for the risk and its treatment to another party;
  • Accepting the risk—taking a calculated risk, and deciding not to take any action.
Chris and Stephen [35] wrote that, for every activity in a project, it is necessary to clearly define who is responsible, create a work schedule, and make sure to integrate them into the work plan. Risk must be managed throughout the entire project’s lifespan in order to reduce the effects of the risks on meeting the project’s targets at all stages, including its conclusion. In engineering projects, responsibility for the risk management process is usually shared by two individuals: the systems engineer and the project manager [36,37,38].
Kordova, Katz, and Frank [39] studied the management processes shared by project managers and systems engineers in the defense industry, and they provided recommendations for joint project management that leads to project success. Figure 3 shows the division of responsibility for risk management between the systems engineer and the project manager, as well as how their efforts mesh.
According to Kordova, Katz, and Frank [39], project risks include management-related risks (e.g., cost or organizational expenses), as well as technical/engineering risks (e.g., specifications, performance demands, and premature technology). During the project, there are joint discussions about risks, they are ranked, and a risk minimization plan is developed. Project managers usually integrate all risks, while systems engineers are generally responsible for identifying and managing only technical risks. However, technical risks often have managerial consequences, because risk minimization plans generally include the allotment of resources (schedule/budget) that are managed by the project manager.
The projects analyzed in the current paper are all defense classified systems of systems (SoSs). SEBok [40] defined an SoS as a set of systems or system elements that interact to provide a unique capability that none of the constituent systems could accomplish on their own. A similar definition was previously suggested by Maier [41], who defined an SoS as a collection of task-oriented systems that pool their resources and capabilities to create a new, more complex system that offers additional functionality and performance beyond simply the sum of the constituent systems.

3. Methodology and Research Design

The research paradigm combined analytical, quantitative, and qualitative methods, as presented in Figure 4. The qualitative research started as an exploratory study. The analytical component included assessing both primary (testimony of engineers and project managers that were involved in the classified projects) and secondary (literature) sources. The quantitative component included data collection from 46 classified defense SoSs in the Air Force. Figure 4 represents the research design.

3.1. The Exploratory Stage

The qualitative research started as an exploratory study, consisting of 10 semi-structured interviews with professionals who participated in classified defense SoSs in the Air Force. The interviewees included project officers, flight crews, pilots, project managers, and systems engineers, who were asked about the projects they participated in and these projects’ risk factors, the association between project budget and the extent of deviation from the planned schedule, and the connection between different risk factors and project scheduling delays. After recording and summarizing the interviews, content analysis was performed, and a triangulation process was conducted in order to confirm each finding presented in the report which was mentioned by three or more interviewees, to ensure trustworthiness.

3.2. The Survey

On the basis of the results from the interviews, a survey was developed to examine the risk factors faced by defense SoSs in the Air Force. Its goal was to determine the segmentation of risk factors for these systems.
A pilot questionnaire was first distributed to 10 experts in project management, including senior systems engineers and a professor of industrial engineering, for their evaluation. On the basis of their responses and comments, a final version of the survey was created. In order to validate the final version of the survey, a pilot group was selected to complete the questionnaire. The data, thus, collected included the organization’s risk management methodology, the most common risk factors in defense systems, and the main characteristics of organizations that manage to avoid the occurrence of risks. The data collected by the survey included the most common risk factors in defense systems. During the survey, each respondent was asked to select the five most common risk factors in defense systems from the following list:
  • Risk factor 1: Failure to maintain risk management processes;
  • Risk factor 2: Delays in supporting infrastructure;
  • Risk factor 3: Cultural differences among system members;
  • Risk factor 4: Overly optimistic scheduling assessment;
  • Risk factor 5: Insufficient human resources;
  • Risk factor 6: Lack of other (nonhuman) resources;
  • Risk factor 7: Lack of system team’ previous experience;
  • Risk factor 8: Lack of system stakeholders’ previous experience;
  • Risk factor 9: Too many stakeholders influencing the system;
  • Risk factor 10: Complexity of the military operation;
  • Risk factor 11: Research and development (R&D) required in a new field/area;
  • Risk factor 12: Overlap between different system processes;
  • Risk factor 13: Changes in the original specifications;
  • Risk factor 14: Gap in knowledge management;
  • Risk factor 15: Dependence on other factors.
In the first stage of statistical analysis, frequencies of the risk factors faced by 46 defense systems were counted. In the second stage, heterogeneity and homogeneity between the risk factors were calculated using Cochran’s Q test and I2 statistic. In the third stage, multidimensional scaling was performed. In the fourth stage, hierarchical cluster analysis was performed.

4. Results

4.1. Findings of the Exploratory Study (Interviews)

The risk factors faced by defense SoSs, as reported by the interviewees and confirmed by the triangulation process, are as follows:
  • The quality and quantity of human resources are critical factors in the development process; an insufficient workforce is a significant risk in the defense industry.
  • The dynamics of defense industries often makes it necessary to shorten the time-to-market, even though development processes are usually very time-consuming.
  • Too many stakeholders are involved, influencing one another, in addition to many parties from external companies working on the system and interdependent on one another.
  • Additions to the statement of work (SoW) and/or changes to the system’s initial design.
  • The tendency to change roles/jobs once every 2–3 years in the military may create a sense of partial commitment and an “until the end of my term” attitude toward the system. This may also cause project managers to commit to challenging SoWs and schedules.
  • A bigger system budget leads to more potential risks.
  • The risks that cause schedule delays can be divided into two types: insufficient planning/management and resource constraints (mainly workforce and budget-related).

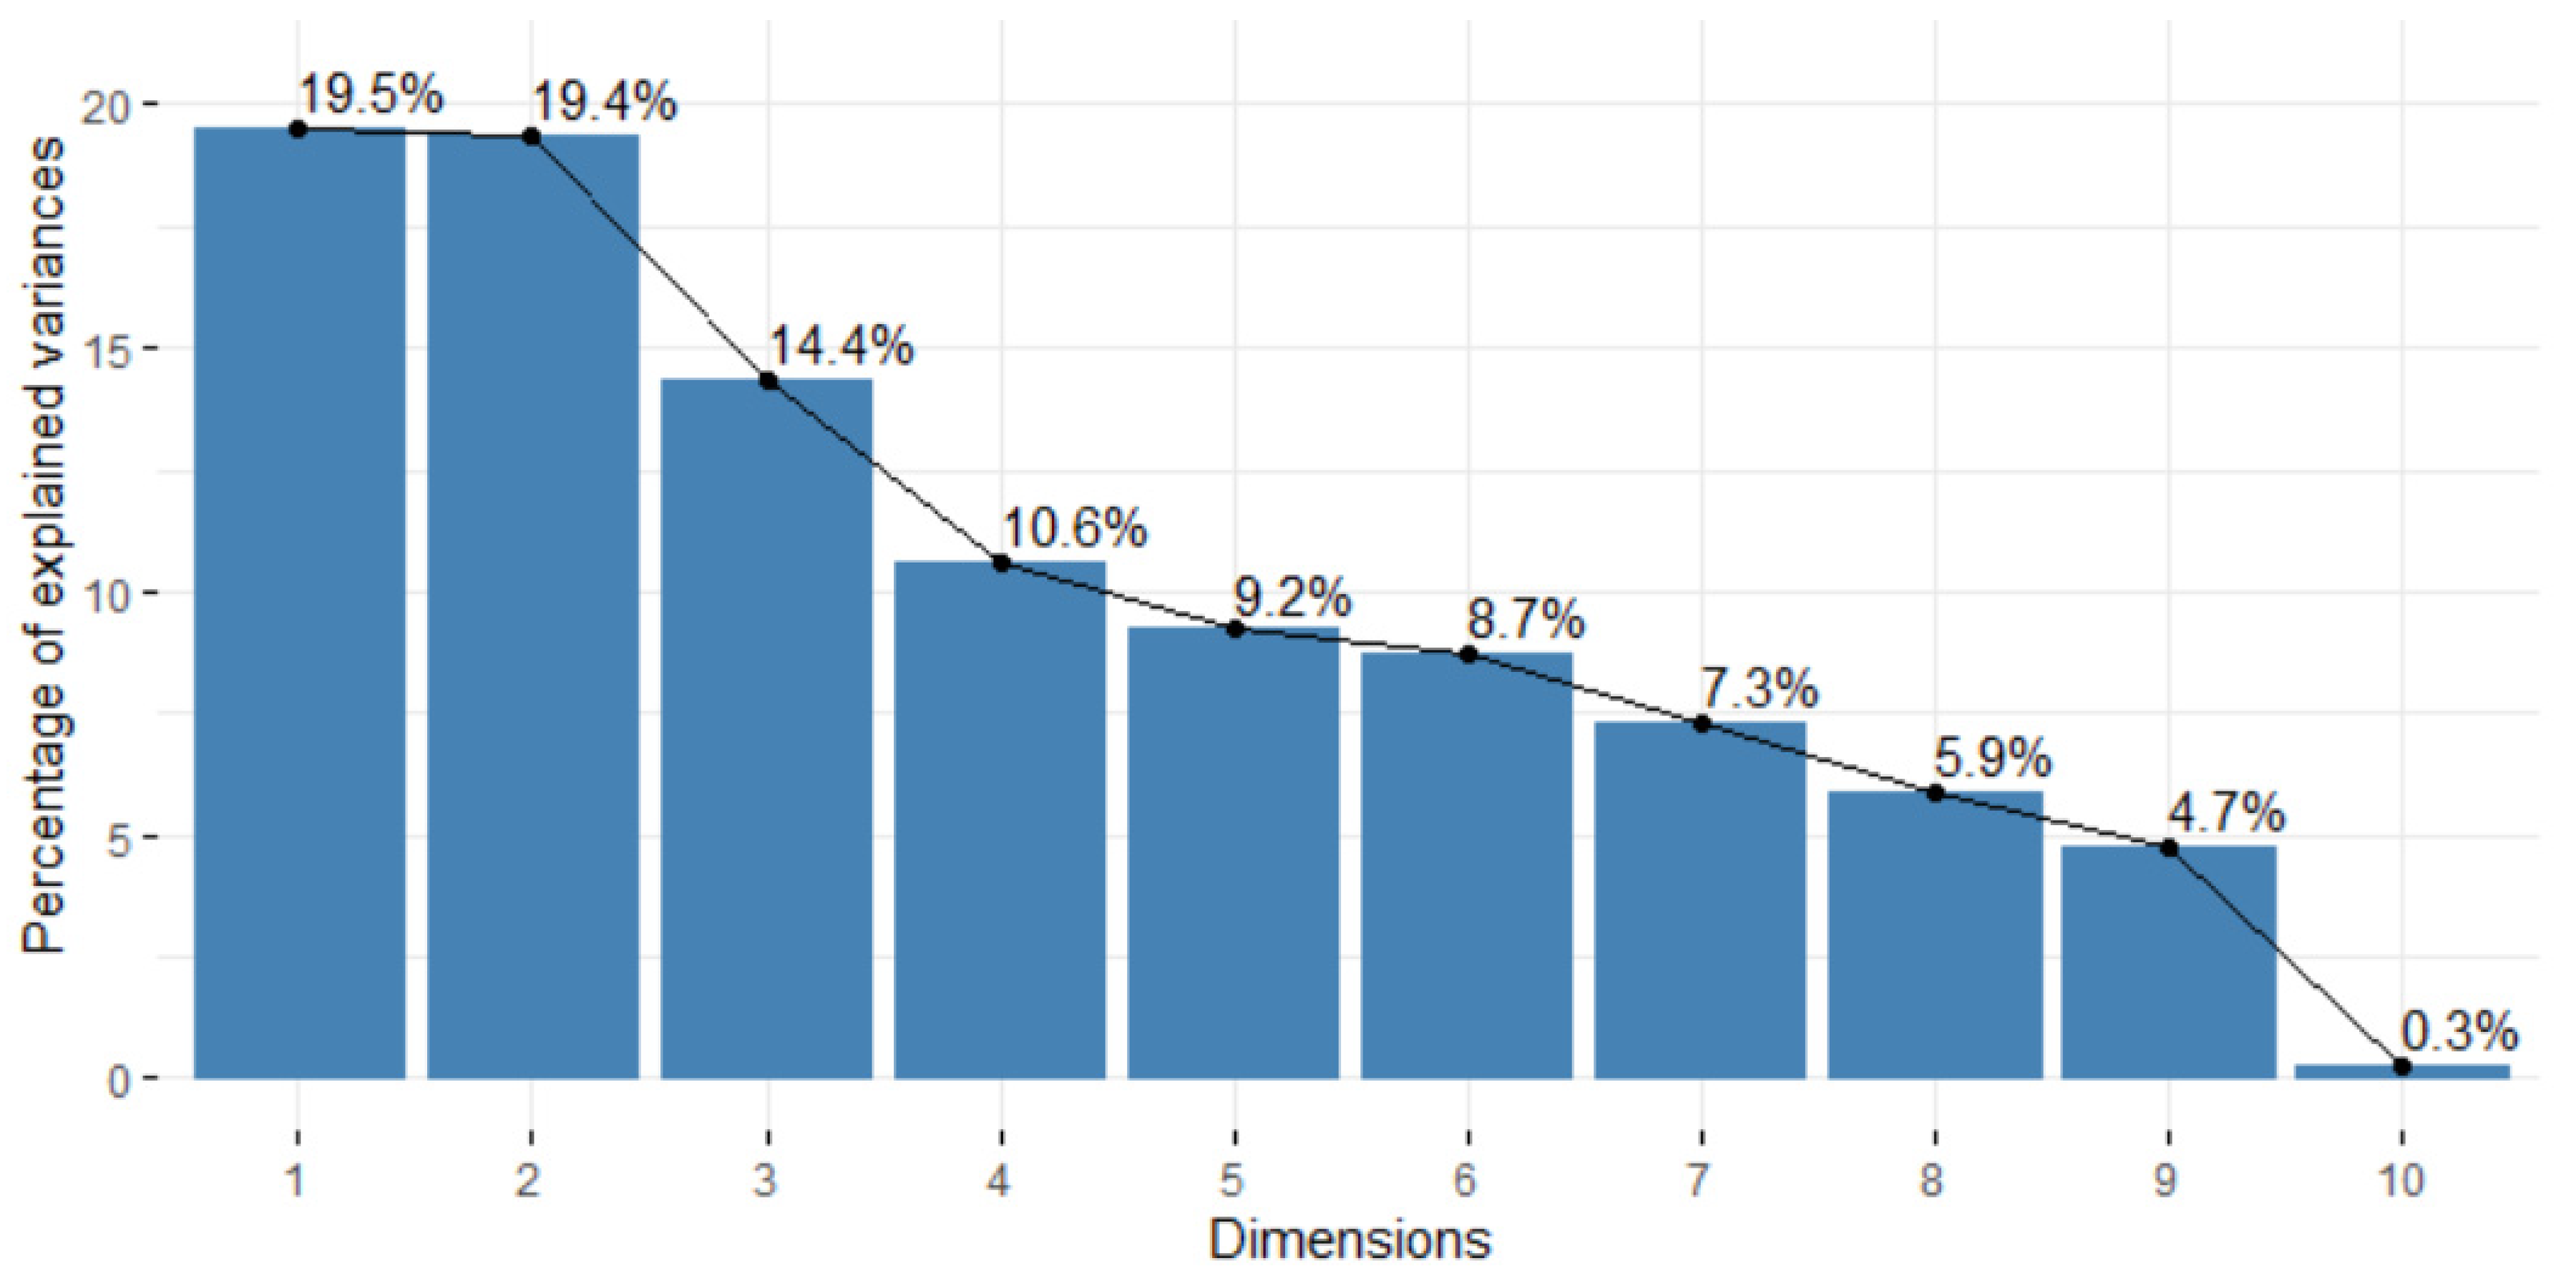
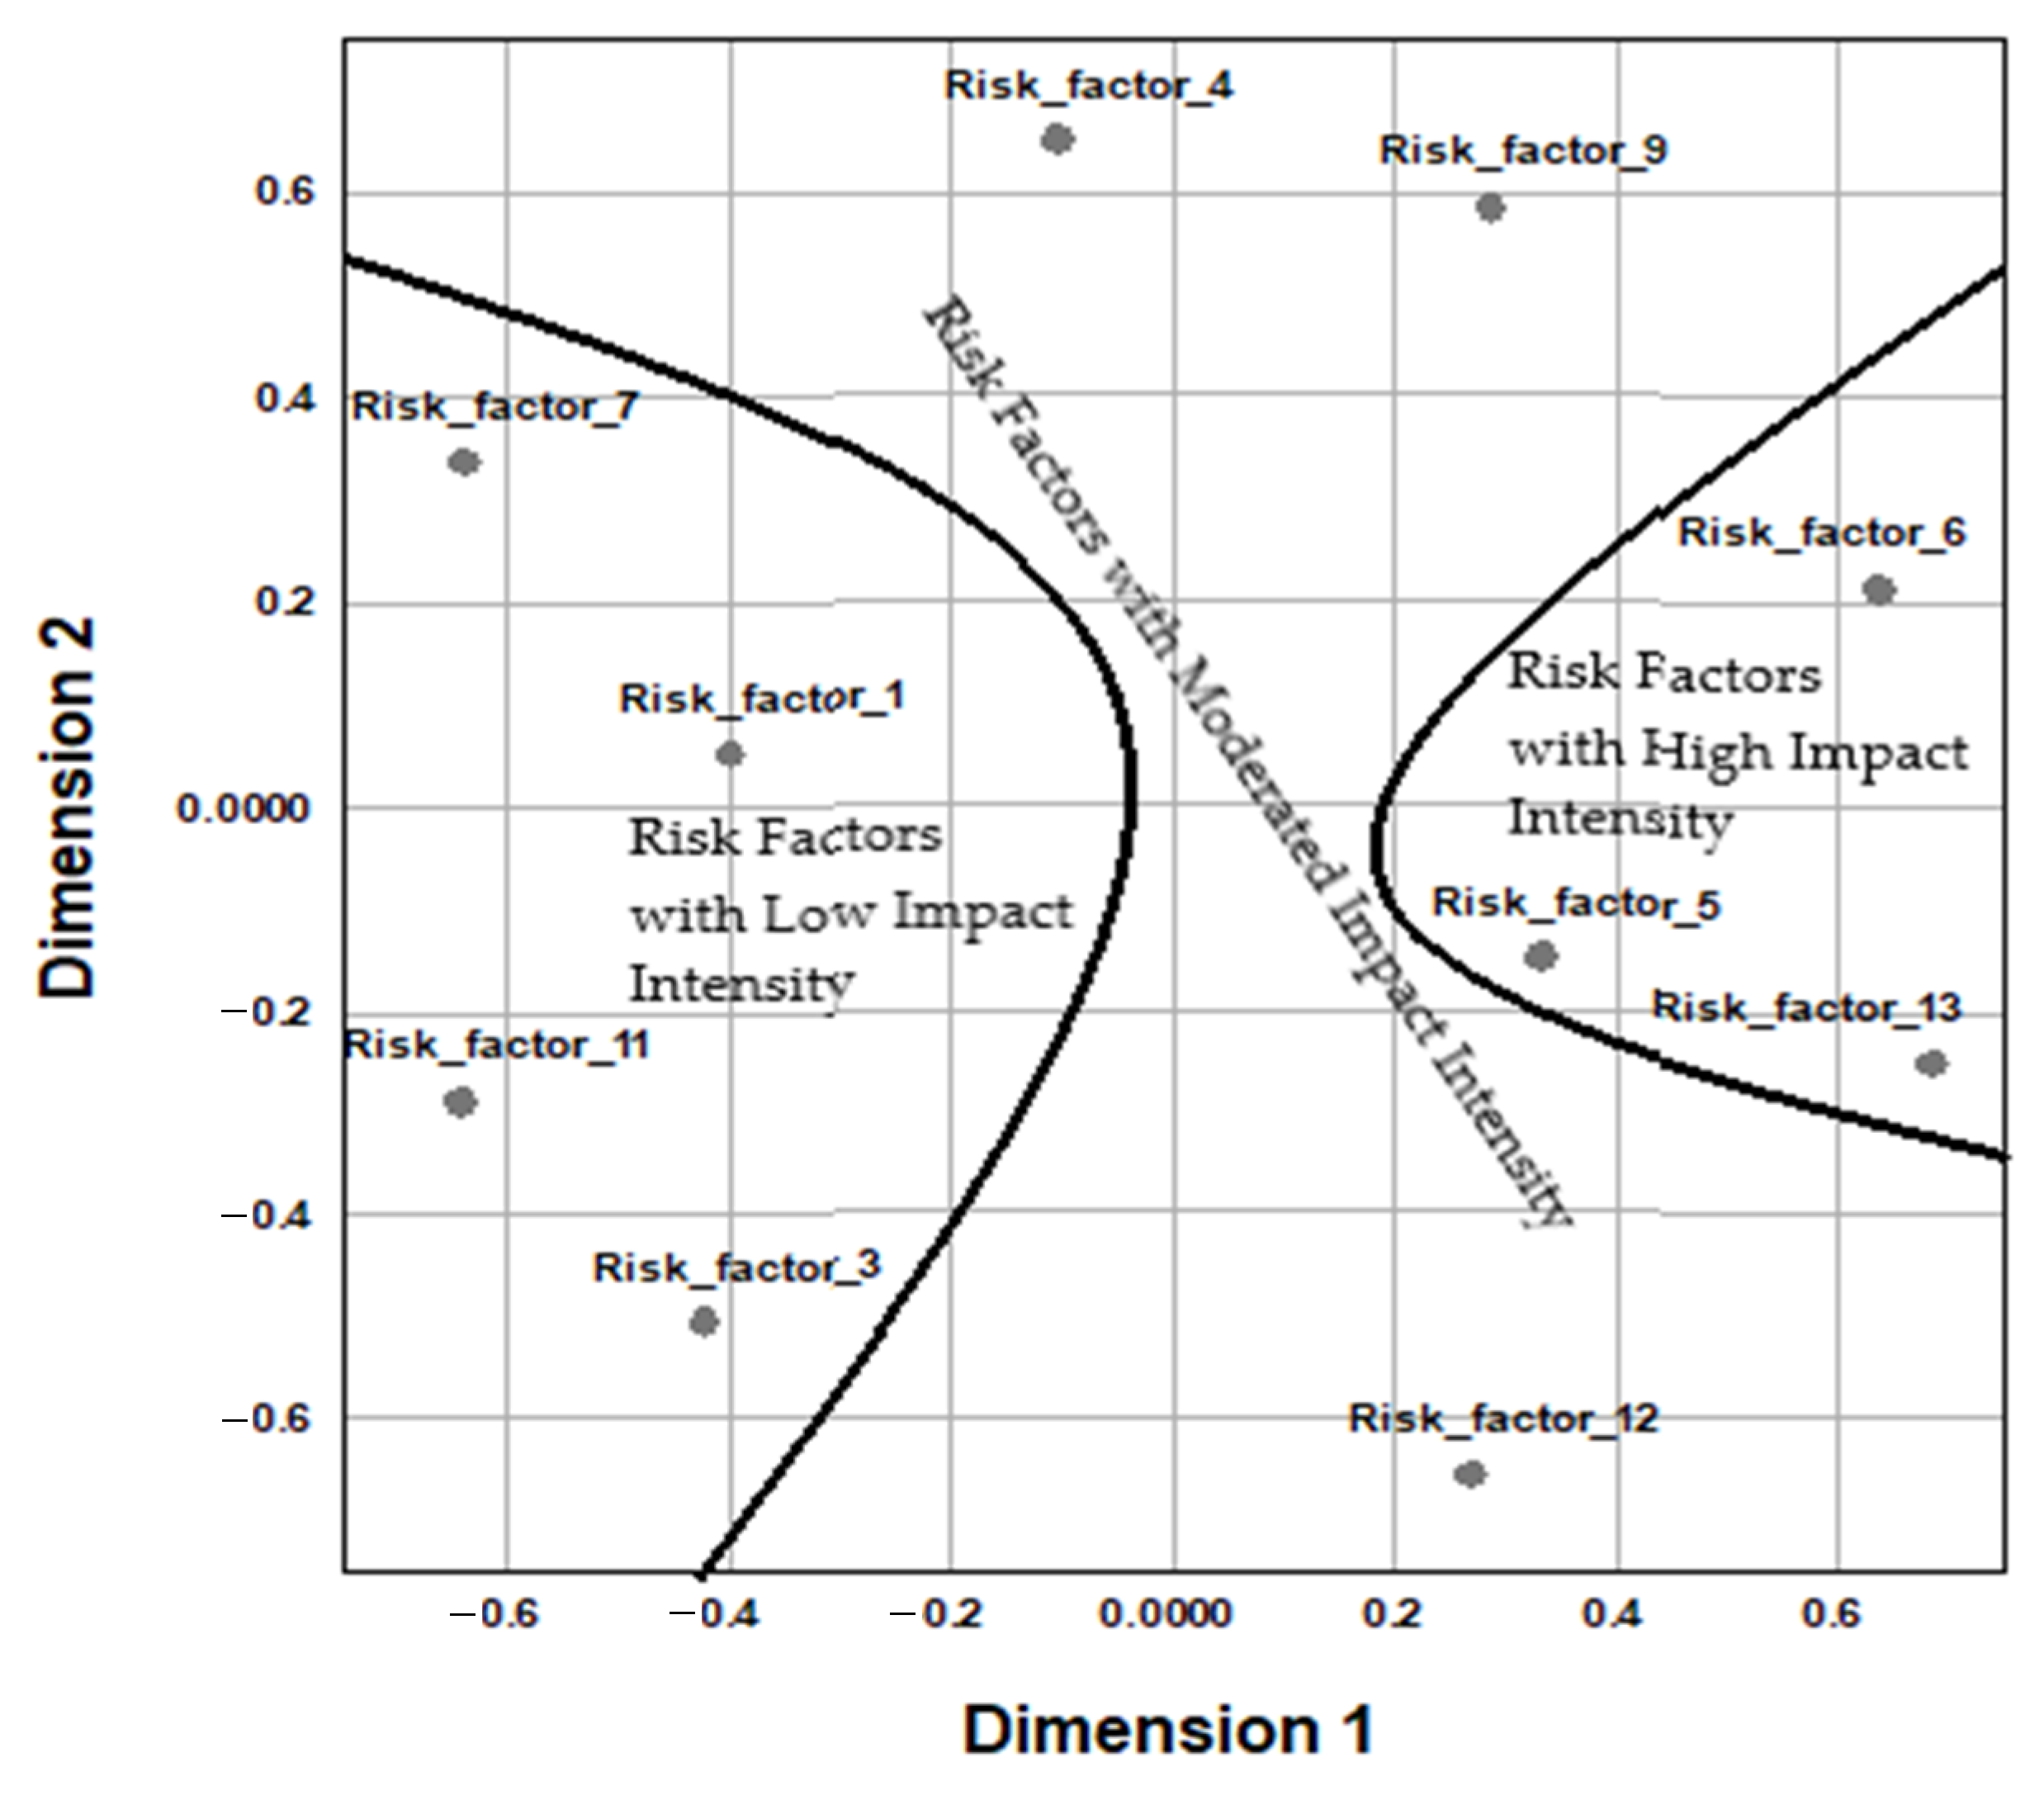
4.2. Findings from the Survey

In the first stage, frequencies of the risk factors faced by 46 defense SoSs are presented. Figure 5 presents the bar chart (frequencies) of the risk factors faced by these defense SoSs.
According to Figure 5, the seven most common risk factors faced by the defense SoSs surveyed were risk factor 5 (insufficient human resources), risk factor 13 (changes in the original specifications), risk factor 6 (lack of other (nonhuman) resources), risk factor 12 (overlap between different system processes), risk factor 4 (overly optimistic scheduling assessment), risk factor 9 (too many stakeholders influencing the system), and risk factor 7 (lack of system team’ previous experience)
In the second stage, heterogeneity and homogeneity between the risk factors were evaluated using Cochran’s Q test and I2 statistic. Table 1 lists (in descending order) the proportion of each of the 10 risk factors (risk factors 2 (delays in supporting infrastructure), 8 (lack of system stakeholders’ previous experience), 10 (complexity of the military operation), 14 (gap in knowledge management), and 15 (dependence on other factors) were not included in the analysis because respondents mentioned them only once).
Next, in the framework of heterogeneity, we conducted a Cochran’s Q test and calculated the I2 statistic (risk factors 2, 8, 10, 14, and 15 were not included in the analysis because respondents mentioned them only once). As part of Cochran’s Q test, pairwise comparisons were conducted with a Bonferroni-adjusted alpha level of 0.005 (0.05/10), in order to detect heterogeneity. The findings of Cochran’s Q test can be seen in Figure 6, which shows the pairwise comparisons in an explicit configuration. All of the blue lines represent significant difference between one risk factor’s frequency and another’s adjusted by the Bonferroni correction for multiple tests. All of the red lines represent significant difference between one risk factor’s frequency and another’s not adjusted by the Bonferroni correction for multiple tests.
The pairwise comparisons show that risk factor 5 was noted significantly more by the respondents than risk factor 7 (lack of system team’s previous experience; frequency = 19), risk factor 11 (R&D required in a new field/area; frequency = 13), risk factor 1 (failure to maintain risk management processes; frequency = 13), and risk factor 3 (cultural differences among system members; frequency = 6). Therefore, we propose that it is the most crucial risk factor. Similarly, risk factor 13 (changes in the original specifications; frequency = 35) and risk factor 6 (lack of other (nonhuman) resources; frequency = 31) were noted significantly higher by the respondents than risk factor 1 (failure to maintain risk management processes; frequency = 13), risk factor 11 (R&D required in a new field/area; frequency = 13), and risk factor 3 (cultural differences among system members; frequency = 6), making risk factor 13 and risk factor 6 second in importance. In addition, risk factor 12 (overlap between different system processes; frequency = 26) was noted significantly higher by the respondents than risk factor 3 (cultural differences among system members; frequency = 6), making risk factor 12 third in importance.
Additionally, as part of Cochran’s Q test, in order to detect homogeneity, stepwise step-down analysis was conducted based on asymptotic significances. Table 2 presents the findings of the stepwise step-down analysis.
The stepwise step-down analysis showed that there are two subsets of risk factors. Subset 1 was characterized by risk factors 7 (lack of system team’ previous experience), 11 (R&D required in a new field/area), 1 (failure to maintain risk management processes), and 3 (cultural differences among project members). The proportions of these risk factors ranged from 0.13 to 0.413, which converged to a group of risk factors whose proportions were significantly smaller than the proportions of the group of risk factors belonging to Subset 2. The group of these risk factors was called “risk factors with low impact intensity”.
Subset 2 was characterized by risk factors 5 (insufficient human resources), 13 (changes in the original specifications), and 6 (lack of other (nonhuman) resources). The proportions of these risk factors ranged from 0.674 to 0.783, which converged to a group of risk factors whose proportions were significantly higher than the proportions of the group of risk factors belonging to Subset 1. The group of these risk factors was called “risk factors with high impact intensity”.
Risk factors (risk factor 9: too many stakeholders influencing the system, risk factor 4: overly optimistic scheduling assessment, and risk factor 12: overlap between different project processes) whose proportions ranged from 0.5 to 0.565 adjoined the two groups “risk factors with low impact intensity” and “risk factors with high impact intensity”. This group of risk factors was called “risk factors with moderated impact intensity”.
To validate the findings, which were based on Cochran’s Q test, multidimensional scaling was performed. First, it was decided how many dimensions the solution should have. The scree plot in Figure 7 helped make this decision.
The procedure began with a 10-dimensional solution and worked down to a two-dimensional solution. The scree plot shows the normalized raw stress of the solution at each dimension. It can be seen from the plot that increasing the dimensionality from two to three and from three to four offered large improvements in the stress. After dimension four, the improvements were rather small. Therefore, it was decided to analyze the data using a two-dimensional solution, because the results were easier to interpret.
The common space plot (Figure 8) gives a visual representation of the relationships between the objects.
Figure 8 shows that dimension 1 (on the x-axis) correlated strongly with risk factors with high impact intensity: risk factor 6 (lack of other (nonhuman) resources), 13 (changes in the original specifications), and 5 (insufficient human resources). Dimension 2 showed diverse relationships with risk factors with low impact intensity (risk factor 3: cultural differences among system members, risk factor 1: failure to maintain risk management processes, and risk factor 11: R&D required in a new field/area) and with risk factors with moderate impact intensity (risk factor 9: too many stakeholders influencing the system, risk factor 4: overly optimistic scheduling assessment, and risk factor 12: overlap between different system processes).
In order to validate the findings produced by Cochran’s Q test (including heterogeneity and homogeneity analyses) and multidimensional scaling (which yielded similar results), it was decided to conduct another analysis: hierarchical cluster analysis. Figure 9 shows the dendrogram for the single linkage solution of the analysis.
From the hierarchical cluster analysis, it can be clearly seen that risk factors with high impact intensity (5, 13, and 6) were the first in the hierarchy of influence. Followed in second place in terms of impact were risk factors with moderate impact intensity (12, 4, and 9), and last were risk factors with low impact intensity (7, 11, 1, and 3).

5. Discussion

The risk factors faced by defense SoSs have been the subject of increasing attention in the complex reality of the 21st century. Multifaceted battlefield challenges and evolving combat requirements mean that defense SoSs must be developed rapidly, using daring innovation and technological ingenuity. Unlike others systems, the complex risk management of defense SoSs is rarely mentioned in the literature. The current study proposes a preliminary attempt to identify and analyze the risks in these systems.
Figure 10 presents the risk map that was built according to the survey results. The risk map shows the connection between the intensity of each risk factor (on a scale of marginal/low/moderate/high) and the probability of the risk. The probability of the risk was divided into four ranges: very low from 0 to 0.020, low from 0.130 to 0.413, moderate from 0.500 to 0.565, and high from 0.761 to 0.783.
Risk factor 13 (changes in the original specifications) was rated as the most influential risk factor, associated with a group of high-impact risk factors, along with risk factors 5 (insufficient human resources) and 6 (lack of other (nonhuman) resources).
On the other hand, complexity of the military operation, gap in knowledge management, and delays of system stakeholders’ previous experience were associated with the group of marginal impact risk factors and very low probability.
The exploratory study and the quantitative study showed some meaningful results. According to Figure 5, Figure 6, Figure 7, Figure 8 and Figure 9 for the quantitative study and to the interviews for the exploratory study, the main common insights were as follows:
  • The exploratory study found that the quality and quantity of human resources is a critical factor in development processes, but it was sometimes found to be insufficient. This risk was mentioned as a significant factor in almost every interview. The survey results showed that insufficient human resources (risk factor 5) represented the primary risk factor, ahead of all others.
  • Another risk presented in the exploratory study, reported mainly by those respondents who had a broader picture (managerial level), is the continuously changing battlefield that forces all involved parties to reduce the time of IOC, although development processes take a substantial amount of time. This need was also mentioned in Naaman [31]. Ongoing systems need to remain relevant despite rapidly changing battlefield conditions; thus, changes in the original specifications (risk factor 13) represent a significant risk factor, as the survey indeed found.
  • In many defense systems, it is necessary to change the system’s predefined goals because of changing security requirements. This results in changes in the end product, which in turn delays other processes. This is why the intelligence–mission–technology analysis conducted at the beginning of the process is so critical. This analysis facilitates the prediction of possible future changes in system goals, accordingly making it possible to introduce system changes, with a minimal influence on schedule. Thus, the robustness principle becomes stronger as a defense SoS advances. The ability of a product to adapt itself to changing conditions, requirements, and infrastructures is especially significant in the defense industry.
  • Defense SoSs suffer from too many stakeholders who mutually influence each other. This finding is in line with previous findings [5,28,29] regarding the need for many partners when managing projects under constraints. Sometimes, entities from different organizations and companies are involved in a project and are mutually dependent on one another. An example of this dependence is the hiring of subcontractors, who are required to provide services or products to the primary contractor, which are a critical part of the defense SoS. The interview findings show that subcontractors have a meaningful influence on SoSs on several levels, from product quality to scheduling issues. This subject came up in interviews with project managers who are required to cope with complex challenges in their work with subcontractors.
Because defense SoSs have high sensitivity, project managers strive for independence, as they prefer to depend on their own skills, rather than on external sourcing, which may reduce their flexibility. The desire of project managers of defense SoSs for independence is reflected in the risk map in Figure 10. Two of the marginal risks with marginal impact and very low probability were gap in knowledge management and lack of systems stakeholders’ previous experience. A project manager who depends on their own competencies does not need to rely on others’ experience and knowledge.
5.
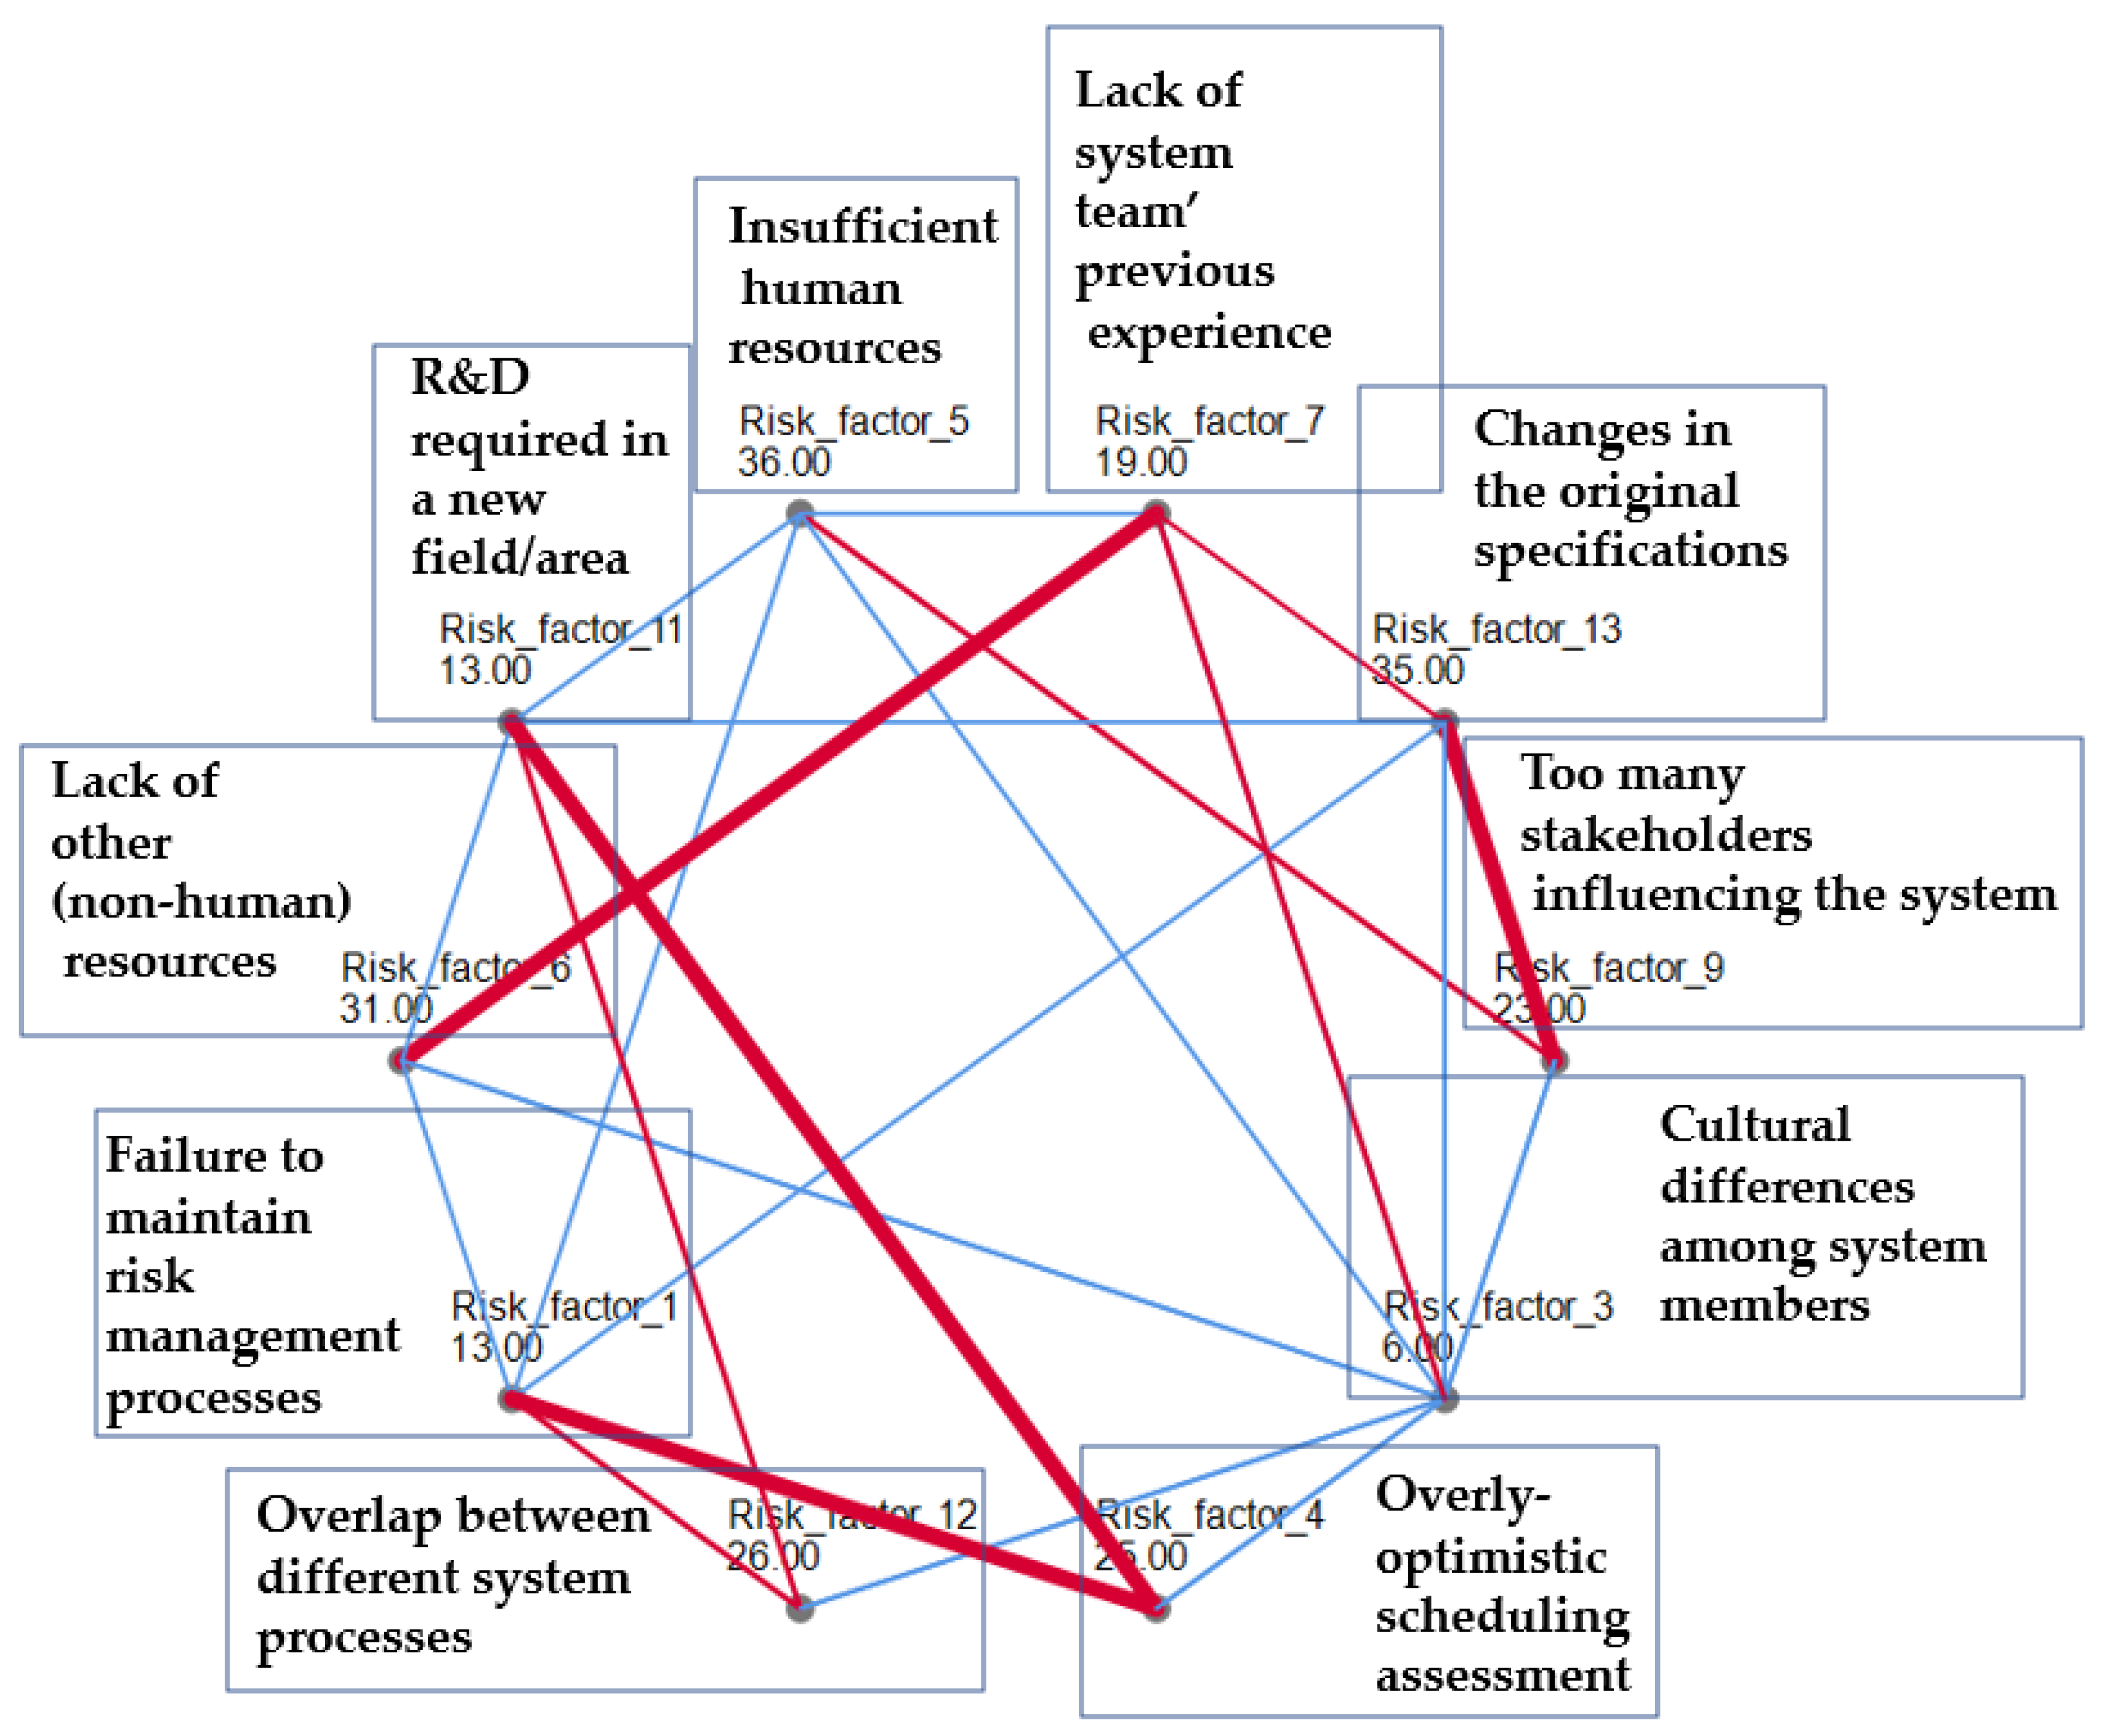
The survey findings showed a linkage between risk factor 13: changes in the original specifications and some others factors (risk factors 4, 5, 6, 9, and 12) that may in some instances be caused by managerial considerations. All these potential risks might lead to future changes that impact scheduling delays.
6.
Another aspect that leads to scheduling delays, and which was expressed in the interviews, is the high frequency of role switching within the defense industry, especially when working on classified SoSs. Role switching can have numerous advantages, but it has two significant disadvantages:
  • There is an initial learning process, during which the individual must learn to solve problems on the basis of existing and new knowledge. At this stage, the individual may pay less attention to the project.
  • We can assume that a project manager or officer who knows, from the beginning, that they will be managing a project from beginning to end will be more committed than one who will likely be transferred before its completion. Another related, common occurrence is the introduction of new professionals to an existing project at advanced stages. Naturally, each professional wants to make their mark on the project, even when they enter a pre-existing, stable project at a later stage. This need may generate a desire to make changes or additions that will be remembered as being initiated by specific people, but could potentially influence the project schedule.

6. Conclusions and Recommendations

The current study presented an innovative and successful implementation of heterogeneity and homogeneity using Cochran’s Q test and the I2 statistic, which was validated using multidimensional scaling, which in turn was validated by hierarchical cluster analysis. The above method is a loop in which it is possible to start from any of these statistical analyzes.
The findings of the current study show the need to focus on some main challenges/risks faced by defense SoSs:
  • Risk factor 5: Insufficient human resources;
  • Risk factor 6: Lack of other (nonhuman) resources;
  • Risk factor 13: Changes in the original specifications.
We could link each one of the risk factors presented in the study to one of these three characteristics. For example, insufficient human and general resources can be linked to managing projects under resource constraint conditions. The subject of resources could also be linked to a lack of clearly defined goals, because goals often determine the project’s requirements, leaving uncertainties regarding acquisitions and accessibility. Each one of the risk factors considered might be minimized by high-quality advanced planning, to which all of the necessary resources are allocated.
The risk management process includes several advanced stages of analysis and thinking [32]. The more thoroughly the initial risk analysis process is carried out, the easier it will be to predict the risks that will affect/be affected by the budget and provide responses to at least some cases. In addition, as a function of the demand to reduce development times [31], it is reasonable to assume that defense system SoWs will also decrease, especially in light of continuously changing battlefield-related needs, which demand rapid response times and shorter development times. Thus, the scope of defense systems budgets will most likely be organized differently in the future.

6.1. Main Conclusions and Recommendations

  • Organizational adaptations will make it possible to minimize the common risk factors found in the study; the study found that changing the project’s initial design specifications, insufficient human resources, and lack of other (nonhuman) resources were the three main risk factors. Defense systems have unique characteristics. Therefore, there must be a close connection between the end-user (e.g., air force operator), the department responsible for making the request (e.g., development) and the accountable unit that carries out the request (e.g., procurement department). Generally, the party making the request is also the one that defines the technical specifications. There is a real need for organizational change that permits transferring responsibility for SoW specifications to the party carrying out the work. This could reduce the number of specification changes during a project. We further found that the experience accrued by officials in the departments implementing and/or making requests can also help reduce some of the above risks. One critical remark is that these organizational changes are necessary to cope with rapid developmental changes and mitigate project risks. We also found that insufficient human resources represent a significant risk factor. Assuming that there are sufficient resources, outsourcing of the SoW has the potential to reduce these risks. However, these processes sometimes present other risks that are preferable to avoid. To minimize potential risks, an organization should develop tools that allow for a proper, intelligent analysis of outsourcing processes on the basis of past studies/data and valid professional knowledge.
  • Developing generic infrastructure, which allows for the integration of new systems, would contribute significantly in two ways:
    • Reduced R&D required for future integration, thereby reducing potential R&D-related risks.
    • Decreased development times for new abilities.
  • Process automation, with an emphasis on automated control processes, is necessary in order to reduce the risk of insufficient resources. For example, transitioning to automated checking of new systems instead of manual checking has many advantages, including increased effectiveness, the ability to run more tests in less time, the ability to work 24/7, and a reduced need for and dependence on human resources, which reduces risk related to workforce availability, as well as costs.
  • Changes in performance specifications at advanced stages represent one of the main reasons for system delays. In-depth preparation of technical and performance specifications at the beginning of the project may mitigate this risk. A project’s progress generates a great deal of stress for most of the involved parties, which may consequently create inadequate thoroughness in certain areas, including specification processes. We recommend defining principles to regulate orderly work procedures, which includes anchoring the time windows of all of the system partners.
A process of risk management in defense SoSs is a rational chain of practices by decision agents in order to ensure that system implementation complies with certain conditions. The decision-makers need to identify, analyze, and evaluate the risks in all stages of the project’s life cycle, as well as use their organizational structure and administrative practices to respond to risks in way that benefits the project [18,23,26,42].
Proper risk management methods are crucial to implement in defense SoSs. As managerial echelons focus more on risk management, more attention will be paid to subjects at work levels, resulting in fewer instances of risks. Moving forward on a defense SoS without a proactive focus on risk management is likely to lead to more problems arising from unmanaged risks.

6.2. Study Limitations and Recommendations for Future Research

This paper presented results of a data science analysis of 46 classified defense SoSs. We recommend that future research expand the study to other defense industries in additional countries, with different clients and suppliers.

Author Contributions

Both authors contributed to several aspects of the study, specifically, conceptualization, S.K. and S.F.; methodology, S.K.; formal analysis, investigation, resources, and data curation S.K. and S.F.; writing, review and editing, S.K. and S.F.; supervision S.K.; Both authors have read and agreed to the published version of the manuscript.

Funding

This research received no external funding.

Institutional Review Board Statement

The study was conducted according to the guidelines of the Declaration of Helsinki, and approved by the Ethics Committee of Ariel University (protocol code 9371419 July 2019).

Informed Consent Statement

Informed consent was obtained from all subjects involved in the study.

Data Availability Statement

Data available on request due to restrictions eg privacy or ethical. The data presented in this study are available on request from the corresponding author. The data are not publicly available due to confidential considerations.

Acknowledgments

The author would like to thank Sani Mazuz and Chen Dvir for their contribution for the data collection.

Conflicts of Interest

The authors declare no conflict of interest.

References

  1. A Guide to the Project Management Body of Knowledge (PMBOK GUIDE); Project Management Institute: Newtown Square, PA, USA, 2018.
  2. Fairley, R. Risk Management for software projects. IEEE Softw. 1994, 11, 57–67. [Google Scholar] [CrossRef]
  3. Boehm, B.W. Software risk management: Principles and practices. IEEE Softw. 1991, 8, 32–41. [Google Scholar] [CrossRef]
  4. Kliem, R.L.; Ludin, I.S. Reducing Project Risk; Gower: Farnham, UK, 1997. [Google Scholar]
  5. Risk Management—Principles and Guidelines; ISO 31000:2018; Available online: https://www.iso.org/standard/65694.html (accessed on 6 February 2021).
  6. Ye, S.; Tiong, R.L.K. NPV-at-risk method in infrastructure project investment evaluation. J. Constr. Eng. Manag. 2000, 126, 227–233. [Google Scholar] [CrossRef]
  7. Hastak, M.; Shaked, A. ICRAM-1: Model for international construction risk assessment. J. Manag. Eng. 2000, 16, 59–69. [Google Scholar] [CrossRef]
  8. Wu, Y.; Song, Z.; Li, L.; Xu, R. Risk management of public-private partnership charging infrastructure projects in China based on a three-dimension framework. Energy 2018, 165, 1089–1101. [Google Scholar] [CrossRef]
  9. Thomas, A.V.; Kalidindi, S.N.; Ganesh, L.S. Modelling and assessment of critical risks in BOT road projects. Constr. Manag. Econ. 2006, 24, 407–424. [Google Scholar] [CrossRef]
  10. Mu, J.; Peng, G.; MacLachlan, D.L. Effect of risk management strategy on NPD performance. Technovation 2009. [Google Scholar] [CrossRef]
  11. Pimchangthong, D.; Boonjing, V. Effects of risk management practices on IT project success. Manag. Prod. Eng. Rev. 2017, 8, 30–37. [Google Scholar] [CrossRef] [Green Version]
  12. Raz, T.; Shenhar, A.J.; Dvir, D. Risk management, project success, and technological uncertainty. R&D Manag. 2002, 32, 101–109. [Google Scholar] [CrossRef]
  13. Bannerman, P.L. Risk and risk management in software projects: A reassessment. J. Syst. Softw. 2008, 81, 2118–2133. [Google Scholar] [CrossRef]
  14. Oehmen, J.; Olechowski, A.; Robert Kenley, C.; Ben-Daya, M. Analysis of the effect of risk management practices on the performance of new product development programs. Technovation 2014, 34, 441–453. [Google Scholar] [CrossRef] [Green Version]
  15. De Carvalho, M.M.; Rabechini, R., Jr. Impact of risk management on project performance: The importance of soft skills. Int. J. Prod. Res. 2015, 53, 321–340. [Google Scholar] [CrossRef]
  16. Jin, X.-H.; Zhang, G. Modelling optimal risk allocation in PPP projects using artificial neural networks. Int. J. Proj. Manag. 2011, 29, 591–603. [Google Scholar] [CrossRef]
  17. Ojiako, U.; Papadopoulos, T.; Thumborisuthi, C.; Yang, Y.F. Perception variability for categorized risk factors. Ind. Manag. Data Syst. 2012, 112, 600–618. [Google Scholar] [CrossRef]
  18. Besner, C.; Hobbs, B. Contextualized project management practice: A cluster analysis of practices and best practices. Proj. Manag. J. 2013, 44, 17–34. [Google Scholar] [CrossRef]
  19. Gil, N.; Tether, B.S. Project risk management and design flexibility: Analyzing a case and conditions of complementarity. Res. Policy 2011, 40, 415–428. [Google Scholar] [CrossRef]
  20. Baharmand, H.; Zad, M.; Hashemi, S.H. Prioritization of effective risk factors on oil industry construction projects (by PMBOK Standard Approach). Res. J. Appl. Sci. Eng. Technol. 2013, 6, 521–528. [Google Scholar] [CrossRef]
  21. Robinson, L.A.; Levy, J.I. The [r]evolving relationship between risk assessment and risk management. Risk Anal. 2011, 31, 1334–1344. [Google Scholar] [CrossRef] [PubMed]
  22. Fortune, J.; White, D.; Jugdev, K.; Walker, D. Looking again at current practice in project management. Int. J. Manag. Proj. Bus. 2011, 4, 553–572. [Google Scholar] [CrossRef] [Green Version]
  23. Teller, J.; Kock, A. An empirical investigation on how portfolio risk management influences project portfolio success. Int. J. Proj. Manag. 2013, 31, 817–829. [Google Scholar] [CrossRef]
  24. Pajares, J.; López-Paredes, A. An extension of the EVM analysis for project monitoring: The cost control index and the schedule control index. Int. J. Proj. Manag. 2011, 29, 615–621. [Google Scholar] [CrossRef]
  25. Schroeder, K.; Hatton, M. Rethinking risk in development projects: From management to resilience. Dev. Pract. 2012, 22, 409–416. [Google Scholar] [CrossRef]
  26. Petit, Y. Project portfolios in dynamic environments: Organizing for uncertainty. Int. J. Proj. Manag. 2012, 30, 539–553. [Google Scholar] [CrossRef] [Green Version]
  27. Kuo, Y.-C.; Lu, S.-T. Using fuzzy multiple criteria decision making approach to enhance risk assessment for metropolitan construction projects. Int. J. Proj. Manag. 2013, 301, 602–614. [Google Scholar] [CrossRef]
  28. Wang, Y.; Wan, Y.; Wu, X.; Li, J. Exploring the risk factors of infrastructure PPP projects for sustainable delivery: A social network perspective. Sustainability 2020, 12, 4152. [Google Scholar] [CrossRef]
  29. Ameyaw, E.E.; Chan, A.P.C. Evaluation and ranking of risk factors in public–private partnership water supply projects in developing countries using fuzzy synthetic evaluation approach. Expert Syst. Appl. 2015, 42, 5102–5116. [Google Scholar] [CrossRef]
  30. Lessard, D.R. Uncertainty and Risk in Global Supply Chains; Research Paper No. 4991-13; MIT Sloan School: Cambridge, MA, USA, 2013. [Google Scholar]
  31. Naaman, A. Establishment of the Armed Force—Research Development in Air Force, Between the Poles, Part 3; IDF: Jerusalem, Israel, 2016; pp. 85–99. [Google Scholar]
  32. Wang, J.; Lin, W.; Huang, Y.H. A performance-oriented risk management framework for innovative R&D projects. Technovation 2010, 32, 601–611. [Google Scholar]
  33. Lee, E.; Park, Y.; Shin, J.G. Expert systems with applications. large engineering project risk management using a Bayesian Belief Network. Expert Syst. Appl. 2009, 36, 5880–5887. [Google Scholar] [CrossRef]
  34. Department of Defense. Risk, Issue, and Opportunity Management Guide for Defense Acquisition Programs; Office of the Deputy Assistant Secretary of Defense for Systems Engineering/Department of Defense: Washington, DC, USA, 2015.
  35. Chris, C.; Stephen, W. Managing Project Risk and Uncertainty: A Constructively Simple Approach to Decision Making; John Wiley & Sons: Hoboken, NJ, USA, 2002. [Google Scholar]
  36. Haskins, C. System Engineering Handbook; INCOSE: San Diego, CA, USA, 2010. [Google Scholar]
  37. Sharon, A.; Weck, O.L.; Dori, D. Project management vs. systems engineering management: A practitioners’ view on integrating the project and product domains. Syst. Eng. 2010, 14, 427–440. [Google Scholar] [CrossRef]
  38. Alexander, W.N. Systems Engineering Principles; John Wiley & Sons: Hoboken, NJ, USA, 2011. [Google Scholar]
  39. Koral Kordova, S.; Katz, E.; Frank, M. Managing development projects—The partnership between project managers and systems engineers. Syst. Eng. 2018, 1–16. [Google Scholar] [CrossRef]
  40. BKCASE Editorial Board. The Guide to the Systems Engineering Body of Knowledge (SEBoK); Version 1.9.1 R.D. Adcock (EIC); The Trustees of the Stevens Institute of Technology: Hoboken, NJ, USA, 2018. [Google Scholar]
  41. Maier, M.W. Architecting principles for system of systems. Syst. Eng. 1998, 1, 267–284. [Google Scholar] [CrossRef]
  42. da-Silvaa, L.R.; Crispima, J.A. The project risk management process: A preliminary study. Proc. Technol. 2014, 16, 943–949. [Google Scholar] [CrossRef] [Green Version]
Figure 1. Impact of variables as a function of project time [1].
Sustainability 13 01789 g001
Figure 2. Risk management process according to the United States (US) Department of Defense (DoD).
Sustainability 13 01789 g002
Figure 3. Overlaps between systems engineering and project management.
Sustainability 13 01789 g003
Figure 4. The research design.
Sustainability 13 01789 g004
Figure 5. Bar chart of risk factors faced by 46 defense systems of systems (SoSs).
Sustainability 13 01789 g005
Figure 6. Cochran’s Q test and pairwise comparisons with a Bonferroni-adjusted alpha level of 0.005 (total N = 46; related-samples Cochran’s Q test statistic = 70.156; degrees of freedom (df) = 9; asymptotic significance (two-sided test) = 0.000; I2 = 75.99).
Sustainability 13 01789 g006
Figure 7. Scree plot.
Sustainability 13 01789 g007
Figure 8. Gray dot: Common space coordinates (stress and fit measures: normalized raw stress = 0.072; Stress-I a = 0.270; Stress-II a = 0.798; S-Stress b = 0.175; dispersion accounted for (DAF) = 0.927; Tucker’s coefficient of congruence = 0.962; a. optimal scaling factor = 1.078; b. optimal scaling factor = 1.078.).
Sustainability 13 01789 g008
Figure 9. Dendrogram for the single linkage solution (cluster method: between-group linkage; measure: binary; simple matching).
Sustainability 13 01789 g009
Figure 10. The risk map of 46 defense SoSs.
Sustainability 13 01789 g010
Table 1. The proportion of each of the 10 risk factors (N = 46).
Risk FactorProportion
Risk factor 5: Insufficient human resources0.78
Risk factor 13: Changes in the original specifications0.76
Risk factor 6: Lack of other (nonhuman) resources0.67
Risk factor 12: Overlap between different project processes0.57
Risk factor 4: Overly optimistic scheduling assessment0.54
Risk factor 9: Too many stakeholders influencing the system0.50
Risk factor 7: Lack of system team’ previous experience0.41
Risk factor 1: Failure to maintain risk management processes0.28
Risk factor 11: Research and development (R&D) required in a new field/area0.28
Risk factor 3: Cultural differences among project members0.13
Table 2. Homogeneous subsets of risk factors.
Sample aSubset
12
Risk factor 3: Cultural differences among system members0.130
Risk factor 1: Failure to maintain risk management processes0.283
Risk factor 11: R&D required in a new field/area0.283
Risk factor 7: Lack of system team’ previous experience0.413
Risk factor 9: Too many stakeholders influencing the system0.5000.500
Risk factor 4: Overly-optimistic scheduling assessment0.5430.543
Risk factor 12: Overlap between different project processes0.5650.565
Risk factor 6: Lack of other (non-human) resources 0.674
Risk factor 13: Changes in the original specifications 0.761
Risk factor 5: Insufficient human resources 0.783
Test statistic10.096−64.96
Significance (two-sided test)0.1211.000
Adjusted significance (two-sided test)0.1681.000
Note: Homogeneous subsets are based on asymptotic significances. The significance level is 0.05. a. Each cell shows the sample number of successes.
Publisher’s Note: MDPI stays neutral with regard to jurisdictional claims in published maps and institutional affiliations.

