1. Introduction
Energy sustainability is a current concept that has implications for our daily activity. However, from the energy point of view, there is a lot to improve. Cities consume half of the energy available on a global scale, and the urban infrastructure of municipalities (lighting, water, waste, etc.) entail an energy consumption that, in many cases, is produced from fossil fuels. Moreover, retail electricity prices have risen steadily along the last decade in many countries (e.g., by 78% in Spain, 52% in Germany, and 48% in the U.K. in 2018 since 2007) [
1]. These facts make the present electricity grid unsustainable in the long term and, therefore, it is necessary to implement energy production from renewable sources on an urban scale to allow energy savings that do not compromise the environment [
2].
In our cities, electricity can be produced from renewable sources. For example, photovoltaic energy can cover up to 30% of the energy needs of a building, or 100% of the lighting required in roads [
3]. Also, for example, biomass can cover 100% of the heating needs, and other types of renewable energy can be used in different areas [
4].
The average global irradiance in the province capitals of Spain is between 3.54 and 5.40 kW∙h/m
2∙d, having between 2500 and 3000 h of full light per year, with a mean value of more than 8.2 h a day. This means that photovoltaic (PV) systems can be considered a suitable solution for independent lighting installations [
5].
In summary, the use of photovoltaic solar panels to power LED lamps is an application that carries economic and environmental advantages when compared with conventional systems. For more than 10 years, there has been research related to lighting design using solar-powered LED based equipment [
6]. There are also proposals to study the implementation of autonomous public lighting systems in locations far from the electricity grid [
7].
To take full advantage of these autonomous PV systems, studies have been conducted on control systems that allow regulation of lighting levels [
8,
9]. All these systems are based on LED technology and on regulating the drivers that control these LEDs. Currently, there are several studies that establish conditions for autonomous PV lighting equipment to minimize its PV panel and its battery in the winter season [
10].
The problem with conventional autonomous PV lighting systems is their sudden shutdown. That is, once the minimum battery discharge value is reached, the light suddenly turns off. The study of the regulation of these autonomous systems, so that the maximum duration of their lighting is guaranteed regardless of the meteorological circumstances, has led to studies such as that of Kiwan et al. [
11], where new controllers are designed for each luminaire. In that study, new controllers are designed to minimize the problem of sudden luminaire shutdown and extend the life of the battery system.
In this work, a novel application will be studied for the management and control system of a centralized PV generator to power a security lighting installation. Unlike previous works, all the light points will be powered from a centralized battery system, and a master controller will turn on, off, and simultaneously regulate all the points of light. With this proposal, the system is more efficient and economically more affordable; since it is simpler, it avoids the cost of over-dimensioning the PV panels and the batteries of the system that are absolutely necessary for lighting installations, and it is robust (by powering the load with direct current, working the generation systems and the lamps at a unified voltage level). The control architecture is also inexpensive, simple, and easy to deploy and maintain. It is a small step towards energy sustainability in municipal infrastructures.
2. Determinants of Location in the Development of Autonomous Photovoltaic Lighting Systems
2.1. Differences of Hours of Sun Related to the Latitude of the Installation
In lighting installations, it is necessary to have storage systems that accumulate the energy captured during the day to be used at night. These elements represent the highest cost of both the implementation and maintenance of the proposal, so it is essential to minimize the total installed capacity for an adequate economic amortization.
The capability of harvesting energy is related mainly to the amount of hours of sun available at each moment. Thus, due to the axial tilt of the Earth, the Sun is always within 23.5° north or south of the celestial equator, so the subsolar point is always between the two tropics.
Specifically, the solar declination is cancelled at the spring (22 and 23 September) and autumn (20 and 21 March) equinoxes and, at these two moments, the duration of the day is equal to that of the night throughout the earth. However, on the summer solstice (21 and 22 June) the sun declination is +23.45° aligning with the Tropic of Cancer. In the northern hemisphere this generates the longest day and the shortest night of the year. Conversely, in the winter solstice (21 and 22 December) the declination is −23.45° and the Sun lies in the Tropic of Capricorn, causing the shortest day and the longest night in the northern hemisphere. In the southern hemisphere, the opposite occurs.
Thus, on the equator, the night lasts about 12 h regardless of the season of the year. In the lower middle latitudes of the planet (north and south), where California, southern Spain, Egypt, or South Africa meet, the seasonal difference is approximately of 4 h in the daylight span between the winter and summer solstices. If we further increase the distance to the equator, the difference in the length of the day from summer to winter increases and can reach very remarkable values. On average, in central Europe the sky will still be illuminated at 10 p.m. in summer, but it is completely dark at 5 p.m. in winter. This means that there are very notable differences in the capacity to generate energy by PV systems in winter and in summer in any area above the tropics. This requires that facilities need to be designed under worst case criteria, increasing the total PV surface and the capacity of the battery system.
2.2. Cost Analysis of PV and PVB Systems. Influence of Each Type of Component
The large present evolution and demand of PV energy has been possible thanks to the huge price decrease experienced by this industry due to the economies of scale in the last decade. The cost for residential grid-connected PV systems has fallen down to about 1280 €/kW as a worldwide average. More in detail, values have been reduced another 20% in Europe to reach, in most cases, 1130 €/kW, and in Australia they have been reduced up to 30%, where prices are set around 950 €/kW [
12].
At present and overall, photovoltaic battery storage (PVB) system installations are less common, due to their higher amortization period and failure and default risks, and have limited historical pricing data. Moreover, battery system costs have a greater variation, and they are currently between 540–1900 USD/kW∙h [
13]. Thus, this automatically becomes the most significant element of the installation related to its economic cost. More specifically, they have many different prices depending on the technology used. Considering Li-ion, lead-acid, and several industrialized cathode materials (offering different lifetime expectation and efficiency), the average price for energy costs ranges between 410–1630 USD/kW∙h for Li-ion or between 350–750 USD/kW∙h for lead-acid [
1].
Nowadays mainstream lithium-ion batteries are driving a rapidly expanding market due to electric vehicles. Basic lithium-ion battery packs cost 1183 USD/kW∙h in 2010 and, in 2016, that price decreased to 273 USD/kW∙h [
14]. Nowadays, in 2019, the price had dropped nearly tenfold to 156 USD/kW∙h [
15] due to cost reduction benefiting from important economies of scale.
Regardless of price decreases, in the future Li-ion batteries will face a minimum price limit caused by the scarcity of available cobalt and lithium. In predictions of 2030 prices, they are expected to be around 124 USD/kW∙h [
16]. Moreover, this can lead to a cost increase of the materials over time and outperform the gains due to efficiency increase, economies of scale, and learning effect.
In this sense, the high cost of batteries is the major barrier to the worldwide massive adoption of PVB systems. This is especially relevant mainly in places with higher latitudes and in applications such as lighting installations where the dependency on the battery storage capability is complete.
3. Objective
The aim of this study is to stablish a system where the impact of the variation of sun hours in the cost of the installation is minimized. To develop this work, an existing outdoor lighting installation previously powered from the power grid was used. This installation has been renewed using photovoltaic panels and batteries so it can operate autonomously [
17].
The necessary installation has been dimensioned using the methodology described in
Section 4. It considers the design criteria of using the average annual irradiation and total energy consumption of the loads of a 12 h night available in the spring and autumn equinoxes instead of the worst-case situation to detain the number (and the total cost) of equipment.
This system was assembled and put through a long-term experimental analysis to check the real performance achieved to ensure that the simplifications used in the dimensioning of the system were not significant [
18]. Different electrical and irradiation measurements were taken that indicate the exact operational behaviour of the PV generator.
The energy deficit that is generated in the months with less solar radiation has been verified and it derives into repetitive sudden crashes of the system. Thus, optimization changes are proposed to improve the efficiency considering only aspects within the PVB system: efficiency improvement or elimination of components and introduction of regulation control elements to reduce the energy made available on the lamp’s grid [
11].
Thus, it is proposed to change the nature of the energy transportation bus from alternating current (AC) to direct current (DC) and to introduce a centralized control system to supervise the energy available in the batteries. This control system will send a dimming command to the luminaires when the storage level starts being compromised to delay any possible sudden shut down of the system, adjusting the performance in the winter season and allowing the maximum consumption in the summer.
4. Methodology
The starting point is an existing security outdoor lighting installation surrounding the building of a primary school, situated in the south of Spain, on which an experimental PVB isolated system is mounted.
Among the two main trends in dimension of PVB systems techniques, in this case we left aside the techniques based on probability analysis of loss of load (LOLP) also named as “Loss of Power Probability” (LOPP) or “Load Coverage Rate” (LCR) because they use as the main indicator in the design that the system fails or is not capable of supplying power in the most unfavourable working case [
19]. This is precisely the design principle that we intend to avoid.
On the other hand, the mechanism used is based on the calculation of the energy needs of the loads of the installation (taking also into account the losses related to the batteries and the transportation grid), and then establishing a number of panels and battery cells with the capacity to maintain its operation for a number of days of autonomy determined for the seasonal conditions required by the designer [
20]. In this way, it is intended to quantify the real energy deficiency generated in the winter months for an installation calculated with respect to the equivalent in a site on the equator with constant conditions throughout the year.
Once the installation was deployed in the intended location its operation was monitored for six months covering the winter and spring seasons (December–May). During this time, the electrical and energy parameters generated were measured and the difference between design parameters and real performance was evaluated.
After this testing period, the installation was modified, introducing changes related to energy consumption reduction or saving. Nowadays, the most extended method to accomplish this goal is to execute a renewal of the point of lights from conventional technologies toward LED emitters. The analysis of several upgrades of outdoor lighting installations with LED technology carried out by Gorgulo and Kocabey [
21] shows how values of reduction of the electricity consumption of the same are achieved, conserving or increasing the lighting results, between 36 and 90%, depending on the technologies of origin of the replaced systems and the degree of maintenance of the same. The most repeated usual savings values are between 50 and 60%. This trend should increase in the coming years as the performance improvement of the LED emitters that are developed and marketed for this type of products increases, which already reach 200 Lm/W and it is expected that they can reach practical values in the environment of 255 Lm/W [
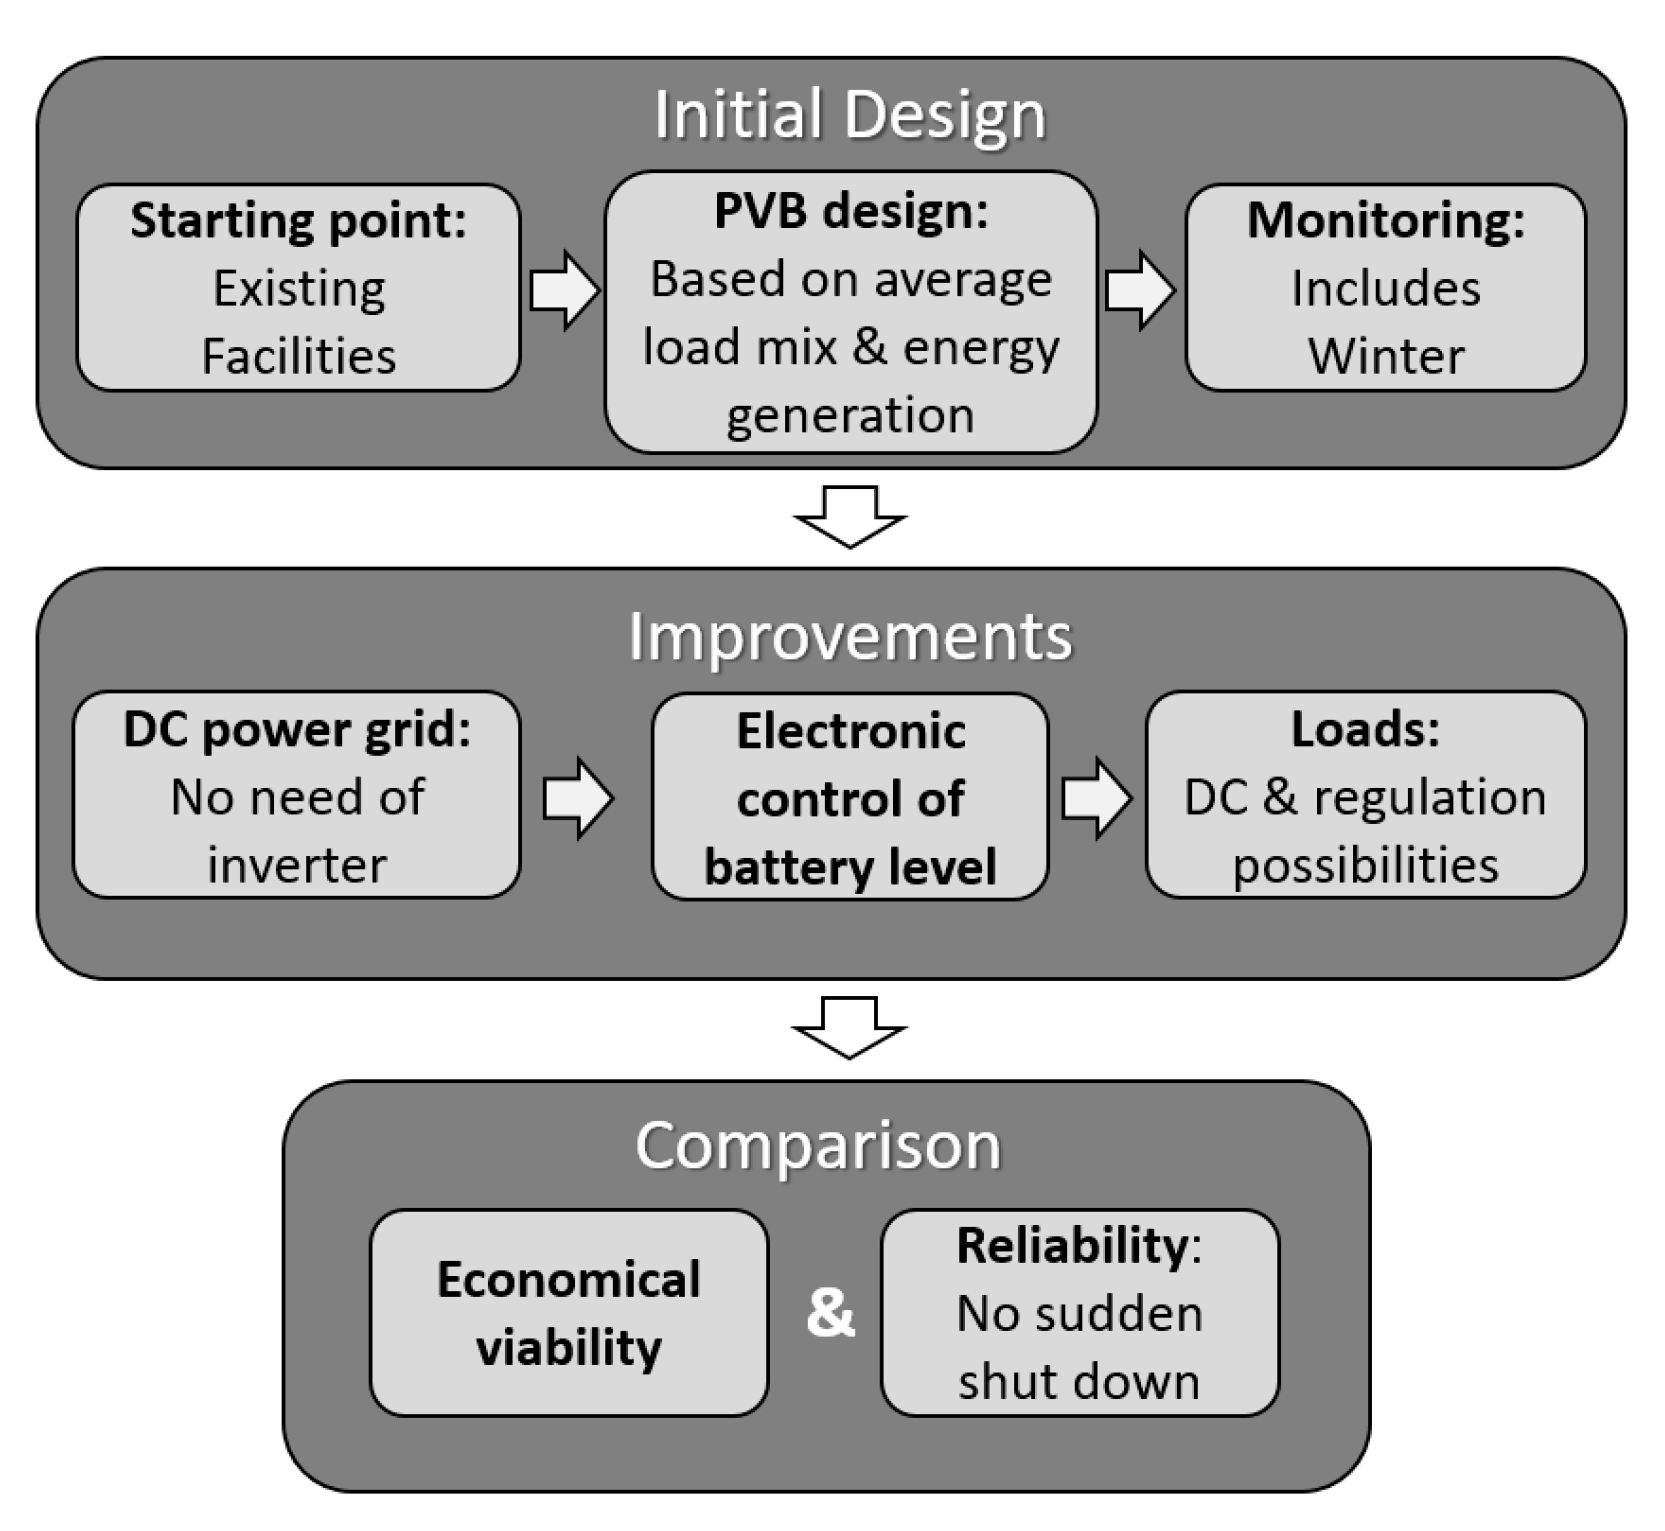
22]. However, we have the intention in this work to analyse the possibilities of energy saving related with the PVB electric generator system and not with the loads exclusively. Thus, two proposals to optimise the system were developed:
Replacing the type of the power bus switching from AC to DC (within the level of the Safety Extra-Low Voltage (SELV)).
Introducing a centralised energy control system with brightness level regulation capability. This control unit implements an auto-adjustment algorithm to command the regulation of the electrical consumption of dimmable loads to adapt it to the energy availability.
All these activities are summarized in a flown chart in
Figure 1.
5. Initial Installation Dimensioning
The installation is located in the municipality of Cartama (Malaga, Spain) at the street Goya N° 81, with coordinates 36°44′59.47′′ North and 4°35′36.76′′ West. The installation has five points of light. The Illuminance and uniformity objective requirements are Em ≥ 5 lux and Emin ≥ 1 lux (Class P4 of routes for people and cyclists according to the EN 13201-2:2015—Road lighting—Part 2: Performance requirements) [
23]. It was experimentally verified that for the distribution and distances between the existing model of lanterns and the PVB system in the installation (as indicated in
Figure 2) these desired values were achieved using 40 W induction lamps at each points of light (Manufacturer: LVD. Model: Induction Lamp Saturn Series LVZ-ZWJYTX2B-120/60-40: 2600 lumens, power factor: 0.98 & nominal input voltage: 230 V
AC). The distance values presented in
Figure 2 mean the wires length of each cable ran between the terminals of the equipment (batteries, inverter, or bulb caps) that were electrically connected at its ends.
The energy generation and the storage equipment must be able to supply the installation’s consumption in the average annual situation of the number of existing peak solar hours with a working autonomy of three full nights of 12 h (spring or summer equinox). For this reason, the installation was dimensioned using the annual mean values of irradiation in the plane of generation. However, the angle of inclination of the panels used was selected optimizing the solar path of December to maximize the energy capture in the month with the least solar radiation. The equipment described in
Table 1 was used to build the PVB system.
5.1. Calculation of the Daily Consumption of the Installation
The consumption established for the design conditions is that of 5 luminaires in which induction lamps are initially installed with the ballast integrated and a total individual consumption of 40 W. Thus, the total calculation consumption is 200 W∙h with a use of 12 h a day.
Considering the nominal 24 V
DC of the PVB system and taking into account the conversion efficiency of the inverter (
ηconversion = 0.90), a daily energy consumption requirement of 111.11 Ah/d is calculated using Equation (1).
Considering a 98% of wire performance factor (ηwire = 0.98) and a 90% of battery performance factor (ηbattery = 0.90), based on the specifications of the manufacturers, a corrected consumption value of the installation of 125.97 A∙h/d is established.
5.2. Dimensioning of the Array of Batteries
The system is dimensioned using Equation (2) establishing a storage requirement of 3 days without any energy recharge, a maximum allowable discharge of 85% of the battery rack, and a temperature correction of 80%. This offers a capacity requirement of 555.75 A∙h.
The commented value of the maximum discharge depth has been adjusted to prevent from freezing the electrolyte on cold nights (its freezing point is low when the battery is fully charged). In most tropical climates, the risk of temperatures below 0 °C is minimal; however, it must be a specific element of analysis for each site. According to
Table 1, with the battery presented, the combination that covers the calculated requirements of energy capacity and the development of a nominal voltage of 24 V
DC is the union of 12 cells in series.
5.3. Dimensioning of the Photovoltaic Generator
Based on the latitude of our installation, the optimal inclination angle of the PV panels for the month of December is 55° on the south orientation. Also, according to the data provided by the National Meteorological Agency of Spain (AEMET) [
24], the total annual average irradiance for our location is 5.45 kW∙h/m
2∙d. We used this value according to the dimensioning requirements established. In comparison, the solar collection value for the most unfavourable month (December) is a total irradiance of 2.36 kW∙h/m
2∙d.
The number of PV modules to be connected in series is obtained from the quotient between the nominal system voltage and the nominal voltage of the module. In our case, a single module provides with the required voltage of the PVB (24 V
DC). The number of panels in parallel is obtained as the quotient between the design current of the generator and the current of each module at the point of maximum power under standard conditions. The design current of the generator is the quotient of the corrected consumption of the installation divided by the number of hours of peak sun available. In this case, this requirement is met with four panels of the model selected in
Table 1.
5.4. Dimensioning of the Rest of Equipment in the Installation
Battery controller: This equipment is used to protect the batteries against overcharging or an excessive discharge. It is also capable of determining the sunset and sunrise situations based on the output voltage of the PV panels and open or close the power supply bus of the luminaires based on this criterion. The specific model selected (Iload: 40 ADC/Idischarge: 30 ADC) offers working values above the short-circuit current of the four parallel PV panels (22.5 ADC) applying a security coefficient of 1.50.
Inverter: The equipment used to transform from DC to AC the electric power was selected with a maximum conversion power of 300 W to have a sufficient safety margin over the total power installed in the lamps, taking into account the losses in the wires and in the auxiliary equipment of the luminaires.
Wires of the power grid: The previous existing wires of the power distribution grid to the load used copper with 2.50 mm2 section in a three wire conductor with RZ1-K 0.6/1 kV isolation enveloping. The consumption level of the loads requires of a lower section to support a low voltage drop and to stand a shortcut failure; however, this is the minimum value allowed by the low voltage electrical installation regulation in the country of the installation. To minimize the cost of the renewal process and, as it is not necessary, the same cable was kept for the autonomous configuration.
6. Resulting Installation
For the experimental study, the installation calculated was arranged as shown in
Figure 3. The production of photovoltaic solar energy came from four panels of 190 W peak power connected in parallel located on a metal canopy, with an inclination of 55° with south orientation. The cost of the energy generation and storage system equipment designed is shown in
Table 2. The cost of batteries represented more than 75% of the economic resources necessary for its development.
Test Equipment Installed
The experimental measurements were carried out using:
A pyranometer SLM 018-C2 from the manufacturer Mac Solar to measure the global irradiation. It was placed next to the photovoltaic panels with the same inclination as them.
A PA6000 data logger from the manufacturer PCE to measure the voltage and intensity in the DC lines of the PVB.
A Power Vision V1.8.c network analyser from the manufacturer Circutor to measure the voltage, intensity, and power factor in the AC power grid. It was placed at the output of the inverter.
7. Analysis of the Measured Values of the Initial Design of the PVB System
The behaviour of the installation was controlled and measured between the months of December and May.
Figure 4 shows an example of current and voltage measurements for powering the lighting equipment during one night in March.
From the measured data, the average current consumption was 10.996 A
DC. This value was 4.5% higher than the corrected current estimated in the dimensioning process (10.498 A
DC). Also, the real performance of the inverter was calculated using Equation (3). The value obtained was 10 points lower than the expected value given as nominal by the manufacturer.
Figure 5 shows the measurements of the radiation in the month of April and May.
Table 3 details by hours the parameters obtained in the PV panels in one sunny illustrative day: April 29, 2020 (04.29, 2020). This day has been selected based on the information given by
Figure 5 as the irradiation was within the low segment of the expected range for this month. This information allows calculation of the produced energy and the efficiency of the photovoltaic generator can be obtained. The performance of the photovoltaic generator can be calculated using Equation (4) with the data in
Figure 6 and
Figure 7. Compared with the value given in the specifications of the panels (14.9%) this means an additional 9.7% loss of accuracy on the calculation performed.
Table 4 contains the data and values obtained with the measurements of the real performance of the PV generator measured in the months from December (worst case) to March. This table indicates the real amount of deficit or surplus of energy produced with respect to the energy consumption required by the lighting installation as established. With respect to the month of December, the installation had a total deficit of capacity of 2996.35 A∙h. This means that, considering that the total energy generated and stored in the same period is of 1547.72 A∙h, the installation should be about three times bigger to avoid any sudden crash in the performance without introducing any new control or optimization element.
8. Design Modifications to Include Light and Battery Levels Management Systems
Based on the data obtained in the experimental test of the installation’s initial implementation format, the following modifications, according with the methodology explanation detailed in
Section 4, have been made to solve this energy gap, achieving in this case a reduction of 66% of the energy requirements to make the installation capable of providing a complete service throughout the year, without increasing the generation system (number of photovoltaic panels or battery cells).
8.1. DC Power Grid and Lighting Technology
Modification of the type of power bus from 220/230 VAC to a direct current bus adjusted to the nature of the photovoltaic generators and to the battery system used (24 VDC). This modification allows two actions on the installation:
Transform the AC power line bus for luminaires to a DC eliminates the inverter. The aim is to improve the system’s efficiency by eliminating this energy transformation stage and, at the same time, improve its robustness and cost.
Replace the 40 W induction lamps with 40 W LED lamps with a DC constant voltage (CV)–constant current (CC) power driver (Meanwell LDH-45®) adapted to battery powered system input (18–36 VDC) and with a constant output current independent of the input signal (storage system load). This choice is based on their DC nature and dimming capability. Moreover, they also allow:
Improvement of the light quality by working with a much higher colour rendering index (CRI) of 80 that facilitates the perception of objects both by the human eye and cameras [
25];
Improvement of the efficiency of the light source, obtaining values higher than 125 Lm/W with commercial equipment available in a generic way in the lighting equipment market. These systems are more efficient and robust than mains powered equipment by greatly simplifying the necessary auxiliary power system such as the LED driver [
26].
The analysis of the loads is an aspect that is outside the objectives of this work, focused on the architecture of the PVB system. In this way, and to maintain equivalent conditions for the comparative study of the evolution of the generator, five LED luminaires with the same power of 40 W are used. The object of the change is based on using light points that work directly on the DC grid without modifying their consumption with the voltage variations offered by the battery in its discharge process and their dimming possibilities.
On the other hand, the improvement of efficiency generated with the elimination of the inverter (80.70% as calculated in
Section 5, which means 49.42 W) is reduced by the rise of power loses in the wires caused by the large increment of current generated. To evaluate this effect, it is necessary to calculate the losses in both cases. As the topology of the installation is not lineal (as shown in
Figure 2) we need to calculate the losses in the five cable runs of the grid, using Equation (5), and add the results as detailed in
Table 5.
ρ: Resistivity of the cable [Ὡ∙mm2/m]. For Cu, ρ = 1/56 Ὡ∙mm2/m
U: Average voltage of the grid [223 V
AC/24 V
DC] (See
Figure 4)
S: Wire section [mm2]
Pi: Power of the visible load of the cable run ‘i’ [W]
Li: length of the cable run ‘i’ [m]
If the same wiring is kept, the increment in losses is 24.07 W. This implies that the real savings is the reduction of 25.17 W. This is approximately a 9.9% of total energy savings to change from AC to DC. If we just increase the section of the wires of cable run 1, where all the current is being driven, the savings increase up to 31.76 W (12.5% of total energy savings). Thus, with an adequate initial design, savings can be optimized choosing the best wire section based on the ratio between cost and energy losses.
8.2. Electronic Control Architecture
Outdoor lighting systems, endorsed by the requirements of energy efficiency regulations in this type of installations, specify that their light quality is especially related to guaranteeing sufficient lighting uniformity. It is not so important to guarantee high levels of lighting, which can be reduced as the night progresses, as long as they are high enough to control and monitor the surroundings. For this reason, the addition of an auto-adjustment system is proposed to supervise and manage the brightness control of the LED lamps.
The operation of the proposed system is based on detecting the voltage level of the batteries and adjusting the consumption of the LEDs to the availability of energy from the batteries. The idea is to maintain maximum turn-on intensity all night if the energy availability allows it, but it will generate a pattern of intensity dimming if the system finds that it does not have enough energy to cover the energy consumption. In this way, in the months of energy deficit, the installation would continue to operate all necessary hours, although with a reduced light flow pattern.
The human eye is capable of adapting to a range of illumination values of approximately 10 orders of magnitude covering from very high levels of sun daylight to very small values from reduce artificial lighting. However, the perceived illumination level (of a subjective nature) is, in general, a logarithmic function of the intensity of light incident in the human eye (Weber Fechner Law) so that our photoreceptor does not operate simultaneously over the entire range, but in each case, and depending on the existing average luminosity, it becomes sensitive to a range around said average value [
27]. For the human eye, considering the capability of adapting different brightness levels, studies such as by Rahm and Johansson [
25] asses how reduction of the light emitted within 70% of the nominal level do not produce a significant loss of perception either in facial recognition or obstacle detection.
In this proposal, a control system is planned based on the design principle to minimize the hardware required to adjust the functionality to the specific needs of the lighting installation but allowing some configuration capacity. For this, the need to implement a management unit, a communications channel, and a network of actuators to control the regulation of LED lamps must be assessed:
One central management unit placed in the PV station with the battery bank and has two tasks: First, to control the charge level of the battery rank. This allows establishment of one or more action points in which to reduce the lamps’ consumption in order to extend energy availability. Second, to command the communications bus. These two tasks are programmed in the firmware loaded in a microcontroller that command this central processing unit (CPU). The discharge control algorithm of the outdoor lighting installation to decide whenever it is necessary to start dimming the light to prolong the autonomy was built based on the battery rank voltage measure while is charged. The output voltage of the batteries varies significantly whenever the system is in open mode or with loads connected, and different values of current requirements also change that value. Thus, in the cases where the power requirement is assigned to the grid varies over the time, the lecture of this parameter will not be able to give an accurate estimation of the charge level. However, if the load is constant, as in our installation, this system is accurate.
A communications bus. For simplicity, a Master-Slave architecture with the permanent set of the active data in the bus is generated. This information indicates to the lamps the operating status they must apply at each moment.
A set of lamp control units placed in each luminaire and connected to their power drivers. They have the mission to receive the information from the management board and convert it into a dimming signal in order to modify the driver’s operating mode. With this modification, the variation of the output current that is introduced into the LED matrix, and therefore the amount of light produced, can be controlled. These controllers include a configuration micro switch block that allows them to be configured manually for each operating state ordered by the management board to define the percentage of light level the luminaire should emit.
8.2.1. Hardware Assembly Configuration
Master control unit: A very low power microcontroller (MSP430F2002 by Texas Instruments) is used with the following modules of connection/contact with its external environment attached (See
Figure 8):
Power input. Received directly from the batteries. The control unit has a voltage regulator that adapts the feeds to the integrated circuits VUC (3.3 V)
Battery voltage read: Two lines (Vbat and ground (GND)) to estimate the battery charge status. A resistor voltage divider is required to adapt the measured value within the operating range of an analog to digital converter (ADC) unit of the microcontrollers (VUC and GND)
Communications bus: n lines (GND and ‘n’ DATUM lines). Metal Oxide Semiconductor Field Effect Transistor (MOSFET) Integrated Circuits (ICs) allow the processor to generate two different states in the bus and, thus, generate a binary information codification: open circuit (‘1’) and closed circuit (‘0’). Increasing the number of DATUM lines allows more possible combinations that can communicate 2n different working status.
Lamp’s slave control unit: The same printed circuit board (PCB) with a simpler microcontroller (MSP430F2001 without an ADC module) is used in this CPU with the following modules of connection/contact with its external environment (see
Figure 8):
Power input. Identically as the master control unit.
Communications bus: Each lamp control unit includes a VUC pull-up resistor that set a stable value in the DATUM lines while the master controller keeps the MOSFET as an open circuit. It is important that the connection of the data bus always respect the polarity of the cables. DATUM cannot be mixed with GND in any luminaire since, in this case, the bus would be permanently setting a ‘1′ status.
Luminaire DC-CC driver control signal. It executes a pulse width modulation (PWM) signal with a frequency of 2 KHz that regulates in the range 100–0% of the active pulse’s width to configure the output current emitted by a Meanwell LDH-45B-700 W driver which power the LEDs of the lamp.
This control unit must be installed with a wiring distance as short and direct as possible. The driver’s task is to set a fixed and constant power supply for the lamp’s LEDs regardless of the changing voltage of the batteries (and the PV panels, if applicable).
Both master and slave control units can be generated upon the same PCB, soldering the required components for each case. The design achieved can be compacted in a base of 55 × 27 m
2.
Figure 9 presents the implementation of a master system prepared to command the maximum of three DATUM lines (eight different dimming stages) for which it is prepared.
8.2.2. Communication Bus
This bus is based on a multi-thread system of static communication where a GND thread is used that equalizes the voltage references of the data bus and as many threads as are needed for the different states to be marked. 1 DATUM line: 2 states. 2 DATUM lines: 4 states. 3 DATUM lines: 8 states, etc.
These threads connect a layer digital input pin lamps’ processor and have a pull-up resistor that keeps the bus in a natural state in a logic ‘1’ (3.3 VDC as the microcontroller supply).
The management board has MOSFET ICs with which the data threads can be switched with the ground thread so that, if the circuit is open on the bus, a ‘1’ is read thanks to all the pull-ups of the luminaires; when it is short-circuited, the DATUM thread is set to ‘0’.
In this way, a binary number with as much resolution as DATUM lines can be kept statically on the data bus. Thus, there is no electromagnetic noise or interference at any time as it is a system with DC supply and a communications bus where transitions only occur when the consumption requirements change punctually. The energy requirement of the bus is minimum and can be implemented using wires as small as 0.25 mm2 with no shielding required.
This system has a robust design that requires low installation and maintenance costs compared to other systems used to control PVB lighting systems [
28].
8.2.3. Cost of the Control Architecture
Table 6 lists the average economic cost of each of the system components, differentiating the central control unit and the cost of the receiver for each luminaire. The total cost of this architecture, even considering the cost of the dimming driver proposed (Meanwell LDH-45 @4.50 €/unit) is less than the 2% of the total cost of the installation.
The total cost of the actions executed implies less than 88 € (22.50 € for 2 × 4 mm
2 in bus for the cable run 1 and 65.39 € for the electronic control). This money allows a basic performance of the installation without disruption of service of an average season design of the PVB system. As evaluated in
Section 7, the energy deficit found requires triple of both the number of PV panels and the battery units of the bank (beyond the oversize of the battery charger unit). Using
Table 1 as reference, the cost of this additional equipment reaches the amount of 6920.00 €. (7873% more than the two proposals).
Related systems found in the literature to control a mini-grid of streetlights concern power line communication (PLC) [
29] or wireless [
30] data networks to interact with the luminaires and the criteria to dim the luminaires are based in the presence of users (detected using sensors) or the expected usage of the via based on timing criteria [
31,
32].
The economic evaluation of these systems is complex, as expressed by Vieira et al. [
33]: “Initially the developed IoT system was considered not worth the investment, the initial investment would not be fully recovered before the end of the battery life. However, it was worth the investment in the isolated areas where there was no power supply.” In all these cases listed, the system studied allows complex energy saving schemes and point-to-point dimming capability. However, the expressed budget of these control systems surpasses our proposal greatly and makes them non-affordable by most markets which cannot assume large payback periods.
9. Testing Procedure of the Improvement of the Installation
With the battery bank fully charged, the power grid is connected turning on the luminaries, performing at full power constantly. The lamps operate turned on with the PV disconnected until the energy within the storage equipment reach the fully discharge level. In this installation the load of the five luminaires with LED lamps is exactly constant as the driver included in the luminaires maintain the power consumption constant independently of the variations of the voltage of the battery rank.
The variation over time of the battery charge voltage was recorded during the experiment. This behaviour is shown in
Figure 10. The voltage value measured decreased sharply the first 10 h and then traced a linear decrease that again fell down sharply just a few hours before it reached the cut-off level (22.0 V
DC) when the battery controller turned off the system, 75 h after the start. This means a relevant increment of time from the design criteria capacity to power the installation for three nights without recharging that is generated by the transition from an AC to a DC grid and eliminate all the conversion elements.
This experiment was repeated three times, obtaining an exactly similar behaviour on the discharge curve. The voltage, after the grid is disconnected, immediately rises, showing the open circuit value for this battery model at this level of charge.
After this first experiment, the experience was repeated integrating the electronic regulation systems programmed with one single dimming step. A 70% brightness level regulation was programmed to be activated when reaching a voltage battery value of 24 V
DC. This value means, approximately, 50% of the total energy that can be stored. With this configuration the system endured 115 h before reaching again the depth of discharge of the batteries (see
Figure 11). This is 53% more active operation time from the previous experience without the control architecture.
10. Conclusions
The implementation of autonomous lighting installations based on photovoltaic generation in latitudes that are far from the equator are expensive and complex due to the need to use batteries to sustain consumption during the night and, also, to the high discrepancy between the duration of the day and the night in summer and winter that affects not only the energy that can be generated but also the increase in energy consumption implied by more night hours. Actually, a system that does not fail in the most adverse conditions needs to be oversized to almost triple the costs of an equivalent installation located on the equator. The percentage of the weight of the batteries in our installation model has been analysed in a particular way, reaching a value of around 70%.
In this work, the theoretical dimensioning of an installation has been assessed, not for the worst case (winter) but for the average situation of the spring/autumn equinoxes. This installation has been assembled and its real behaviour has been exhaustively tested over six months (December and March), covering the winter and spring seasons to see the discrepancies of the real situation with the calculation estimate. A lower effective yield than expected was found, which delved further into the installation’s energy deficit. In this situation, an autonomous lighting equipment with photovoltaic systems is not reliable in the winter months, leading to sudden shut down of the system during the night.
In order to cover the energy deficit, two lines of work have been exposed. The first is based on improving the overall efficiency of the system by making the entire system work in SELV, reducing the number of components (the inverter) and losses in electrical conversions. Besides, in this case, and without going into assessing a possible improvement of the efficiency of the loads (such as a switch to LED technology), an efficiency improvement of 15% can be achieved by partially increasing the section of part of the wiring of the grid.
On the other hand, the integration of an electronic management system is defended to regulate the consumption of the luminaires in the cases in which the stored energy drops to levels that could compromise the shutdown of the installation. This allows improvement of the operation time of a standalone lighting installation with several points of light by reducing the energy consumption of the loads at late hours at night. This reduction has been carried out in a progressive way so that the human eye does not easily perceive the dimming process. This system makes it possible to generate a non-linear behaviour of the system, turning on the luminaires at maximum intensity in summer while obtaining maximum energy availability and regulating the brightness of the lamps in winter with the minimum capacity to capture solar radiation. The test results showed that the designed controller operates as designed. The operation hours of the newly designed system, compared with the conventional system, implements only a single dimming step to regulate a maximum of 70% of brightness which is minimally noticed by the human eye, allowing an increase of 30% of the operating hours without energy harvesting.
Overall, it has been demonstrated that an optimized configuration of the power grid and its loads can be achieved introducing a centralized control system that can adapt the consumption and the brightness of the luminaires based on the trend of the energy consumption and its present availability. With such a system it is possible to maintain working the installation, dimensioned for the average night duration, in the worst-case conditions of winter without a significant loss of functionality beyond the adaptation (more or less severe) of the global lighting illuminance, while always maintaining the required uniformity. This is considered an acceptable and sustainable behaviour by global energy saving regulations.


 ,
, 


