Article

Efficiency Evaluation and Selection Strategies for Green Portfolios under Different Risk Appetites

1
School of Economics, Qingdao Agricultural University, Qingdao 266109, China
2
School of Economics, Ocean University of China, Qingdao 266100, China
3
Marine Development Studies Institute of OUC, Key Research Institute of Humanities and Social Sciences at Universities, Ministry of Education, Qingdao 266100, China
*
Author to whom correspondence should be addressed.
Sustainability 2021, 13(4), 1933; https://doi.org/10.3390/su13041933
Submission received: 13 January 2021 / Revised: 3 February 2021 / Accepted: 8 February 2021 / Published: 11 February 2021
(This article belongs to the Section Economic and Business Aspects of Sustainability)

Abstract

:
Since investors have diverse risk motives for green investments, this paper uses data envelopment analysis (DEA) and simulation to accurately evaluate the efficiency of green portfolios from the perspective of investors’ subjective risks and accordingly provide suitable investment selection strategies. On the one hand, the paper integrates investors’ risk preferences with efficiency evaluation models under the framework of behavioral finance, and then constructs a green portfolio efficiency evaluation model based on cumulative prospect theory on the basis of defining green portfolio efficiency. On the other hand, by bringing realistic Chinese stock data into the evaluation model and solving it with the help of large number iteration and DEA, the trends of frontier movements and selection options of green portfolios under the influence of different risk preferences are obtained and analyzed. The empirical simulation reveals that: (1) if investors’ risk aversion at return rises, it will not only reduce the expected prospective value of the green portfolio, but also shift down and flatten the frontier of the green portfolio; indicating that investors will tend to reduce their risk-tolerant attitude and prefer a conservative strategy under the same value condition. (2) If investors increase their risk-seeking in the case of losses, this will raise the expected prospect value of the green portfolio and lead to an inward and steeper green portfolio frontier; suggesting that, given equal value, investors prefer to increase their risk-taking capacity and use aggressive strategies in the hope of turning the profit around. (3) The efficiency results of green portfolios are very sensitive to changes in investors’ risk preferences, suggesting that investors need to select and match green portfolios with their own risk appetite levels. The above findings enrich and expand the risk types and evaluation models in previous green investment studies from the perspective of investors’ subjective risk.

1. Introduction

As environmental awareness of sustainable development grows, investors in financial markets are increasingly focused on green investments, but investors’ attitudes to risk are also becoming more complex. On the one hand, if an enterprise focuses on the production and research of green products, this process requires a large amount of capital investment and it is usually difficult to obtain high profits in the short term, resulting in the performance of the enterprise may not be bright, so the risk characteristics of the investment are significant; on the other hand, companies with good social responsibility, green and environmentally friendly, often have a good market reputation and are more likely to be recognized and supported by investors, so the risk-averse function of the investment can be reflected. However, such excessive investor attention can easily lead to a ‘herding effect’, which can lead to irrational investments and exacerbate risks. Therefore, not only should green investment products themselves be the focus of attention, but the choice of green investment strategy, influenced by investors’ risk attitudes, also requires scientific decision-making. In other words, what happens to the expected performance of green investments when investors become more or less risk-averse? In addition, the wide choice of green investment products has not only made portfolios largely replace single-asset investments as the mainstream, but also made portfolio efficiency based on input-output measures a key concern for investors. Therefore, the main focus of this paper is on how to accurately evaluate the efficiency of green portfolios based on investors’ risk appetite, and then select the optimal green portfolio that suits investors’ risk tolerance.
In summary, this paper constructs a model for evaluating the efficiency of green portfolios based on cumulative prospect theory within the framework of behavioral finance, taking the risk motive when investing in green as the inspiration and entry point. The main innovative works are: Firstly, the risk preferences of investors are integrated into the efficiency evaluation of green portfolios, overcoming the limitations of the rational man assumption in traditional efficiency models. Moreover, a definition of green portfolio efficiency is given in the framework of behavioral finance, and a green portfolio efficiency evaluation model based on cumulative prospect theory is constructed accordingly. Secondly, considering the differentiated performance of investors’ attitudes towards risk of gain and loss, i.e., using data envelopment analysis (DEA) method as the main tool, the effect and direction of the change in risk attitudes on the change in the effective frontier of green portfolio efficiency are clarified through sensitivity analysis, while providing a reference for the green investment decision-making behavior of investors with different risk attitudes.
The subsequent structure of the article is set out as follows: Section 2 combs the literature; Section 3 describes the research problem and sets out the basic hypothesis conditions; Section 4 constructs a green portfolio efficiency model based on cumulative prospect theory; Section 5 conducts simulations using actual data to analyze the effect of risk appetite and the investment selection strategy; and Section 6 provides a summary and insights.

2. Literature Review

2.1. Research on DEA-Based Efficiency Evaluation

The mean-variance model proposed by Markowitz [1] is a crucial underpinning of modern portfolio theory. Additionally, in recent years, the non-parametric estimation DEA method [2] has been widely used in portfolio efficiency evaluation due to the concave character of its frontier surface. Moreover, Daraioa and Simarb [3] pointed out that there are two special forms of DEA models, namely the Sharpe index and the Treynor index, further increasing the evaluation application possibilities of DEA. Subsequently, scholars have focused on the improvement and application of DEA models and methods around the realistic constraints of portfolio investment problems. Zhao et al. [4] introduced quadratic constraints into the DEA portfolio efficiency analysis considering systematic risk, unsystematic risk, and excess return to evaluate the performance of open-end mutual funds in China. Galagadera and Silvapulle [5] assessed the efficiency of mutual funds in Australia using the DEA method using the standard deviation of the minimum initial investment from its portfolio as an input indicator and the expected rate of return as an output indicator. Liu et al. [6] systematically studied portfolio performance under market frictional risk disturbances based on a DEA evaluation of portfolio efficiency in terms of cost and trading volume. Lim et al. [7] further considered the return-risk factor in the evaluation process and developed a cross-efficiency based portfolio efficiency evaluation model. Choi and Min [8] conducted a portfolio efficiency measure by incorporating the Treynor and Sharpe indices into the DEA portfolio efficiency index after considering the type of risk in the portfolio in their study. Banihashemi and Navid [9] added CVaR to the input indicators and constructed an evaluation model for application in conjunction with the range directional measure. Zhou et al. [10] attempted to improve on the DEA production frontier as well as examining the rebalancing of portfolios. They also examined the impact of factors such as corporate social responsibility (CSR) and information disclosure by drawing on Chinese mutual fund data. Zhou et al. [11,12,13,14] improved the DEA method and evaluated its application to address the phase-in of transaction costs and the base constraint of the portfolio. Lin and Li [15], based on the directional distance function and diversification DEA models, proposed two diversification super-efficiency models to deal with negative values in risk measures. Xiao et al. [16] constructed bi-level diversification-consistent DEA models to investigate the influence of the uncertainty on the efficiency and ranking.

2.2. Research on Cumulative Prospect Theory

Existing research on portfolio investment efficiency is mainly based on the Markowitz model, however the rational man assumption of this model has been questioned by many scholars. In an environment of many uncertainties, investors tend to exhibit limited rationality and do not consider the pursuit of expected utility as the primary goal of decision making. For example, the famous Allais paradox [17] and Ellsberg’s paradox [18]. These traditional financial market anomalies have led to the continuous improvement of financial research theories. Among them, Tversky [19], based on a large number of experiments and surveys, incorporated psychological theory into the risk decision process, and thus proposed the prospect theory, which marked the beginning of behavioral finance. However, the prospect theory is only a literal descriptive model, without a rigorous mathematical formula to support the theory; moreover, the prospect theory does not satisfy the first-order stochastic dominance theory and cannot be directly applied to decision-making. Kahneman [20] improved on the above problem by developing a cumulative prospect theory and quantifying investors’ risk preferences in the form of a formula, giving it a logically rigorous mathematical derivation that can be easily applied. With the refinement and deepening of the prospect theory, investment optimization and evaluation studies based on this theory are gradually advancing. Pirvu and Schulze [21] investigated the problem of how to allocate their investment weights between risk-free assets and multiple risky assets, providing a two-fund separation theorem based on a portfolio of risk-free and risky assets, and thus provide a two-fund separation theorem based on risk-free and risky portfolios; in particular, Pirvu and Schulze assumed that excess returns based on reference points obey an elliptically symmetric distribution, thus transforming a high-dimensional return distribution problem into a one-dimensional distribution problem, which greatly simplifies the process of solving it. Gong et al. [22,23] performed a proof of equivalence based on a cumulative prospect theory portfolio optimization model suitable for segmented power functions, which not only further simplifies the solution process but also allows for an attempt to solve the model using non-parametric methods. Consigli et al. [24] converted the expected prospective value of a portfolio into a risk-equivalent factor in the form of an equivalence transformation, and then used the risk-equivalent factor to investigate its efficient frontier. Bernhein and Sprenger [25] based on cumulative prospect theory devise a simple and direct nonparametric method for measuring the change in relative probability weights resulting from a change in payoff ranks. However, Hens and Mayer [26] pointed out that realistic investment market asset returns may be singularly distributed in addition to obeying the elliptical normal distribution assumption. Ingersoll [27] pointed out that the non-concave nature of the prospect-theoretic utility function may polarize portfolio optimization. Because some of the parameter settings of the probability-weighting function can lead to certain consequences might be found which would not obtain were only positive decision weights allowed, or conversely ‘general’ propositions might remain unverifiable. Grishina et al. [28] introduced stochastic optimization algorithms to the portfolio optimization process, but ignored the prerequisite assumption of distortion of weights.

2.3. Research on Green Investment

From a personal investment and financial perspective, green investments include not only investments in company shares, but also individual company bonds and other credit instruments and mutual funds. The criteria for the selection of such companies are still environmentally friendly and socially desirable. The “green” aspect of investment can therefore be summarized in two ways: on the one hand, the choice of investment in companies that carry out production, research, and development (R&D) of green products. For example, Ino and Matsumura [29] examined the government’s green portfolio criteria for both the purpose of limiting non-green output and promoting green output, using the green outputs and grey polluting outputs of firms as an entry point. A similar study is the renewable portfolio standards studied by Bento et al. [30]. On the other hand, the focus is on green performance in corporate management, which is based on a composite indicator score such as corporate social responsibility. For example, Chakrabarti and Sen [31] used the Dow-Jones Global-Total-Stock-Market Index to set stocks of environmentally friendly companies as green stocks and tested the effectiveness of a green portfolio consisting of a regional green index. Allevi et al. [32] argued that the green investing is a subset of socially responsible investment (SRI), thus determining green funds in their study with the help of a series of indicators of corporate social responsibility.
Accordingly, this paper argues that because of the many uncertainties in the process of R&D and production of green products, there is no guarantee that an enterprise is necessarily an environmentally friendly green enterprise. However, as CSR generally covers the assessment of environmental inputs, companies with good CSR tend to be more likely to be green companies. Therefore, in this paper, the empirical study of green portfolios is conducted by first screening for greenness based on CSR scores, followed by subsequent studies.

2.4. Review

In summary, the following shortcomings of existing research remain, providing an entry point for this paper: firstly, for the time being, portfolio efficiency measurement models are still based on the traditional Markowitz model, which basically assumes that investors are risk averse. However, investors present different risk preferences when faced with different scenarios of losses and gains have been shown to be prevalent in financial markets. Secondly, while the existing literature has begun to experiment with introducing prospect theory into portfolio decisions, it has failed to achieve an applied integration in portfolio efficiency evaluation models. Moreover, the research focuses on the impact of passive risk factors on the desired effects of portfolios, and lacks an effective frontier to explore whether and how investors’ subjective different risk attitudes affect portfolio efficiency. Thirdly, existing research has rarely considered the evaluation of the efficiency of green portfolios. However, green financial investment is a performance concern that takes into account the green performance of companies, making investors’ risk attitudes potentially more sensitive to the impact of green asset evaluation results and selection motives, and thus deserving of special attention.

3. Problem Description and Underlying Assumptions

This paper focuses on the efficiency of a multi-asset green portfolio, considering the case where the portfolio contains one risk-free asset and multiple risky green assets. This paper therefore assumes that: rf is the financial market return on the risk-free asset; ri (i = 1, 2, 3…, n) is the return on the risky green asset of the security i; W0 is the investor’s initial investment amount; xi (i = 1, 2, 3…, n) is the investment amount (weight) on the risky asset i. After the investment amount on the risky asset has been allocated, the remaining investment amount will be invested in the risk-free asset. Therefore, the final investment wealth W1 at the end of the investment period of the portfolio is
W 1 = ( W 0 i = 1 n x i ) 1 + r f + i = 1 n x i 1 + r i = W 0 ( 1 + r f ) + i = 1 n x i r i i = 1 n x i r f
For cumulative prospect theory, there are three basic assumptions that differ from traditional portfolio efficiency evaluation models, which are described mathematically as follows.

3.1. Anchor Point Deviation

Within the framework of cumulative prospect theory, investors tend to evaluate the benefits of their portfolios not in terms of the absolute value of their final wealth, but rather in terms of their portfolio benefit metrics relative to other return anchors or targets that divide portfolio benefit outcomes into gains and losses. Therefore, this paper defines the green portfolio anchor point deviation as
D = R p r s ,
where D denotes the deviation of the portfolio return from the anchor point; rs represents the value of the return at the anchor point; and RP denotes the expected return of the asset portfolio over the investment period. In Equation (2), since RP is a random variable, the deviation D from the anchor point is also a random variable, i.e., |E(D)| < , |Var(D)| < .

3.2. Perceived Value Function

Cumulative prospect theory suggests that investors have two distinct attitudes to losses and gains. In a gain situation, investors tend to be risk averse and lock in their gains in a “pocket-friendly” manner in order to minimize their risk exposure, while in a loss situation, investors show an excessive appetite for risk in order to turn their losses into profits. Based on this, the segmented value function proposed by Tversky [19] and Kahneman [20] is used as the base value function for this model, which is expressed as
v t = v + t , t 0 v t , t < 0 ,
v + t = t α , 0 < α < 1 v t = λ ( t ) β , λ > 1 , 0 < β < 1 ,
where t is a random variable for the deviation D of the anchor point; v+(t) denotes the value function when it is in profit relative to the anchor point; −v(−t) denotes the value function when it is in loss; α represents the risk attitude coefficient of an investor whose portfolio is in gain; β represents the risk attitude coefficient of an investor whose portfolio is in loss; and λ is the loss aversion coefficient, which indicates the investor’s sensitivity to losses.

3.3. Weighting Function

Studies related to cumulative prospect theory have found that in real investment markets, investors tend to overestimate the likelihood of small probability events occurring and underestimate the likelihood of large probability events occurring instead. This paper therefore draws on Tversky [19] and Kahneman [20] to set up a weighting function as follows:
w + F D t = F D γ t [ F D γ t + ( 1 F D γ t ) γ ] 1 γ ,
w F D t = F D δ t [ F D δ t + ( 1 F D δ t ) δ ] 1 δ ,
where FD(t) is the cumulative distribution function of D; γ represents the curvature of the probability of gain weight function; and δ represents the elevation of the probability of loss weight function.

4. Construction of a Green Portfolio Efficiency Model Based on Cumulative Prospect Theory

4.1. Model Setting

Further set out in accordance with the preceding assumptions: when the green portfolio is R = (r1, r2, r3, …rn), the expected return of the portfolio is E(R) = μ = (μ1, μ2, μ3, …μn), the covariance matrix Cov(R) = ∑, and is a positive definite matrix; xn+1 is the weighting of investments in risk-free assets (as a percentage of investment amounts), satisfying i = 1 n x i + x n + 1 = 1 ; the return follows a normal distribution, disregarding financing and financing transactions as well as transaction costs. When the investment weight is x = (x1, x2, x3, …, xn), this paper gives the following formula for the deviation of the portfolio anchor point D(x):
D x = x 1 r 1 + x 2 r 2 + + x n r n + x n + 1 r f r s = x R + x n + 1 r f r s .
Since returns follow a normal distribution, R ~ N n μ , , and hence D x ~ N μ D , σ D 2 is obtained, where
μ D = x μ T x n + 1 r f r s σ D 2 = x T x .
Based on the above conditions, this paper gives the cumulative expected prospective value of
V D = 0 + v + t d w + 1 F D t + 0 v t d w F D t .
Considering that the above equation is too complicated to calculate, this paper refers to an alternative cumulative prospect theory portfolio optimization method given by Gong et al. [22,23] which is suitable for portfolio value functions as segmented power functions, so that the above equation is equivalent to
V ( D ) = 0 + w + 1 F D t d v + t 0 w F D t d v t .
We can therefore give a green portfolio optimization model based on cumulative prospect theory as
max     V D x s . t .   i = 1 n x i 1 , x i 0 , i = 1 , 2 , 3 , , n .

4.2. Definition of Efficiency

Using the green portfolio model based on cumulative prospect theory (Equation (11)), this paper gives the efficient frontier of a green portfolio considering risk preference. Since economics often measures the maximum output capacity that can be achieved by a production unit at a given level of inputs in terms of technical efficiency, the frontier is then expressed using the proximity of the actual production activity of each production unit compared to frontier production. Therefore, this paper draws on the concept of technical efficiency and defines the green portfolio efficiency based on the cumulative prospect theory by projecting the portfolio to be evaluated onto the efficient frontier (i.e., the corresponding optimal portfolio point) with the help of the distance to the frontier surface. That is, the ratio of the desired prospect value of the green portfolio to the ideal (maximum) desired prospect value for the same level of risk.
As shown in Figure 1, the curve AB is the true frontier of a green portfolio based on cumulative prospect theory consisting of one risk-free asset and multiple green portfolio risk assets; C is a portfolio to be evaluated; V3(D) denotes its expected prospect value; σ32 denotes the corresponding variance; CD and CE are the vertical lines from point C to the X and Y axes respectively, and intersect the frontier at points A and B respectively; then point A is the projection point of portfolio C on the prospect value-oriented frontier.
The efficiency of a green portfolio based on cumulative prospect theory can therefore be defined as
P E C V = C D A D = V 3 D V 1 D .
The above definition of portfolio efficiency is idealized based on the true frontier. However, due to the complexity of the real investment environment, the true frontier is not available, which makes it difficult to determine the green portfolio efficiency. Considering that when the green assets are diversified, the mean-variance model portfolio efficient set and the prospect theory portfolio efficient set are basically the same, and their frontiers are both concave functions. Therefore, the efficiency of the model can be analyzed and evaluated by means of the DEA method based on the concave function characteristics of the frontier surface of the cumulative prospect theory-based asset portfolio.

4.3. A Green Portfolio Efficiency Evaluation Model Based on Cumulative Prospect Theory

Assuming that the expected prospect value of the green portfolio j (j = 1, 2, 3, …, n) among the n green portfolios selected by the investment decision maker can be mathematically expressed as Vj(D), and the corresponding risk indicator can be expressed as σ j 2 = i = 1 n l = 1 n x i j σ i l x l j . In this paper, the risk factor is taken as the input variable, the expected prospect value is taken as the output variable, and the variable payoff of scale is assumed, therefore the following cumulative prospect theory-based green portfolio efficiency can be developed as an evaluation model:
max     φ s . t . j = 1 N λ j ( i = 1 n l = 1 n x i j σ i l x l j ) ( i = 1 n l = 1 n x i j 0 σ i l x l j 0 ) j = 1 N λ j i = 1 n V j D φ i = 1 n V j 0 D j = 1 N λ j = 1 λ j 0 , j = 1 , 2 , 3 , , N ,
where ϕ represents the efficiency value measured by the relevant portfolio’s decision-making unit (DMU) and λj represents the weight assigned to the green portfolio j decision unit by the efficiency evaluation model. It should be noted that since the cumulative prospect value of a given green portfolio is influenced by the risk appetite of the investment decision maker, i.e., the risk attitude coefficient α for gains and the risk attitude coefficient β for losses. This paper therefore draws on the above evaluation model to provide a detailed analysis of the efficiency of green portfolios with heterogeneous risk preferences.

5. Simulation Analysis

5.1. Data Selection and Earnings Distribution

In this paper, based on the idea that socially responsible investment is also a kind of green investment [32], we use CSR scores to screen green stocks and thus obtain portfolio data. The steps are as follows: (1) to obtain the annual CSR scores of Chinese A-share listed companies by industry using Hexun’s highly recognized CSR database in China. (2) Setting listed companies with CSR scores higher than their sector scores as green companies. (3) Based on the ticker symbols of green companies, we obtain their yield data from the China WIND database to form a pool of green stock candidates. (4) To ensure an adequate time span for the sample size, the sample data node was set from January 2012 to December 2019. (5) The sample of companies whose listing time does not meet the 8-year time span, whose CSR score in a year within the time period is lower than the industry score, ST and PT were excluded, and 1863 green companies were finally identified from 51 industries. (6) After importing the green stock pool data into SPSS, four stocks were randomly selected as the study sample (stock codes: 603360, 002320, 600327, and 603808) with the help of the simple random sampling function of SPSS. The statistical characteristics of the stocks’ expected return data were obtained as shown below.
The reason for the choice of four stocks for the stock sample needs to be explained in particular: on the one hand, the number of four stocks is basically representative of the asset diversification in the portfolio; and the matching portfolio formed after 3000 iterations of calculation can basically cover all asset portfolio scenarios in reality. On the other hand, this paper uses the trend of the frontier surface for portfolio efficiency evaluation, and the trend of the frontier surface after the large number of simulations does not inherently reverse due to the actual number of stock choices. In this regard, the simulation results when three green stocks are re-randomly selected are shown in the Appendix A to illustrate the robustness of the conclusions.
μ = ( 0.04 ,   0.015 , 0.039 , 0.027 )
= 10 5 × 11.45 4.69 2.29 7.01 4.69 16.9 3.16 6.02 2.29 3.16 12.77 2.96 7.01 6.02 2.96 24.34
where μ represents the expected return vector of the four selected green securities and ∑ represents their covariance matrix; the risk-free asset return of the financial market is 2%; the anchor value of the asset portfolio is the risk-free return of the financial market. In this paper, we follow the elliptical distribution assumption proposed by Pirvu and Sceulze [21], and assume that the four stocks obey a one-dimensional elliptical random distribution, which means that the portfolio returns also obey an elliptical distribution. In addition, considering that elliptic distributions include various forms of random distributions, and for the convenience of calculation, the multivariate normal distribution is chosen as the base distribution for the solution in this paper.

5.2. Comparative Analysis of Efficiency Frontiers under Different Risk Preferences

In order to consider the role of risk preference on the green portfolio frontier i.e., the impact of the risk aversion coefficient α in the gain state and the risk seeking coefficient β in the loss state on changes in the efficiency frontier. In this paper, the values of α and β are assigned several times with the help of Matlab. A total of 3000 iterations of random weight assignments are made by computer for the four stocks with different investment amounts (weights), resulting in 3000 sets of green portfolios to be evaluated with different expected prospect values and risk indicators. Based on the above, the DEA method is applied to construct the frontier of a green portfolio, using risk indicators as inputs and expected prospect values as outputs, in order to observe the impact of changes in risk parameters on the frontier. It should be noted that carving a portfolio on the axis of risk and return is a reflection of the profit-seeking nature of investors, i.e., the pursuit of maximum return for a given risk, which is one of the basic assumptions of a classical portfolio [1]. Furthermore, since the loss aversion coefficient λ of investors changes the expected prospective value of a portfolio in the same proportion, it does not have an impact on the efficiency outcome of the portfolio, nor does it have an impact on the efficiency frontier. This paper therefore draws on Tversky’s and Kahenman’s parameter settings [19,20] such that λ = 2.25.
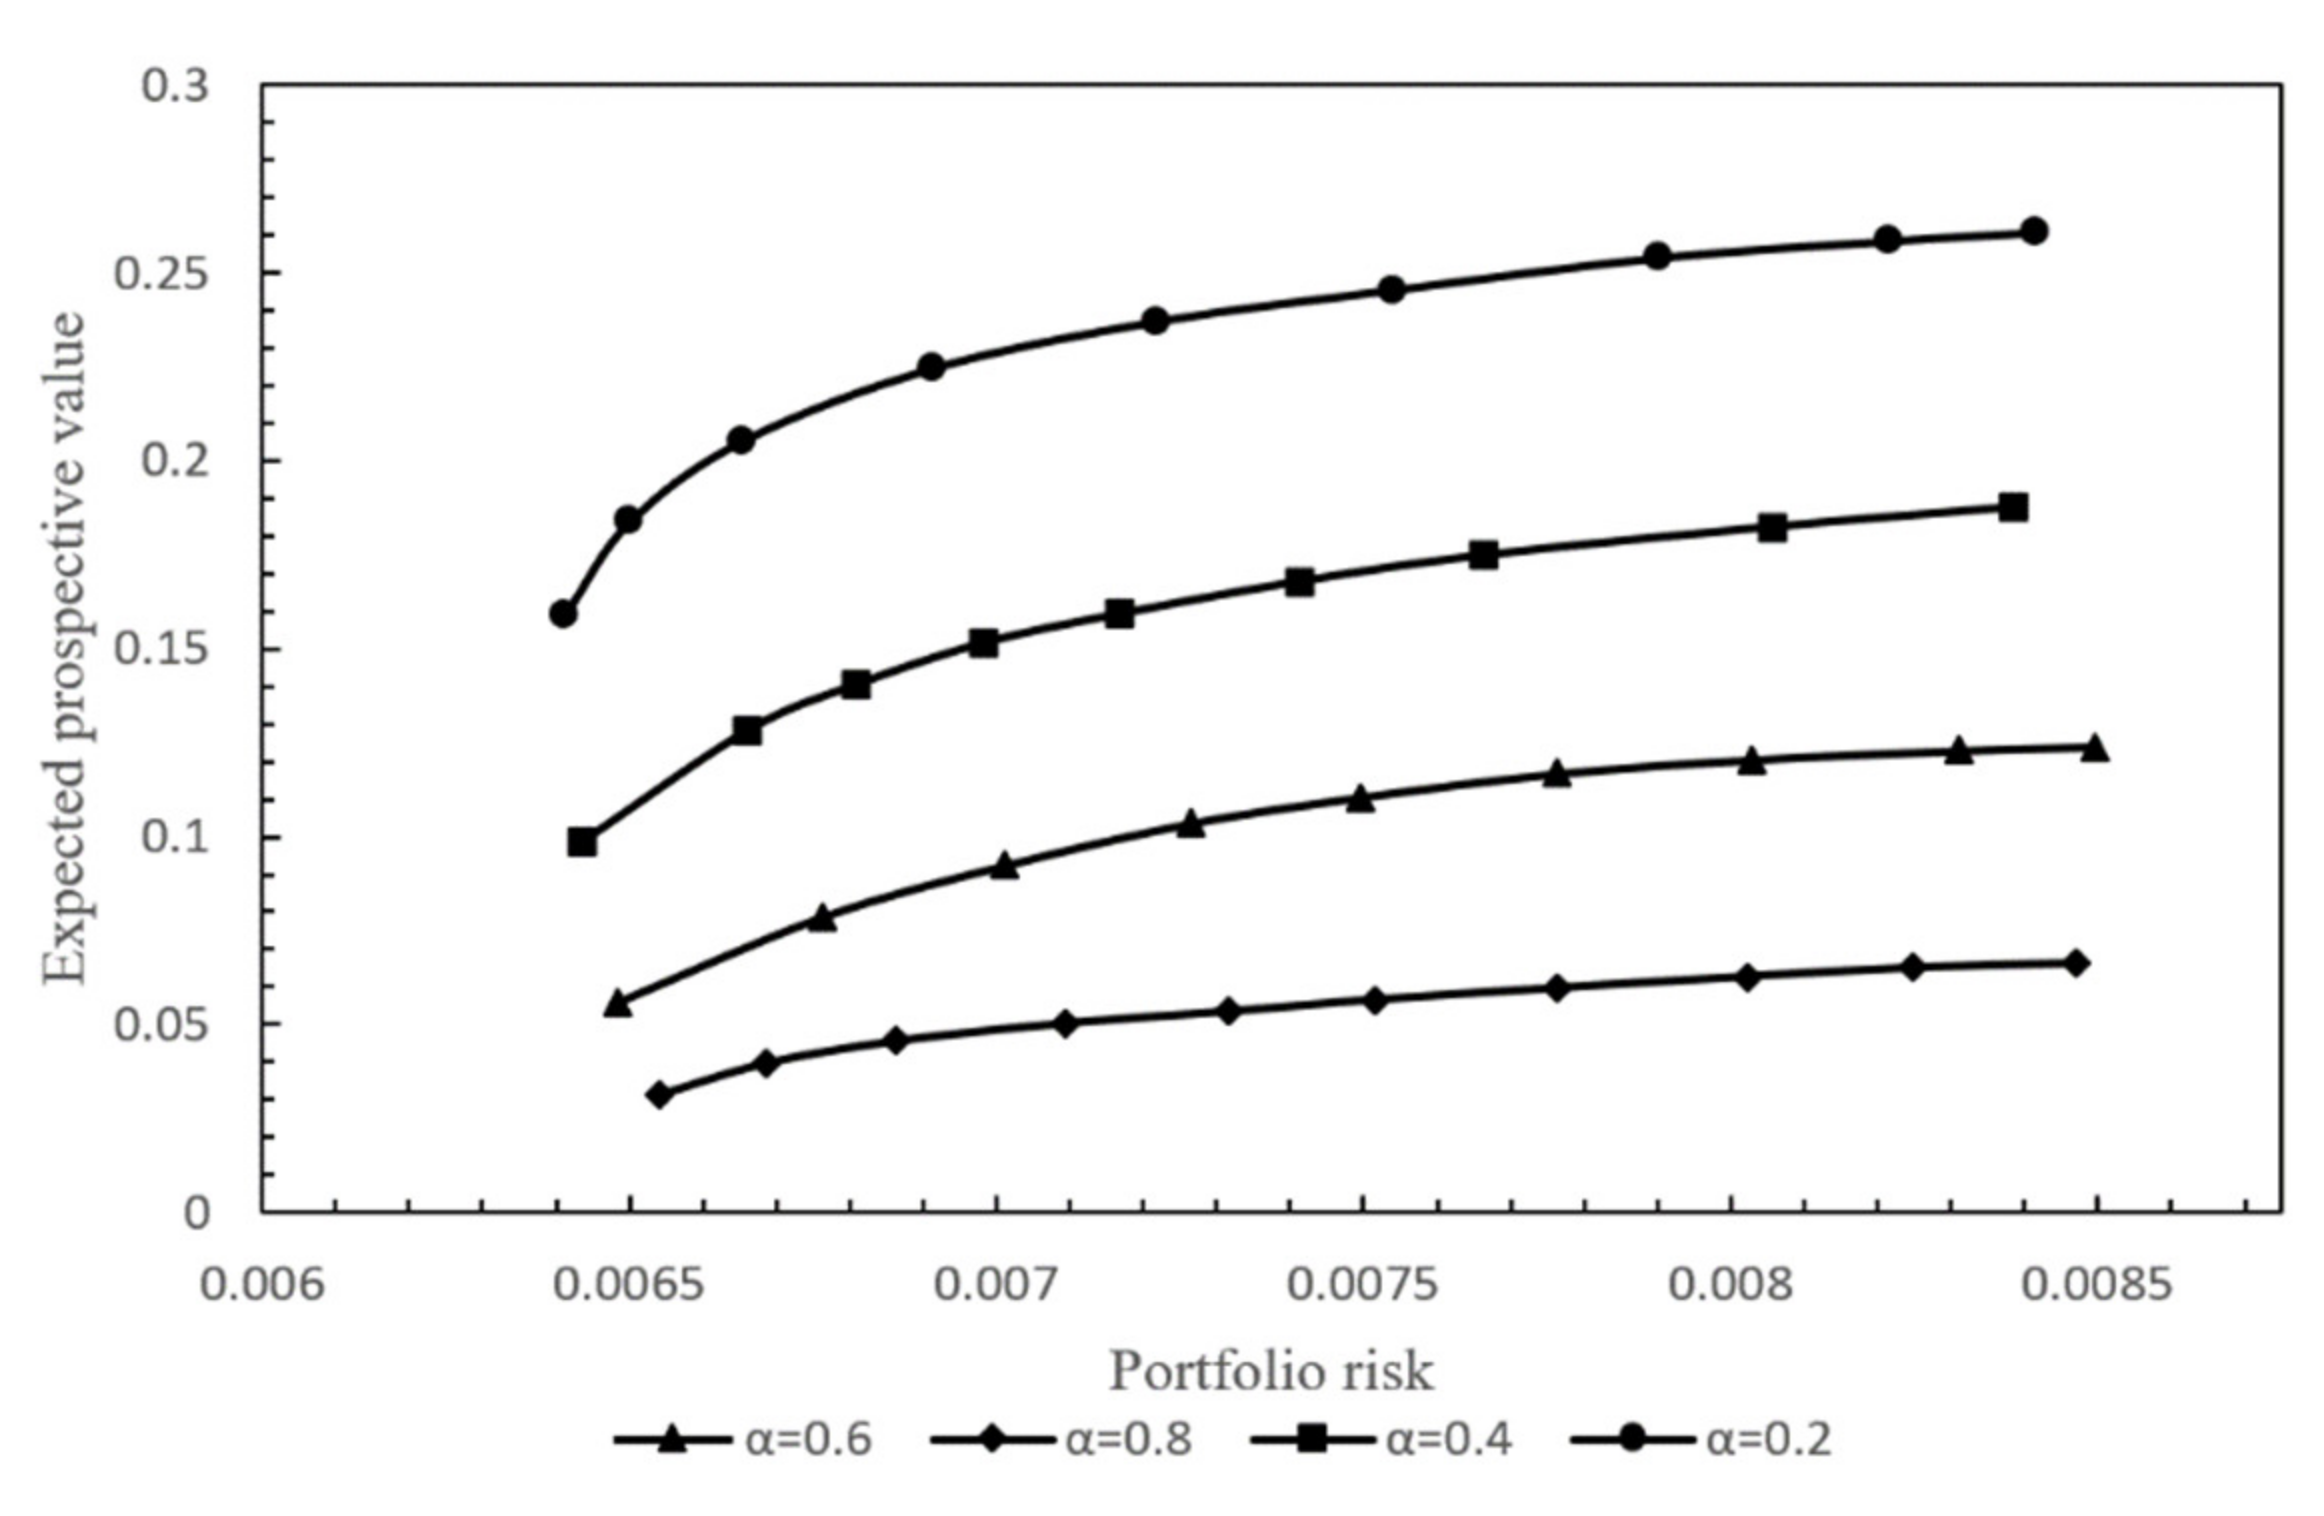
First, this paper tests the impact of the risk aversion parameter α at the time of return on the frontier surface. Using the DEA model to measure the efficiency of 3000 groups of green portfolios under four different levels of risk aversion states, the four types of green portfolio efficiency frontiers of α = 0.2 α = 0.4 α = 0.6 α = 0.8 are constructed, respectively. The simulation results are shown in Figure 2. To facilitate the calculation, the parameters of other variables were set with reference to Tversky and Kahneman’s parameter settings [19,20], i.e., β = 0.88 γ = 0.61 δ = 0.69.
As shown in Figure 2, when other parameters are held constant, the efficiency frontier surface moves downwards as parameter α increases and the shape of the frontier surface tends to flatten out gradually. This can be interpreted as meaning that as the level of anchor point returns is positive, then within the framework of cumulative prospect theory, the expected prospect value of the corresponding green portfolio decreases as the risk aversion factor α at return rises. This is reflected in a ‘sinking’ of the efficiency frontier as the parameter α increases. This may be due to the fact that if the risk aversion of investors becomes more pronounced, the proportion of conservative investments increases; for the same expected prospect value, the risk attitude of investors becomes less tolerant, leading to a less risky choice of portfolio.
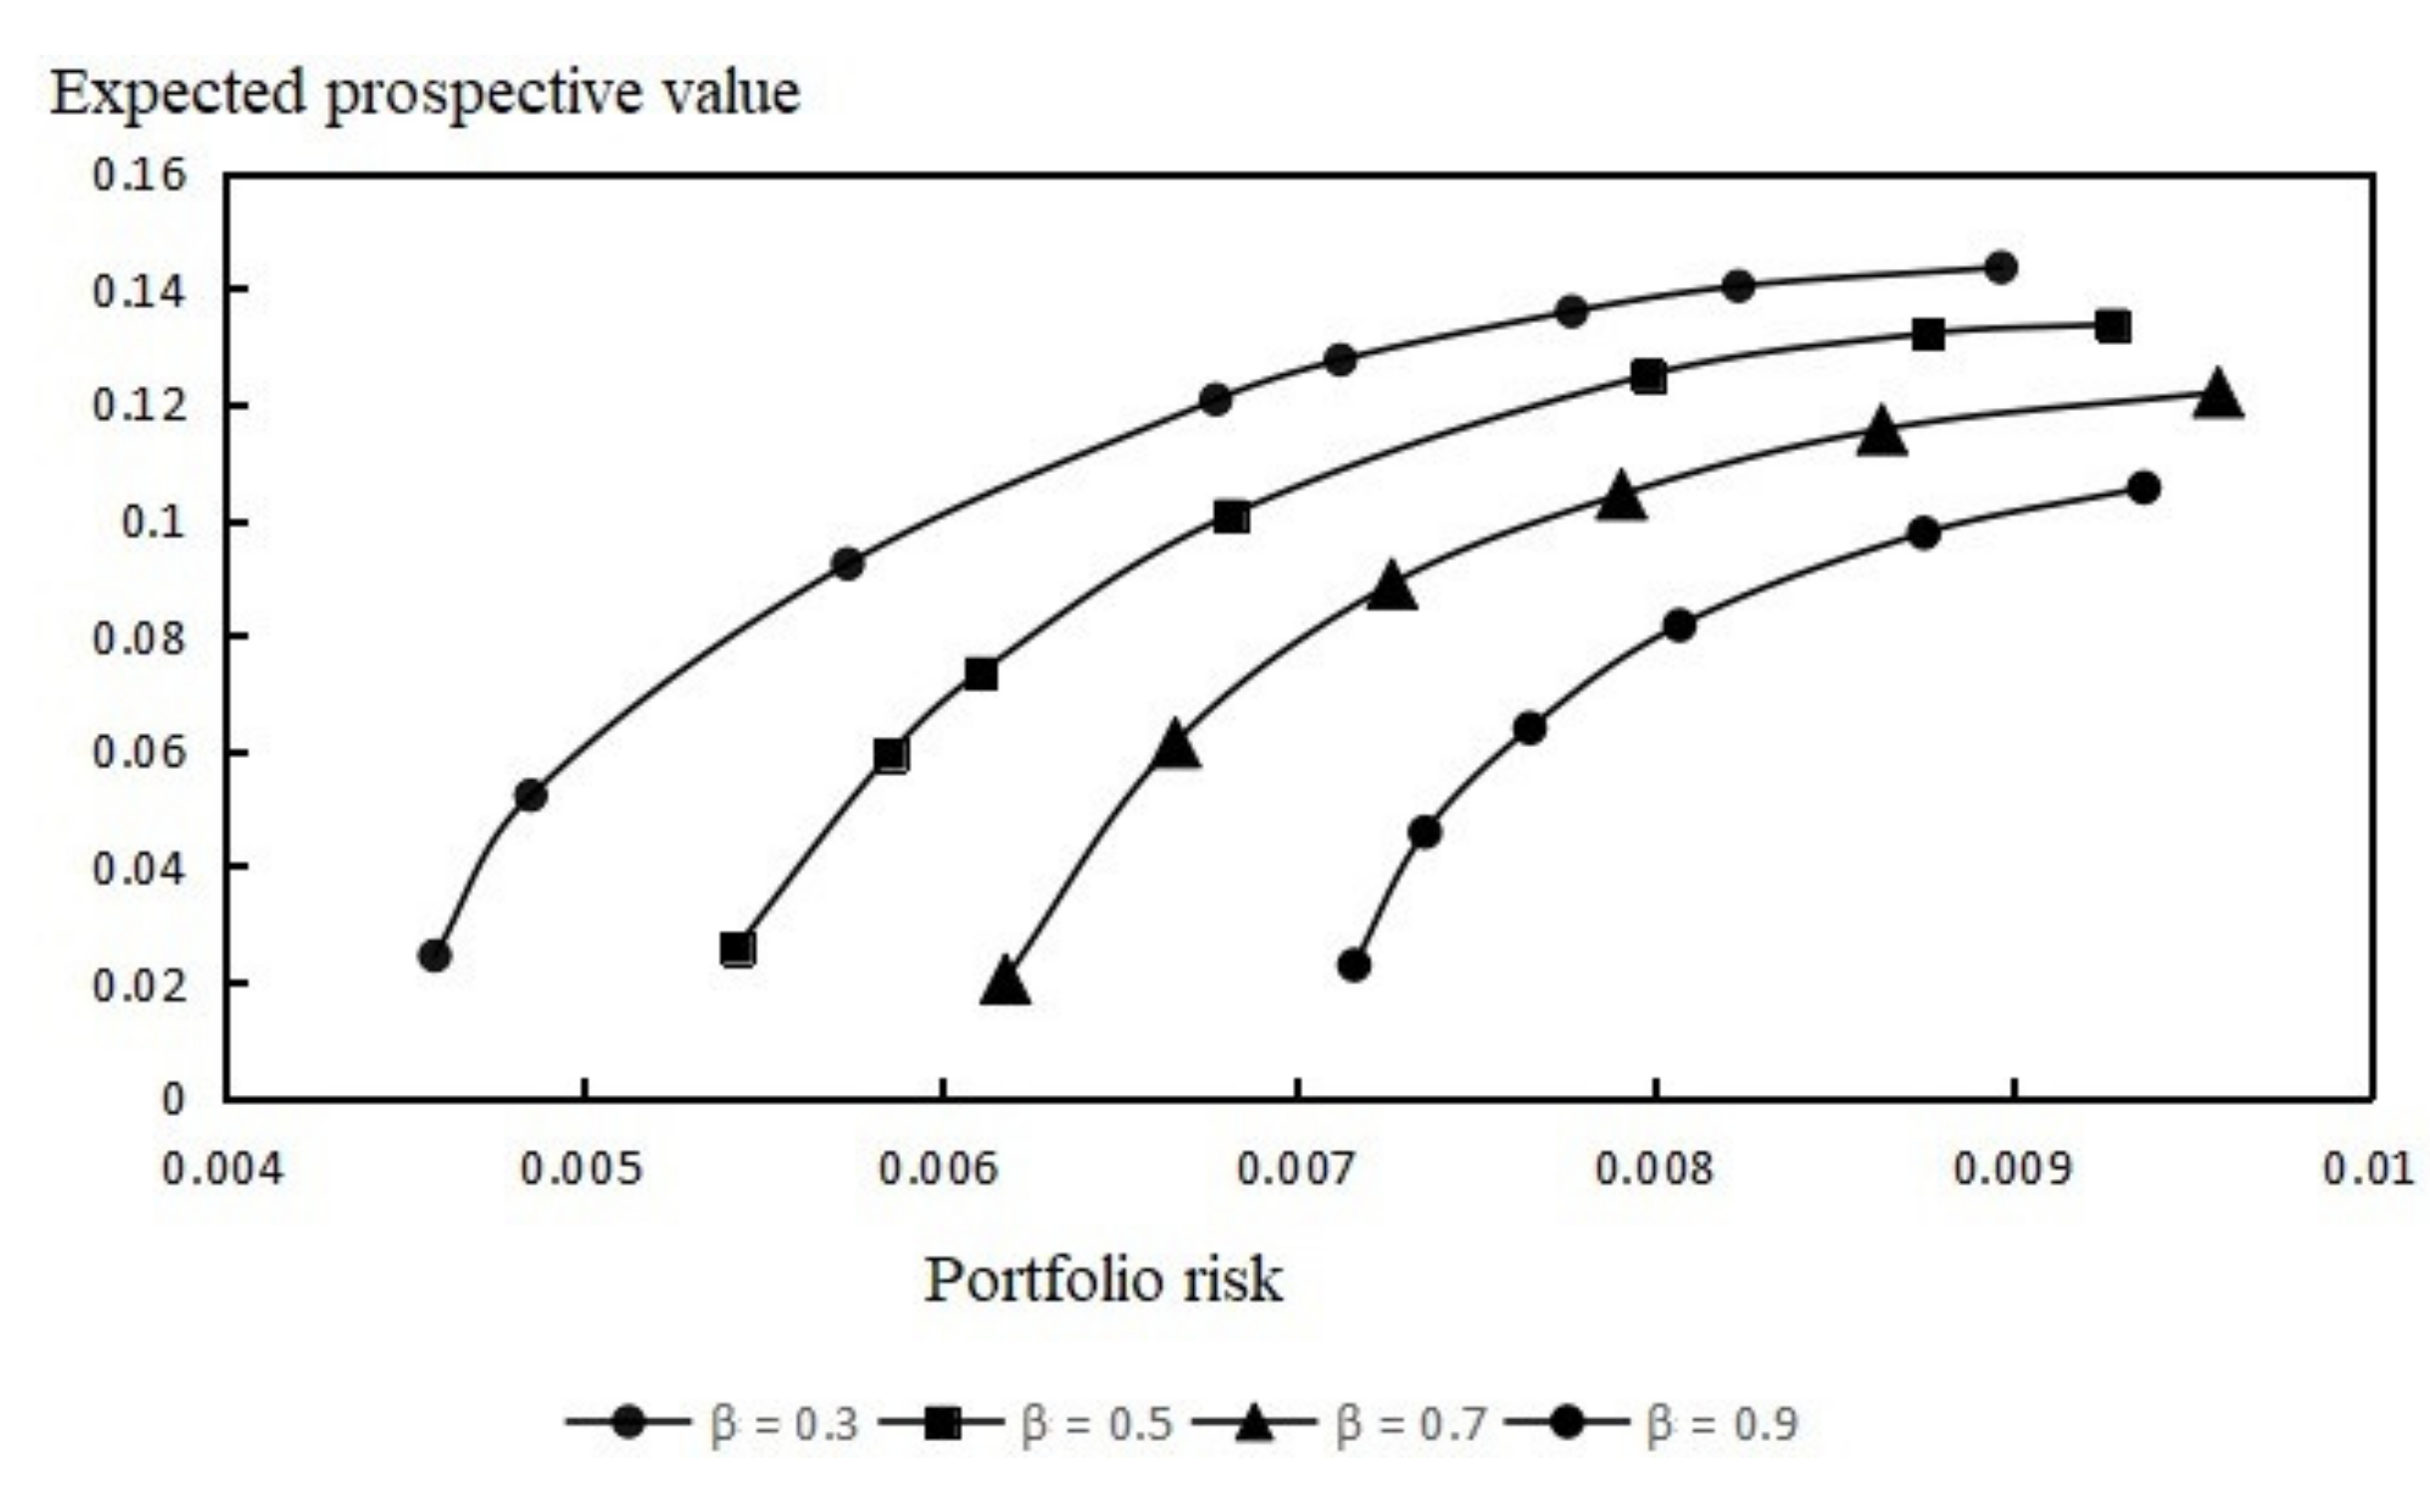
Secondly, this paper analyses the impact of the risk-seeking factor β on the frontier at the time of loss. As mentioned before, after setting the base parameter value (α = 0.6 γ = 0.61 δ = 0.69), using the DEA model to measure the efficiency of 3000 groups of green portfolios with four different parameter value of β = 0.3 β = 0.5 β = 0.7 β = 0.9, which in turn constructs the corresponding green portfolio efficiency frontier. The results are shown in Figure 3.
As shown in Figure 3, all else being equal, the efficiency frontier of the green portfolio converges inwards as the risk-seeking factor at loss β increases and the slope of the efficiency frontier curve steepens. This can be interpreted as meaning that, since the portfolio has a positive rate of return at the anchor point, the green portfolio efficiency frontier converges and becomes more sloped as the risk-seeking factor β at loss increases within the cumulative prospect theory framework. What is more, if the risk of a green portfolio increases, the expected prospect value associated with it increases. Therefore, for the same level of expected prospect value, investors will tend to take on a higher risk preference.
The above results identify suitable portfolio matching strategies for investors from a subjective risk attitude perspective. This is because previous studies on the impact of risk have tended to focus on the external risks of investors, such as the risk of financial assets themselves and background risk. Moreover, such studies have largely accepted the view that “when investors are exposed to greater risk, they tend to invest more of their wealth in low-risk financial assets rather than in risky assets” [33,34,35,36]. However, the results of this paper, by introducing investors’ subjective risk attitudes into the evaluation of green portfolio efficiency, yield heterogeneous risk-seeking strategies for both gains and losses, i.e., ‘conservative’ strategies for gains and ‘aggressive’ strategies for losses. This covers and extends the existing findings.

5.3. Green Portfolio Efficiency Evaluation Analysis Based on the Cumulative Prospect Theory Framework

The efficiency of the green portfolio is solved according to Model Equation (13), taking into account the variation of the two risk factors. In this paper, 14 sets of DMUs for the green portfolio are set for each type of risk factor in order to add as many control groups as possible while covering the optimal DMUs.
To verify the impact of heterogeneous risk preferences on green portfolio efficiency, the differential assignment of the return risk aversion coefficient α and the loss risk preference coefficient β is carried out. This subsection follows the settings for each parameter in Section 5.2, assuming β = 0.88 γ = 0.61 δ = 0.69. On the one hand, the green portfolio efficiency scores (φ) are calculated separately for the four different risk attitudes of α = 0.2 α = 0.4 α = 0.6 α = 0.8. The results and their rankings are shown in Table 1. On the other hand, the green portfolio efficiencies are measured and ranked for different loss risk seeking coefficients β = 0.3 β = 0.5 β = 0.7 β = 0.9 based on parameter α = 0.6 γ = 0.61 δ = 0.69. The results are shown in Table 2.
From Table 1 and Table 2, it can be illustrated that the green portfolio efficiency can be effectively evaluated and ranked using Model Equation (13). Further analysis reveals that there are also significant differences in the results of the evaluation of the efficiency of green portfolios at different levels of risk preferences. This may be due to the heterogeneity of investors’ risk attitudes, which leads to differences in their perceptions of the prospective value of each green portfolio and thus affects their evaluation of the efficiency of each green portfolio. For example, when the return risk aversion coefficient α = 0.2, then the investor faces a low level of risk aversion to returns and the optimal green portfolios available are 4, 6, 7, and 10; however, if the level of risk aversion at return increases (e.g., α = 0.8), the optimal green portfolios become 7 and 13; in particular for portfolio 4, its efficiency ranking becomes 14th from 1st, evolving into a green portfolio with a low level of efficiency. Similar to the results for α, changes in investors’ attitudes towards loss risk appetite β have a similar effect on the efficiency and ranking of green portfolios. Therefore, heterogeneous risk-averse investors can reasonably evaluate the performance level of their green portfolios based on the efficiency values measured by the model in order to select a green portfolio construction approach that is suitable for their own risk tolerance level.

6. Conclusions and Insights

This paper constructs an evaluation model of green portfolio efficiency based on cumulative prospect theory. On the basis of defining the efficiency and solution orientation of the model, the attitude of investors’ risk preferences is innovatively introduced into the evaluation process of green portfolio efficiency. This idea not only enables the construction and evaluation of green portfolios to better match investors’ subjective risk preferences, but also more closely resembles investment decisions in real financial investment markets. The main findings and implications of this paper are as follows.
(1) In the gain state, if the risk aversion of investors increases, the expected prospect value of a green portfolio will decrease. At the same time, the efficiency frontier will sink as α rises and gradually flattens out, suggesting that it is more appropriate for investors to reduce their risk tolerance at the same value. Investors’ attitudes and investment choices should therefore be based on a conservative strategy, with an increased allocation to risk-free assets. The conclusion of this article is similar to the current insights from risk research, i.e., that investors need to gradually shift their asset investment focus towards preservation of value when their green portfolios are gaining.
(2) In the loss state, if the additional risk of the green portfolio rises by one unit, the expected prospect value will rise. At the same time the efficiency frontier tends to converge as β rises and the slope of the frontier becomes larger. This suggests that, in the current state, the investor’s risk tolerance should increase in order to maintain the same expected value. This conclusion fully reflects the basic risk attitude supported by cumulative prospect theory, i.e., even when extended to the issue of green portfolio efficiency, it is still preferable for investors to increase their risk-taking in the event of losses in order to pursue a turnaround in adversity.
(3) The findings of this paper point out that investors’ different risk preferences have a greater impact on the efficiency evaluation results of green portfolios, indicating that the green portfolio efficiency evaluation model based on cumulative prospect theory constructed in this paper is effective. Therefore, in the actual investment process, investors need to introduce their own risk preferences in time to achieve an accurate evaluation of the green portfolio efficiency, so as to effectively determine the green portfolio that matches their own risk preference characteristics. Although this paper successfully constructs a model for evaluating the green portfolio efficiency, it uses the complex risk motive of green investment as the main influencing factor and opportunity for writing.
However, the restriction of the model on the ‘greenness’ of a portfolio may not be absolutely specific, and as there is relatively little prior supporting research literature around the evaluation of green portfolio efficiency, these provide possible starting points for the subsequent construction of a proprietary evaluation model for green portfolios.

Author Contributions

Conceptualization, W.Y., S.L. and L.D.; formal analysis, W.Y. and S.L.; methodology, W.Y. and S.L.; writing of the original draft, W.Y. and S.L.; review and editing, W.Y. and L.D. All authors have read and agreed to the published version of the manuscript.

Funding

This research was funded by National Social Science Fund of China (19VHQ002) and Shandong Provincial Natural Science Foundation of China (ZR2020QG019).

Institutional Review Board Statement

Not applicable.

Informed Consent Statement

Not applicable.

Data Availability Statement

Publicly available datasets were analyzed in this study. This data can be found here: [http://stockdata.stock.hexun.com/zrbg/].

Conflicts of Interest

The authors declare no conflict of interest.

Appendix A

The operation was repeated by changing the number of randomly selected 4 stocks to 3 according to the steps in Section 5.1. The re-obtained sample stock codes are: 600559, 603567, 002115. By simulating the frontier and solving for efficiency with the help of DEA, Figure A1 and Figure A2, Table A1 and Table A2 are obtained. The correspondence between the pictures and tables in the appendix and the main text are: Figure A1 corresponds to Figure 2, Figure A2 corresponds to Figure 3, Table A1 corresponds to Table 1, Table A2 corresponds to Table 2.
The comparison reveals that: on the one hand, according to the picture, the trend of the change in the frontier of the new green portfolio under the influence of different risk preferences is similar to the trend in the main text; on the other hand, according to the results in the table, the new green portfolio efficiency evaluation results are still very sensitive to the change in investors’ risk preferences. The above results indicate that the findings of this paper are robust. It also demonstrates that the green portfolio efficiency evaluation model based on cumulative prospect theory constructed in this paper is valid and is not affected by the number of stocks selected.
Figure A1. Ratio of efficiency fronts with different α-parameters.
Sustainability 13 01933 g0a1
Figure A2. Ratio of efficiency fronts for different β-parameters.
Sustainability 13 01933 g0a2
Table A1. New green portfolio efficiency solution for different return risk aversion factors α.
DMUα = 0.2α = 0.4α = 0.6α = 0.8
ScoreRankScoreRankScoreRankScoreRank
10.3563140.6214140.7703111.00001
20.967660.850160.1231140.99954
30.989550.851451.000010.96215
40.7124121.000010.785590.801612
50.949070.843871.000010.765313
61.000010.7569110.879170.93297
70.7968101.000010.864881.00001
80.7013130.6436130.885160.842711
91.000010.7512120.983530.842710
100.839290.775390.7113121.00001
111.000011.000010.912450.712314
120.860880.812480.7720100.95906
130.7427110.888740.978540.87598
141.000010.7627100.1242130.85249
Table A2. New green portfolio efficiency solution for different loss risk appetite factors β.
DMUβ = 0.3β = 0.5β = 0.7β = 0.9
ScoreRankScoreRankScoreRankScoreRank
10.9827 60.5593 81.0000 10.3463 14
20.9282 110.4366 130.4153 120.9013 7
31.0000 11.0000 10.6714 100.4325 13
40.9879 50.3253 140.5973 110.5468 12
50.9984 40.7621 51.0000 10.9812 3
60.6565 121.0000 10.7488 81.0000 1
70.5644 131.0000 11.0000 10.6751 11
80.1167 140.6160 70.7355 90.9022 6
91.0000 10.5572 90.0667 140.9169 5
100.9436 100.5031 110.7590 70.9211 4
110.9533 81.0000 11.0000 10.8890 9
121.0000 10.6312 60.2365 131.0000 1
130.9765 70.4938 121.0000 10.8891 8
140.9524 90.5556 100.7732 60.8875 10

References

  1. Markowitz, H. Portfolio selection. J. Financ. 1952, 7, 77–91. [Google Scholar]
  2. Charnes, A.; Cooper, W.W.; Rhodes, E. Measuring the efficiency of decision making units. Eur. J. Oper. Res. 1978, 2, 429–444. [Google Scholar] [CrossRef]
  3. Daraioa, C.; Simarb, L. A robust nonparametric approach to evaluate and explain the performance of mutual funds. Eur. J. Oper. Res. 2006, 175, 516–542. [Google Scholar] [CrossRef]
  4. Zhao, X.; Wang, S.; Lai, K.K. Mutual funds performance evaluation based on endogenous benchmarks. Expert Syst. Appl. 2011, 38, 3663–3670. [Google Scholar] [CrossRef]
  5. Galagedera, D.U.A.; Silvapulle, P. Australian mutual fund performance appraisal using data envelopment analysis. Manag. Financ. 2002, 28, 60–73. [Google Scholar] [CrossRef]
  6. Liu, W.B.; Zhou, Z.B.; Liu, D.B.; Xiao, H.L. Estimation of portfolio efficiency via DEA. Omega 2015, 52, 107–118. [Google Scholar] [CrossRef]
  7. Lim, S.; Oh, K.W.; Zhu, J. Use of DEA cross-efficiency evaluation in portfolio selection: An application to Korean stock market. Eur. J. Oper. Res. 2014, 236, 361–368. [Google Scholar] [CrossRef]
  8. Choi, H.S.; Min, D. Efficiency of well-diversified portfolios: Evidence from data envelopment analysis. Omega 2017, 73, 104–113. [Google Scholar] [CrossRef]
  9. Banihashemi, S.; Navid, A.S. Portfolio performance evaluation in mean-CVaR framework: A comparison with non-parametric methods value at risk in mean-VaR Analysis. Oper. Res. Perspect. 2017, 4, 21–28. [Google Scholar] [CrossRef]
  10. Zhou, Z.B.; Xiao, H.L.; Jin, Q.Y.; Liu, W.B. DEA frontier improvement and portfolio rebalancing: An application of China mutual funds on considering sustainability information disclosure. Eur. J. Oper. Res. 2017, 269, 1–21. [Google Scholar] [CrossRef]
  11. Zhou, Z.B.; Ding, H.; Ma, C.Q.; Wang, M.; Liu, W.B. Technical efficiency evaluation approach for portfolios with transaction costs. Chin. J. Manag. Sci. 2015, 23, 25–33. [Google Scholar]
  12. Zhou, Z.B.; Lu, M.; Xiao, H.L.; Jin, Q.Y. Performance evaluation of multi-period portfolios based on the network index DEA. Commer. Sci. Res. 2016, 23, 98–103. [Google Scholar]
  13. Zhou, Z.B.; Liu, P.; Yu, H.N.; Ma, C.Q.; Liu, W.B. Performance evaluation of multi-period portfolios on considering transaction costs. Chin. J. Manag. Sci. 2015, 23, 1–6. [Google Scholar]
  14. Zhou, Z.B.; Jin, Q.Y.; Zeng, X.M.; Wu, Q.; Liu, W.B. Performance evaluation of portfolios with cardinality constraints. Chin. J. Manag. Sci. 2017, 25, 174–179. [Google Scholar]
  15. Lin, R.Y.; Li, Z.X. Directional distance based diversification super-efficiency DEA models for mutual funds. Omega 2020, 97. [Google Scholar] [CrossRef]
  16. Xiao, H.L.; Ren, T.T.; Zhou, Z.B.; Liu, W.B. Parameter uncertainty in estimation of portfolio efficiency: Evidence from an interval diversification-consistent DEA approach. Omega 2020. [Google Scholar] [CrossRef]
  17. Allais, M. Le Comportement de L’homme Rationnel Devant Le Risque: Critique des postulats et axiomes de l’ecole Americaine. Econometrica 1953, 21, 503–546. [Google Scholar] [CrossRef]
  18. Ellsberg, D. Risk, Ambiguity, and the Savage axioms. Q. J. Econ. 1961, 75, 643–669. [Google Scholar] [CrossRef] [Green Version]
  19. Tversky, K.A. Prospect theory: An analysis of decision under risk. Econometrica 1979, 47, 263–292. [Google Scholar]
  20. Kahneman, A.T. Advances in prospect theory: Cumulative representation of uncertainty. J. Risk Uncertain. 1992, 5, 297–323. [Google Scholar]
  21. Pirvu, T.A.; Schulze, K. Multi-stock portfolio optimization under prospect theory. Math. Financ. Econ. 2012, 6, 337–362. [Google Scholar] [CrossRef]
  22. Gong, C.; Xu, C.; Wang, J. An efficient adaptive real coded genetic algorithm to solve the portfolio choice problem under cumulative prospect theory. Comput. Econ. 2018, 52, 227–252. [Google Scholar] [CrossRef]
  23. Gong, C.; Xu, C.; Ando, M.; Xi, X.M. A new method of portfolio optimization under cumulative prospect theory. Tsinghua Sci. Technol. 2018, 23, 75–86. [Google Scholar] [CrossRef]
  24. Consigli, G.; Hitaj, A.; Mastrogiacomo, E. Portfolio choice under cumulative prospect theory: Sensitivity analysis and an empirical study. Comput. Manag. Sci. 2019, 16, 129–154. [Google Scholar] [CrossRef]
  25. Bernheim, B.D.; Sprenger, C. On the empirical validity of cumulative prospect theory: Experimental evidence of rank-independent probability weighting. Econometrica 2020, 88, 1363–1409. [Google Scholar] [CrossRef]
  26. Hens, T.; Mayer, J. Cumulative prospect theory and mean variance analysis: A rigorous comparison. Swiss Financ. Inst. Res. Pap. Ser. 2014, 21, 14–23. [Google Scholar] [CrossRef] [Green Version]
  27. Ingersoll, J. Non-monotonicity of the Tversky-Kahneman probability-weighting function: A cautionary note. Eur. Financ. Manag. 2016, 14, 385–390. [Google Scholar] [CrossRef]
  28. Grishina, N.; Lucas, C.A.; Date, P. Prospect theory-based portfolio optimization: An empirical study and analysis using intelligent algorithms. Quant. Financ. 2017, 17, 1–15. [Google Scholar] [CrossRef] [Green Version]
  29. Ino, H.; Matsumura, T. Promoting green or restricting gray? An analysis of green portfolio standards. Econ. Lett. 2021, 198. [Google Scholar] [CrossRef]
  30. Bento, A.M.; Garg, T.; Kaffine, D. Emissions reductions or green booms? General equilibrium effects of a renewable portfolio standard. J. Environ. Econ. Manag. 2018, 90, 78–100. [Google Scholar] [CrossRef] [Green Version]
  31. Chakrabarti, G.; Sen, C. Time series momentum trading in green stocks. Stud. Econ. Financ. 2020, 37, 361–389. [Google Scholar] [CrossRef]
  32. Allevi, E.; Basso, A.; Bonenti, F.; Oggioni, G.; Riccardi, R. Measuring the environmental performance of green SRI funds: A DEA approach. Energy Econ. 2019, 79, 32–44. [Google Scholar] [CrossRef]
  33. Zhai, J.; Bai, M.Y. Mean-risk model for uncertain portfolio selection with background risk. J. Comput. Appl. Math. 2018, 330, 59–69. [Google Scholar] [CrossRef]
  34. Liu, Y.J.; Zhou, M.N.; Zhang, W.G. Mean-semivariance portfolio optimization model with background risk. Syst. Eng. Theory Pract. 2020, 40, 2282–2291. [Google Scholar]
  35. Zhang, Y.J.; Chen, M.Y. Evaluating the dynamic performance of energy portfolios: Empirical evidence from the DEA directional distance function. Eur. J. Oper. Res. 2018, 269, 64–78. [Google Scholar] [CrossRef]
  36. Jin, J.Y.; Han, L.Y. Assessment of Chinese green funds: Performance and industry allocation. J. Clean. Prod. 2018, 171, 1084–1093. [Google Scholar] [CrossRef]
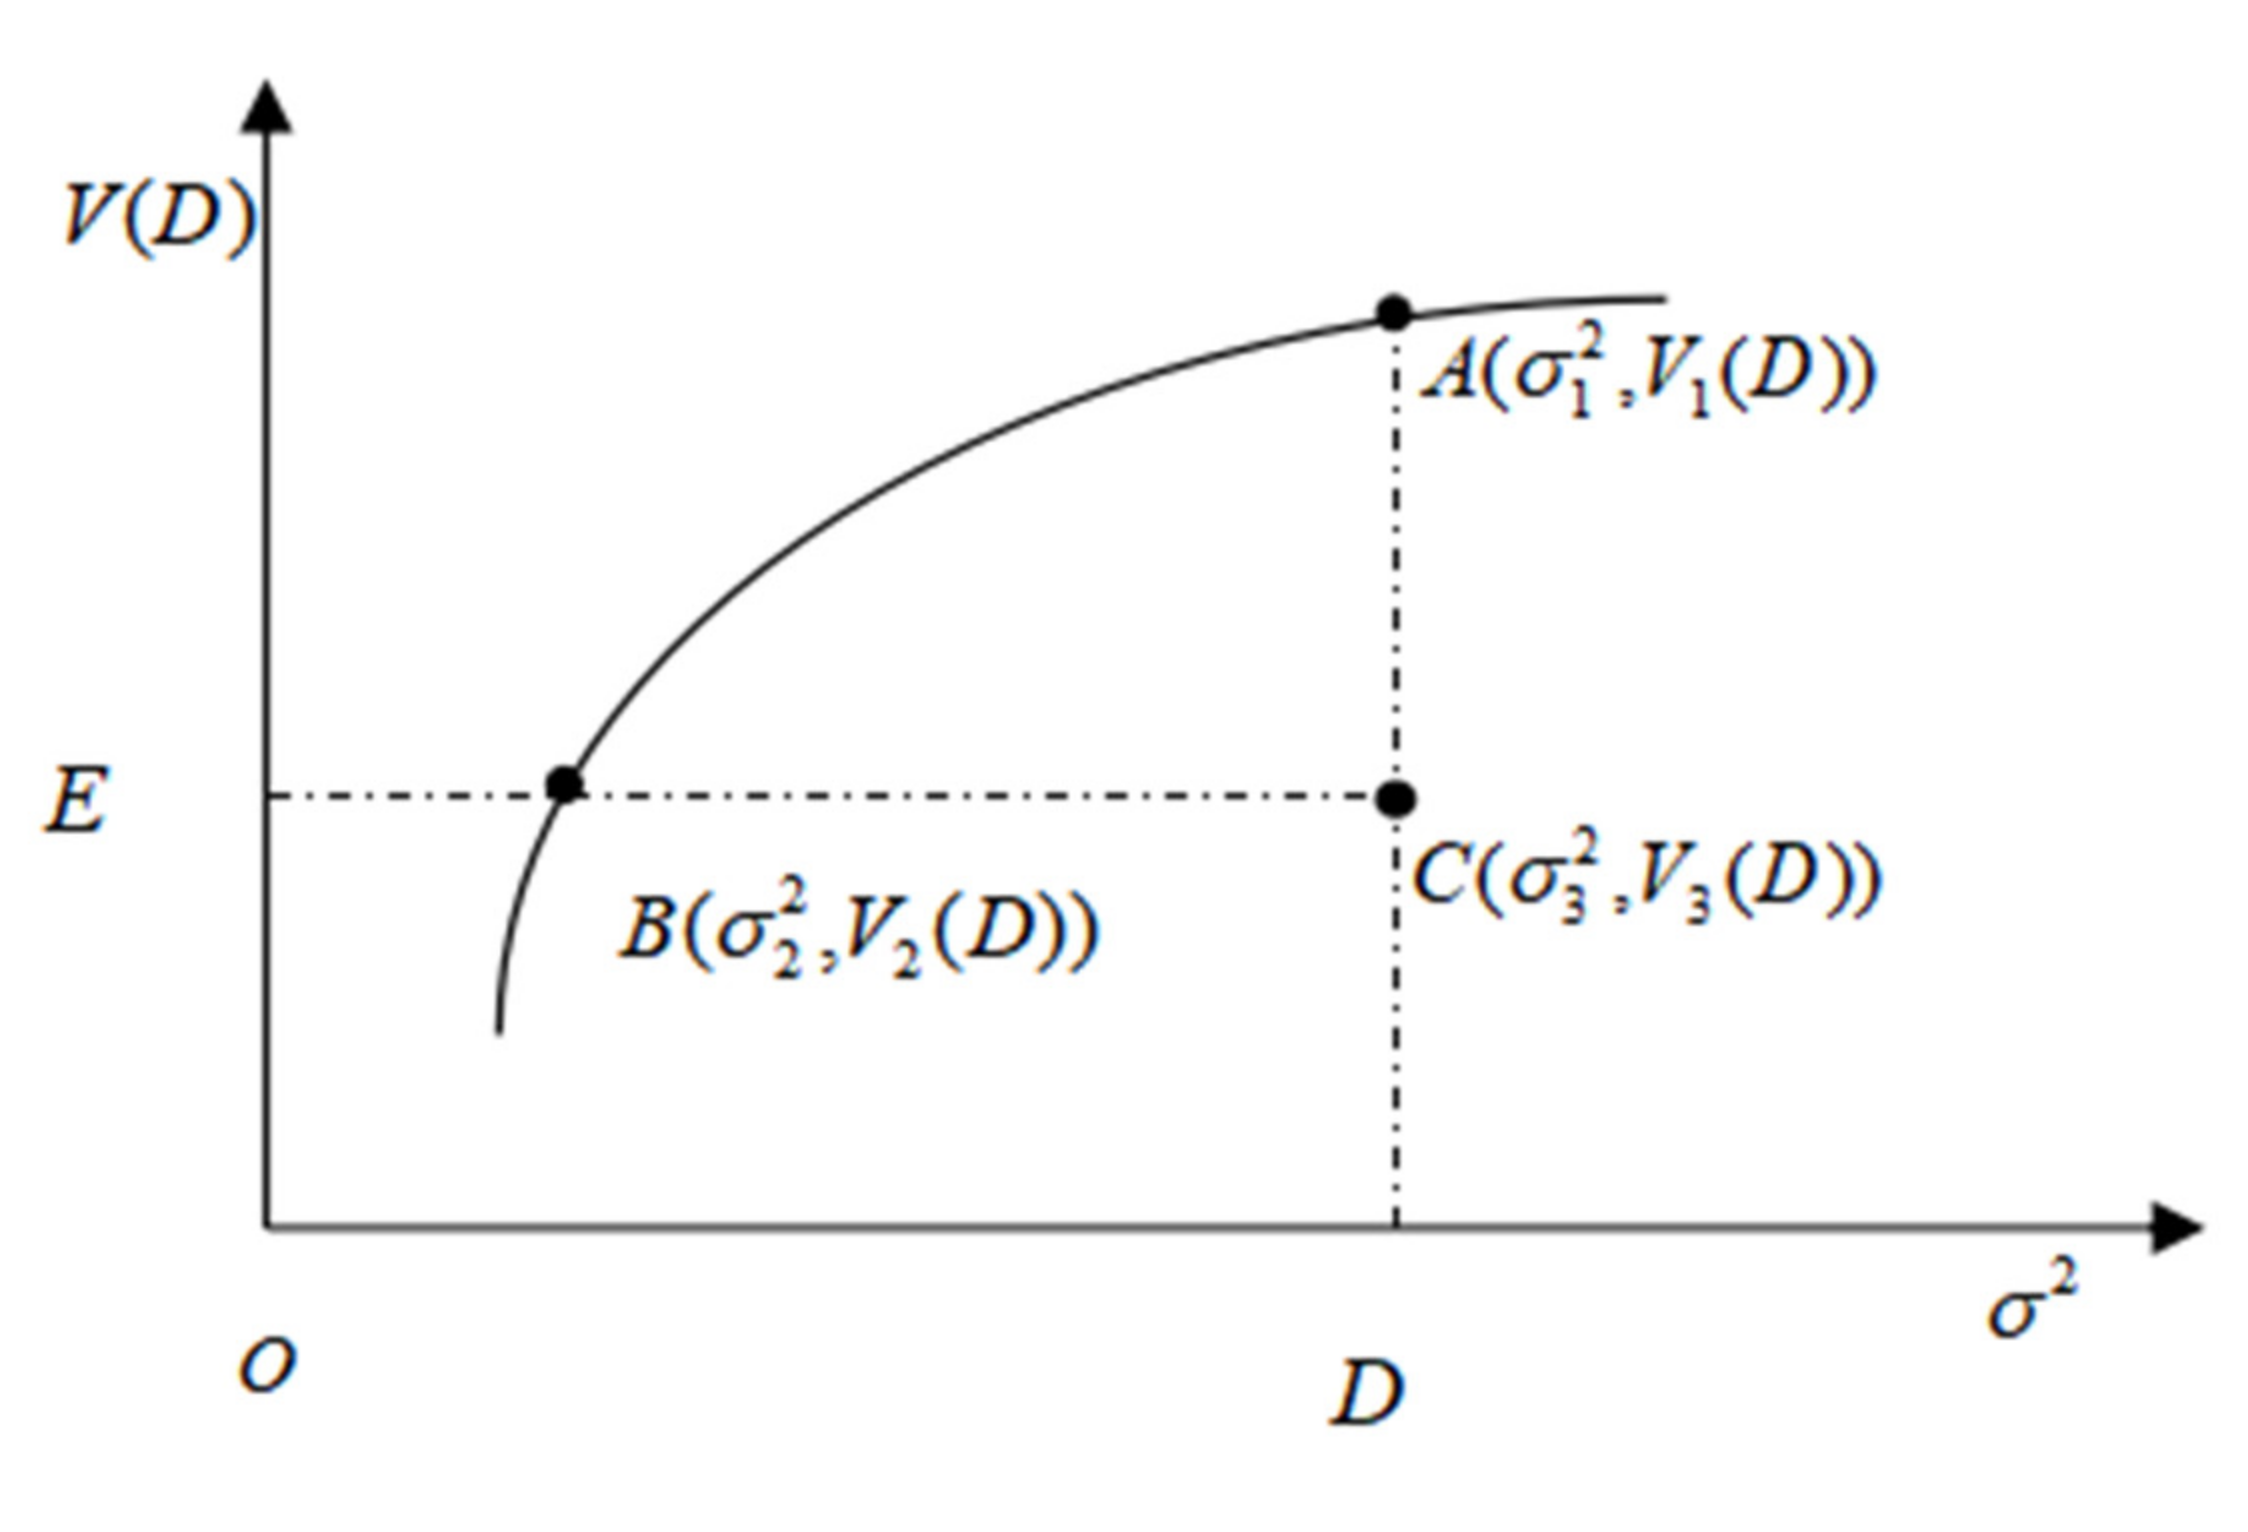
Figure 1. Definition of green portfolio efficiency.
Sustainability 13 01933 g001
Figure 2. Ratio of efficiency fronts with different α-parameters.
Sustainability 13 01933 g002
Figure 3. Ratio of efficiency fronts for different β-parameters.
Sustainability 13 01933 g003
Table 1. Green portfolio efficiency solution for different return risk aversion factors α.
DMUα = 0.2α = 0.4α = 0.6α = 0.8
ScoreRankScoreRankScoreRankScoreRank
10.842990.96495110.744813
20.8374110.942970.998350.90526
30.843580.973540.956590.95974
4110.91218110.708914
50.94234110.8920110.87488
6110.90129110.97763
711110.9654811
80.959050.756111110.95915
90.848170.7401120.7784140.842910
10110.7392130.9273100.85269
110.89896110.992660.87617
120.8420100.7371140.8603120.801812
130.7765130.961960.81771311
140.8190120.8159100.981970.841111
Table 2. Green portfolio efficiency solution for different loss risk appetite factors β.
DMUβ = 0.3β = 0.5β = 0.7β = 0.9
ScoreRankScoreRankScoreRankScoreRank
10.838511111111
20.8828100.8488110.9534110.916410
3110.7079140.974850.91769
40.8048120.7842120.966770.96395
50.89858111111
6110.7719130.8031120.897213
70.887990.922380.80191311
8110.942970.965080.92648
911110.962790.98884
100.960350.984740.973960.93087
110.6977140.966950.9559100.892414
120.924070.90409110.909112
130.7855130.8721100.989840.93926
140.6814150.951360.7739140.910311
Publisher’s Note: MDPI stays neutral with regard to jurisdictional claims in published maps and institutional affiliations.