Article

Spatiotemporal Dynamics of Nitrogen Budgets under Anthropogenic Activities in Metropolitan Areas

Department of Environmental Science and Engineering, Fudan University, 2205 Songhu Road, Shanghai 200438, China
*
Author to whom correspondence should be addressed.
Sustainability 2021, 13(4), 2006; https://doi.org/10.3390/su13042006
Submission received: 12 December 2020 / Revised: 1 February 2021 / Accepted: 10 February 2021 / Published: 12 February 2021
(This article belongs to the Section Social Ecology and Sustainability)

Abstract

:
The rapid growth of metropolitan regions is closely associated with high nitrogen (N) flows, which is known as the most important reason for widespread water pollution. It is, therefore, crucial to explore the spatiotemporal patterns of N budgets under intensive human activity. In this study, we estimated the long-term (2000–2015) N budgets by integrating the net anthropogenic nitrogen input (NANI) and the export coefficient model (ECM) in the Yangtze River Delta Urban Agglomeration (YRDUA), a typical metropolitan area with strong human disturbances. The results revealed that the NANI decreased by 10% from 2000 to 2015, while N exports showed a 6% increase. Hotspots for N budgets were found in the northeastern areas, where cropland and construction land were dominant. The linear regression showed a close relationship between the NANI and N export, and about 18% of the NANI was exported into the river system. By revealing the critical sources and drivers of N budgets over time, our work aimed to provide effective information for regional policy on nitrogen management. Future strategies, such as improving the fertilizer efficiency, optimizing the land use pattern, and controlling the population density, are necessary in order to address the environmental challenge concerns of excessive N.

1. Introduction

Over the past several decades, excessive nitrogen (N) enrichment in terrestrial and aquatic ecosystems has become a global concern [1,2,3]. The imbalance of the N cycle has led to a range of ecological damage, such as eutrophication, biodiversity loss, acid rain, and soil acidification, which is mainly due to the increasing human interference related to over-fertilization, dense population, massive food demand, high livestock breeding rate, and increased combustion of fossil fuels [4,5,6,7]. Some researchers have even documented that the safe operating boundaries have already been exceeded in the systems of the nitrogen cycle that are under human interference, as well as in the rate of biodiversity loss and climate change; these have been identified as the three largest threats to our planet in the Anthropocene [8]. Such conditions could generate unacceptable environmental changes if effective strategies are not taken. Given that the global N overload continues to be a critical problem [1,9,10,11], it is significant to understand and characterize the spatiotemporal patterns of the N budget, the main sources, and the impacts of human-induced N in high-urbanization areas.
While N inputs and exports are the two vital parts of the N cycle, research has proved that riverine N flux is greatly related to anthropogenic N inputs in many regions across the world [12,13,14,15,16]. The ratio of N exports to N inputs for rivers can also reflect the capacity for N retention in terrestrial ecosystems and the potential risks of N pollution in aquatic ecosystems [17,18,19,20,21]. A previous review showed that the proportion of N exports ranged from 3% to 118%, with an average ratio of 24% [20], and this was influenced by various factors, such as hydroclimate, land use type, the degree of N saturation, and other human activities [13]. For example, the N export ratio was lower in Baiyangdian Basin (3%), a semiarid watershed, than in Taihu Basin (38%), a humid watershed [22,23]. However, there have been few systematic reports on the dynamic spatiotemporal patterns of N budgets, as well as on the dynamic response of riverine N exports to anthropogenic N inputs or how N budgets have varied over time due to anthropogenic activities in metropolitan areas that have experienced rapid urbanization and socioeconomic development.
Revealing the spatiotemporal patterns of N budgets can provide effective information for improving nitrogen pollution management and can point to the dominant sources of pollution for potential reduction strategies [24]. The net anthropogenic nitrogen input (NANI) model, first introduced by Howarth et al. [25], has been widely used to estimate the anthropogenic N inputs in various regions across the world, and has been shown to be a simple and effective mass balance approach that is detailed enough to incorporate available data on individual crops, livestock, and people [6,12,13,22,23,24,26,27,28,29,30,31,32]. This method is typically calculated as the sum of four major components: fertilizer N application, N in net food and feed imports, atmospheric N deposition, and biological N fixation. Considering the modes of delivery of N, Zhang et al. [28] divided the N inputs into non-point-source and point-source, providing a more accurate estimate of nutrient inputs, especially in areas with heavy point-source N pollution.
Given that increases in nutrient inputs are generally accompanied by corresponding increases in nutrient exports [12,13,22,23], it is necessary to assess N exports when evaluating the interactions between human activities and the N cycle. There is a series of models, including both mechanistic and empirical models, that can be applied to assess nutrient exports. Among them, the export coefficient model (ECM) is a strong empirical model that has been proved to be suitable for simulating the flux of nutrient pollutants entering rivers in plain areas [33,34,35], particularly when there are insufficient monitoring data for studies. This model, which was developed in North America in the 1970s, was confirmed to be able to resolve the issues related to the flat terrain and intricate river network, and can be used to estimate N exports into a river system when evaluating the nutrient contaminant export load [18,22,23,36,37,38]. Recently, researchers studied the relationship between N inputs and riverine N exports by combining the NANI and ECM models in plain basins, such as the Taihu Basin [23] and Baiyangdian Basin [22]. Overall, the simulations for estimating nitrogen inputs and exports can be used to explore not only the exact N flow budgets, but also the corresponding risks of N load.
Urban ecosystems are complex systems that couple humans and nature. Exploring the effects of human activities in cities is of great significance for sustainable development, especially in the context of rapid urbanization. As one of the most developed urban areas in China, approximately 16% of the total population of China is concentrated in the Yangtze River Delta Urban Agglomeration (YRDUA), though it only accounts for 2% of the land area of China. Due to the humid climate and the flat terrain, the human activities for living and producing are very intense in this region. For instance, there are a large number of agricultural production activities in the central and northern parts, as well as dense population in the eastern and central parts. The Taihu Lake Basin in the center is widely regarded as an important area with excessive nutrient enrichment and a fragile water environment. Therefore, the YRDUA is a representative area with enhanced human disturbance in the context of rapid urbanization. Results from this region would also have implications for other urban areas, as most regions around the world are experiencing continuous socioeconomic development.
In this study, we integrated the NANI and ECM models to quantitatively evaluate long-term (2000–2015) N inputs and exports at the city scale in the YRDUA, a typical urban agglomeration in China, and identified the spatial and temporal dynamics, as well as the potential driving effects of socioeconomic factors on N budgets. The specific goals were: (1) to quantify the N inputs and exports and identify their main sources; (2) to reveal the dynamic spatial–temporal characteristics of N budgets and identify the impact of anthropogenic driving factors; and (3) to explore the N export ratio and to illustrate the response of riverine N exports to anthropogenic N inputs.

2. Materials and Methods
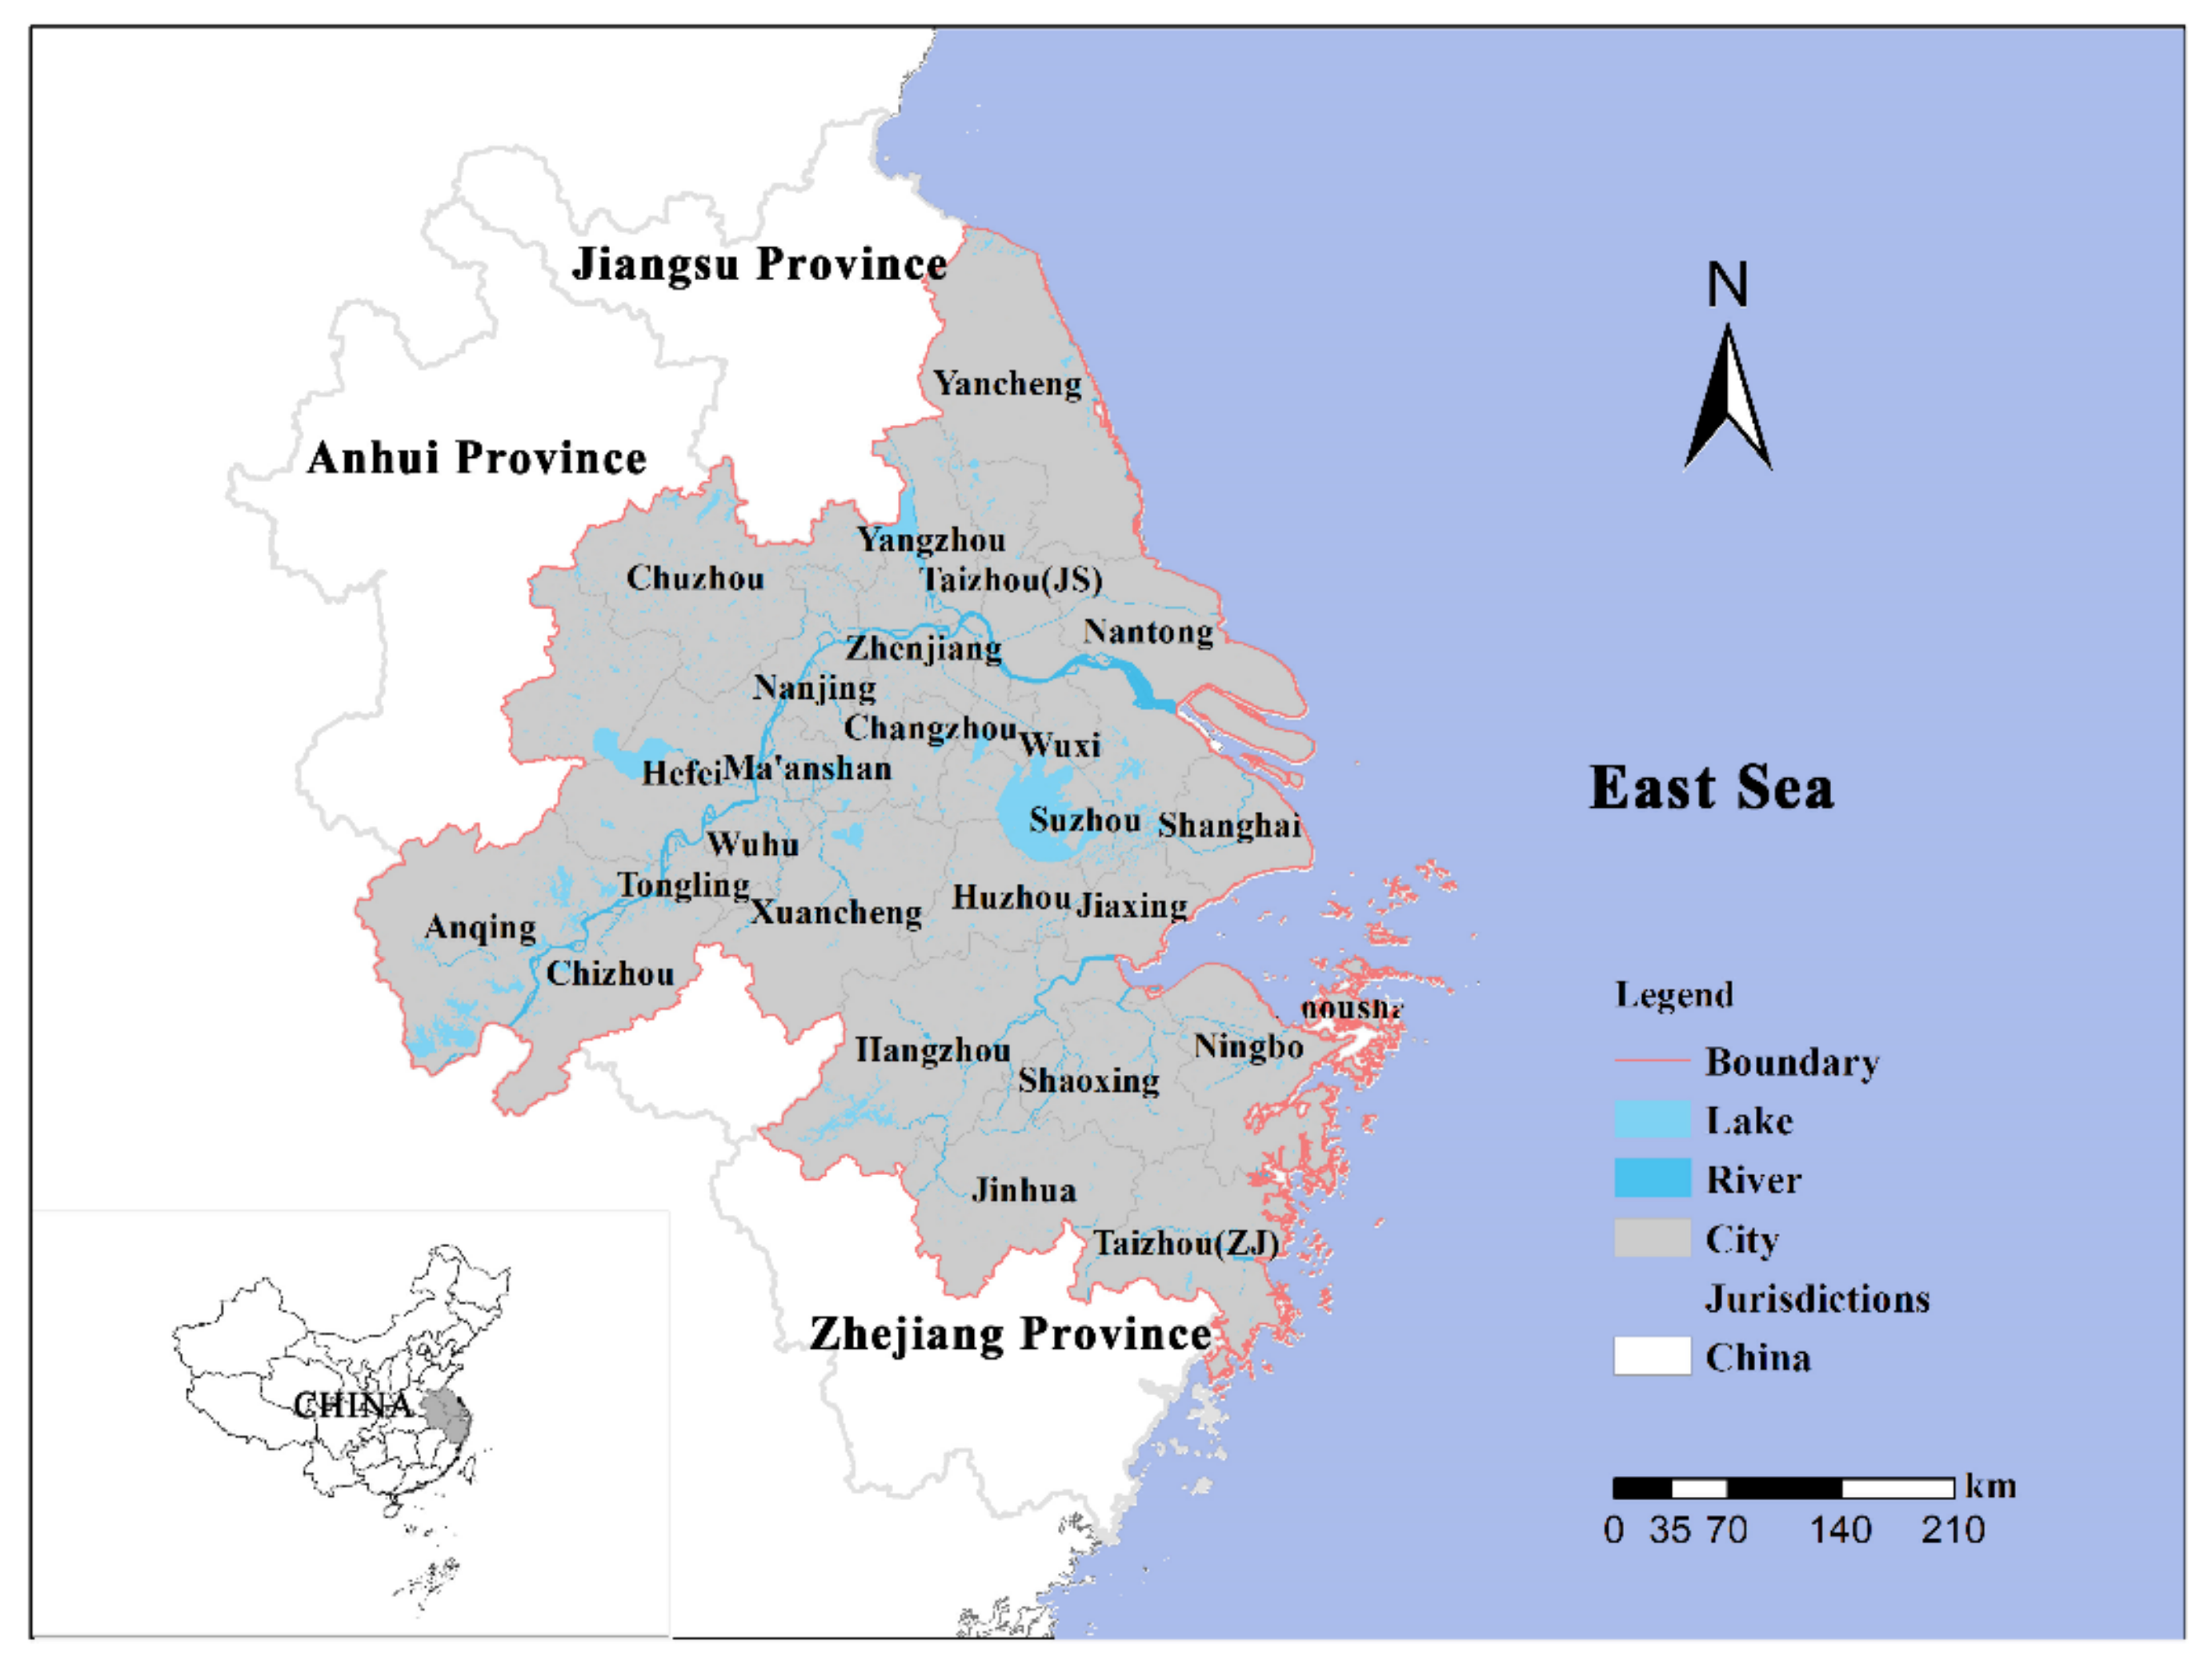
2.1. Study Area

The Yangtze River Delta Urban Agglomeration (YRDUA), located on the largest alluvial plain in Eastern China (29°20′ W−32°34′ W, 115°46′ E−123°25′ E; Figure 1), was proposed in the Development Plan of the YRDUA (2016–2030) and approved by the China State Council in 2016. This region covers a land area of 211,700 km2, of which 49.4% is mountainous (the southwestern part), and the rest are plains (the northern, central, and eastern areas). The YRDUA encompasses 26 cities, including the Shanghai Municipality, nine cities in southern Jiangsu Province, eight cities in northern Zhejiang Province, and eight cities in parts of Anhui Province. Characterized by a subtropical monsoon climate, the annual mean temperature and precipitation there range from 18 to 23 °C and from 1000 to 2000 mm, respectively.
As one of the six world-class urban agglomerations, the YRDUA has experienced fast urbanization and industrialization in the past few decades. Population settlements in this area have reached 1063 people km2, which is approximately seven times the nation’s average. The land cover mainly consists of cropland and forest land, accounting for 51% and 25% of the total area, respectively. Overall, cropland is mainly distributed in the northeast, while forest land is distributed in the southwest. In addition, construction land is densely concentrated in the central and eastern areas (especially in the Taihu Lake Basin) (Figure S1). The large proportion of agricultural land, the high-density population, and the development of industry and transportation have caused a significant influence on the ecological environment of this region. In addition, there is a dense river system, with more than 200 lakes [39]. Taihu Lake, the third-largest freshwater lake in China, is located in the center of this area. Large-scale eutrophication is a serious problem in the surface waters of the region, and especially in Taihu Lake [40]. Currently, the contradiction between the human interference and ecological security has yet to be effectively resolved.

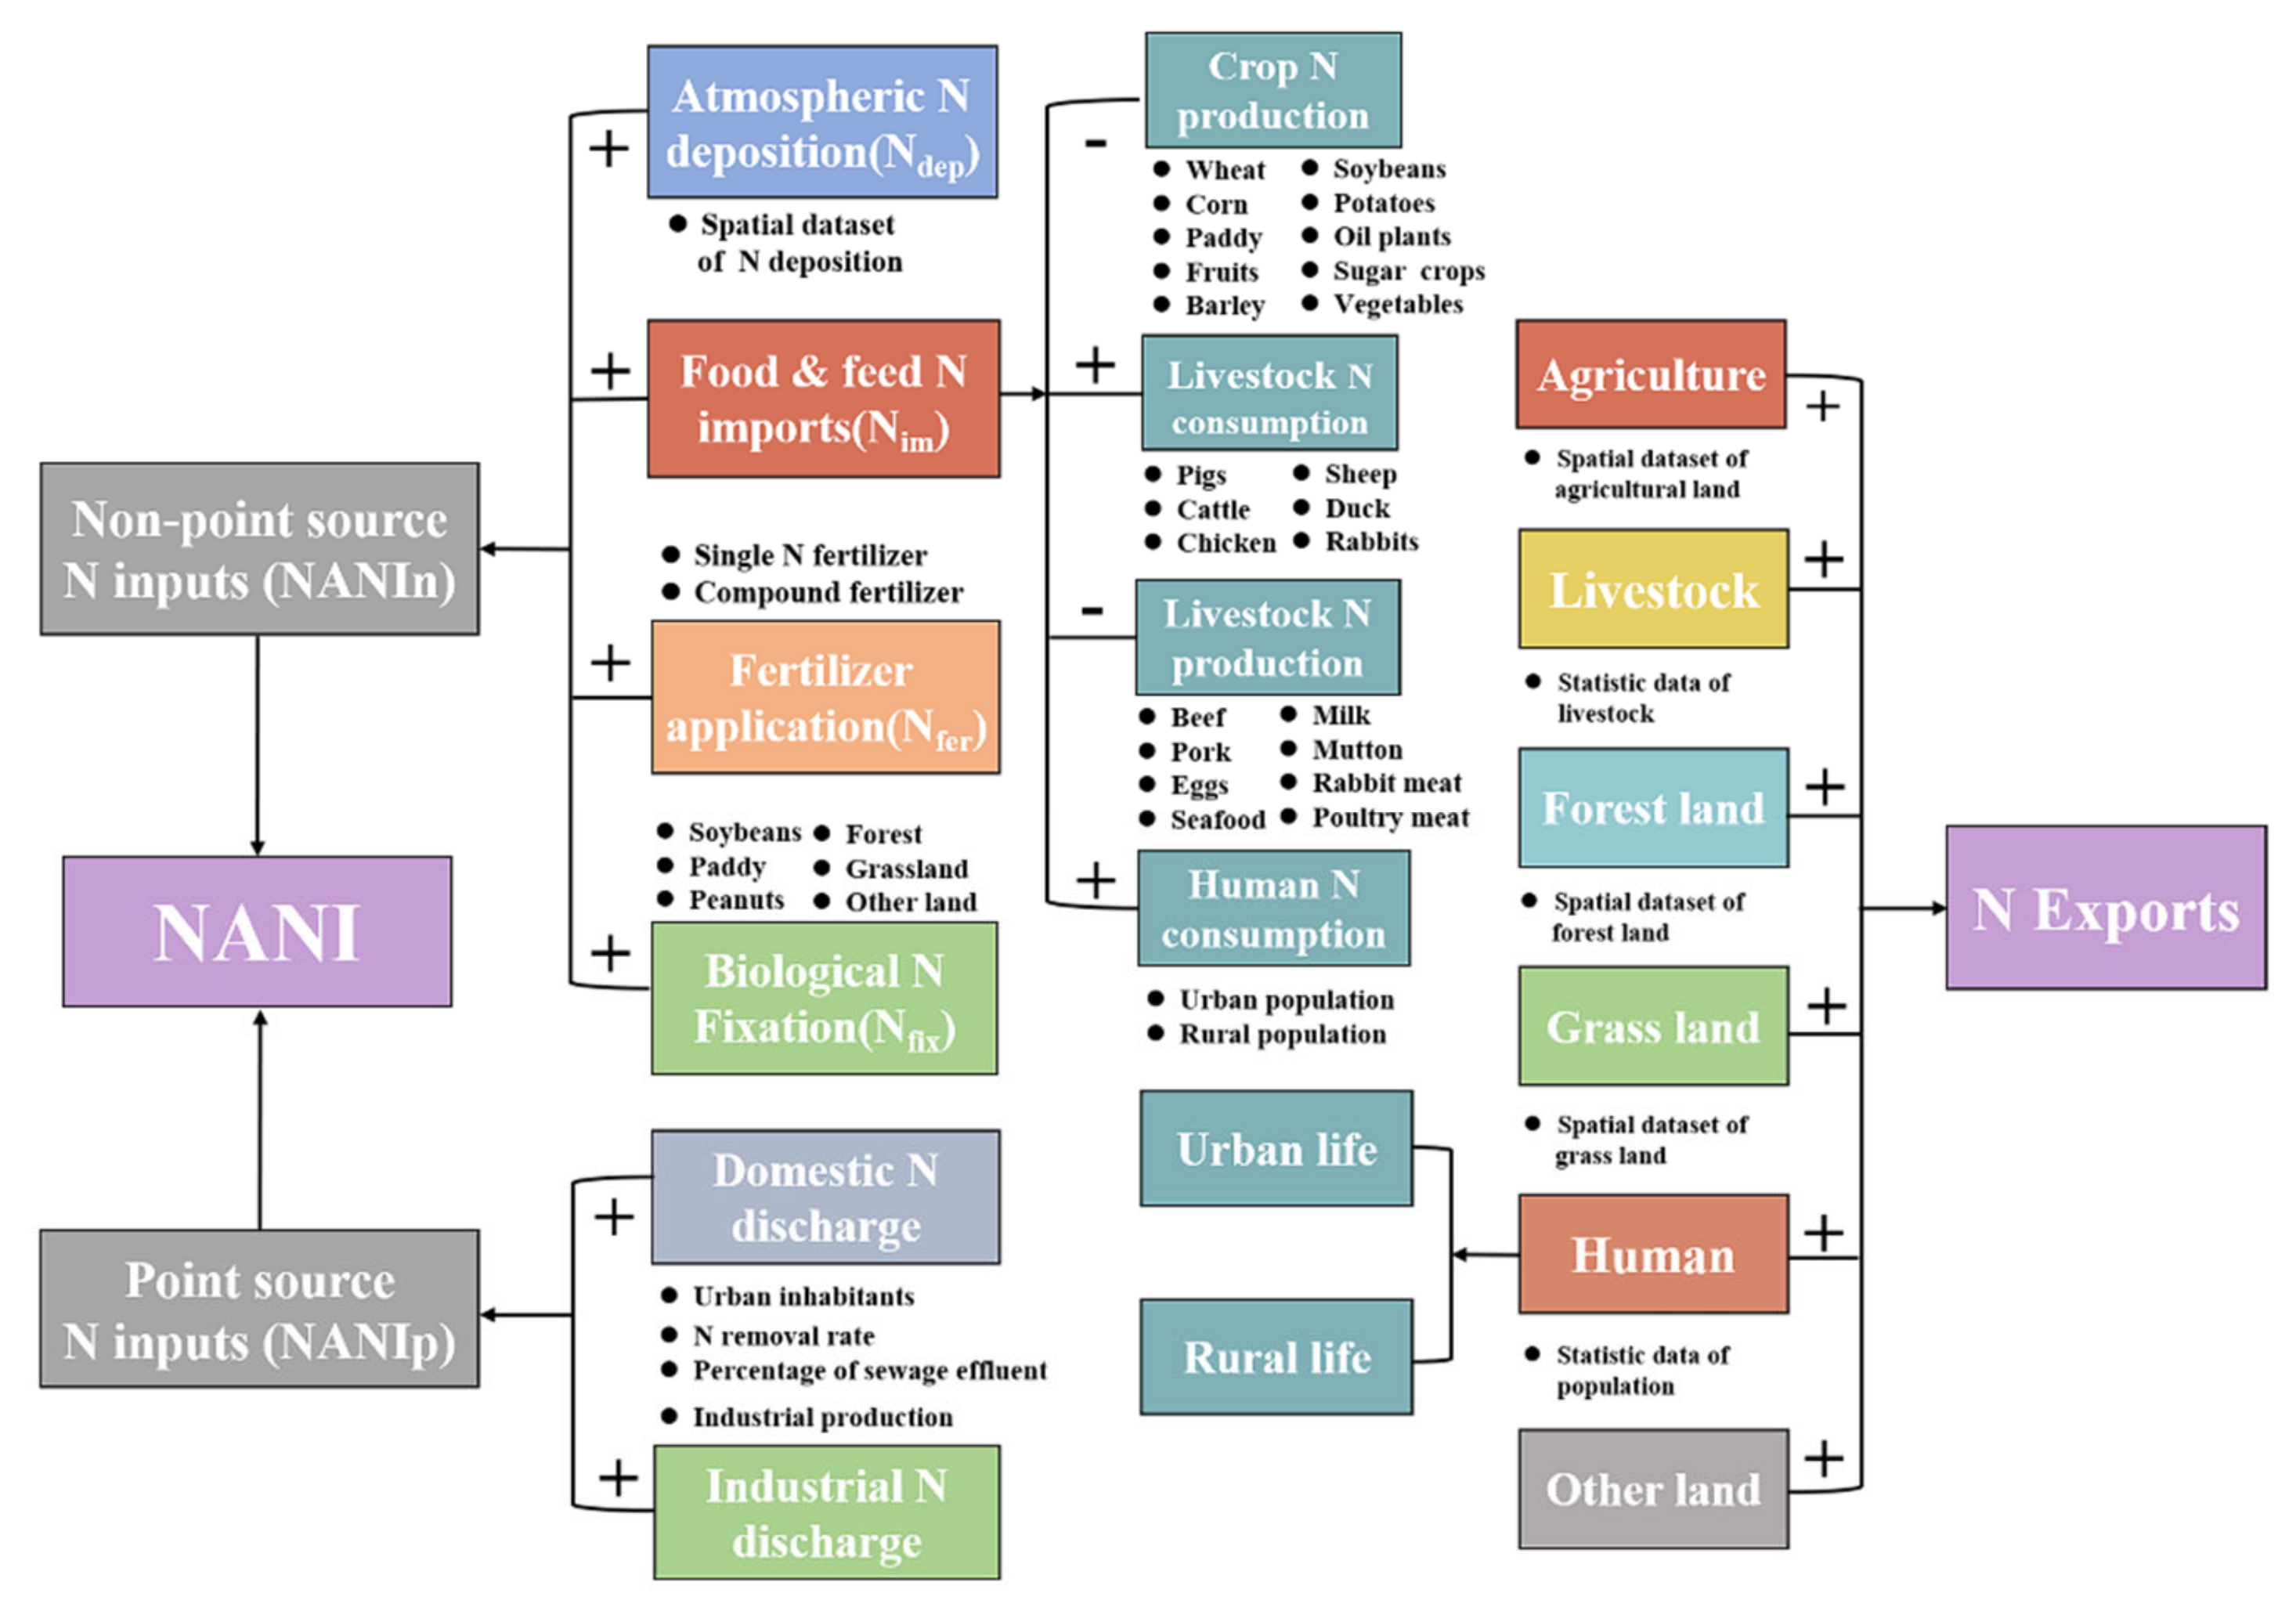
2.2. Accounting for Anthropogenic N Budgets

To estimate the human-controlled nitrogen budgets entering the territory, we used the NANI (net anthropogenic nitrogen input) approach to calculate the anthropogenic N inputs and the ECM (export coefficient model) to count the N exports. An overview of the model framework and data requirements is presented in Figure 2. Additionally, the methodology for evaluating N budgets is described below.

2.2.1. Non-Point-Source Inputs

Non-point-source N inputs (NANIn) are mainly composed of atmospheric N deposition, fertilizer N application, net food and feed import N, and biological N fixation. The basic calculation (Equation (1)) is presented below:
NANI n = N fer + N fix + N dep + N im
where NANI n is the N from non-point-source inputs, N fer is the N fertilizers applied, N fix is the biological N fixation, N dep is the atmospheric N deposition, and N im is the net food and feed N imports in urban and rural regions. The units are   kg   N   km 2   a 1 .
Among these components, only N im is allowed to be negative because its calculation is based on the balance of local production and consumption [41]. It is negative when the local food and feed supply exceed the demand. The net food and feed imports can be calculated with Equation (2):
N im = N selfo + N selfe N harv N liv
where N selfo and N selfe are the N consumption by humans and livestock, respectively. N harv is the N in crops, and N liv is the N in animal products. The units of the above are kg   N   km 2   a 1   .

2.2.2. Point-Source Inputs

Point-source N inputs (NANIp) are estimated as the sum of industrial and urban point discharges that could directly flow into the river systems [28]. The calculation (Equation (3)) is
NANI p = N urban + N ind 1 I sew I rem tn
where N ind is the N discharged by industrial production, N urban is the N discharged by urban inhabitants, and the units are kg   N   km 2   a 1   . I rem tn refers to the average N removal rate by a sewage plant. I sew is the proportion of sewage effluent connected with sewage plants. The above are expressed as percentages.
Based on the assumption that N emitted in wastewater by households and industries is generally connected to the same sewerage system [24], the calculation of I sew can be obtained from the following equation (Equation (4)):
I sew = W sew W ind + W urban
where W ind and W urban are the volume of wastewater produced by industrial production and domestic households, respectively; W sew is the actual treatment volume by sewage plants.

2.2.3. Estimation of N Exports

To understand the nitrogen exports in different subsystems, we applied the export coefficient model (ECM) to estimate N exports. The ECM model is a mathematical weighted equation that can be applied to assess the pollution load exported from different sources to water bodies [38]. Here, we estimated the nitrogen exported from agricultural land, forest land, grass land, and other land-use types, as well as livestock breeding, urban life, and rural life. The expression (Equation (5)) is
L = i = 1 m E i A i
where L is the amount of nitrogen exported ( kgN   a 1 ), and E i is the export coefficient for each source ( kg   N   km 2   a 1 ). A i is the area of the land-use type ( km 2 ) or the number of livestock (capita) or population (people). The export coefficients used here (Table S4) refer to previous studies [22,23].

2.3. Data Sources

City-level datasets, such as population, crop yields, amounts of fertilizer applied, livestock number, and industrial production, were adopted for counting anthropogenic nitrogen inputs. Most of the data used to calculate N budgets or represent the human activity index were obtained from local statistical yearbooks, national agriculture yearbooks, and national economic and social statistical bulletins. The raster data of wet and dry atmospheric N deposition from 2000 to 2015 were derived from Jia et al. [42] and can be accessed at http://www.sciencedb.cn/dataSet/handle/607. The land-use data set (2000–2015) originated from the Data Center for Resource and Environmental Science, Chinese Academy of Sciences (RESDC) (http://www.resdc.cn). Additionally, the calculation parameters applied in this study refer to previous research and are shown in the Supplementary Materials.

2.4. Data Analysis

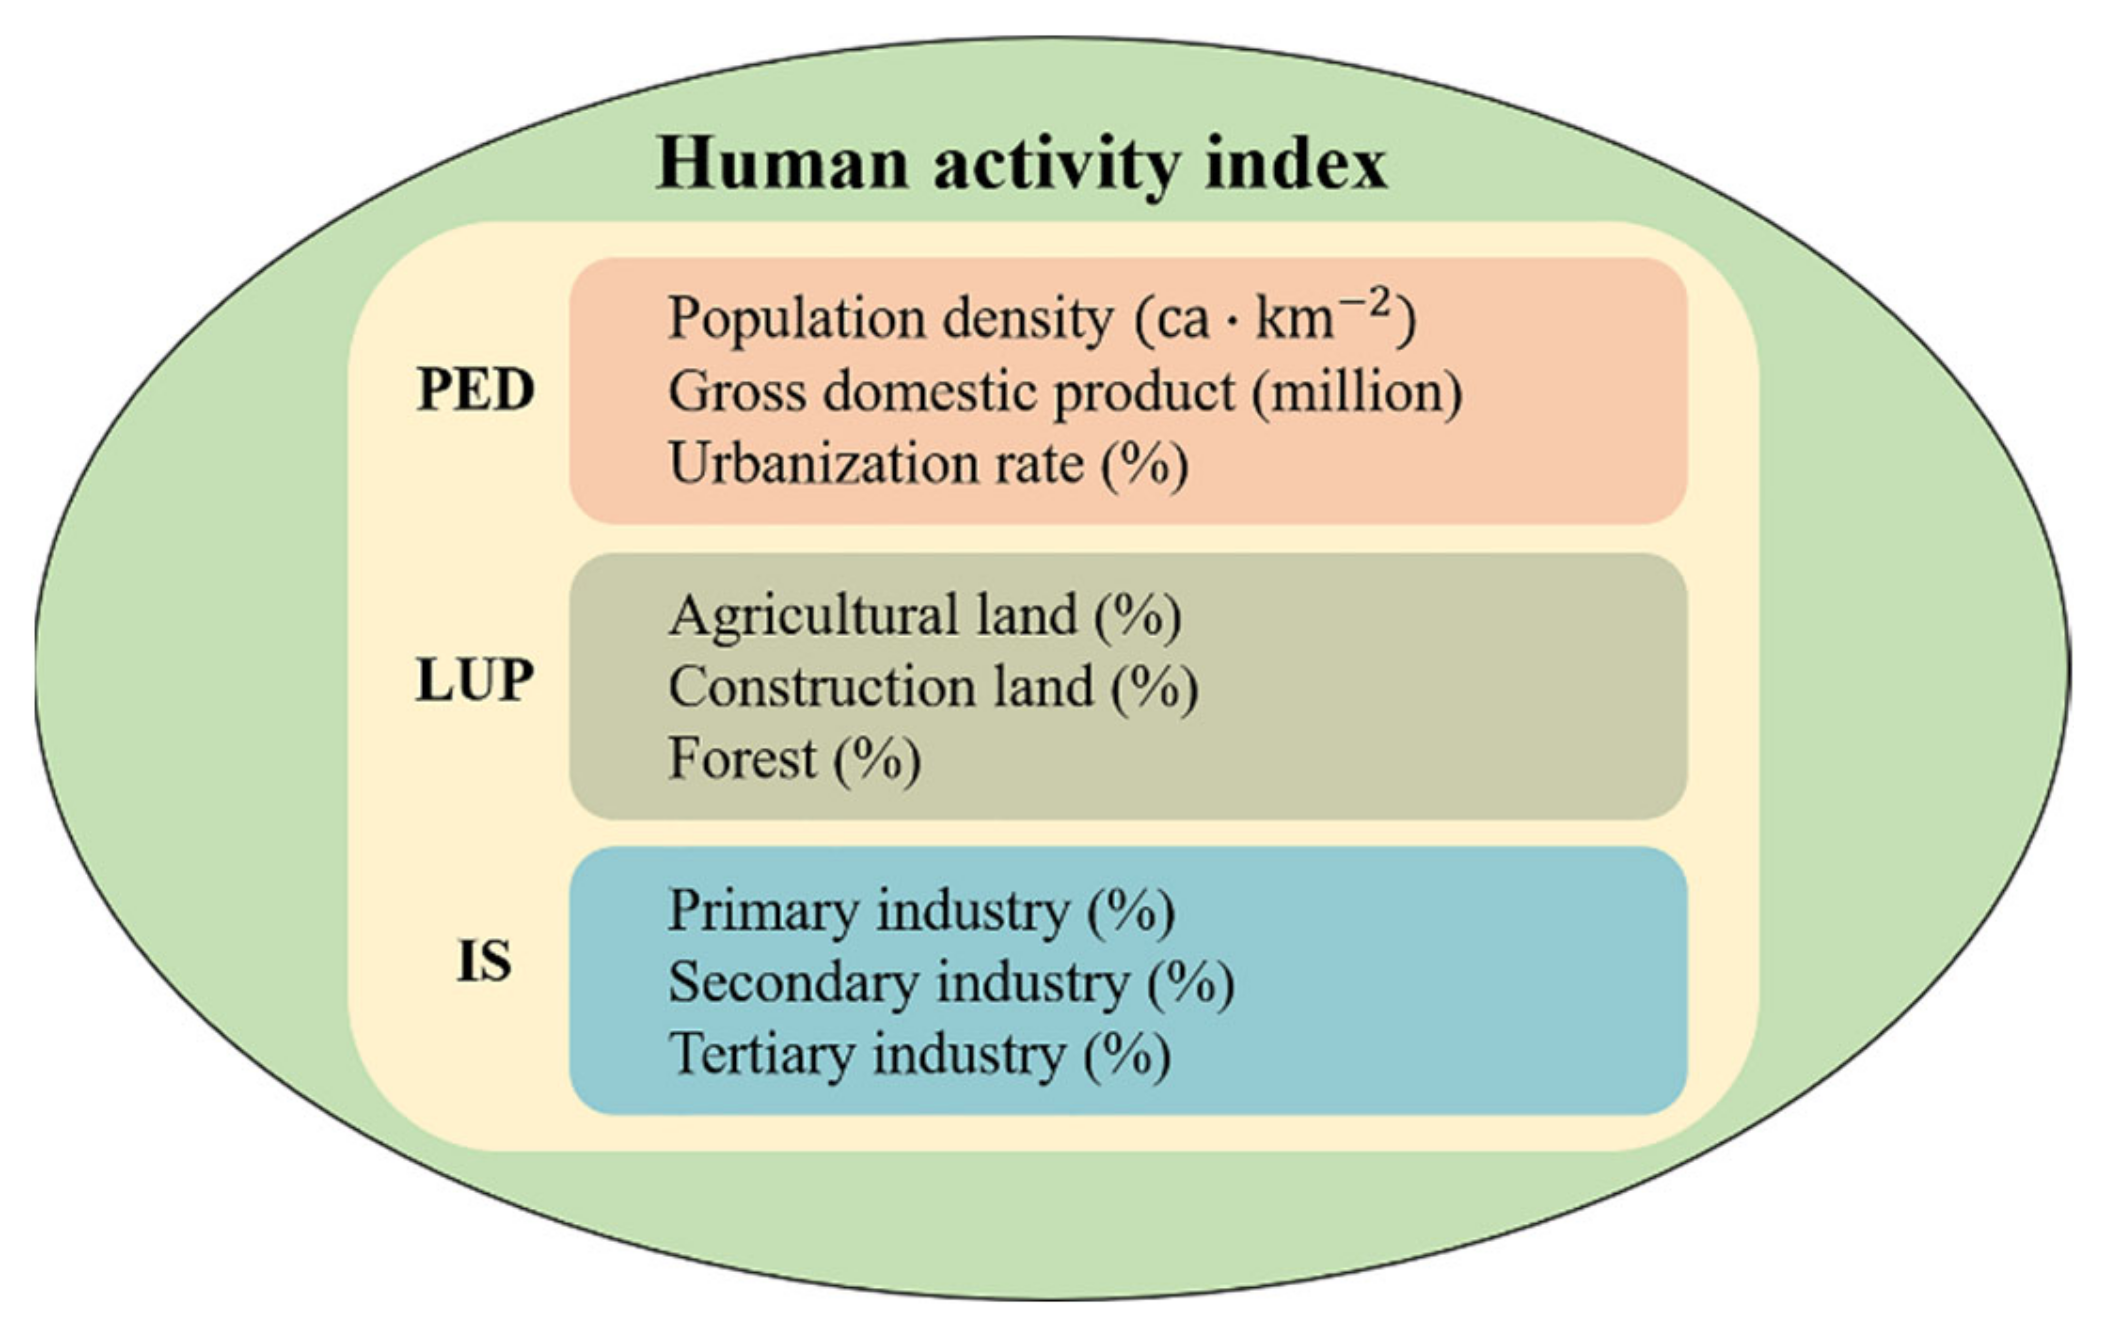
2.4.1. The Relationship between N Budgets and Anthropogenic Activities

To assess the effects of human activities on nitrogen inputs and exports, we used the method of linear regression. Three categories of human activity indexes, including nine sub-indexes, were chosen to establish the human activity index system (Figure 3), which consisted of the population density (PD), the urbanization rate (UR), the gross domestic product (GDP), the percentage of agricultural land (PAL), the percentage of forest land (PFL), the percentage of construction land (PCL), the proportion of primary industry (PPI), the proportion of secondary industry (PSI), and the proportion of tertiary industry (PTI).

2.4.2. Hotspot Analysis

Hotspot analysis was conducted via the “Hot Spot Analysis (Getis-Ord G i * )” tool in the Spatial Statistics Tools, which is a part of the ArcGIS software 10.2, and was used to identify the areas of the greatest concern [24]. The formula of Getis-Ord G i * calculated for each feature in a dataset is given as (Equation (6)):
G i * = j = 1 n W i , j x j   X ¯ j = 1 n W i , j S n j = 1 n W i , j 2 j = 1 n W i , j 2 n 1
where x j is the value for feature j , n is equal to the total number of features, W i , j is the spatial weight between feature i and   j , and
  X ¯ = j = 1 n x j n
S = j = 1 n x j 2 n   X ¯ 2
For statistically significant ( p < 0.01   or   p < 0.05   or   p < 0.1 ) positive G i * , a larger G i * value indicates that the clustering of high values (hotspot) is more intense. For statistically significant ( p < 0.01   or   p < 0.05   or   p < 0.1 ) negative G i * , smaller G i * means more intense the clustering of low values (cold spot).

2.4.3. Sensitivity Analysis

Sensitivity analysis is an effective method for assessing the contributions of the main components of N budgets [12]. The sensitivity (S) of a variable y to a parameter x is calculated by examining the effect of a change in x on the response of y relative to a baseline value. The sensitivity is defined here as the proportional change of variable y , relative to baseline y b , divided by the proportional change in parameter x , relative to baseline value x b . In this study, we applied a ±10% change for the main parameters. The expression (Equation (9)) is
S y | x , x b   y b ,   = y y b x b x x b y b
where   x is the parameter, and y is the variable; x b and y b are the baselines of x and y , respectively.

3. Results

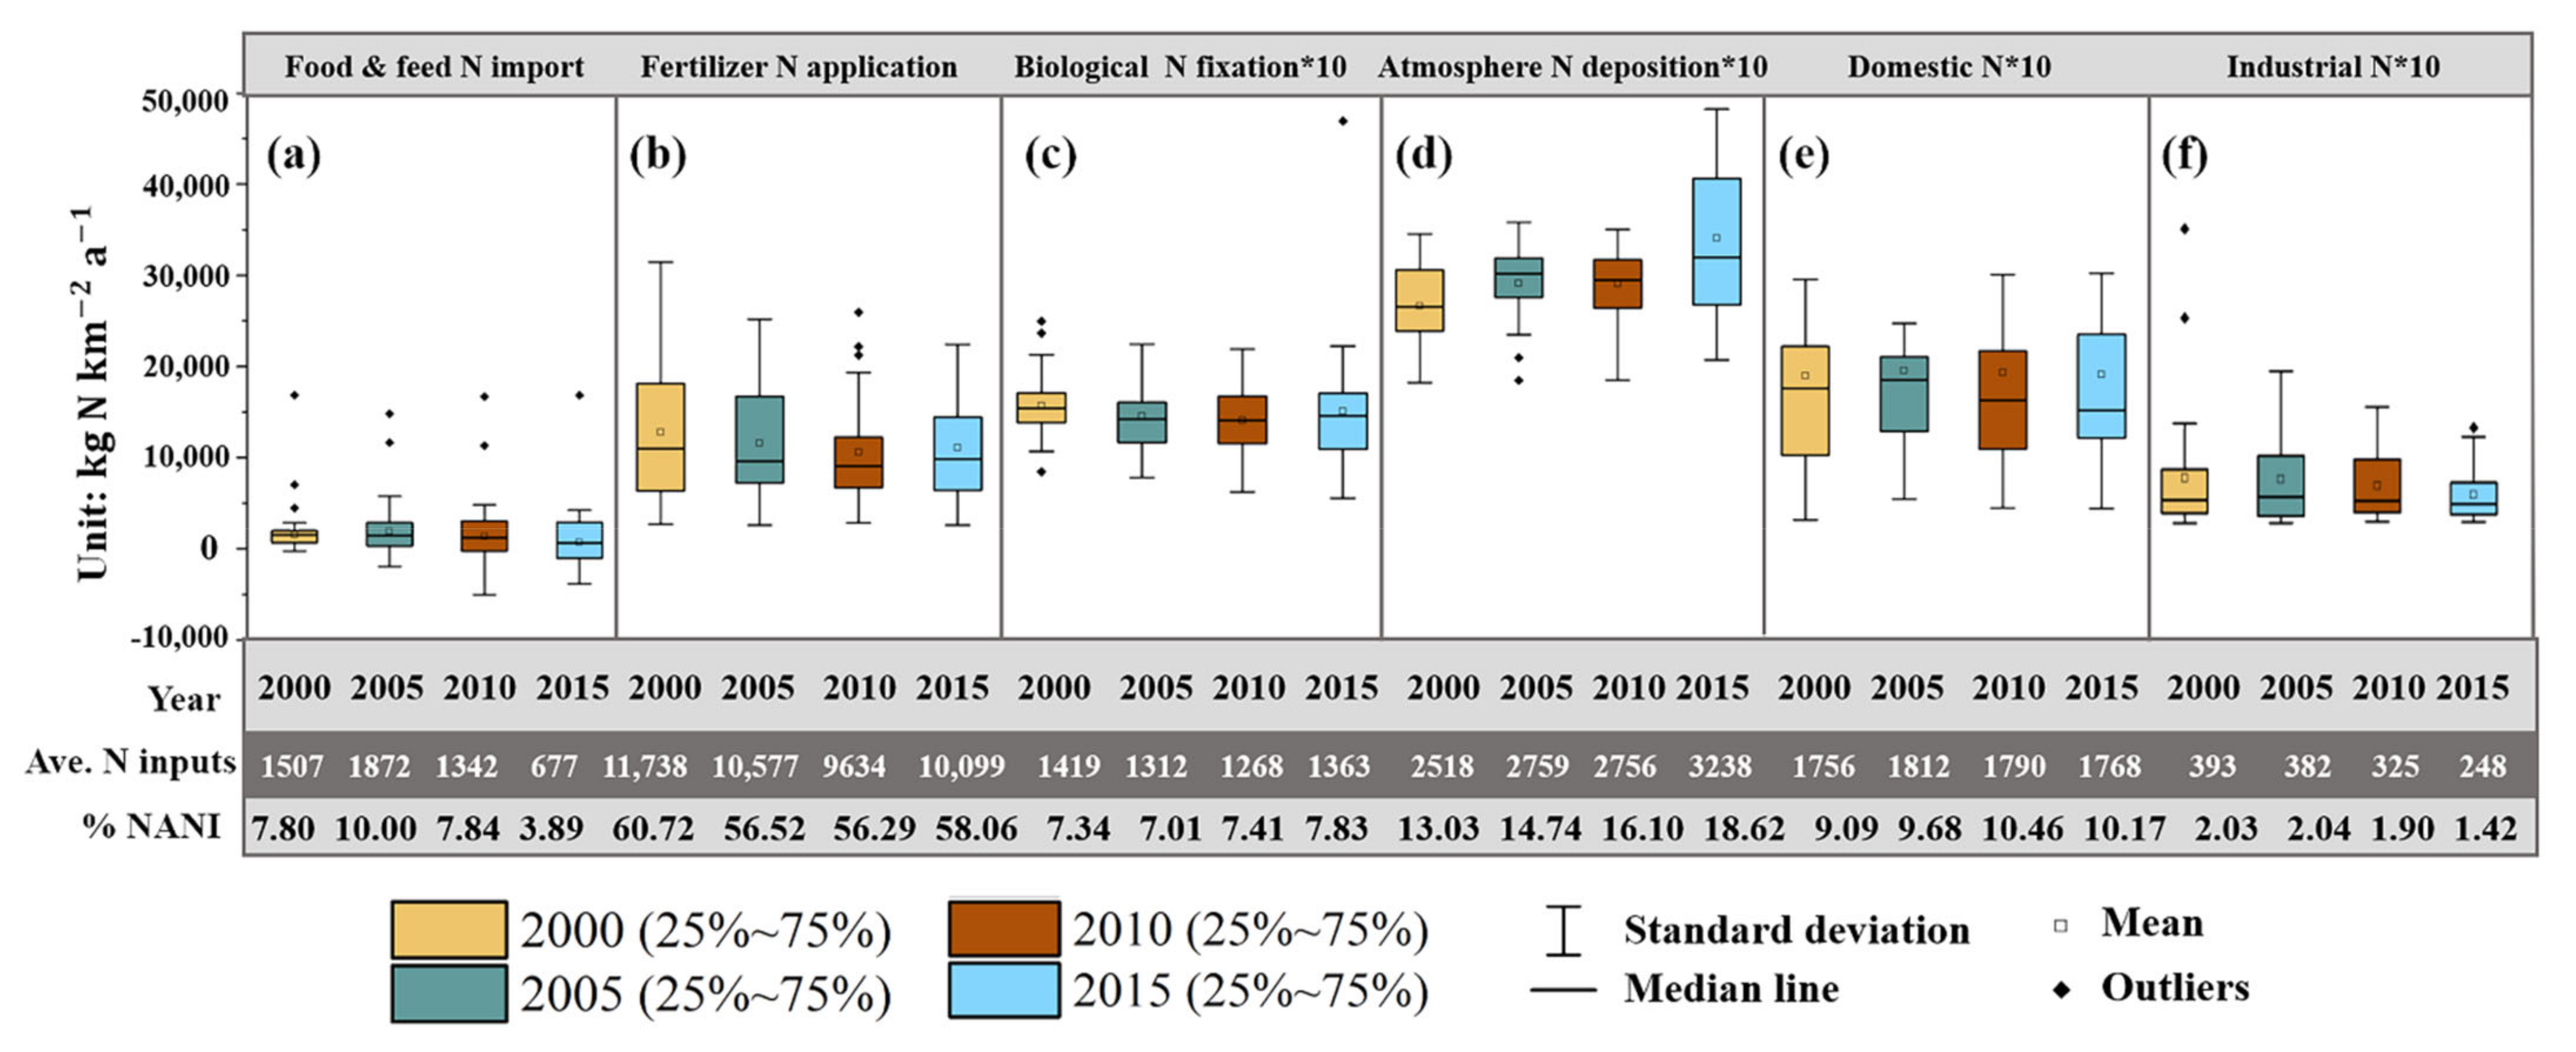
3.1. Temporal Dynamics and Sources of Anthropogenic N Inputs

On average, the area-weighted NANI in the YRDUA decreased from 18,766.79 kg   N   km 2   a 1 in 2000 to 16,798.08   kg   N   km 2   a 1 in 2015, showing a downward trend (Table 1). The NANI values of the 26 cities in this region ranged from −10,563.83 to 54,168.68   kg   N   km 2   a 1 , with an average of 19,331.37 kg   N   km 2   a 1 in 2000 and, in 2015, ranged from −8612.49 to 39,208.17 kg   N   km 2   a 1 , with an average of 17,392.74 kg   N   km 2   a 1 . This is due to the distinctions in the urban development characteristics, which caused such a large difference in the NANI intensity between these cities. Non-point source N accounted for approximately 90% of the total N inputs, indicating that the NANI in the YRDUA mainly came from non-point-source inputs. Over the study period, the change in total anthropogenic N inputs was consistent with the non-point-source N inputs, while the point-source N inputs showed an upward trend first, and then decreased.
Among the components of the NANI, the fertilizer N application was proved to be the dominant source for N inputs across the 26 cities studied (Figure 4), contributing about 58%, which implied that agricultural production was one of the main drivers of N input intensity. Accompanied by intensive fertilizer application, the atmosphere N deposition, which became the second major source of N inputs, presented an increasing trend, and its amount increased by 29% from 2000 (2518   kg   N   km 2   a 1 ) to 2015 (3238   kg   N   km 2   a 1 ). Domestic sewage N discharge was the third major source of the NANI in the YRDUA, with an average proportion of about 10%.
Additionally, the amount of net food and feed N import increased from 2000 to 2005, and then decreased by 2015, showing that the mismatch between food supply and demand in the YRDUA intensified between 2000 and 2005 and then improved from 2005 to 2015. In contrast, the N contents from biological N fixation and industrial N production were relatively stable. The variation rates of N input sources over the study period are shown in Figure 5. During 2000–2005, four out of six components of the NANI increased. However, in 2005–2015, there was only one increase; in other words, except for the atmosphere N deposition, the others showed a downward trend. Thus, we concluded that, in addition to the fertilizer N application, which is generally the main source of N inputs, atmospheric N deposition, which mainly results from fossil fuel combustion, traffic emissions, industrial exhaust emissions, etc., also requires sufficient attention in metropolitan areas.

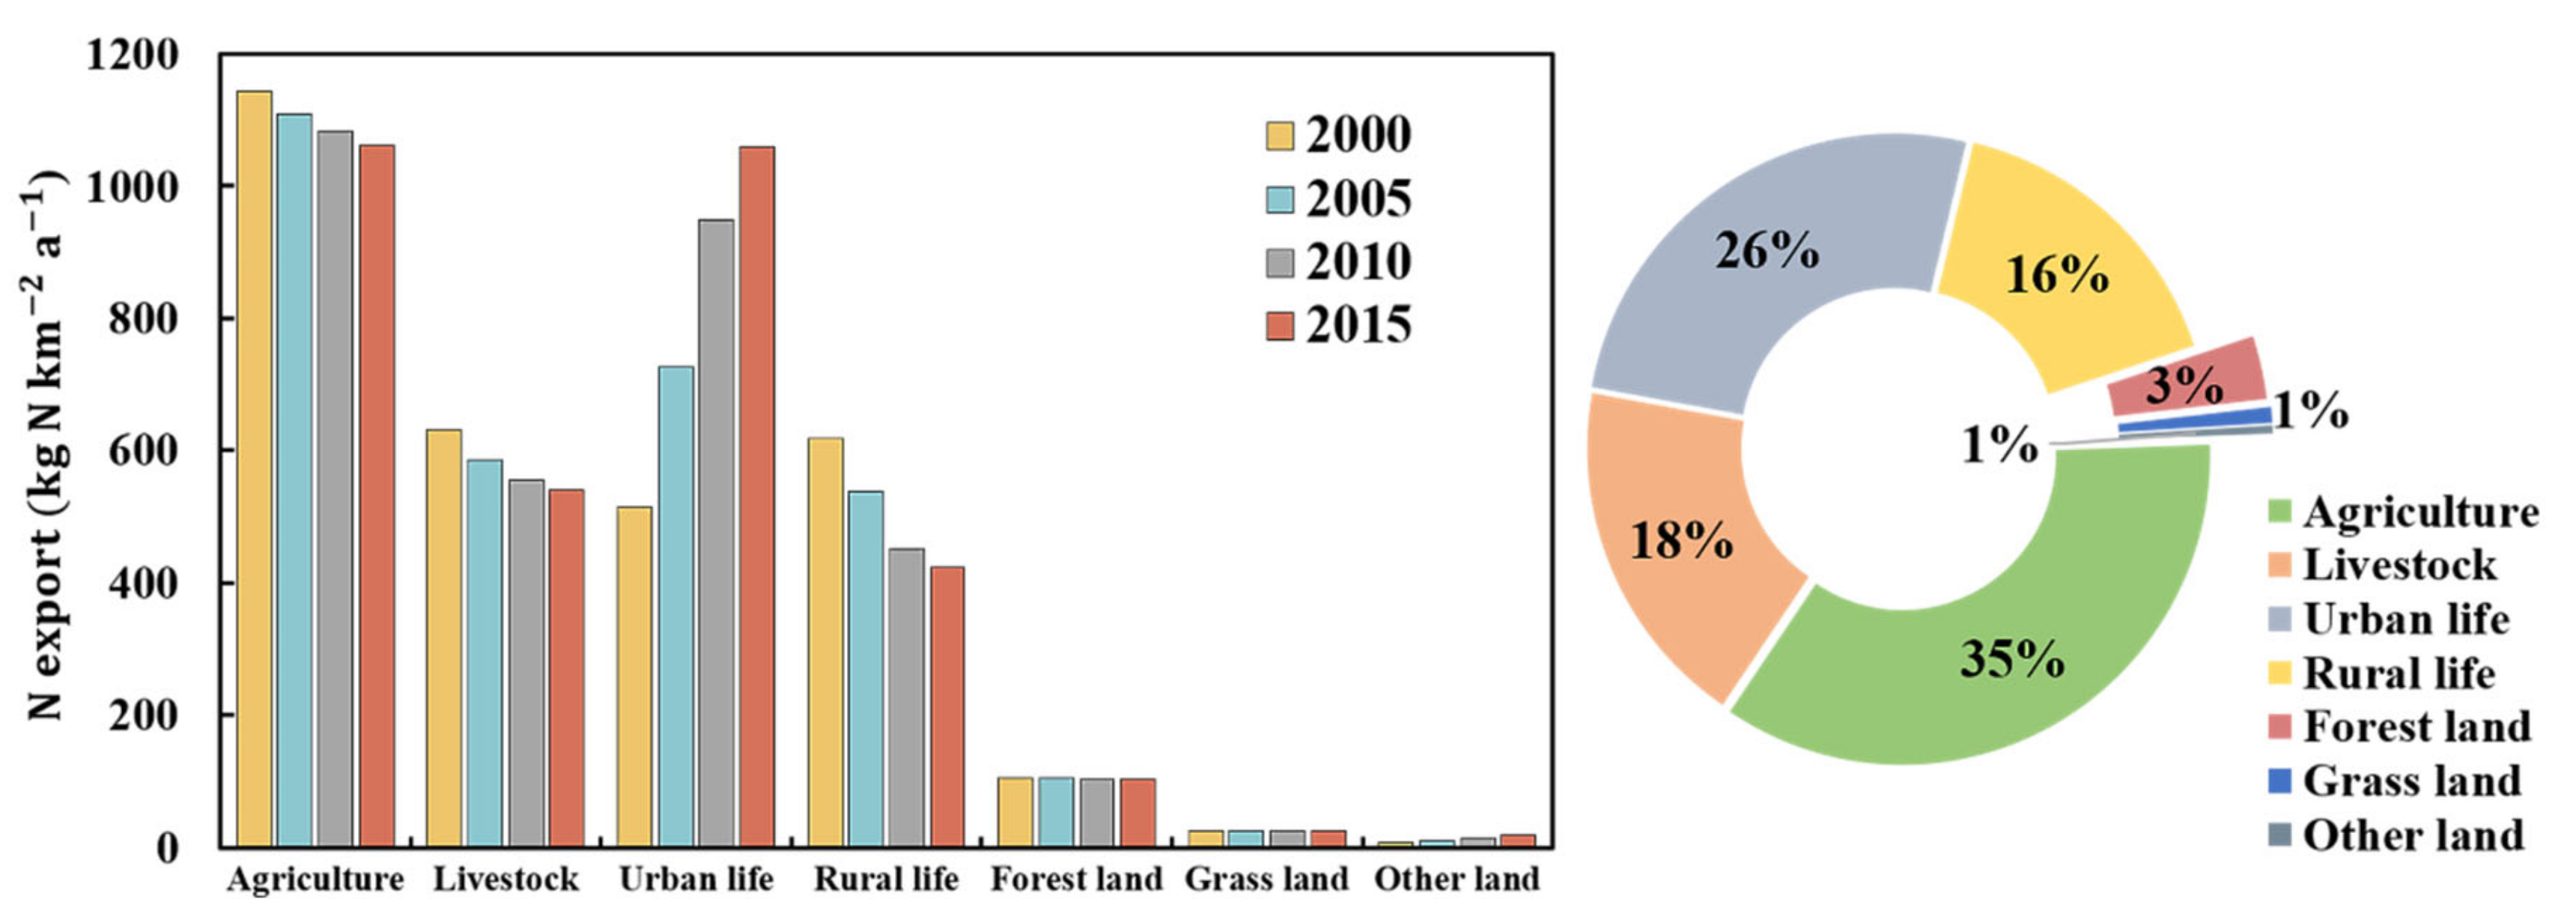
3.2. Temporal Dynamics and Sources of Anthropogenic N Exports

The dynamic characteristics of N exports to rivers in the YRDUA during 2000–2015 are shown in Figure 6. In this period, area-weighted N exports grew from 3047.52 kg   N   km 2   a 1 in 2000 to 3233.46 kg   N   km 2   a 1 in 2015, with an increase of 6%. Various sources were calculated, including farming, livestock breeding, rural life, urban life, and other land-use types. We observed that the contributions from the main pollution sources changed considerably between 2000 and 2015. Agricultural production was the predominant source of N exports in the YRDUA, contributing to 35% of total N exports, and this amount showed a downward trend in 2000–2015, which was consistent with the reduction of cultivated land, which fell by 7%.
On the contrary, the amount of N exported from urban life, the second main source, showed a significant increasing trend, rising about 106% from 2000 to 2015. This is due to the rapid increase in urban population—more specifically, the number of urban residents in 2015 was about twice as many as in 2000. The N exported from both rural life and livestock breeding showed a decreasing trend from 2000 to 2015, in which the trend of rural life was more obvious. Forest land, grass land, and other land-use types remained relatively stable during the study period. Overall, changes in N exports were inextricably linked to urbanization, as well as the intensification of agriculture and aquaculture.

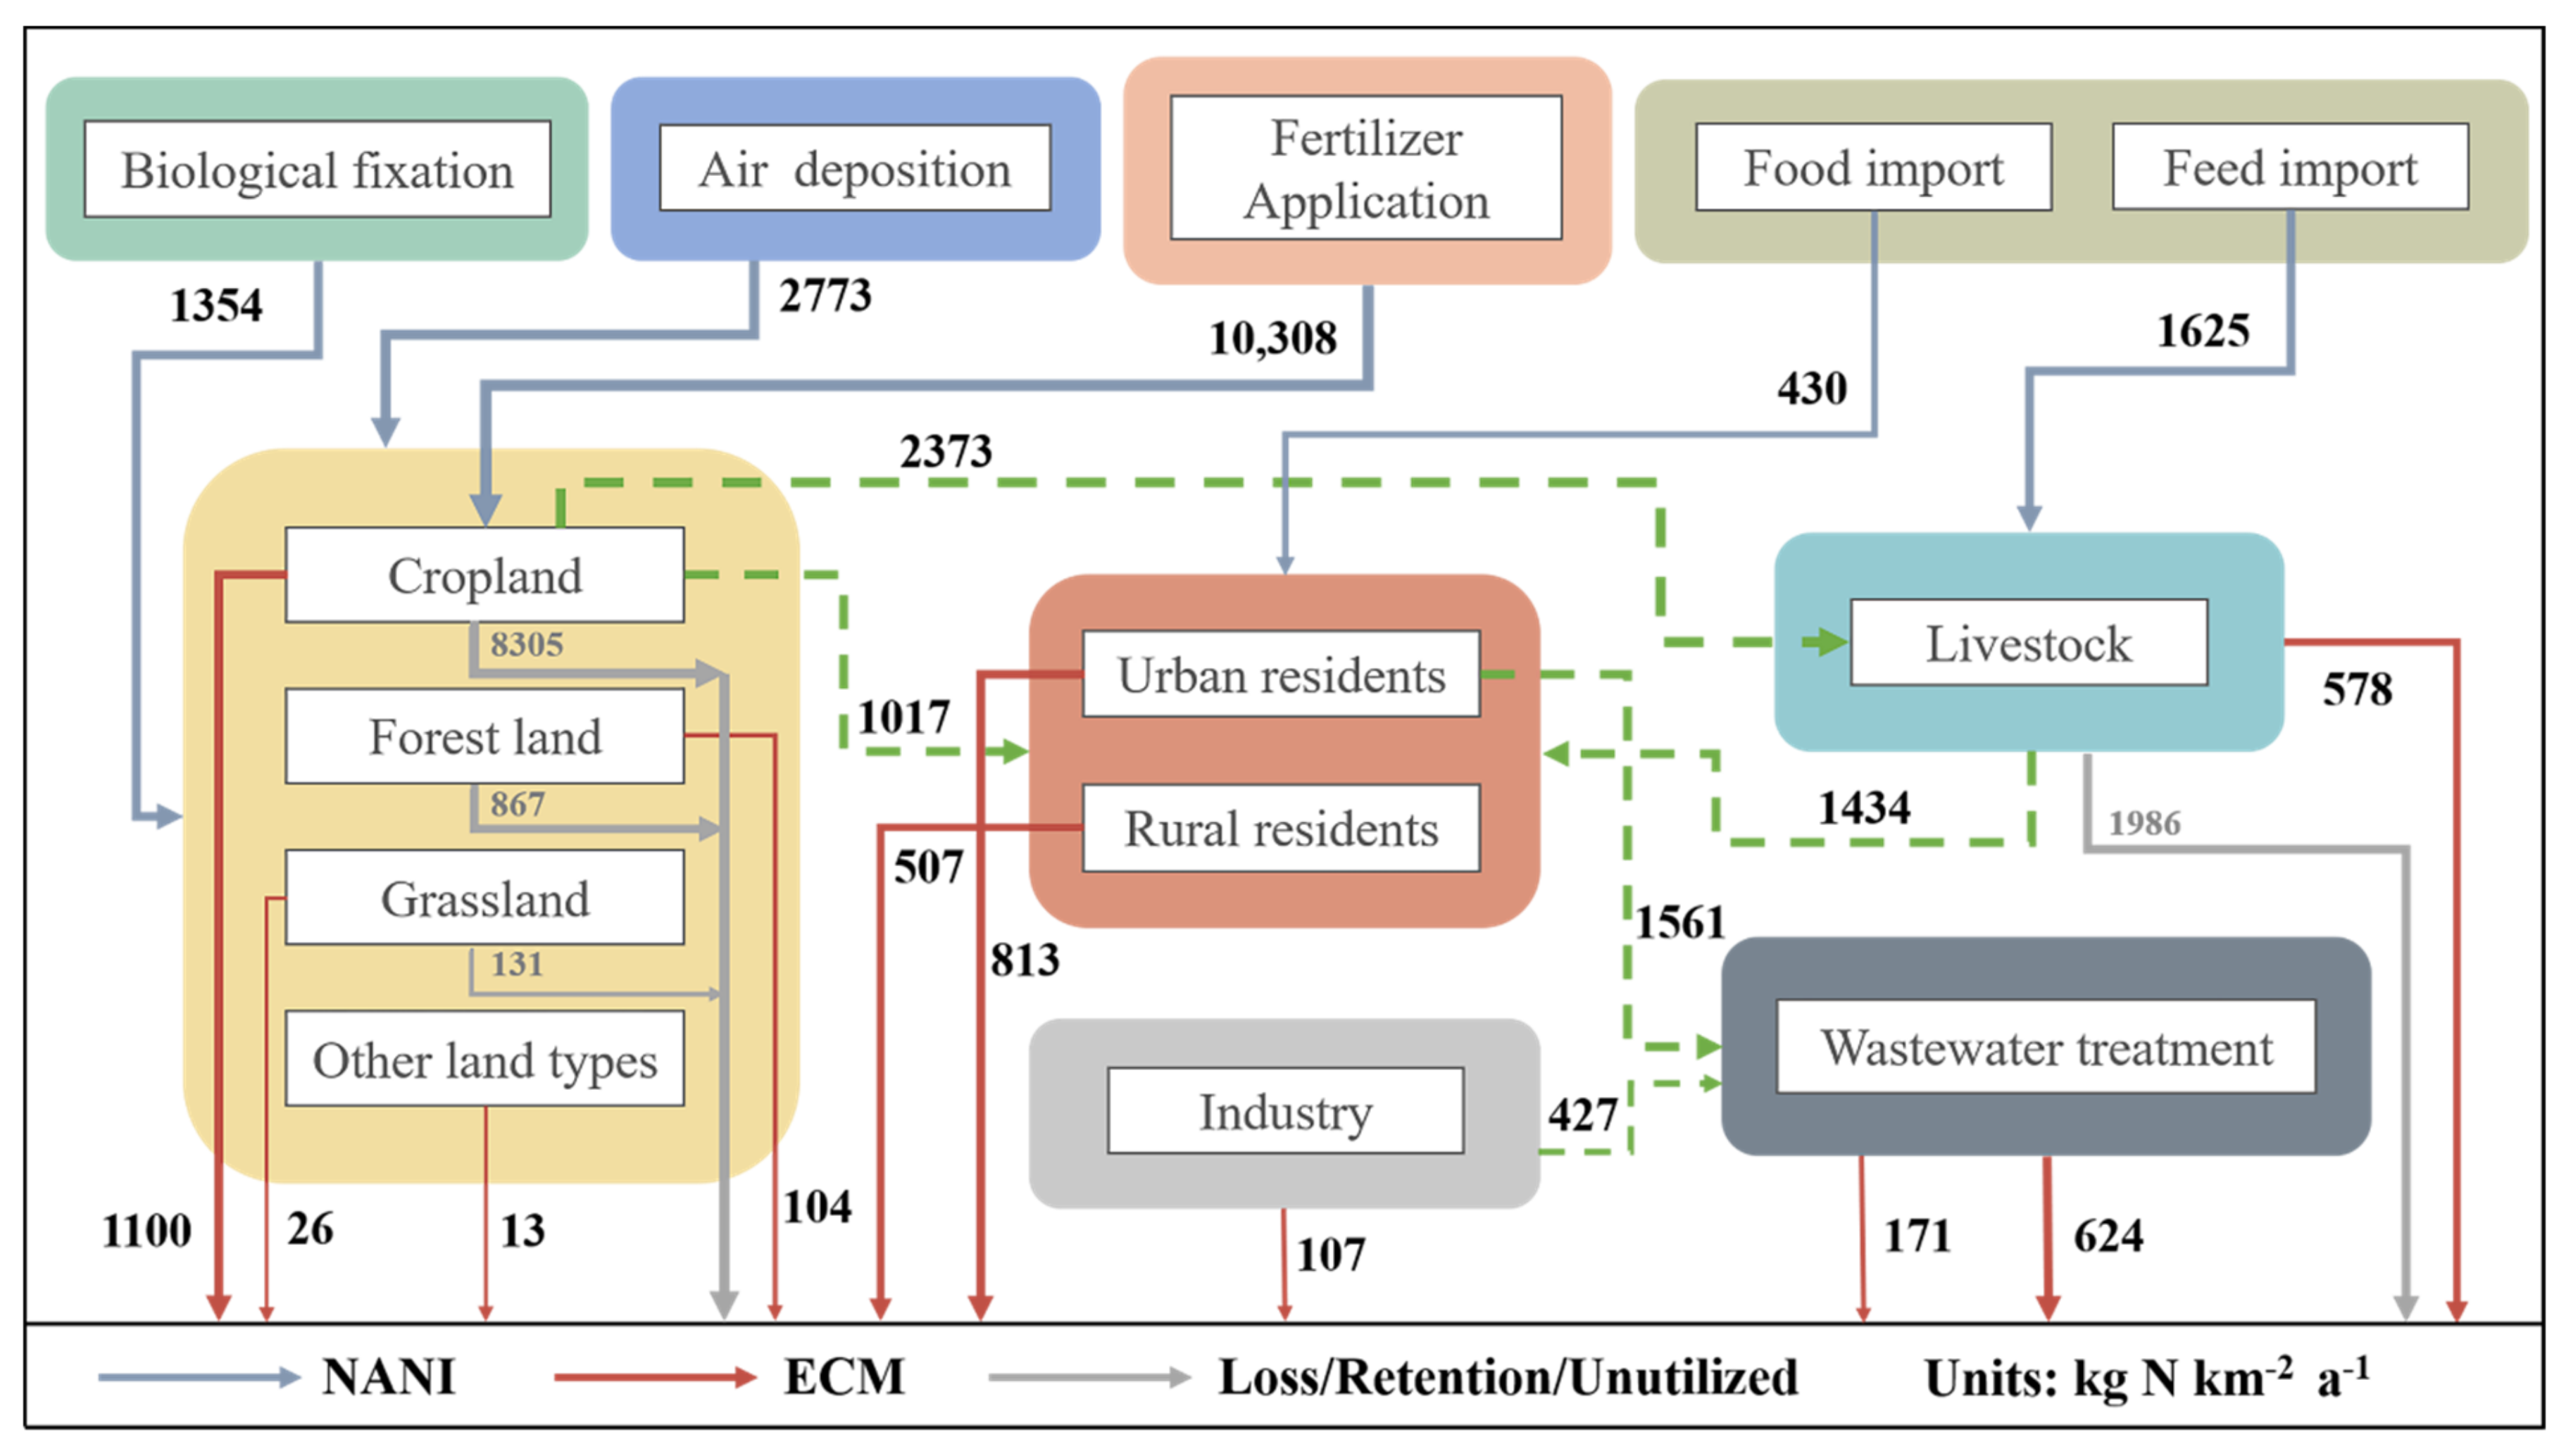
3.3. Overview of N Flows in the Metropolitan Area

An overview of the mean N flows in the YRDUA during 2000–2015 is presented in Figure 7. According to the traces of N flows, we found that the agricultural system was the most crucial part, and received the highest N mass compared with other nodes (e.g., urban and rural inhabitants and livestock). However, the utilization efficiency of N showed a considerable mismatch with the intensity of fertilizer N inputs into this system, which resulted in almost 70% of N inputs not being effectively used. The surplus N was either exported to the water bodies through a non-point pathway or retained in the system. As for the human and livestock systems, the N derived from urban and rural residents and livestock was apparently also the major component of non-point-source pollution. Even if we assume that the N production of local crops and animals was entirely used for domestic demand, this metropolitan region still needed food and feed N imports at the overall level.
Notably, several assumptions were made to generate this diagram (Figure 7), including that (1) we assumed that each node (i.e., crops, humans, livestock, etc.) was subjected to the conservation of mass; (2) the N produced by local crops and animals were assumed to be completely used to meet the demands of local human consumption and livestock breeding; (3) according to the difference in N demand between people and animals, we assumed that 70% of the crop production N flowed to livestock, while 30% was supplied to humans; (4) the percentage of sewage effluent that was treated by sewage plants was assumed to be 80% based on a multi-year average.

3.4. Spatial Patterns and Hotspot Analysis of N Budgets

The dynamic spatial distribution pattern of N budgets is shown in Figure 8. The overall distribution of the NANI presented a similar spatial pattern to that of non-point-source N inputs (NANIn) during 2000–2015, showing that the N inputs were higher in the northeastern plain area than in the southwestern hilly region. It appears that the N inputs were generally high in areas where the population density was high and were low in areas where woodland was the main land-use type.
We found that the NANI intensities in Shanghai and Jiaxing were invariably high throughout this period; however, the reasons for their high values are not the same. Specifically, net food and feed N import contributed largely to the N inputs of Shanghai, while fertilizer N application was the most important source for Jiaxing. This mostly resulted from the different development patterns. Shanghai is the city with the highest population density in the YRDUA, which has led to a great demand for food N imports, and this is different from Jiaxing, which has relatively developed agricultural production. The N exports also showed a similar spatial trend of N inputs, in which Shanghai and Jiaxing were also the most prominent. Considering the distribution of the land-use patterns (Figure S1) and population residences, we concluded that high-intensity N budgets mainly occurred in areas with intensive agricultural activities and dense population.
The cities with high N budgets in the YRDUA were mainly concentrated in the Taihu Lake Basin and its north, including Shanghai, Jiaxing, Yancheng, Taizhou (JS), Nantong, Changzhou, Wuxi, and Nanjing. These cities were also identified as the hotspots ( p < 0.01 ) of N budgets during the study period (Figure S2). Through our research, the hotspots covered 19% of the total land, but contributed to more than 30% of the total N budgets. In contrast, the cold spots occupied 14% of the total area and contributed less than 7% of the total N budgets. Overall, the spatial distribution of hotspots remained relatively stable during 2000–2015, implying that the relatively high values of N inputs found in 2000 were likely to remain in 2015.

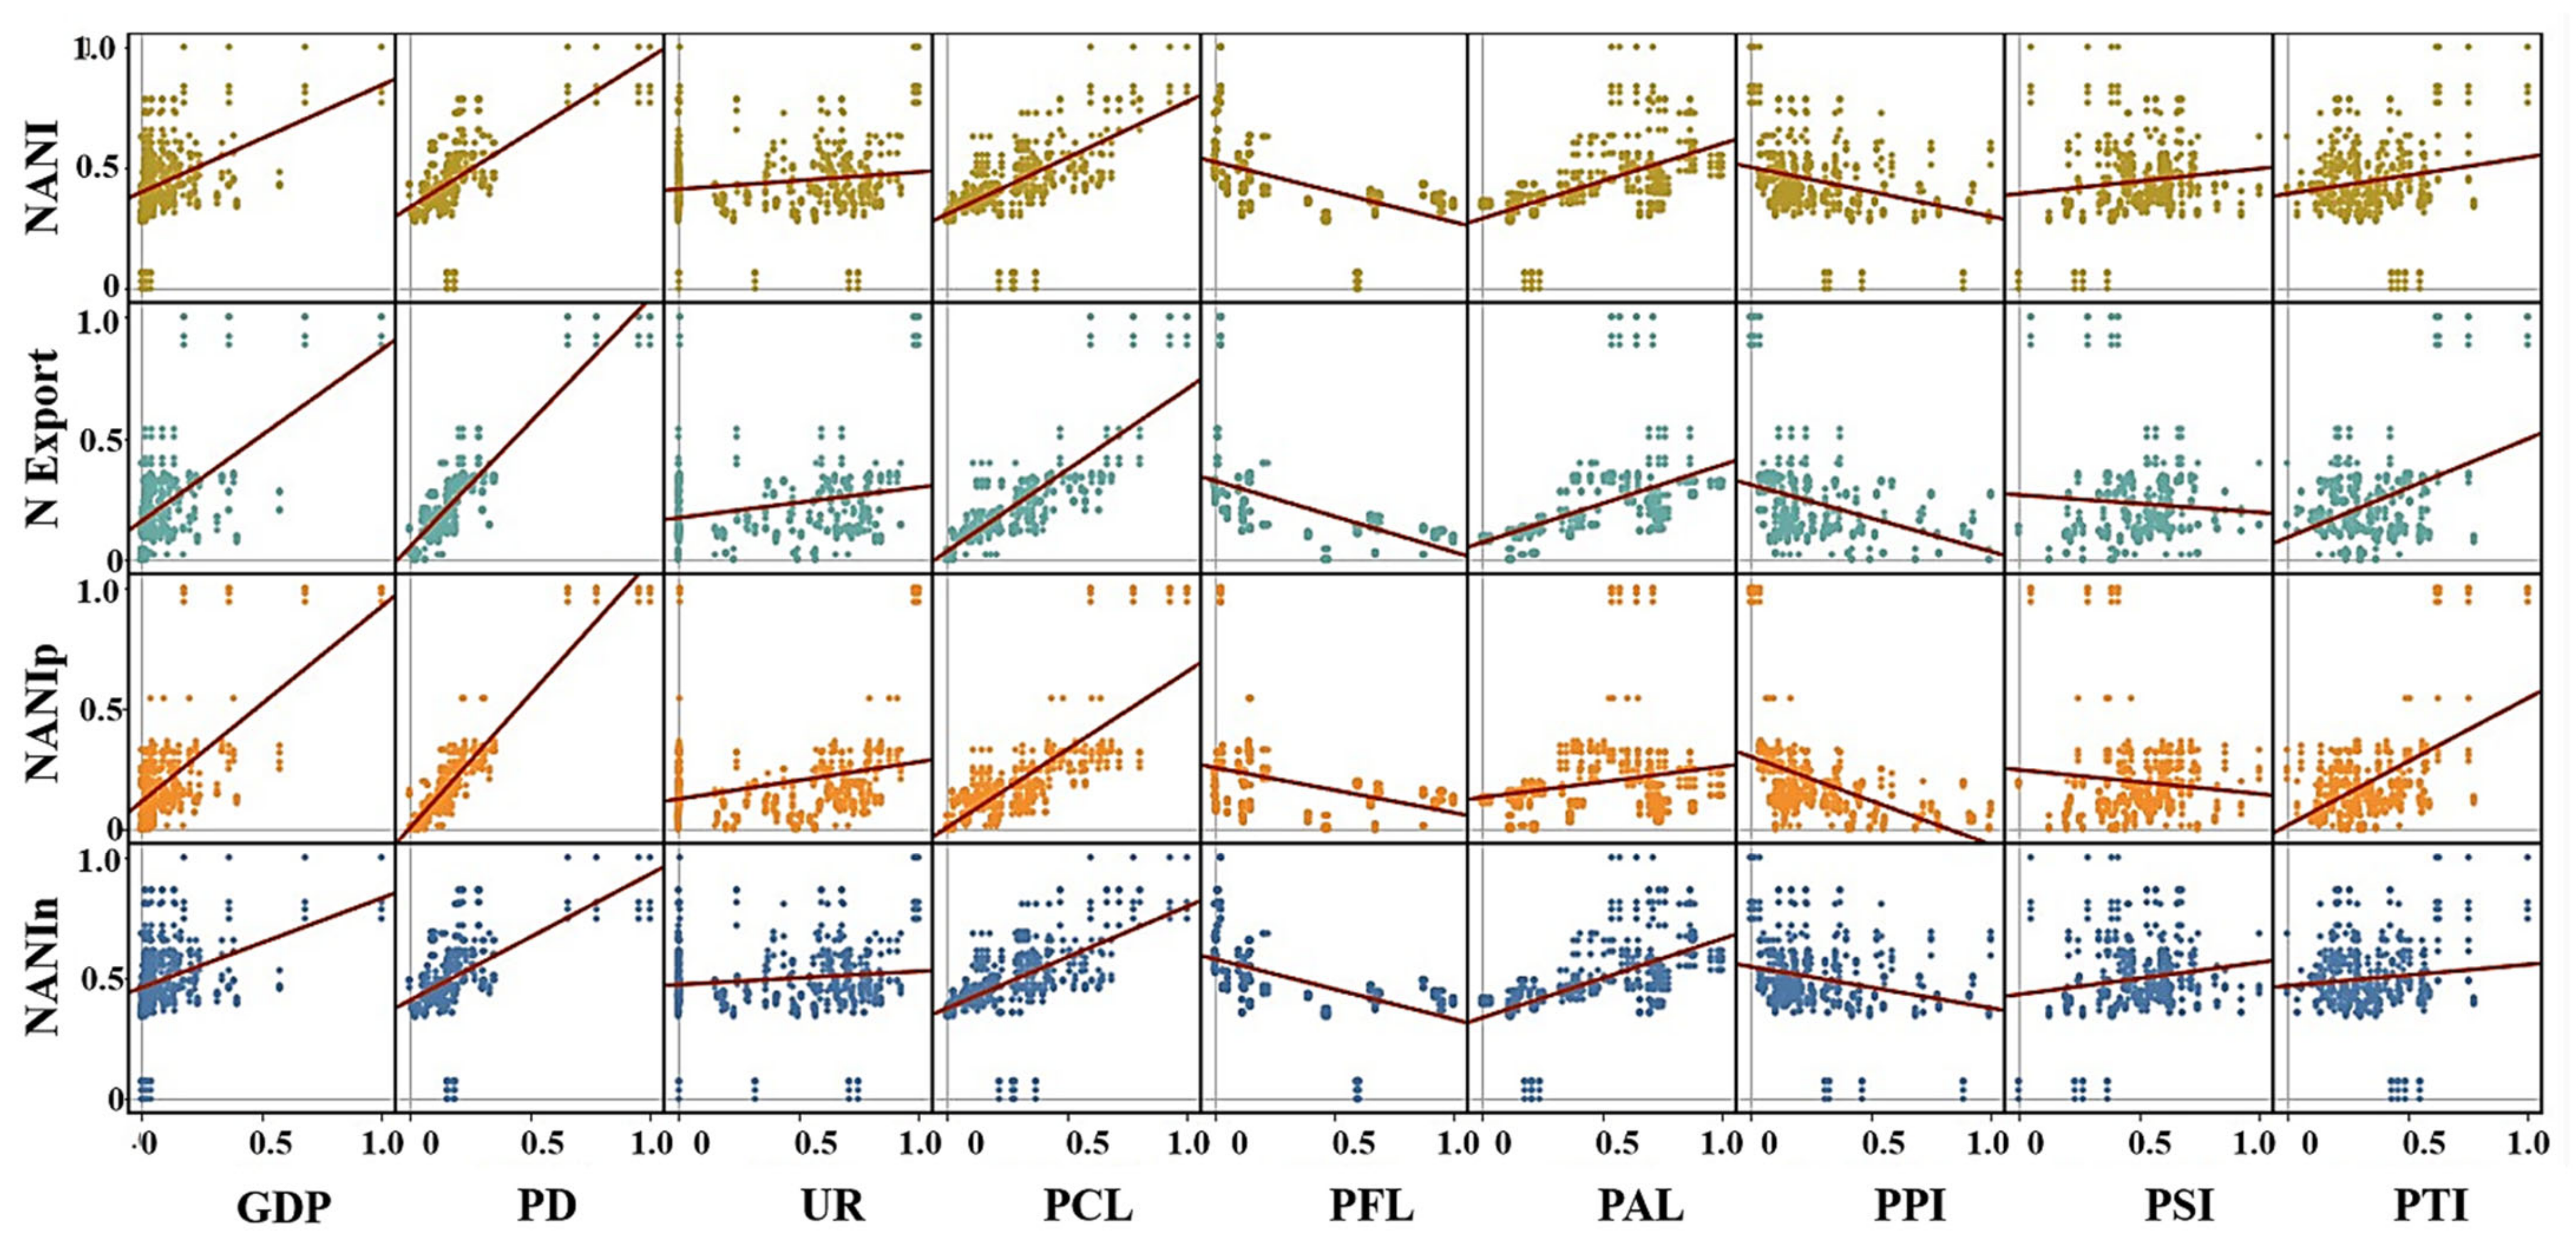
3.5. Potential Driving Factors of N Budgets

To explore how human activities affected the N budgets in the YRDUA, linear regression analysis was performed to explore the relationship between the human activity index and N budgets (Figure 9). All data have been standardized here. Three categories of indicators, including the levels of population and economic development (PED), land-use pattern (LUP), and industrial structure (IS), were selected in this analysis (Figure 3). The results showed that, except for the urbanization rate (UR), the other PED indexes were significantly positively correlated with the N inputs and exports (Table S5). This indicates that cities with higher population densities or higher levels of economic development are more likely to have higher N input and export intensities.
Among the LUP indexes, the percentage of agricultural land (PAL) and the percentage of construction land (PCL) had clear positive effects on the intensity of nitrogen flux, while the N inputs and exports were inversely proportional to the proportion of forest land (PFL). Consistently with the spatial distribution pattern (Figure 8), the areas with high N budgets were located in the northeast of the YRDUA, where there was a high proportion of cropland or construction land. The low N budgets were distributed in the southwestern cities, where the land-use patterns were dominated by forest areas. Regarding the IS indexes, the three sub-indexes (PPI, PSI, and PTI) were observed to have no obvious correlation with the N inputs and exports, indicating that the characteristics of the industrial structure had no direct driving effects on the nitrogen flux in urban areas.

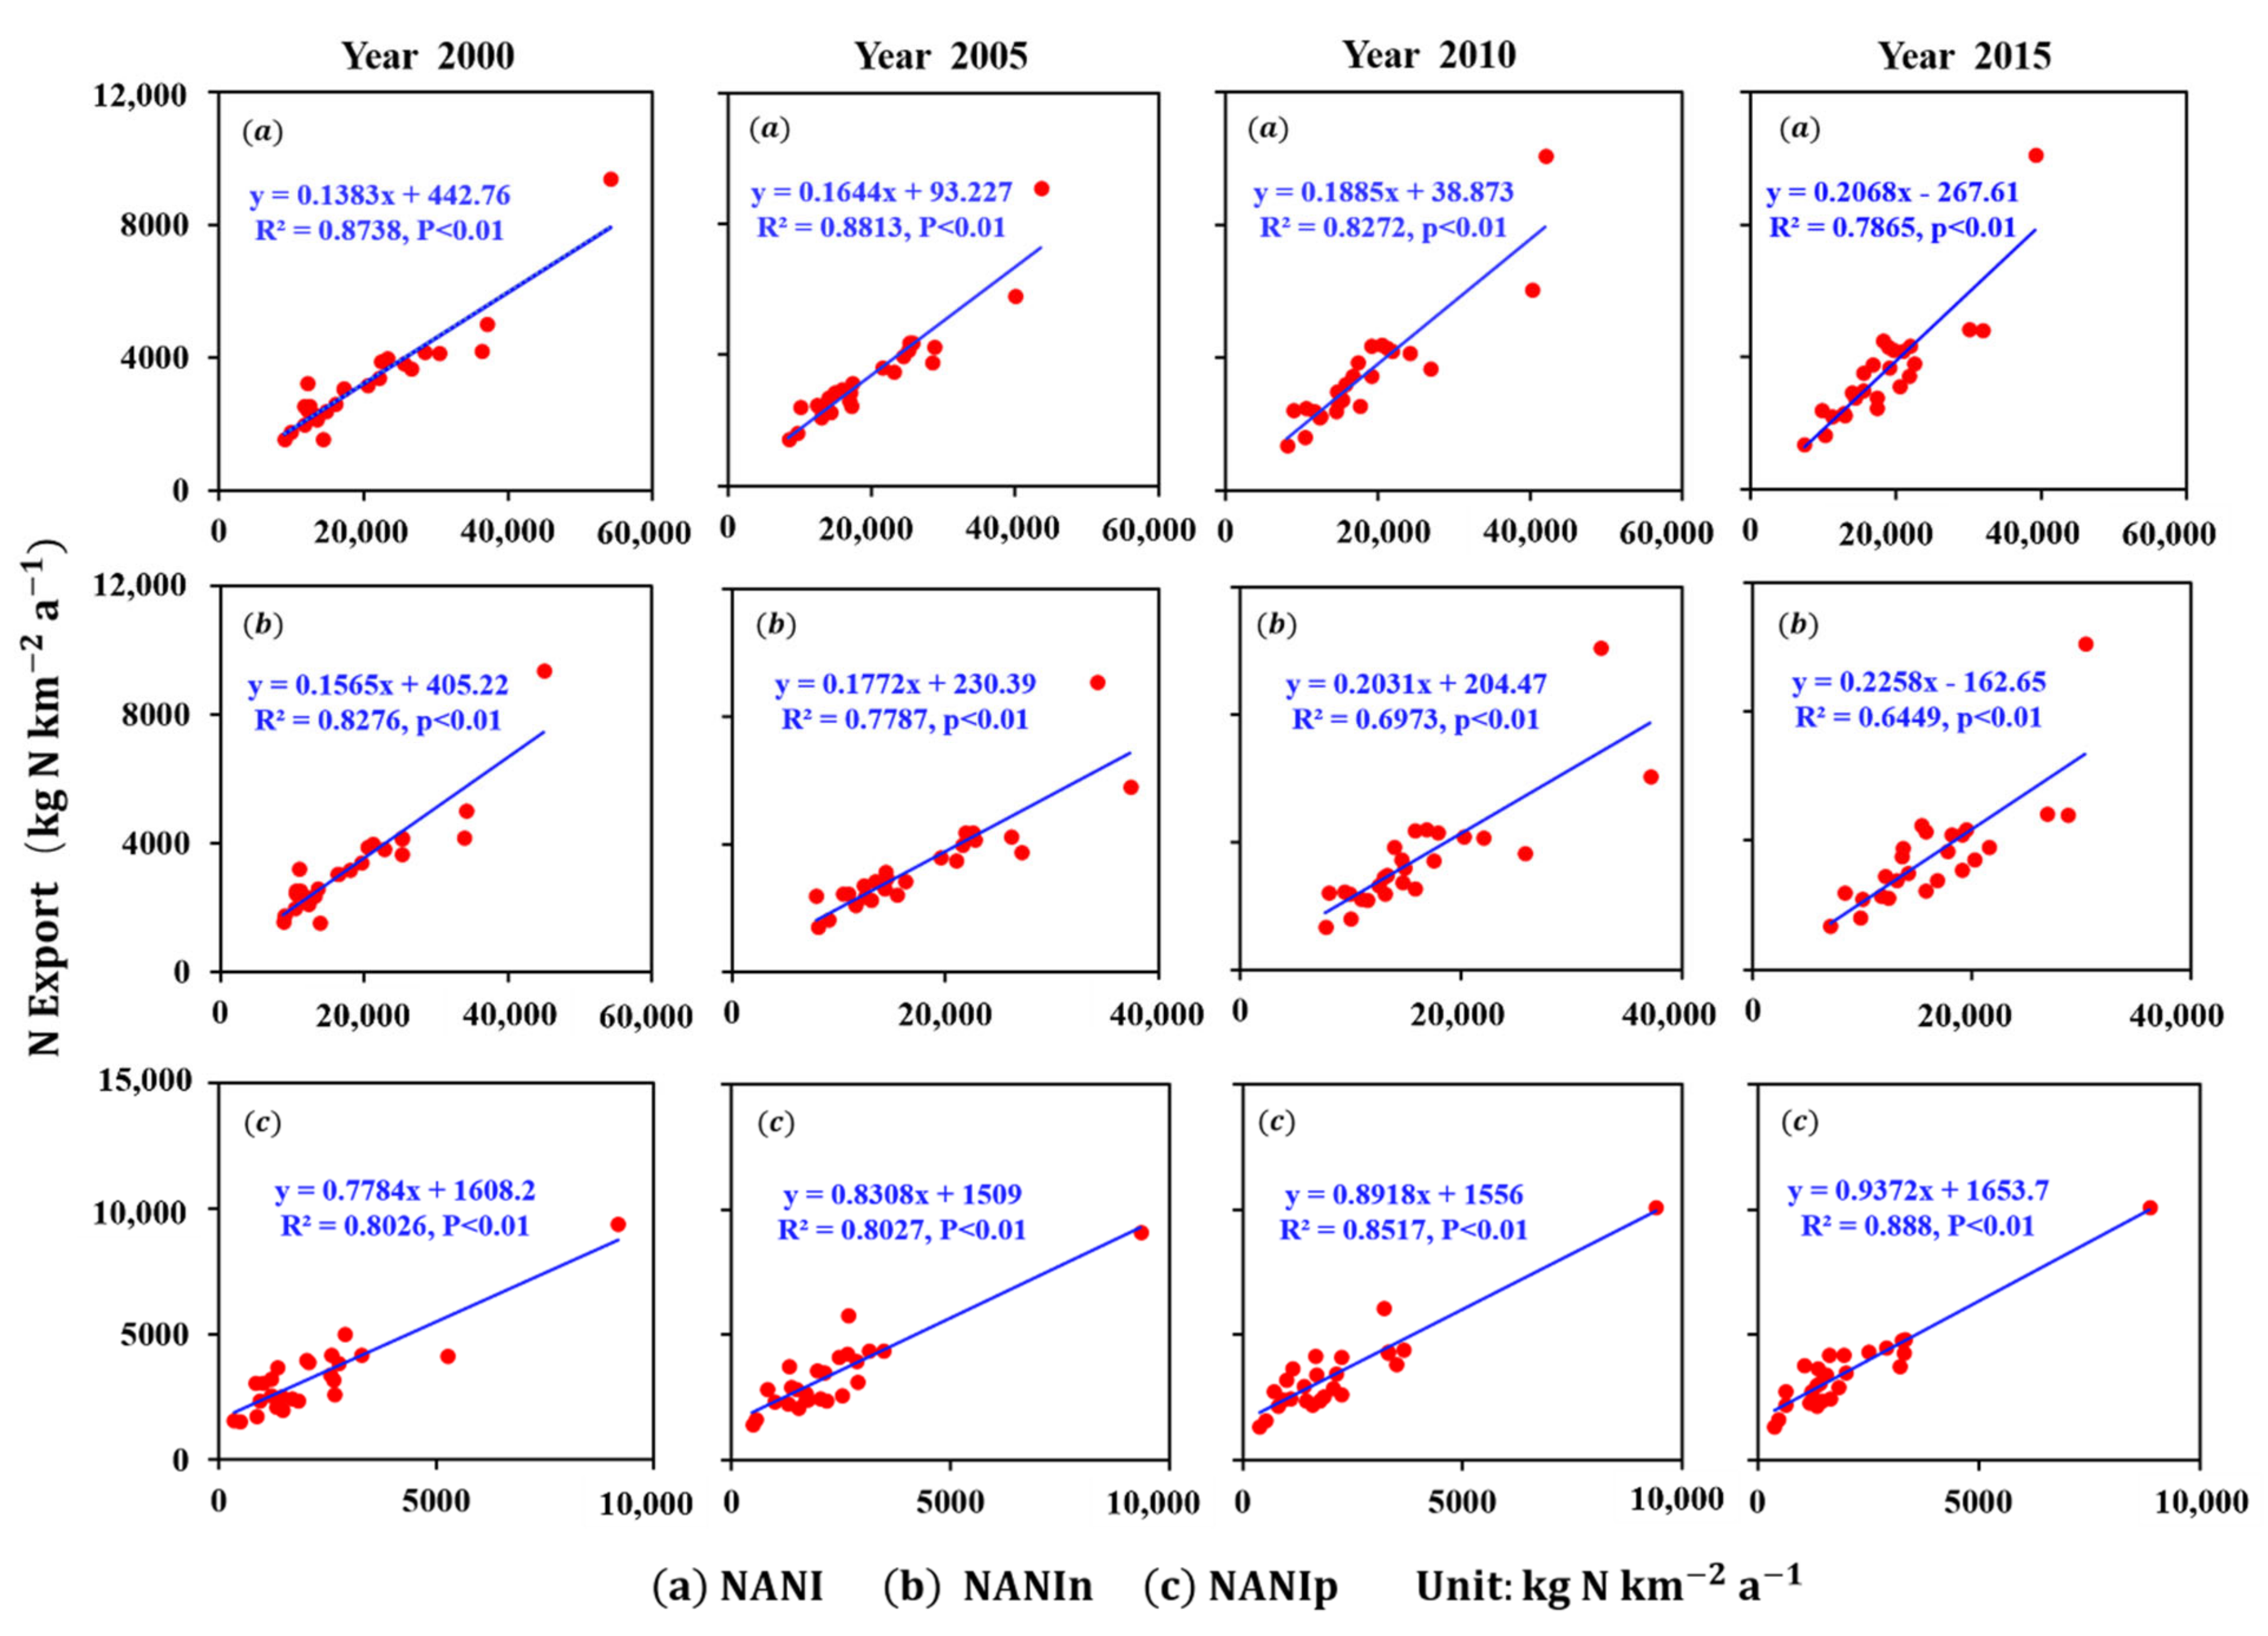
3.6. Dynamic Response of N Exports to N Inputs

The riverine N exports from the 26 cities were significantly and positively correlated with the NANI during 2000–2015 in the YRDUA (Figure 10). The slopes between the NANI and riverine N exports were 0.14, 0.16, 0.19, and 0.21 in 2000, 2005, 2010, and 2015, respectively. The slope of the fitted equation showed a significant increasing trend from 2000 to 2015. This is consistent with a previous study on the Taihu Lake Basin, in which the export ratio also showed remarkable growth during 1980–2010. Overall, 18% of the N inputs were exported to the water bodies across the 26 cities in the YRDUA, which was evidently higher (about 3%) than in the Baiyangdian Basin [22]. Considering the case that they are both plain areas, hydroclimate might be a major cause of this difference. Therefore, it can be concluded that, compared with arid or semi-arid areas, the NANI could have a greater influence on the riverine N in humid and rainy regions.
As for the NANIn and NANIp, the N export ratio also had a distinct rising trend during the study period. On average, 19% of the NANIn and 86% of the NANIp were exported into water bodies. Even though the non-point-source inputs were fairly high, they are usually relevant to strong landscape retention processes, which can dramatically reduce the masses flowing into river systems.

4. Discussions

4.1. Anthropogenic N Inputs in the YRDUA

In this study, long-term N inputs in the YRDUA were quantitatively evaluated by using the NANI method. For further understanding, we compared the characteristics of the NANIn in major basins and regions around the world [12,16,22,23,24,26,31,43,44,45,46,47,48,49] (Figure 11). We only compared the characteristics of non-point-source N here, as it was the dominant source in this study and there have been relatively few studies involving point-source nitrogen so far. In general, the multi-year averaged NANIn in the YRDUA was around three times higher than that reported in mainland China [44,45].
Except for the Huai River Basin (HRB) and Baiyangdian Basin (BYD), the NANIn of the YRDUA was higher than those of the other basins or regions shown in the figure. Fertilizer N application and atmospheric N deposition were the main causes for the relatively high values of the NANIn in these two basins, and this is consistent with the two main sources of the NANI in the YRDUA. Unlike other areas where fertilizer N was the most vital source of N inputs, the atmospheric N deposition was the dominant source in Beijing, which was closely related to the urban characteristics there. This also revealed that fossil fuel combustion could be the main source of N pollution in metropolises.
Generally, land-use types dominated by cultivated land were largely responsible for large N inputs [50]. For instance, the percentage of agricultural land (51%) in the YRDUA was smaller than that in the Huai River Basin [24], and the NANIn was comparatively lower due to the relatively less intensive agricultural production and fertilizer application (Table S6). In contrast, the NANIn in the YRDUA was higher than that in the Erhai Basin [48], where forest was the main land-use type, covering about 69%, which is nearly three times the proportion of forest land in the YRDUA. In addition, the high population density also contributed a great deal to the N input intensity, which was demonstrated by the examples of the Taihu Basin, Chaohu Basin, Beijing Municipality, and YRDUA (Figure 11).
The uncertainties in our study are mainly relevant to the data sources and parameters because the N budgets were calculated based on two empirical models. First, most of the data were originally derived from statistical yearbooks, which are known to be the most reliable data source in China [51]. Many parameters used in this study for assessing N budgets through individual crops, livestock, population, etc. can also cause uncertainties. The most influential parameters of N budgets were identified through sensitivity analysis (Figure S3). The results showed that the most sensitive input term of the non-point-source components of the NANI was fertilizer application, followed by food and feed inputs. Regarding the point sources, the most sensitive component was the urban domestic N discharge. Ensuring the accuracy of sensitivity parameters is essential for reducing the biases and uncertainties of estimation. In addition, the dynamics of the coefficients might also result in potential uncertainties. Thus, it is essential to be careful when selecting the associated parameters.

4.2. Influence of Anthropogenic Inputs on Riverine N Exports

Studying the response of riverine N exports to human-caused N inputs can promote understanding of the influence of anthropogenic N inputs on regional water pollution at the macroscopic scale. We examined the N export ratio and found that a mean of about 18% of the N inputs were exported to water bodies during 2000–2015. The N export ratio showed an increasing trend from 2000 to 2015, with a growth rate of 7%. Compared with the global N export ratio (25%) [52], that of the YRDUA was significantly lower, which indicates that there might be a considerable amount of N retained in this urban agglomeration, with potential harm to the terrestrial ecosystem.
For non-point-source and point-source pollution, although non-point-source N inputs were dominant in the YRDUA (contributing about 90%), we found that only about 19% of non-point-source N was exported to water bodies. This is because non-point-source N inputs are generally related to landscape retention processes, which can significantly reduce the N masses [24], and the denitrification may also be a significant loss pathway in agricultural watersheds. However, attention should also be paid to the issue of nitrogen saturation. As mentioned by Lian et al. [23], the excess N could not be retained in the Taihu Basin because the N surplus there was so large. This indicates that the ecosystem has a certain storage capacity for nitrogen; once it oversteps its capacity, the N retention rate of a landscape will be greatly reduced. Regarding the limited amount of green space (forest land and grass land), which typically has a higher N retention rate than other land-use types, in the YRDUA (accounting for only 29% of total land in 2015), it is vital to investigate the storage capacity and nitrogen saturation limit in rapidly urbanizing areas in the future.

4.3. Possible Implications for Reducing N Loading

The spatial–temporal characteristics and main sources of N budgets in the YRDUA, a typical developed urban agglomeration, were explored in our study. It is crucial to take effective measures and strategies for mitigating N pollution. Although the overall anthropogenic N inputs showed a downward trend, the contribution of the increasing atmospheric N deposition cannot be ignored. In addition, areas identified as hotspots (Figure S2) were always areas of high N inputs and exports during the study period, which should be paid more attention in order to control excessive N. Regarding the agricultural system, which was identified as the most important node of N flows, it is necessary to improve the production efficiency of limited cropland—for instance, by carrying out different crop rotations and increasing the effective yield of crops—as production is intensified on land that is not converted for urban uses.
In addition, the scientific application of chemical fertilizers, improvement of fertilizer use efficiency, or development of biological fertilizers (e.g., green manure and manure piles) can also contribute to reducing the N load of the farming system. Regarding the livestock and human systems, effective use of their N outputs, such as human and animal feces or animal remains, is a useful way to promote N recycling. For industry, excessive dependence on fossil fuels greatly promotes the increase in atmospheric N deposition; therefore, it is necessary to use strategies such as alternative and renewable energy sources, including solar, wind, and energy derived from biomass.
Since sewage treatment plants play an important role in reducing the point-source pollution, they should also receive attention when attempting to control N. According to the sensitivity analysis of N inputs (Figure S3), if the sewage treatment capacity or N removal rate can increase by 10%, the point-source inputs of the NANI can be reduced by 9%. Therefore, improving the sewage treatment could be significant for the reduction of point-source inputs in the future.
Furthermore, optimizing the land-use patterns will also make a great contribution to the reduction of the nutrient load. As mentioned above, the proportion of forest land has a significant negative impact on the intensity of nitrogen budgets. If land-use patterns can be managed and optimized appropriately, with urban planning guiding sustainable development and natural environments that serve as a nutrient sink where nitrogen can be consumed by biological processes, the ecological damage from anthropogenic nitrogen sources can be minimized.

5. Conclusions

In this study, we evaluated the dynamic spatial–temporal characteristics of N budgets, the N export ratio, and the main anthropogenic driving factors of N inputs and exports in the YRDUA, a developed urban agglomeration area with intensive human activities. On average, the value of the NANI was about three times higher than the counterpart reported in mainland China over the study period. While non-point-source N contributed a large portion of the total inputs, fertilizer N application was the most important component of anthropogenic N inputs.
Although fertilizer nitrogen input was controlled to a certain extent from 2000 to 2015, the significant increase in the atmospheric nitrogen deposition revealed that controlling the use of fossil fuels and the emission of exhaust gas had great significance for the nitrogen management in rapidly urbanizing regions. For the point-source inputs, although they could be effectively controlled with the improvement of sewage treatment capacity, when this ability develops to a certain level, the continuous growth of the population will bring huge pressure on the regional nitrogen control. As was shown in the analysis of potential driving factors, the population density had a prominent positive correlation with the nitrogen budgets, especially the point-source nitrogen input. Through the analysis of the riverine nitrogen export ratio, it was found that around 82% of the nitrogen remained in the ecosystem, which may cause nitrogen saturation that will need to be addressed in the future.

Supplementary Materials

The following are available online at https://www.mdpi.com/2071-1050/13/4/2006/s1.

Author Contributions

Conceptualization, N.D. and J.Z.; Data curation, N.D.; Formal analysis, N.D.; Funding acquisition, X.W.; Investigation, N.D. and J.Z.; Methodology, N.D. and X.L.; Project administration, X.W.; Resources, X.W.; Software, N.D. and J.Z.; Supervision, X.W.; Validation, N.D. and X.L.; Visualization, N.D.; Writing—original draft, N.D.; Writing—review and editing, N.D. All authors have read and agreed to the published version of the manuscript.

Funding

This research was funded by the National Key Research and Development Program of China (Grant No. 2016YFC0502700) and the National Social Science Major Foundation of China (Grant No. 14ZDB140).

Institutional Review Board Statement

Not applicable.

Informed Consent Statement

Not applicable.

Data Availability Statement

The data presented in this study are available on request from the corresponding author. The data are not publicly available due to restrictions on right of privacy.

Conflicts of Interest

The authors declare no conflict of interest.

References

  1. Galloway, J.N.; Dentener, F.J.; Capone, D.G.; Boyer, E.W.; Howarth, R.W.; Seitzinger, S.P.; Asner, G.P.; Cleveland, C.C.; Green, P.A.; Holland, E.A.; et al. Nitrogen Cycles: Past, Present, and Future. Biogeochemistry 2004, 70, 153–226. [Google Scholar] [CrossRef]
  2. Galloway, J.N.; Leach, A.M.; Bleeker, A.; Erisman, J.W. A chronology of human understanding of the nitrogen cycle. Philos. Trans. R. Soc. Lond. B Biol. Sci. 2013, 368, 20130120. [Google Scholar] [CrossRef] [Green Version]
  3. Fowler, D.; Coyle, M.; Skiba, U.; Sutton, M.A.; Cape, J.N.; Reis, S.; Sheppard, L.J.; Jenkins, A.; Grizzetti, B.; Galloway, J.N.; et al. The global nitrogen cycle in the twenty-first century. Philos. Trans. R. Soc. Lond. B Biol. Sci. 2013, 368, 20130164. [Google Scholar] [CrossRef]
  4. Erisman, J.W.; Galloway, J.N.; Seitzinger, S.; Bleeker, A.; Dise, N.B.; Petrescu, A.M.; Leach, A.M.; de Vries, W. Consequences of human modification of the global nitrogen cycle. Philos. Trans. R. Soc. Lond. B Biol. Sci. 2013, 368, 20130116. [Google Scholar] [CrossRef] [Green Version]
  5. Gao, B.; Huang, Y.; Huang, W.; Shi, Y.; Bai, X.; Cui, S. Driving forces and impacts of food system nitrogen flows in China, 1990 to 2012. Sci. Total Environ. 2018, 610, 430–441. [Google Scholar] [CrossRef] [PubMed]
  6. Zhang, W.; Li, X.; Swaney, D.P.; Du, X. Does food demand and rapid urbanization growth accelerate regional nitrogen inputs? J. Clean. Prod. 2016, 112, 1401–1409. [Google Scholar] [CrossRef]
  7. Isbell, F.; Reich, P.B.; Tilman, D.; Hobbie, S.E.; Polasky, S.; Binder, S. Nutrient enrichment, biodiversity loss, and consequent declines in ecosystem productivity. Proc. Natl. Acad. Sci. USA 2013, 110, 11911–11916. [Google Scholar] [CrossRef] [Green Version]
  8. Rockström, J.; Steffen, W.; Noone, K.; Persson, Å.; Chapin, F.S.; Lambin, E.F.; Lenton, T.M.; Scheffer, M.; Folke, C.; Schellnhuber, H.J.; et al. A safe operating space for humanity. Nature 2009, 461, 472–475. [Google Scholar] [CrossRef]
  9. Kaushal, S.S.; Groffman, P.M.; Band, L.; Elliott, E.M.; Shields, C.A.; Kendall, C. Tracking nonpoint source nitrogen pollution in human-impacted watersheds. Environ. Sci. Technol. 2011, 45, 8225–8232. [Google Scholar] [CrossRef] [PubMed]
  10. Galloway, J.N.; Townsend, A.R.; Erisman, J.W.; Bekunda, M.; Cai, Z.; Freney, J.R.; Martinelli, L.A.; Seitzinger, S.P.; Sutton, M.A. Transformation of the Nitrogen Cycle: Recent Trends, Questions, and Potential Solutions. Science 2008, 320, 889–892. [Google Scholar] [CrossRef] [PubMed] [Green Version]
  11. Billen, G.; Garnier, J.; Lassaletta, L. The nitrogen cascade from agricultural soils to the sea: Modelling nitrogen transfers at regional watershed and global scales. Philos. Trans. R. Soc. Lond. B Biol. Sci. 2013, 368, 20130123. [Google Scholar] [CrossRef] [PubMed]
  12. Hong, B.; Swaney, D.P.; Howarth, R.W. Estimating net anthropogenic nitrogen inputs to U.S. watersheds: Comparison of methodologies. Environ. Sci. Technol. 2013, 47, 5199–5207. [Google Scholar] [CrossRef] [PubMed]
  13. Howarth, R.; Swaney, D.; Billen, G.; Garnier, J.; Hong, B.; Humborg, C.; Johnes, P.; Mörth, C.-M.; Marino, R. Nitrogen fluxes from the landscape are controlled by net anthropogenic nitrogen inputs and by climate. Front. Ecol. Environ. 2012, 10, 37–43. [Google Scholar] [CrossRef] [Green Version]
  14. Gao, W.; Howarth, R.W.; Swaney, D.P.; Hong, B.; Guo, H.C. Enhanced N input to Lake Dianchi Basin from 1980 to 2010: Drivers and consequences. Sci. Total Environ. 2015, 505, 376–384. [Google Scholar] [CrossRef]
  15. Zhang, W.; Swaney, D.P.; Hong, B.; Howarth, R.W.; Li, X. Influence of rapid rural-urban population migration on riverine nitrogen pollution: Perspective from ammonia-nitrogen. Environ. Sci. Pollut. Res. Int. 2017, 24, 27201–27214. [Google Scholar] [CrossRef]
  16. Gao, W.; Swaney, D.P.; Hong, B.; Howarth, R.W.; Liu, Y.; Guo, H. Evaluating anthropogenic N inputs to diverse lake basins: A case study of three Chinese lakes. Ambio 2015, 44, 635–646. [Google Scholar] [CrossRef] [Green Version]
  17. McIsaac, G.F.; David, M.B.; Gertner, G.Z.; Goolsby, D.A. Nitrate flux in the Mississippi River. Nature 2001, 414, 166–167. [Google Scholar] [CrossRef]
  18. Huang, J.C.; Lee, T.Y.; Lin, T.C.; Hein, T.; Lee, L.C.; Shih, Y.T.; Kao, S.J.; Shiah, F.K.; Lin, N.H. Effects of different N sources on riverine DIN export and retention in a subtropical high-standing island, Taiwan. Biogeosciences 2016, 13, 1787. [Google Scholar] [CrossRef] [Green Version]
  19. Zhang, B.-F.; Chen, D.-J. Dynamic response of riverine nitrate flux to net anthropogenic nitrogen inputs in a typical river in Zhejiang Province over the 1980–2010 period. Environ. ENCE 2014, 35, 2911–2919. [Google Scholar]
  20. Zhang, W.; Li, X.-Y.; Su, J.-J. Responses of riverine nitrogen export to net anthropogenic nitrogen inputs: A review. Chin. J. Appl. Ecol. 2014, 25, 272–278. [Google Scholar]
  21. Zhang, W.; Li, X.-Y.; Su, J.-J. Response of Riverine Nitrogen Export to Net Anthropogenic Nitrogen Inputs. J. Subtrop. Resour. Environ. 2019, 14, 47–53. [Google Scholar]
  22. Zhang, X.; Yi, Y.; Yang, Z. Nitrogen and phosphorus retention budgets of a semiarid plain basin under different human activity intensity. Sci. Total Environ. 2020, 703, 134813. [Google Scholar] [CrossRef]
  23. Huishu, L.; Qiuliang, L.; Xinyu, Z.; Haw, Y.; Hongyuan, W.; Limei, Z.; Hongbin, L.; Huang, J.C.; Tianzhi, R.; Jiaogen, Z.; et al. Effects of anthropogenic activities on long-term changes of nitrogen budget in a plain river network region: A case study in the Taihu Basin. Sci. Total Environ. 2018, 645, 1212–1220. [Google Scholar] [CrossRef] [PubMed]
  24. Zhang, W.; Li, H.; Li, Y. Spatio-temporal dynamics of nitrogen and phosphorus input budgets in a global hotspot of anthropogenic inputs. Sci. Total Environ. 2019, 656, 1108–1120. [Google Scholar] [CrossRef] [PubMed]
  25. Howarth, R.W.; Billen, G.; Swaney, D.; Townsend, A.; Jaworski, N.; Lajtha, K.; Downing, J.A.; Elmgren, R.; Caraco, N.; Jordan, T.; et al. Regional nitrogen budgets and riverine N & P fluxes for the drainages to the North Atlantic Ocean: Natural and human influences. Biogeochemistry 1996, 35, 75–139. [Google Scholar]
  26. Hong, B.; Swaney, D.P.; Howarth, R.W. A toolbox for calculating net anthropogenic nitrogen inputs (NANI). Environ. Model. Softw. 2011, 26, 623–633. [Google Scholar] [CrossRef]
  27. Swaney, D.P.; Howarth, R.W.; Hong, B. Nitrogen use efficiency and crop production: Patterns of regional variation in the United States, 1987–2012. Sci. Total Environ. 2018, 635, 498–511. [Google Scholar] [CrossRef]
  28. Zhang, W.S.; Swaney, D.P.; Li, X.Y.; Hong, B.; Howarth, R.W.; Ding, S.H. Anthropogenic point-source and non-point-source nitrogen inputs into Huai River basin and their impacts on riverine ammonia–nitrogen flux. Biogeosciences 2015, 12, 4275–4289. [Google Scholar] [CrossRef] [Green Version]
  29. Gao, W.; Howarth, R.W.; Hong, B.; Swaney, D.P.; Guo, H.C. Estimating net anthropogenic nitrogen inputs (NANI) in the Lake Dianchi basin of China. Biogeosciences 2014, 11, 4577–4586. [Google Scholar] [CrossRef] [Green Version]
  30. Chen, Y.; Gao, W.; Wang, D.; Liu, Y.; Wu, Y.; Guo, H. Net anthropogenic nitrogen inputs (NANI) and riverine response in water shortage region: A case study of Haihe River watershed. Acta Sci. Circumstantiae 2016, 36, 3600–3606. [Google Scholar]
  31. Gao, W.; Gao, B.; Yan, C.; Liu, Y. Evolution of anthropogenic nitrogen and phosphorus inputs to Lake Poyang Basin and its’ effect on water quality of lake. Acta Sci. Circumstantiae 2016, 36, 3137–3145. [Google Scholar]
  32. Boyer, E.W.; Goodale, C.L.; Jaworski, N.A.; Howarth, R.W. Anthropogenic nitrogen sources and relationships to riverine nitrogen export in the northeastern U.S.A. Biogeochemistry 2002, 57, 137–169. [Google Scholar] [CrossRef]
  33. Shrestha, S.; Kazama, F.; Newham, L.T.H. A framework for estimating pollutant export coefficients from long-term in-stream water quality monitoring data. Environ. Model. Softw. 2007, 23, 182–194. [Google Scholar] [CrossRef]
  34. Young, R.A.; Onstad, C.A.; Bosch, D.D.; Anderson, W.P. AGNPS: A nonpoint-source pollution model for evaluating agricultural watersheds. J. Soil Water Conserv. 1989, 44, 168–173. [Google Scholar]
  35. Johnes, P.J. Evaluation and management of the impact of land use change on the nitrogen and phosphorus load delivered to surface waters: The export coefficient modelling approach. J. Hydrol. 1996, 183, 323–349. [Google Scholar] [CrossRef]
  36. Shih, Y.T.; Lee, T.Y.; Huang, J.C.; Kao, S.J. Apportioning riverine DIN load to export coefficients of land uses in an urbanized watershed. Sci. Total Environ. 2016, 560, 1–11. [Google Scholar] [CrossRef] [PubMed]
  37. Worrall, F.; Burt, T.P.; Howden, N.J.K.; Whelan, M.J. The fluvial flux of nitrate from the UK terrestrial biosphere—An estimate of national-scale in-stream nitrate loss using an export coefficient model. J. Hydrol. 2011, 414, 31–39. [Google Scholar] [CrossRef]
  38. Lu, J.; Gong, D.; Shen, Y.; Liu, M.; Chen, D. An inversed Bayesian modeling approach for estimating nitrogen export coefficients and uncertainty assessment in an agricultural watershed in eastern China. Agric. Water Manag. 2013, 116, 79–88. [Google Scholar] [CrossRef]
  39. Zhu, J.; Ding, N.; Li, D.; Sun, W.; Xie, Y.; Wang, X. Spatiotemporal Analysis of the Nonlinear Negative Relationship between Urbanization and Habitat Quality in Metropolitan Areas. Sustainability 2020, 12, 669. [Google Scholar] [CrossRef] [Green Version]
  40. Qin, B.; Xu, P.; Wu, Q.; Luo, L.; Zhang, Y. Environmental issues of Lake Taihu, China. Hydrobiologia 2007, 581, 3–14. [Google Scholar] [CrossRef]
  41. Han, H.; Allan, J.D. Estimation of nitrogen inputs to catchments: Comparison of methods and consequences for riverine export prediction. Biogeochemistry 2008, 91, 177–199. [Google Scholar] [CrossRef]
  42. Yanlong, J.; Qiufeng, W.; Jianxing, Z.; Zhi, C.; Nianpeng, H.; Guirui, Y. A spatial and temporal dataset of atmospheric inorganic nitrogen wet deposition in China (1996–2015). China Sci. Data 2019, 4. [Google Scholar] [CrossRef]
  43. Parfitt, R.L.; Stevenson, B.A.; Dymond, J.R.; Schipper, L.A.; Baisden, W.T.; Ballantine, D.J. Nitrogen inputs and outputs for New Zealand from 1990 to 2010 at national and regional scales. N. Z. J. Agric. Res. 2012, 55, 241–262. [Google Scholar] [CrossRef]
  44. Ti, C.; Pan, J.; Xia, Y.; Yan, X. A nitrogen budget of mainland China with spatial and temporal variation. Biogeochemistry 2011, 108, 381–394. [Google Scholar] [CrossRef]
  45. Han, Y.; Fan, Y.; Yang, P.; Wang, X.; Wang, Y.; Tian, J.; Xu, L.; Wang, C. Net anthropogenic nitrogen inputs (NANI) index application in Mainland China. Geoderma 2014, 213, 87–94. [Google Scholar] [CrossRef]
  46. Wang, A.; Tang, L.; Yang, D.; Lei, H. Spatio-temporal variation of net anthropogenic nitrogen inputs in the upper Yangtze River basin from 1990 to 2012. Sci. China Earth Sci. 2016, 59, 2189–2201. [Google Scholar] [CrossRef]
  47. Pan, J.; Ding, N.; Yang, J. Changes of urban nitrogen metabolism in the Beijing megacity of China, 2000–2016. Sci. Total Environ. 2019, 666, 1048–1057. [Google Scholar] [CrossRef]
  48. Li, Y.; Liu, H.-B.; Lei, Q.-L.; Hu, W.-L.; Wang, H.-Y.; Zhai, L.-M.; Ren, T.-Z.; Lian, H.-S. Impact of Human Activities on Net Anthropogenic Nitrogen Inputs (NANI) at Township Scale in Erhai Lake Basin. Environ. ENCE 2018, 39, 4189–4198. [Google Scholar]
  49. Han, H.; Bosch, N.; Allan, J.D. Spatial and temporal variation in phosphorus budgets for 24 watersheds in the Lake Erie and Lake Michigan basins. Biogeochemistry 2011, 102, 45–58. [Google Scholar] [CrossRef]
  50. Huang, H.; Chen, D.; Zhang, B.; Zeng, L.; Dahlgren, R.A. Modeling and forecasting riverine dissolved inorganic nitrogen export using anthropogenic nitrogen inputs, hydroclimate, and land-use change. J. Hydrol. 2014, 517, 95–104. [Google Scholar] [CrossRef] [Green Version]
  51. Mengru, W.; Lin, M.; Maryna, S.; Wenqi, M.; Xuejun, L.; Carolien, K. Hotspots for Nitrogen and Phosphorus Losses from Food Production in China: A County-Scale Analysis. Environ. Sci. Technol. 2018, 52, 5782–5791. [Google Scholar]
  52. Swaney, D.P.; Hong, B.; Ti, C.; Howarth, R.W.; Humborg, C. Net anthropogenic nitrogen inputs to watersheds and riverine N export to coastal waters: A brief overview. Curr. Opin. Environ. Sustain. 2012, 4, 203–211. [Google Scholar] [CrossRef]
Figure 1. The boundaries of the Yangtze River Delta Urban Agglomeration (YRDUA), which was used in constructing N budgets.
Sustainability 13 02006 g001
Figure 2. Framework for the calculation of N budgets.
Sustainability 13 02006 g002
Figure 3. Human activity index system. PED = population and economic development, LUP = land use pattern, and IS = industrial structure.
Sustainability 13 02006 g003
Figure 4. Box diagram of the temporal variation of each component of the NANI over 26 cities in the YRDUA from 2000 to 2015. (a) Food and feed N import; (b) Fertilizer N application; (c) Biological N fixation; (d) Atmosphere N deposition; (e) Domestic N; (f) Industrial N. We applied a factor of 10 for certain input terms ((cf) in the figure) to match their values to the scale of the Y-axis.
Sustainability 13 02006 g004
Figure 5. Variation rates of N input sources during 2000–2005, 2005–2010, and 2010–2015. Nim = Net food and feed N import, Nfer = Fertilizer N application, Nfix = Biological N fixation, Ndep = Atmosphere N deposition, Nurban = Urban N discharge, and Nind = Industrial N discharge.
Sustainability 13 02006 g005
Figure 6. The characteristics of the main compositions of N exports in the YRDUA during 2000–2015.
Sustainability 13 02006 g006
Figure 7. Area-averaged N budgets in the YRDUA during the period of 2000–2015.
Sustainability 13 02006 g007
Figure 8. The dynamic spatial distribution of the N budgets in the YRDUA from 2000 to 2015. Unit: kg   N   km 2   a 1 .
Sustainability 13 02006 g008
Figure 9. The relationships between human activity indexes and the NANI, N Export, NANIp, and NANIn over the study period. GDP = Gross Domestic Product; PD = Population Density; UR = Urbanization Rate; PCL = Percentage of Construction Land; PEL = Percentage of Forest Land; PAL = Percentage of Agricultural Land; PPI = Proportion of Primary Industry; PSI = Proportion of Secondary Industry; PTI = Proportion of Tertiary Industry.
Sustainability 13 02006 g009
Figure 10. Relationships between the (a) NANI, (b) NANIn, (c) NANIp, and N exports in 2000–2015.
Sustainability 13 02006 g010
Figure 11. Characteristics of the NANIn in different basins and regions around the world.
Sustainability 13 02006 g011
Table 1. The net anthropogenic nitrogen inputs (NANI) in the YRDUA from 2000 to 2015 (unit:   kg   N   km 2   a 1 ).
YearNANINANInProportion of NANInNANIpProportion of NANIp
200018,766.7916,944.5290.29%1822.279.71%
200518,355.6516,466.2789.71%1889.3910.29%
201017,094.4015,286.7589.43%1807.6510.57%
201516,798.0815,119.4990.01%1678.599.99%
Publisher’s Note: MDPI stays neutral with regard to jurisdictional claims in published maps and institutional affiliations.

