Article

Relationship between Land Property Security and Brazilian Amazon Deforestation in the Mato Grosso State during the Period 2013–2018

by
Daniella Tiemi Sasaki Okida
1,
Osmar Abílio de Carvalho Júnior
1,*,
Osmar Luiz Ferreira de Carvalho
2,
Roberto Arnaldo Trancoso Gomes
1 and
Renato Fontes Guimarães
1
1
Department of Geography, University of Brasília, Brasília 70910-900, Brazil
2
Department of Computer Science, University of Brasília, Brasília 70910-900, Brazil
*
Author to whom correspondence should be addressed.
Sustainability 2021, 13(4), 2085; https://doi.org/10.3390/su13042085
Submission received: 17 November 2020 / Revised: 4 February 2021 / Accepted: 8 February 2021 / Published: 15 February 2021

Abstract

:
This research examines the relations between forest decrease and legal property security in Mato Grosso State, Brazil. The study area encompasses 133,090.4 km2 of the Amazonian biome, belonging to the Brazilian Legal Amazon, located at the arc of deforestation where agriculture and cattle ranching compete with the native vegetation cover. Cadastral monitoring and certification of productive land plots are Brazil’s public policies to implement to tackle these environmental challenges. In this context, we crossed the Land Management System (SIGEF) dataset launched in 2013 from the National Institute for Agrarian Reform and the Amazon Deforestation Monitoring Program (PRODES) dataset from the Brazilian National Institute of Space Research (INPE). The analysis considered the 2013–2018 period with public and private land plots and evaluated the differences in smallholders and large landowners’ deforesting behavior. The results demonstrate that the primacy of certified properties was in private land (94%), with a small portion of the public land (6%). Most properties have <80% forest coverage on certification, corresponding to 85% on private properties and 95% on public properties. This fact is important because environmental legislation in the Amazon region establishes a legal reserve of 80% in forest areas. The results show that the smaller the property, the greater the percentage of proportional deforestation in the certification. In the biennium, considering before and after certification, a proportion of 8% of private properties and 28% of public properties with vegetation cover had deforestation. The results demonstrate the tendency for smaller properties to deforest proportionally more than larger ones. The annual difference series in properties registered in 2015 demonstrates that the highest deforestation occurrence was in the year of certification in private properties and the subsequent year in public properties. The SIGEF system is relatively new, requiring more time to establish a consolidated trend. The combination of property rights and effective compliance with environmental legislation allows the conservation of the forest. However, it is essential to improve inspection. Land ownership inserts the owner into a system of rules to properly use natural resources, constituting a legal instrument to guide human action.

1. Introduction

Land tenure rules define how property rights to land should be allocated within societies and are an essential part of social, political, and economic structures [1]. According to Demsetz [2], property rights influence land-use choices and practices; for example, the owner of a private right focuses his acts on future benefits and costs opportunities. On the other hand, public land would tend to suffer from hunting and overwork in a short period because no one would privately own the land. Like the idea “no one washes a rental car” attributed to many authors, landowners treat their properties (in terms of improving soil against erosion) more responsibly than tenant farmers [3]. Land ownership is related to welfare [4] and deforestation rates [5,6]. Goldstein et al. [7] evidence that investments affect increased tenure security in the early stages of formalizing land ownership in Benin, West Africa. In Ethiopia, land security/property rights are the most significant factors in farmers’ decision to invest in reforestation [8].
Land tenure insecurity problems in Brazil is a challenge for public policies in both urban [9] and rural environments [10,11], worsening in the Brazilian Legal Amazon because of territorial extension. The definition of Brazilian Legal Amazon was by the law of 1953, with 5,020,000 km2 under the legislation of the Superintendence of the Economic Valorization Plan of Amazon (SPVEA) aimed to promote sustainable development of the Amazon region through the integration of the regional economy. In 1966, the government extinguished SPVEA and created the Superintendence of the Amazon Development (SUDAM) of the Regional Development Ministry. One of the current challenges in the Brazilian Legal Amazon is to balance the expanding agricultural frontier with property rights and forest preservation [12,13].
The Brazilian federal government became responsible for land management by creating the National Institute for Colonization and Agrarian Reform (INCRA) in 1970. The growth of deforestation in 2008, after its reduction in the period 2004–2007, encouraged the federal government to create the Legal Lands Program (Law no. 11,952 of 25 June 2009) to streamline the process of land tenure regularization in the Legal Amazon. The Terra Legal Program was the leading national regulatory mechanism for land use in the Amazon rainforest, representing the transfer of INCRA’s regularization obligations to the Ministry of Agrarian Development (MDA). The Terra Legal Program was responsible for georeferencing properties, registration of occupants, procedural analysis, and verification of conformities, concluding in ownership or rejection. During the Michel Temer government, the program expanded to the entire Brazilian territory. However, the Terra Legal Program’s extinction occurred with Provisional Measure 870 of 01 2019, returning the land assignments to INCRA.
In this context, INCRA and MDA developed a web-based tool called the Land Management System (SIGEF), which came into operation on 23 November 2013, to subsidize land governance in the national territory. The SIGEF system manages information on Brazilian rural properties, receiving, validating, and organizing the data. Therefore, this system controls land regularization processes and provides the georeferenced boundaries of certified properties [14]. In the Brazilian Legal Amazon, smallholder farmers and large landowners impact land use differently, and the relationship changes continually with economic and demographic pressures. Large landholders are more sensitive to economic changes (interest rates, financial returns, government subsidies, agricultural credit, inflation rate, and land prices) [15]. Several studies assess the direct relationship between forest deforestation and land property security [16,17,18] and deforestation rates over time to analyze certified properties’ effectiveness [19,20]. These approaches consider the forest to be homogeneous, located in rural areas, and with individual ownership.
Sant’Anna [21] shows that deforestation in the Amazon is related to land inequality and land occupation in Brazil. The revised Brazilian Forest Code (Law no. 12,651 of 25 May 2012) established a series of changes concerning the protection of forests and the flexibilization of the ruling over deforesting farmers, including the amnesty for illegal deforestation in private properties before 2008 [22,23,24]. Besides, the current Forest Code supports the agricultural development in already deforested areas, protecting native vegetation through legal reserves, areas of permanent protection, and compulsory rural environmental registry (CAR) [12,25,26,27]. The convergence of land legalization and environmental law enforcement is the best chance to achieve zero deforestation [28].
This research aimed to analyze the dynamics of the Land Regularization System (SIGEF) with the deforestation rate monitored by the Amazon Deforestation Monitoring Project (PRODES) from 2013 to 2017 within the Amazon biome in the Mato Grosso State. Therefore, the study assesses the influence of certification in the deforesting behavior within the properties.

2. Materials and Methods
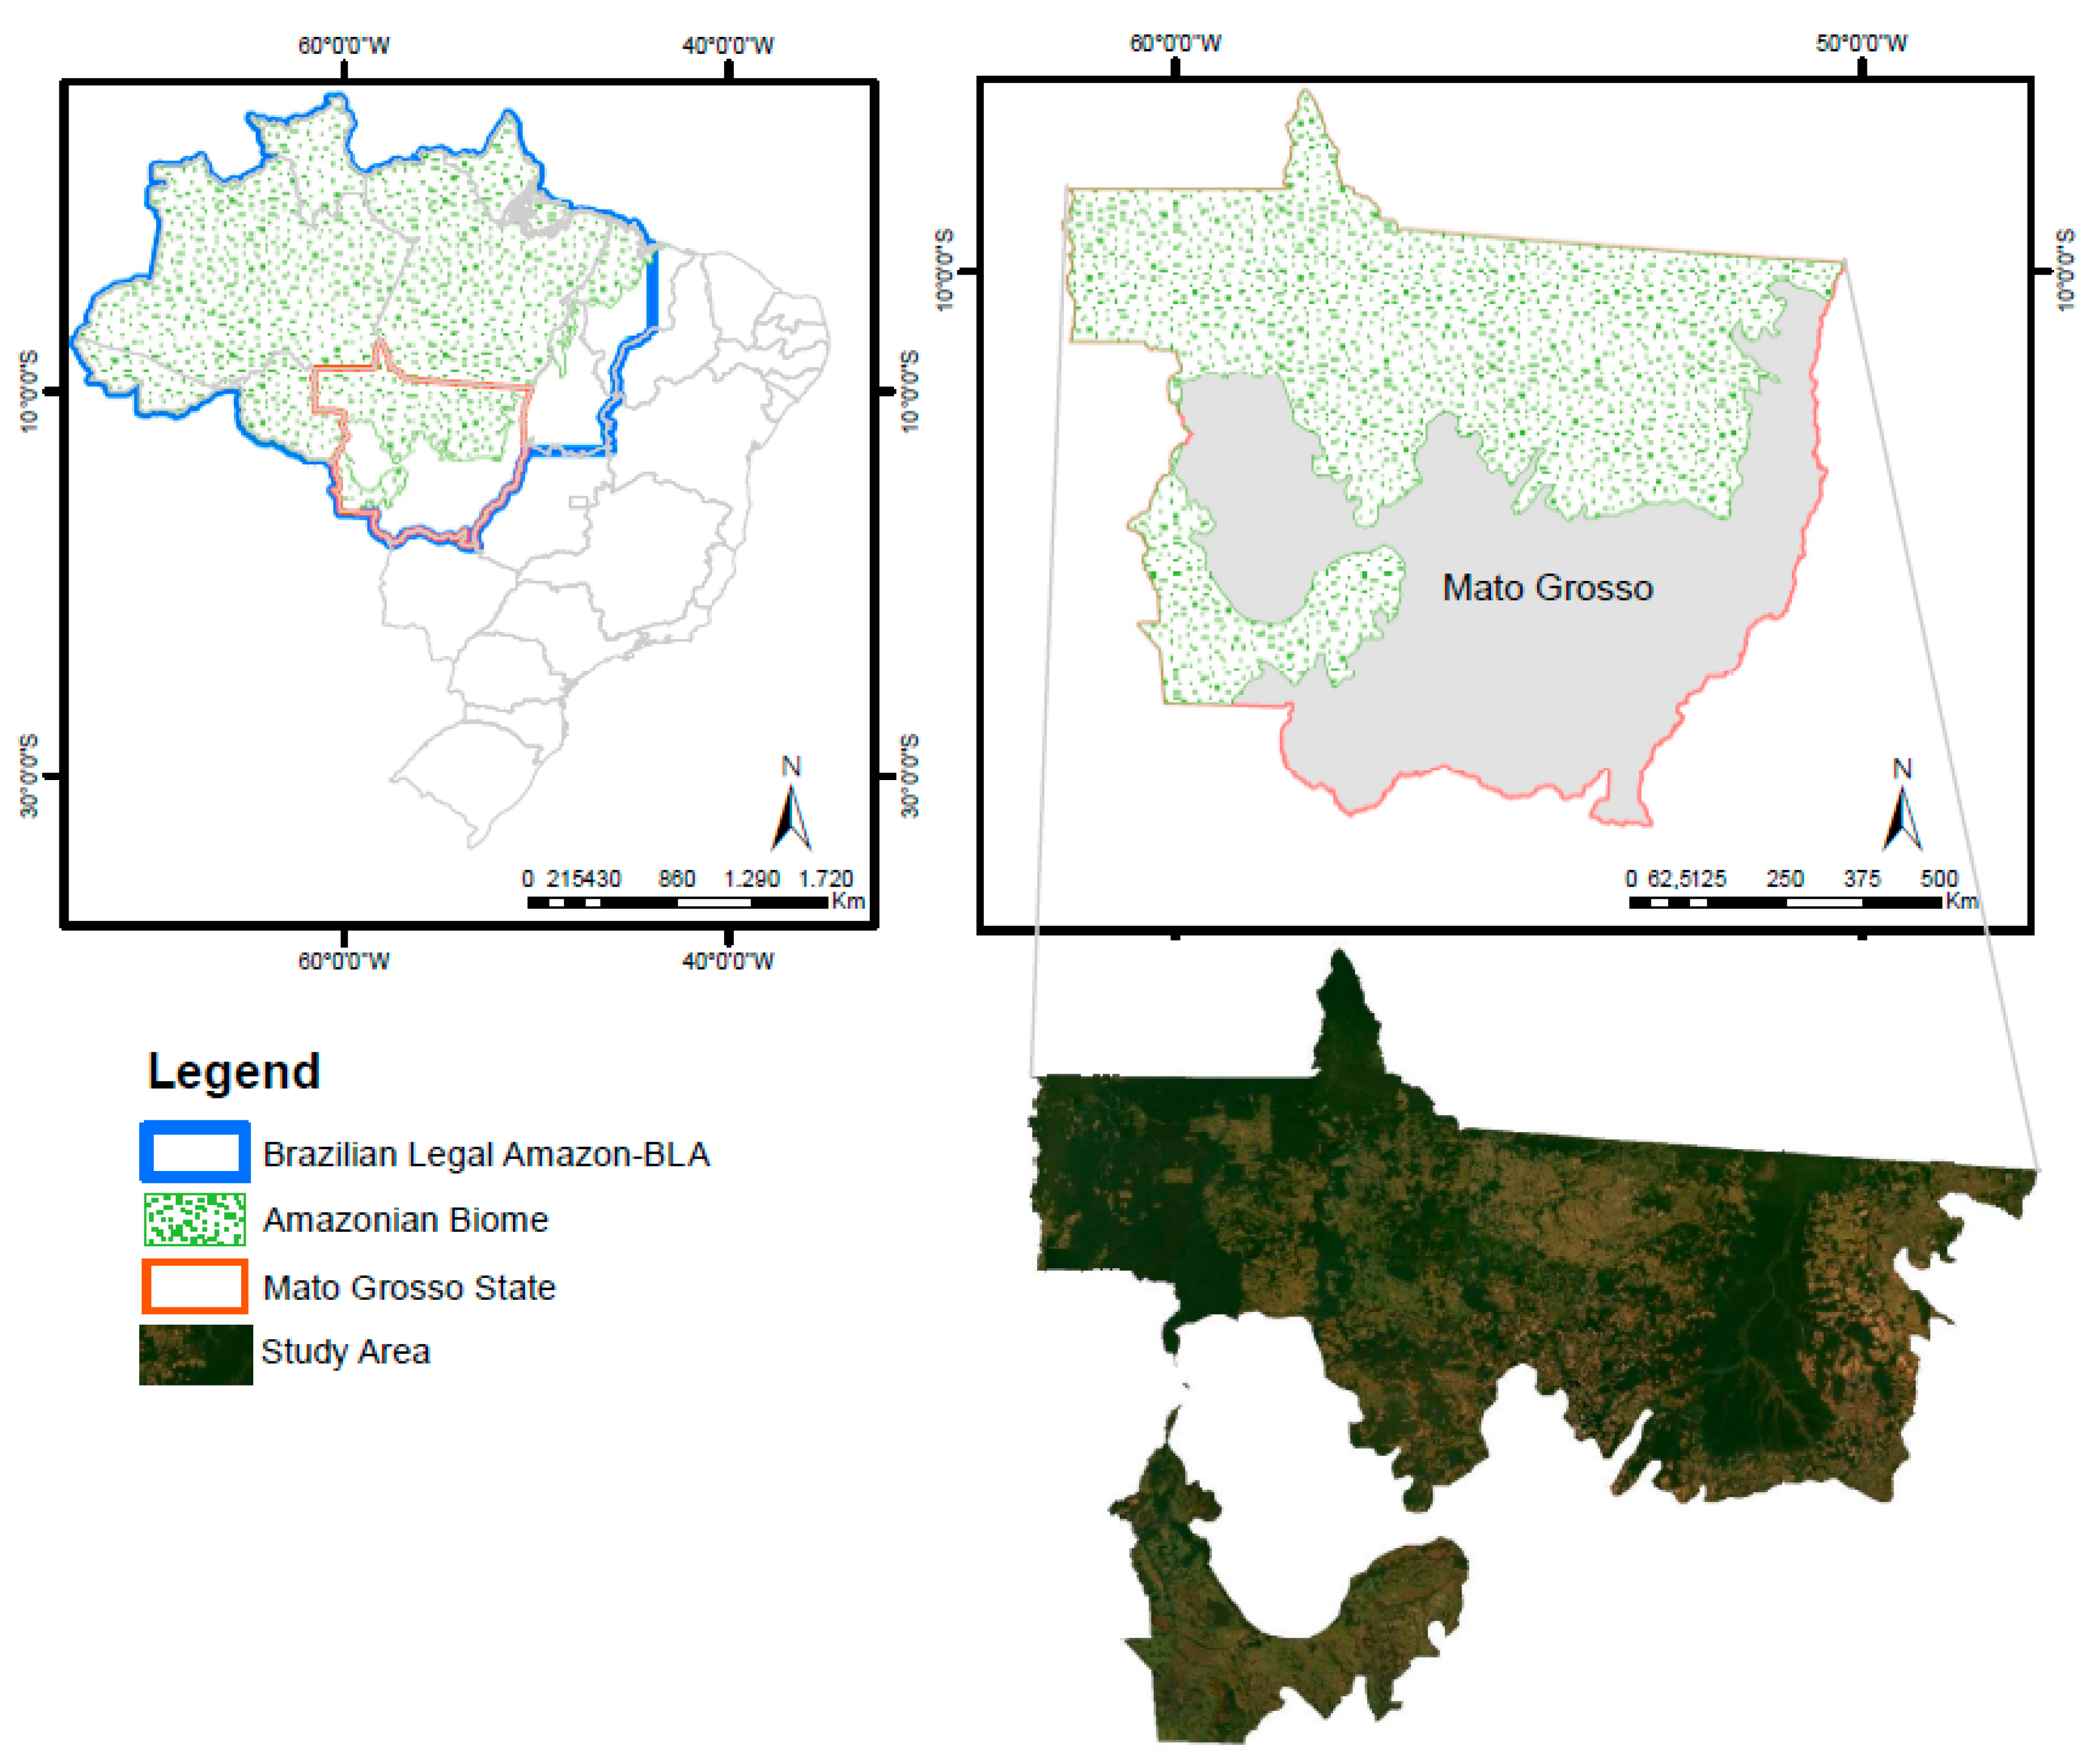
2.1. Study Area

Mato Grosso State has an area of 903,202 km2 [29] and is in the southern Brazilian Legal Amazon within the “Arc of Deforestation,” where the expansion of agriculture and cattle ranching occurs [15,24,30]. The estimated population of the state is 3,035,122 people with a population density of 3.36 (people per km2), according to the latest census [31]. This state has 141 municipalities and harbors springs and rivers from three river basins: (1) Upper Paraguay, (2) Araguaia-Tocantins, and (3) Amazon. The Mato Grosso contains three biomes: (1) Amazon, (2) Cerrado (Brazilian Savannah), and (3) Pantanal (Wetlands). The study area corresponds to the Amazon rainforest areas within the Mato Grosso, covering a total area of 483,469 km2 (Figure 1).
Mato Grosso State has the largest large farms, with over 75% of the agricultural and livestock areas maintained on farms larger than 1000 ha [32]. In 1998–2017, the Mato Grosso State deforested about 142,967 km2 (Figure 2), corresponding to 33.3% of all deforestation in the Brazilian Amazon [33,34]. The deforestation rates reached a maximum peak in 2004. The launch of the Near-Real-Time Deforestation Detection System (DETER) in the Brazilian Amazon led to a reduction in rates. Therefore, between 2004 and 2007, a significant deforestation decrease occurred, attributed to the application of public policy enforcement, monitoring systems, and supply chain interventions, delaying the advance of the agricultural frontier [35]. In 2009, the National Institute for Agrarian Reform (INCRA) coordinated a land regularization program in the Legal Amazon called the Terra Legal Program, with the legal framework establishing Law no. 11.952/2009.
Cattle ranching, followed by soybean planting, was the main deforestation factor in Mato Grosso [36,37]. However, the public and private policies have reduced large-scale deforestation in the major soy-and-cattle frontiers of South America [38,39]. Therefore, Mato Grosso’s forest conservation reflects the state’s efforts to reduce the loss of its primary forest [22].

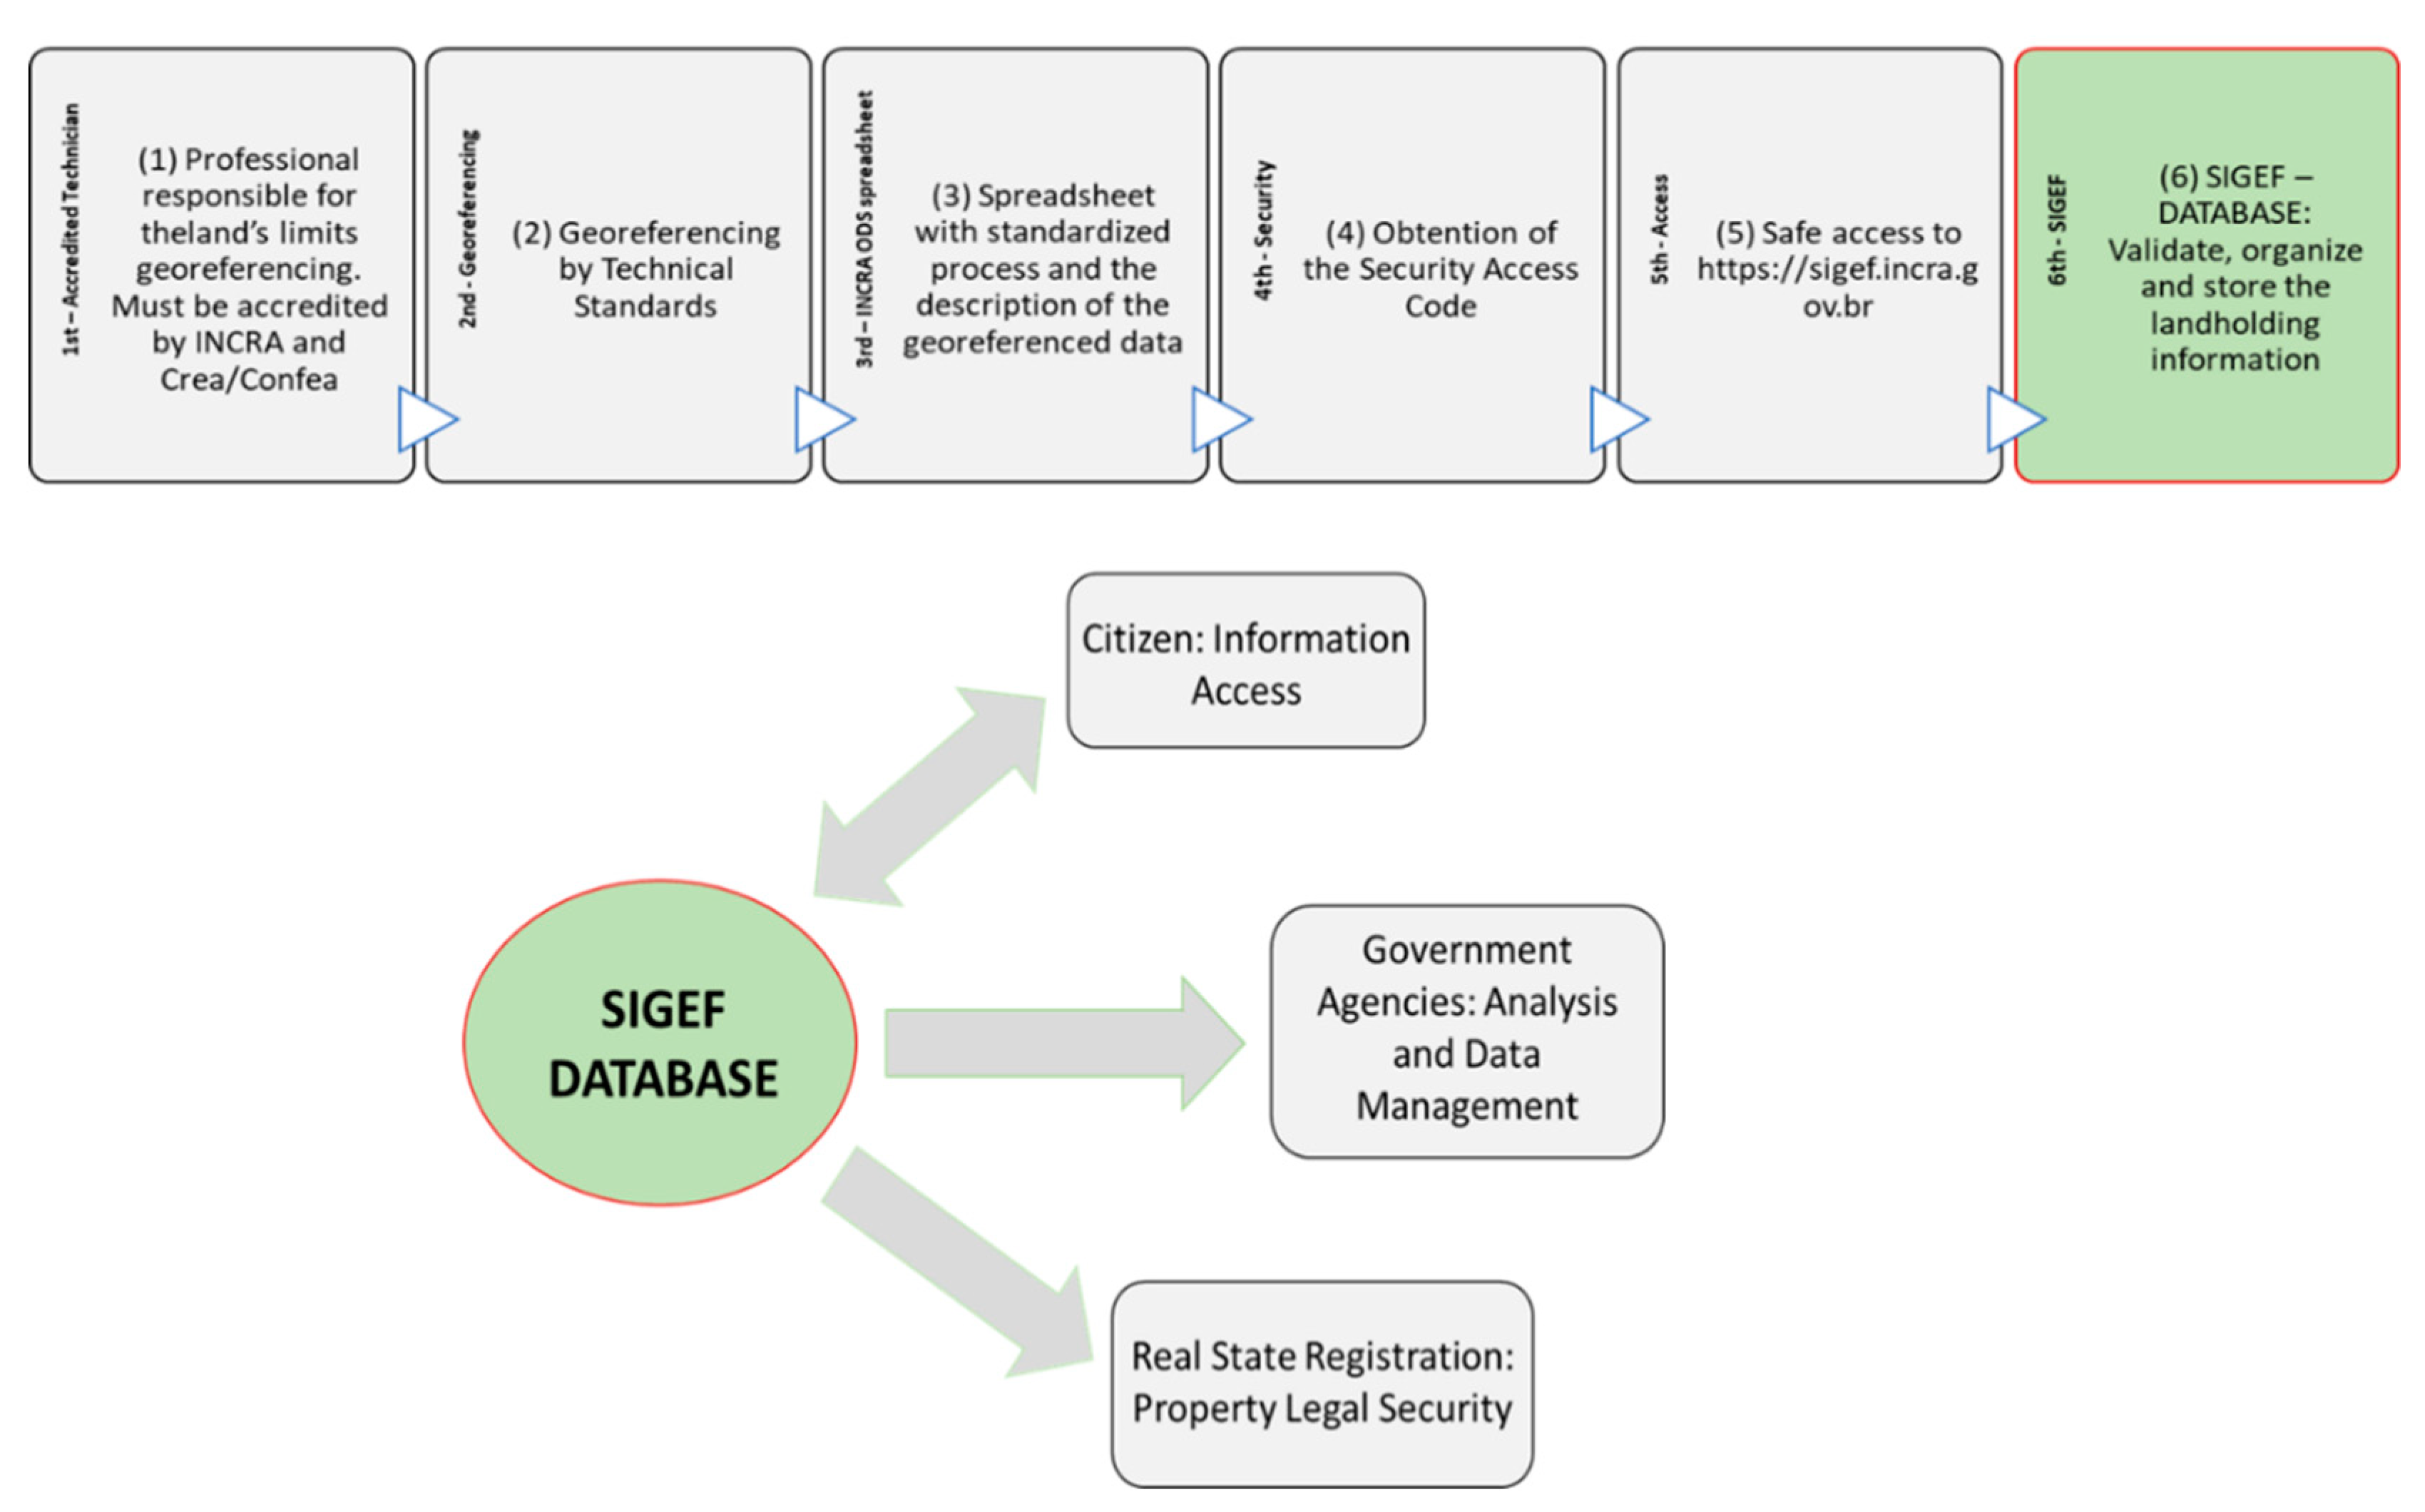
2.2. SIGEF and PRODES Database

In 2013, the INCRA introduced the SIGEF to process and validate land regularization protocols and publish georeferenced data on a web-based platform (Figure 3). The extinct Ministry for Agrarian Development coordinated the SIGEF project’s development with a partnership with INCRA, which contributed to the previously accumulated knowledge to the automated certification (e-Certifica). The SIGEF certifies the properties boundaries and manages georeferencing contracts within the public administration. SIGEF documents have digital signatures and certificates used in the registry, configuring an additional property legal security to the landowner. The rural land certification is an exclusive activity of the INCRA, ensuring property limits’ legal and technical requirements and eliminating overlaps. Management through the SIGEF system (Figure 3) englobes: (i) professional accreditation for rural certification; (ii) digital authentication within the platform; (iii) standardized georeferenced data; (iv) automatized validation of the information in compliance with the technical requirements; (v) automatized generation of technical documents; (vi) electronic management of rural plot of land requirement files; (vii) possibility of online updated information inclusion; (viii) georeferencing services and contract management with the public administration; (ix) open access to information about certified land plots and accreditation procedures. One of the advantages of the SIGEF is the automatic verification of the uploaded data for overlaps and technical requirements. If there is any issue regarding overlaps, the system does not proceed with the validation and land certification. The SIGEF database only has certified public and private properties, not considering collective ownerships, indigenous territories, or Quilombola lands (rural communities formed by descendants of enslaved Africans). Most private land in the Amazon does not have a registration certificate from INCRA, and only a small part is legal [40]. Furthermore, there is a significant percentage of public land unallocated and outside protected areas [40]. However, questions about what is public and private land in Brazil is still a topic under discussion, facilitating private advancement in the public domain and hindering a national land policy.
Since 1988, the PRODES has provided annual clear-cut deforestation data for every state of the Brazilian Legal Amazon. PRODES data production uses Landsat satellite imagery (30-meter resolution and 16-day revisitation), measuring increments higher than 6.25 ha and disregarding forest growth after deforestation [41]. This study used the class named Forest by PRODES, including the following vegetations: (i) Dense Ombrophylous Forest; (ii) Open Ombrophylous Forest; (iii) Seasonal Deciduous Forest; (iv) Alluvial Vegetation; (v) Campinarana; (vi) Ecological Tension Areas (forest/savanna) with a predominance of Forest Physiognomy. The high accuracy of PRODES data [41,42] allows its extensive use in social and natural surveys [5,43,44]. Therefore, these data had applications in the following programs: (i) agribusiness supply chain certification, for example, the soy moratorium; (ii) international agreements such as the UN Climate Change Conference in Paris (COP21); (iii) supporting information for financial aid through the Amazon Fund [45].

2.3. Data Processing

This research used the SIGEF data of certified rural plots during 2013–2018 of the Mato Grosso State, evaluating the following characteristics: public and private plots, land plot size, and certification year within the land regularization system. The land may originally be in the public or private domain. At the end of the certification process, the Federal Government transferred public lands to the private domain. Several studies have been carried out considering different size ranges, such as <100 ha, 100–250 ha, 250–1000 ha, 1000–5000 ha, and > 5000 ha [32]. In the present research, we established a subdivision of the size classes of the properties based on the logarithmic function in the base 10 of the area in square meters, considering nine intervals: <5.0, 5.0–5.5, 5.5–6.0, 6.0 –6.5, 6.5–7.0, 7.0–7.5, 7.5–8.0, 8.0–8.5, >8.5. This class subdivision facilitates statistical analysis. Besides, the methodology assesses the preservation condition of the area considering the following percentages of vegetation cover: <1% (land deforested), 1–20%, 20–40%, 40–80%, and 80–100% (land within environmental legislation). The research evaluated the number of properties and the rate of deforestation considering the two-year interval to establish standards of size and percentage of forest in the certification. An analysis of annual deforestation in the period (2012–2018) considered the properties from 2015, which represents half of the period to assess deforestation behavior.

3. Results

3.1. Property Certification Number on Land of Private and Public Origin

The number of properties registered on public and private land at SIGEF was very different over the studied period (Figure 4). The SIGEF has 16,677 (94%) private properties, while public properties had a significantly smaller amount with 1070 properties (6%) (Figure 5). Except for 2013, all other years had between 2600–3600 registered private properties. In contrast, property registrations on public lands concentrated in 2015, reaching only 906 properties. Figure 6 shows the distribution of the total area between private and public properties. In 2013–2018, the total area of private properties was 110,909.98 km2 (83.3%), while the total area of public properties was 22,180.41 km2 (16.6%). These differences between public and private properties demonstrated that the land certification strategy took place on private land with agricultural activities instead of government land. The average size of public properties was 20.7 km2, which is higher than that of private properties with 16.6 km2.

3.2. Private Property Certification Number per Year, Size, and Percentage of Forest

In the SIGEF system, there is a difference between certification and registration terms. Registered status has fully complied with the Public Registry requirements. However, the certified status already means that the land has been successfully identified and processing steps, and there is legal property security. Table 1 shows the evolution of the number of private properties in the SIGEF from 2013 to 2018, considering the property’s size. Except for the first year of the Terra Legal Project (2013), which had 181 registrations, each subsequent year had more than 2500 certifications. The 6.0–6.5 range has the largest number of certified properties in the entire period, with 4807 (28.8%) properties. The predominance of certified properties was between 5.5–7.5. Properties with sizes > 7.5 represent a small portion of the total with 525 (3.1%) properties. Properties < 5.5 also had a low representation with 2222 (13.3) properties. The proportion of the size property distribution remained little changed over time.
The forest reserve at the time of certification is an important factor in the analysis. According to the law, properties included in the Amazon biome can only deforest 20% of the area, except for consolidated deforestation before 22 June 2008. We consider the forest cover percentage before certification, since the owner can carry out deforestation during the certification year. Table 2 shows the number of private properties certified by SIGEF in the 2013–2018 period, considering their forest coverage in the previous year. The largest number of properties are fully deforested (<1%), reaching 5470 properties, i.e., one third of all properties (32.8%). The number of properties with <80% forest cover is 14,173 (85%), and only 2504 (15%) certainly have no environmental liability.
Table 3 lists the number of private properties in the study period, comparing the size and forest cover percentage one year before certification. Besides, each size class (along the line) shows the percentage of properties in the different forest cover. The percentage of properties without vegetation cover (<1%) is relatively higher in small properties. The reverse behavior occurred in large properties with a more significant number of farms with greater forest coverage. Along the lines of Table 3, the number of properties with smaller size ranges (<5, 5.0–5.5, 5.5–6.0, and 6.0–6.5) gradually decreases with the increasing percentage of forest cover, except for the range (80–100%). The inverted trend happens for larger properties (7.0–7.5, 7.5–8.0, and >8.0) that increase forest cover percentage.
Figure 7 shows the linear regression between the sizes and the percentage of the number of properties with forest cover between 80–100% within each size range. Linear regression has a coefficient of determination (R2) of 0.93, showing a tendency to increase forest cover percentage with increased properties. On the other hand, the linear regression between sizes and the percentage of deforested properties (<1%) within the size range decreases with increasing property, with an R2 of 0.94. The results show that the smallest owners have a proportionately higher deforested area than the largest owners.

3.3. Public Property Certification Number per Year, Size, and Percentage of Forest

The properties coming from public areas showed less data distribution in terms of time and size in the certification. Table 4 shows the evolution of the number of public properties in the SIGEF from 2014 to 2018, considering the property’s size. There is an intense concentration of data in 2015 (84.6%) and the size of the property between 5.5–6.0 log10 (m2) (82.6%). As expected, there is a greater standardization of the size of the lots in the certification of the Federal Government’s lands. The other sizes of properties, due to their lower representativeness, have more limitations for analysis.
Table 5 lists a higher concentration of properties in areas with low forest cover < 40% (76.6%). As with private land, most public properties have <80% forest cover in the certification of ownership, representing 95%. Therefore, a minimal number of properties complied with environmental legislation. Table 6 lists the relationship between size and vegetation cover in the previous year of certification. The primary analysis corresponds to the size of 5.5–6.0 log10 (m2) due to the concentration of most data. The percentage of properties of this size (third row in Table 6) shows a linear trend in decreasing properties’ size with an increase in forest cover (Figure 8).

3.4. Deforestation between the Year before and after the Certification

Table 7 lists the properties that had a loss of forest cover in 2 years, considering the year before and after the certification and eliminating all properties without vegetation cover (<1%) or that remained unchanged. The disregard for 2018 was due to the lack of 2019 forest cover in the analysis. The result showed that deforestation occurred in only 696 properties out of a total of 8625 (excluding properties certified in 2018 and properties without vegetation cover), which corresponds to a percentage of 8.0%. Therefore, the land acquisition did not trigger deforestation for the entire set of properties. Most of the properties that deforested already had <80% forest cover in the certification, totaling 530 properties (76%). The federal government must monitor and reprimand acts of infringement to curb illegal deforestation on legalized properties.
Table 8 lists the average of the proportional deforestation index (PDI), which demonstrates the relationship between the deforested area (DA) in the period with the forest cover of the property in the certification (FCP), represented by the following formulation [(DA/FCP) × 100]. PDIs demonstrate different behaviors between small and large owners. The PDI values for each range of vegetation cover across the properties’ sizes (line in Table 8) demonstrate a linear trend. Eliminating values with a low number of properties (<3), to suppress possible outliers, linear regressions of the number of properties and size demonstrate significant R2 values greater than 0.8 (Figure 9). Therefore, the proportional deforestation in two years is more significant the lower the property in the different proportions of forest cover in the certification. The straight slope is greater for an area with 0–20% forest cover (−31) and lower for areas with 80–100% (−11), showing a more significant effect of this relationship for areas with less forest coverage.

3.5. Deforestation after Two Years on Public Properties

Table 9 lists properties certified between 2014 and 2017 with deforestation events in the first two years. The number of deforested properties was 198, which represents 28% concerning the total of properties (705), disregarding the properties for the year 2018 (34) and without forest cover (<1%) in certification (331). Almost all deforested properties have <80% forest reserve in certification (96.5%). Comparatively, the proportional number of properties that deforested was higher in public than private ones. Table 10 lists the PDI average, showing that the highest values were in size range between 5.5–6.0 [log10 (m2)], regardless of the forest cover in the certification. However, the low number of properties in other size ranges makes comparison impossible.

3.6. Temporal Analysis of the Deforestation Rate for Certified Properties in 2015

The temporal assessment of annual deforestation on properties considered the year of certification in 2015, as it represents half the period studied, allowing us to assess the behavior before and after certification. Besides, the year 2015 concentrates most public properties. The analysis considered only the properties that had deforestation from 2012 to 2018, eliminating the areas without changes. This results in a higher average than considering all properties. The average value of the deforestation rate varies from 2.5 to 4% (Figure 10).
Private properties had the peak of deforestation in the year of certification of the properties. However, last year returned to the growth of deforestation. Public properties had slightly higher deforestation rates, approximately between 3 and 5% (Figure 10). The peak of deforestation occurred in the year following certification. The drop after the peak is more pronounced than the rise before the peak. However, the consistency of the trend of decreasing deforestation in private properties must be attested with the coming years’ advent. Therefore, the data show that the highest rate of deforestation occurred close to the certification event.

4. Discussion

Certification actions in Mato Grosso’s State occurred predominantly on private land, reaching 95% of the SIGEF data during 2013–2018. This proportion is much higher than the Brazilian territory, with 44.2% private, 36.1% public, and 16.6% without registration or unknown tenure [46]. Besides, the predominance of properties has <80% forest cover, with 85% in the private sector and 95% in the public sector. Therefore, the Terra Legal Program operated mainly in non-governmental lands and with significant deforestation.
The results demonstrate an evident relationship between the property’s size and the deforestation proportion in the certification. The smaller the property, the greater the percentage of deforested area. Deforestation after certification maintained this relationship with the property’s size. Other works developed in the Amazon confirm this behavior. Michalski et al. [47] consider that the property’s size is a critical factor in understanding deforestation and land-use change, noting that small properties retain a smaller forest proportion than large ones. Richards and VanWey [32] concluded in a study in the State of Mato Grosso that large private properties (>1000 ha) registered in the CAR database own almost 80% of forests and carbon reserves, while small landowners and public settlements of land reform retain a small proportion of forest. In the Cerrado biome, Stefanes et al. [48] concluded that larger properties had a more significant effect on biodiversity conservation than smaller owners. One explanation is that large farms have more area available for restoration than small farms, reinforcing the need for initiatives to support small producers who occupy a significant part of the Amazon [48,49].
The deforestation analysis in the accumulated two years showed that a small portion of private properties with forested areas presented deforestation (8%), while public properties impacted more proportionally (28%). To inhibit deforestation and promote environmental improvement, the Federal Government has enacted land regularization laws. The Rural Environmental Registry (CAR) was created by Law 12.651/2012, becoming a clause to obtain the definitive title in December 2016 with MP 759 converted into Law no. 13,465 in July 2017. The environmental registration requires the definition of the Permanent Preservation Areas (restricted use) and the Legal Reserve (remnants of forests). In the case of properties not suitable for environmental legislation, there will be a need to enroll in the Environmental Regularization Program (PRA) to recover, recompose, or regenerate environmental liabilities according to a commitment term. Failure to comply with the commitments entered will lead to the continuation of the criminal proceedings under the terms of art. 59, §4 and art. 60, § 2, of Law 12.651/2012. Before MP 759, regularization requirements did not require the CAR, but this does not exempt the owner from carrying it out according to environmental legislation. The formalization of the property registration allows the owner to be held responsible for environmental damages. Therefore, there is a joint effort of environmental commitment and property rights. According to several studies, property rights tend to affect land investments positively [50,51,52], soil conservation [53,54,55], technology adoption [56], and productivity [57,58]. This relationship between ownership and land-use practices occurs in various parts of the world [59,60,61], including in developed countries [62]. Fischer et al. [63] applied Linkert scores from various governance indicators with data obtained from 198 articles and 28 studies worldwide, concluding that areas with tenure/ownership generally produce positive effects for forest conservation. Therefore, the property right instituted by the state is not a simple transfer of land but allows the establishment of a system of rules that authorize or prohibit the use of a given resource, constituting a device to encourage or inhibit human action [45]. Furthermore, land property security guarantees political and social stability, reducing land conflicts.
The temporal behavior of certified properties in 2015, in the middle of the analyzed period, showed that the highest intensity of deforestation in the year of certification on private properties and the following year on public properties. However, private properties showed a slight upward trend in the past year. The causes of Amazon deforestation are complex and multidimensional, including economic, social, political, and environmental factors. Therefore, the results obtained must be evaluated with some care, as they have interference from other factors not included in the research. In the economic sphere, several factors have been reported, such as the development of road infrastructure that enables economic activity [64,65,66,67,68,69], livestock production, mainly beef cattle with the expansion of pastures [70,71,72,73], the increase in monocultures [74,75,76,77], and illegal logging [78,79,80,81,82]. In the political sphere, much research has assessed the effects of government actions on reducing deforestation in the Amazon [22,63,83,84,85] or industry-led initiatives, for example the soy moratorium [86,87,88,89]. In addition to land tenure insecurity, another set of social factors showed association with deforestation, such as population pressure [90,91,92], low income [93], and land conflicts [94,95,96,97].
Although the Brazilian Constitution [98] establishes that “the Union, the states, the Federal District and the municipalities, in common, have the power: VII—to preserve the forests, fauna, and flora,” and the laws are clear, our study shows that obedience is a challenge to overcome. The current law can combat illegal deforestation but faces significant difficulties resulting from economic viability for enforcement and international pressure for food production. The difficulties of public inspection, especially at the agricultural and livestock borders in the State of Mato Grosso, compromise compliance with environmental laws [99,100]. Enforcement activities utilize satellite data on the land cover but need improved monitoring and enforcement to ensure legal security effectiveness [25,83,101]. Sustainable agricultural intensification is the alternative to supply the growing demand for food without deforestation. Stabile et al. [102] suggest that a strategy to reduce deforestation is to increase productivity and implement the Brazilian Forest Code. Koch et al. [103] debate about regional models for sustainable development in controlling deforestation, showing that policies that induce land scarcity can result in agricultural intensification. Another development alternative considers Ostrom’s legacy [104,105,106], in which the self-organized collective action system brings gains in the managed ecosystem and the economic development of the Amazon region. Different studies demonstrate that the valorization of the collective action of the local population is a path to sustainable development, as in the collective floodplain property [107], indigenous territories with full guaranteed property rights [108], areas of non-timber forest products [109], and agro-extractive settlements [106,107]. The self-organized local producers’ system establishes alliances with the support of NGOs and conservationists to formalize and protect their production system more fairly [110]. An important topic for future study is the change in landownership rights and demarcation process for the indigenous groups that have protected their perimeters over the years of increasing tension in the Amazon.

5. Conclusions

This study used a GIS analysis to evaluate the impact of certification of public and private properties with deforestation within the Amazonian biome in Mato Grosso State. SIGEF data show that the preponderance of certified properties is private (94%), while public properties have a low representation of 6%. In certification, private and public properties have a predominance of forest cover <80%, reaching 85 and 95% of properties, respectively. Smaller landowners acquire a property certification with a higher percentage of deforestation. Therefore, the legalization of properties operated mainly in deforested areas and with an untitled private domain. This approach allows homeowners to acquire a more significant commitment to the purchased goods, being induced to comply with the requirements, since they are subject to penalties. An analysis of semiannual deforestation demonstrates the certification that 8% of private properties with forested areas undertook deforestation. This percentage was more defined in public properties, reaching 28%. An analysis of the annual difference in the 2012–2018 period for properties certified in 2015 shows that the greatest deforestation period occurs around the certification year. Public land has slightly higher deforestation rates than private land. Land tenure inequality and the still narrow timeframe of the SIGEF database challenged the present research. Land ownership and current environmental laws in Brazil are important mechanisms for preventing illegal deforestation. However, an important factor is an active enforcement for compliance with the law.

Author Contributions

Conceptualization, D.T.S.O. and O.A.d.C.J.; data curation, R.F.G.; formal analysis, D.T.S.O., O.A.d.C.J., O.L.F.d.C., and R.A.T.G.; funding acquisition, O.A.d.C.J., R.A.T.G., and R.F.G.; investigation, D.T.S.O.; methodology, D.T.S.O., O.A.d.C.J., and O.L.F.d.C.; project administration, O.A.d.C.J., R.A.T.G., and R.F.G.; validation, R.F.G. and O.L.F.d.C.; writing—original draft, D.T.S.O.; writing—review and editing, O.A.d.C.J., O.L.F.d.C., R.A.T.G., and R.F.G. All authors have read and agreed to the published version of the manuscript.

Funding

This research was funded by the National Council for Scientific Technological Development (CNPq) grant number 434838/2018-7 and Coordination for the Improvement of Higher Education Personnel (CAPES) grant number 001. Additionally, professors Osmar Abílio de Carvalho Júnior, Roberto Arnaldo Trancoso Gomes, and Renato Fontes Guimarães receive CNPq productivity grants.

Institutional Review Board Statement

Not applicable.

Informed Consent Statement

Not applicable.

Data Availability Statement

This research uses data from the Sistema de Gestão Fundiária (SIGEF) (https://sigef.incra.gov.br/) and the Projeto de Monitoramento do Desmatamento da Floresta Amazônica Brasileira por Satélite (PRODES) (http://terrabrasilis.dpi.inpe.br/app/map/deforestation?hl=pt-br).

Acknowledgments

We thank the Coordination for the Improvement of Higher Education Personnel (CAPES) for the Doctoral scholarship grant and the National Council for Scientific and Technological Development (CNPq) for financial support. Special thanks are given to the research group of the Spatial Information System Laboratory of the University of Brasilia for technical support. Finally, the authors acknowledge the contribution of anonymous reviewers.

Conflicts of Interest

The authors declare no conflict of interest.

References

  1. Food and Agriculture Organization of the United Nations. Land Tenure and Rural Development; FAO: Rome, Italy, 2002; ISBN 92-5-104846-0. [Google Scholar]
  2. Demsetz, H. Toward a Theory of Property Rights Harold Demsetz The American Economic Review, Vol. 57, No. 2, Papers and Proceedings of the Seventy-ninth Annual Meeting of the American Economic Association. Am. Econ. Rev. 1967, 57, 347–359. [Google Scholar]
  3. Sklenicka, P.; Molnarova, K.J.; Salek, M.; Simova, P.; Vlasak, J.; Sekac, P.; Janovska, V. Owner or tenant: Who adopts better soil conservation practices? Land Use Policy 2015, 47, 253–261. [Google Scholar] [CrossRef] [Green Version]
  4. Rao, J. Fundamental Functionings of Landowners: Understanding the relationship between land ownership and wellbeing through the lens of ‘capability’. Land Use Policy 2018, 72, 74–84. [Google Scholar] [CrossRef]
  5. Brown, D.S.; Brown, J.C.; Brown, C. Land occupations and deforestation in the Brazilian Amazon. Land Use Policy 2016, 54, 331–338. [Google Scholar] [CrossRef]
  6. Nolte, C.; Agrawal, A.; Barreto, P. Setting priorities to avoid deforestation in Amazon protected areas: Are we choosing the right indicators? Environ. Res. Lett. 2013, 8. [Google Scholar] [CrossRef]
  7. Goldstein, M.; Houngbedji, K.; Kondylis, F.; O’Sullivan, M.; Selod, H. Formalization without certification? Experimental evidence on property rights and investment. J. Dev. Econ. 2018, 132, 57–74. [Google Scholar] [CrossRef]
  8. Legesse, B.A.; Jefferson-Moore, K.; Thomas, T. Impacts of land tenure and property rights on reforestation intervention in Ethiopia. Land Use Policy 2018, 70, 494–499. [Google Scholar] [CrossRef]
  9. Ferreira, F.P.M.; Ávila, P.C. Who has secure land tenure in the urban areas of Brazil? Evidence from the state of Minas Gerais. Land Use Policy 2018, 75, 494–504. [Google Scholar] [CrossRef]
  10. Duchelle, A.E.; Cromberg, M.; Gebara, M.F.; Guerra, R.; Melo, T.; Larson, A.; Cronkleton, P.; Börner, J.; Sills, E.; Wunder, S.; et al. Linking forest tenure reform, environmental compliance, and incentives: Lessons from redd+ initiatives in the brazilian amazon. World Dev. 2014, 55, 53–67. [Google Scholar] [CrossRef]
  11. Jepson, W. Producing a modern agricultural frontier: Firms and cooperatives in eastern Mato Grosso, Brazil. Econ. Geogr. 2006, 82, 289–316. [Google Scholar] [CrossRef]
  12. Arvor, D.; Daugeard, M.; Tritsch, I.; De Mello-Thery, N.A.; Thery, H.; Dubreuil, V. Combining socioeconomic development with environmental governance in the Brazilian Amazon: The Mato Grosso agricultural frontier at a tipping point. Environ. Dev. Sustain. 2018, 20, 1–22. [Google Scholar] [CrossRef]
  13. Gil, J.; Siebold, M.; Berger, T. Adoption and development of integrated crop-livestock-forestry systems in Mato Grosso, Brazil. Agric. Ecosyst. Environ. 2015, 199, 394–406. [Google Scholar] [CrossRef]
  14. Instituto Nacional de Colonização e Reforma Agrária—INCRA. Manual Para Gestão da Certificação de Imóveis Rurais; INCRA: Brasília, Brasil, 2013. [Google Scholar]
  15. Fearnside, P.M. Deforestation control in Mato Grosso: A new model for slowing the loss of Brazil’s Amazon Forest. Ambio 2003, 32, 343–345. [Google Scholar] [CrossRef] [PubMed]
  16. Zhou, Y.; Ma, X.; Ji, D.; Heerink, N.; Shi, X.; Liu, H. Does property rights integrity improve tenure security? Evidence from China’s forest reform. Sustainability 2018, 10, 1956. [Google Scholar] [CrossRef] [Green Version]
  17. Garrett, R.D.; Lambin, E.F.; Naylor, R.L. Land institutions and supply chain configurations as determinants of soybean planted area and yields in Brazil. Land Use Policy 2013, 31, 385–396. [Google Scholar] [CrossRef]
  18. Pacheco, P.; Benatti, J.H. Tenure security and land appropriation under changing environmental governance in lowland Bolivia and Pará. Forests 2015, 6, 464–491. [Google Scholar] [CrossRef]
  19. Araujo, C.; Bonjean, C.A.; Combes, J.L.; Combes Motel, P.; Reis, E.J. Property rights and deforestation in the Brazilian Amazon. Ecol. Econ. 2009, 68, 2461–2468. [Google Scholar] [CrossRef] [Green Version]
  20. Lipscomb, M.; Prabakaran, N. Property rights and deforestation: Evidence from the Terra Legal land reform in the Brazilian Amazon. World Dev. 2020, 129, 104854. [Google Scholar] [CrossRef]
  21. Sant’Anna, A.A. Land inequality and deforestation in the Brazilian Amazon. Environ. Dev. Econ. 2017, 22, 1–25. [Google Scholar] [CrossRef] [Green Version]
  22. Arima, E.Y.; Barreto, P.; Araújo, E.; Soares-Filho, B. Public policies can reduce tropical deforestation: Lessons and challenges from Brazil. Land Use Policy 2014, 41, 465–473. [Google Scholar] [CrossRef]
  23. Soares-filho, B.; Rajão, R.; Macedo, M.; Carneiro, A.; Costa, W.; Coe, M.; Rodrigues, H.; Alencar, A. Cracking Brazil ’ s Forest Code Supplemental. Science 2014, 344, 363–364. [Google Scholar] [CrossRef]
  24. Stickler, C.M.; Nepstad, D.C.; Azevedo, A.A.; McGrath, D.G. Defending public interests in private lands: Compliance, costs and potential environmental consequences of the Brazilian Forest Code in Mato Grosso. Philos. Trans. R. Soc. B Biol. Sci. 2013, 368, 7–9. [Google Scholar] [CrossRef] [Green Version]
  25. Azevedo, A.A.; Rajão, R.; Costa, M.A.; Stabile, M.C.C.; Macedo, M.N.; Dos Reis, T.N.P.; Alencar, A.; Soares-Filho, B.S.; Pacheco, R. Limits of Brazil’s Forest Code as a means to end illegal deforestation. Proc. Natl. Acad. Sci. USA 2017, 114, 7653–7658. [Google Scholar] [CrossRef] [Green Version]
  26. Bircol, G.A.C.; de Souza, M.P.; Fontes, A.T.; Chiarello, A.G.; Ranieri, V.E.L. Planning by the rules: A fair chance for the environment in a land-use conflict area. Land Use Policy 2018, 76, 103–112. [Google Scholar] [CrossRef]
  27. Santiago, T.M.O.; Caviglia-Harris, J.; Pereira de Rezende, J.L. Carrots, Sticks and the Brazilian Forest Code: The promising response of small landowners in the Amazon. J. For. Econ. 2018, 30, 38–51. [Google Scholar] [CrossRef]
  28. Benatti, J.H.; da Cunha Fischer, L.R. New trends in land tenure and environmental regularisation laws in the Brazilian Amazon. Reg. Environ. Chang. 2018, 18, 11–19. [Google Scholar] [CrossRef]
  29. IBGE—Instituto Brasileiro de Geografia e Estatística. Brazil in Figures; IBGE: Rio de Janeiro, Brazil, 2017; ISBN 0103-9970. [Google Scholar]
  30. Pacheco, P. Actor and frontier types in the Brazilian Amazon: Assessing interactions and outcomes associated with frontier expansion. Geoforum 2012, 43, 864–874. [Google Scholar] [CrossRef]
  31. IBGE—Instituto Brasileiro de Geografia e Estatística. Censo Demográfico 2010: Características da População e dos Domicílios. Resultados do Universo; IBGE: Rio de Janeiro, Brazil, 2011; ISBN 0104-3145. [Google Scholar]
  32. Richards, P.D.; VanWey, L. Farm-scale distribution of deforestation and remaining forest cover in Mato Grosso. Nat. Clim. Chang. 2016, 6, 418–425. [Google Scholar] [CrossRef]
  33. Assis, L.F.F.G.; Ferreira, K.R.; Vinhas, L.; Maurano, L.; Almeida, C.; Carvalho, A.; Rodrigues, J.; Maciel, A.M.; Camargo, C. TerraBrasilis: A Spatial Data Analytics Infrastructure for Large-Scale Thematic Mapping. ISPRS Int. J. Geo-Inf. 2019, 8, 513. [Google Scholar] [CrossRef] [Green Version]
  34. INPE—Instituto Nacional de Pesquisas Espaciais. Coordenação Geral de Observação da Terra. Programa de Monitoramento da Amazônia e demais Biomas Desmatamento—Amazônia Legal. Available online: http://terrabrasilis.dpi.inpe.br/downloads/ (accessed on 1 November 2020).
  35. Nepstad, D.; McGrath, D.; Stickler, C.; Alencar, A.; Azevedo, A.; Swette, B.; Bezerra, T.; DiGiano, M.; Shimada, J.; Seroa da Motta, R.; et al. Slowing Amazon deforestation through public policy and interventions in beef and soy supply chains. Science 2014, 344, 1118–1123. [Google Scholar] [CrossRef]
  36. Silva, C.A.; Lima, M. Soy Moratorium in Mato Grosso: Deforestation undermines the agreement. Land Use Policy 2018, 71, 540–542. [Google Scholar] [CrossRef]
  37. Maranhão, R.L.A.; de Carvalho Júnior, O.A.; Hermuche, P.M.; Gomes, R.A.T.; McManus Pimentel, C.M.; Guimarães, R.F. The Spatiotemporal Dynamics of Soybean and Cattle Production in Brazil. Sustainability 2019, 11, 2150. [Google Scholar] [CrossRef] [Green Version]
  38. Nolte, C.; le Polain de Waroux, Y.; Munger, J.; Reis, T.N.P.; Lambin, E.F. Conditions influencing the adoption of effective anti-deforestation policies in South America’s commodity frontiers. Glob. Environ. Chang. 2017, 43, 1–14. [Google Scholar] [CrossRef]
  39. McManus, C.; Barcellos, J.O.J.; Formenton, B.K.; Hermuche, P.M.; de Carvalho, O.A.; Guimarães, R.; Gianezini, M.; Dias, E.A.; Lampert, V.; Zago, D.; et al. Dynamics of Cattle Production in Brazil. PLoS ONE 2016, 11, e0147138. [Google Scholar] [CrossRef] [Green Version]
  40. Guedes, S.N.R.; Reydon, B.P. Direitos de Propriedade da Terra Rural no Brasil: Uma proposta institucionalista para ampliar a governança fundiária. Rev. Econ. Sociol. Rural 2012, 50, 525–544. [Google Scholar] [CrossRef] [Green Version]
  41. Shimabukuro, Y.E.; Roberto dos Santos, J.; Roberto, F.; Duarte, V.; Rudorff, B.F.T. The Brazilian Amazon monitoring program: PRODES and DETER projects. In Global Forest Monitoring from Earth Observation; Achard, F., Hansen, M.C., Eds.; CRC, Taylor & Francis Group: Boca Raton, FL, USA, 2013; pp. 153–169. ISBN 978-1-4665-5201-2. [Google Scholar]
  42. Hansen, M.; Shimabukuro, Y.; Potapov, P.; Pittman, K. Comparing annual MODIS and PRODES forest cover change data for advancing monitoring of Brazilian forest cover. Remote Sens. Environ. 2008, 112, 3784–3793. [Google Scholar] [CrossRef]
  43. Müller, H.; Griffiths, P.; Hostert, P. Long-term deforestation dynamics in the Brazilian Amazon—Uncovering historic frontier development along the Cuiabá–Santarém highway. Int. J. Appl. Earth Obs. Geoinf. 2016, 44, 61–69. [Google Scholar] [CrossRef]
  44. Jusys, T. Fundamental causes and spatial heterogeneity of deforestation in Legal Amazon. Appl. Geogr. 2016, 75, 188–199. [Google Scholar] [CrossRef]
  45. MMA—Ministério do Meio Ambiente. Amazon Fund. Project Document; MMA: Brasília, Brasil, 2013.
  46. Sparovek, G.; Reydon, B.P.; Guedes Pinto, L.F.; Faria, V.; de Freitas, F.L.M.; Azevedo-Ramos, C.; Gardner, T.; Hamamura, C.; Rajão, R.; Cerignoni, F.; et al. Who owns Brazilian lands? Land Use Policy 2019, 87, 13–15. [Google Scholar] [CrossRef]
  47. Michalski, F.; Metzger, J.P.; Peres, C.A. Rural property size drives patterns of upland and riparian forest retention in a tropical deforestation frontier. Glob. Environ. Chang. 2010, 20, 705–712. [Google Scholar] [CrossRef]
  48. Stefanes, M.; Roque, F.; Lourival, R.; Melo, I.; Renaud, P.C.; Quintero, J.M.O. Property size drives differences in forest code compliance in the Brazilian Cerrado. Land Use Policy 2018, 75, 43–49. [Google Scholar] [CrossRef]
  49. Thaler, G.M.; Viana, C.; Toni, F. From frontier governance to governance frontier: The political geography of Brazil’s Amazon transition. World Dev. 2019, 114, 59–72. [Google Scholar] [CrossRef]
  50. Ghebru, H.; Lambrecht, I. Drivers of perceived land tenure (in) security: Empirical evidence from Ghana. Land Use Policy 2017, 66, 293–303. [Google Scholar] [CrossRef]
  51. Ma, X.; Heerink, N.; Van Ierland, E.; Van Den Berg, M.; Shi, X. Land tenure security and land investments in Northwest China. China Agric. Econ. Rev. 2013, 5, 281–307. [Google Scholar] [CrossRef]
  52. Deininger, K.; Jin, S. Tenure security and land-related investment: Evidence from Ethiopia. Eur. Econ. Rev. 2006, 50, 1245–1277. [Google Scholar] [CrossRef] [Green Version]
  53. Lovo, S. Tenure Insecurity and Investment in Soil Conservation. Evidence from Malawi. World Dev. 2016, 78, 219–229. [Google Scholar] [CrossRef] [Green Version]
  54. Abdulai, A.; Owusu, V.; Goetz, R. Land tenure differences and investment in land improvement measures: Theoretical and empirical analyses. J. Dev. Econ. 2011, 96, 66–78. [Google Scholar] [CrossRef]
  55. Nigussie, Z.; Tsunekawa, A.; Haregeweyn, N.; Adgo, E.; Nohmi, M.; Tsubo, M.; Aklog, D.; Meshesha, D.T.; Abele, S. Factors influencing small-scale farmers’ adoption of sustainable land management technologies in north-western Ethiopia. Land Use Policy 2017, 67, 57–64. [Google Scholar] [CrossRef]
  56. Zeng, D.; Alwang, J.; Norton, G.; Jaleta, M.; Shiferaw, B.; Yirga, C. Land ownership and technology adoption revisited: Improved maize varieties in Ethiopia. Land Use Policy 2018, 72, 270–279. [Google Scholar] [CrossRef]
  57. Koirala, K.H.; Mishra, A.; Mohanty, S. Impact of land ownership on productivity and efficiency of rice farmers: The case of the Philippines. Land Use Policy 2016, 50, 371–378. [Google Scholar] [CrossRef]
  58. Donkor, E.; Owusu, V. Effects of land tenure systems on resource-use productivity and efficiency in Ghana’s rice industry. Afr. J. Agric. Resour. Econ. 2014, 9, 286–299. [Google Scholar]
  59. Abman, R.; Carney, C. Land rights, agricultural productivity, and deforestation. Food Policy 2020, 94, 101841. [Google Scholar] [CrossRef]
  60. Furumo, P.R.; Rueda, X.; Rodríguez, J.S.; Parés Ramos, I.K. Field evidence for positive certification outcomes on oil palm smallholder management practices in Colombia. J. Clean. Prod. 2020, 245. [Google Scholar] [CrossRef]
  61. Kubitza, C.; Krishna, V.V.; Urban, K.; Alamsyah, Z.; Qaim, M. Land Property Rights, Agricultural Intensification, and Deforestation in Indonesia. Ecol. Econ. 2018, 147, 312–321. [Google Scholar] [CrossRef]
  62. Leonhardt, H.; Penker, M.; Salhofer, K. Do farmers care about rented land? A multi-method study on land tenure and soil conservation. Land Use Policy 2019, 82, 228–239. [Google Scholar] [CrossRef]
  63. Fischer, R.; Giessen, L.; Günter, S. Governance effects on deforestation in the tropics: A review of the evidence. Environ. Sci. Policy 2020, 105, 84–101. [Google Scholar] [CrossRef]
  64. Klarenberg, G.; Muñoz-Carpena, R.; Campo-Bescós, M.A.; Perz, S.G. Highway paving in the southwestern Amazon alters long-term trends and drivers of regional vegetation dynamics. Heliyon 2018, 4. [Google Scholar] [CrossRef]
  65. Milien, E.J.; Rocha, K.; Brown, I.F.; Perz, S.G. Roads, deforestation and the mitigating effect of the Chico Mendes extractive reserve in the southwestern Amazon. Trees For. People 2021, 3, 100056. [Google Scholar] [CrossRef]
  66. Li, G.; Lu, D.; Moran, E.; Calvi, M.F.; Dutra, L.V.; Batistella, M. Examining deforestation and agropasture dynamics along the Brazilian TransAmazon Highway using multitemporal Landsat imagery. GISci. Remote Sens. 2019, 56, 161–183. [Google Scholar] [CrossRef]
  67. Nepstad, D.; Carvalho, G.; Cristina Barros, A.; Alencar, A.; Paulo Capobianco, J.; Bishop, J.; Moutinho, P.; Lefebvre, P.; Lopes Silva, U.; Prins, E. Road paving, fire regime feedbacks, and the future of Amazon forests. For. Ecol. Manag. 2001, 154, 395–407. [Google Scholar] [CrossRef]
  68. Barber, C.P.; Cochrane, M.A.; Souza, C.M.; Laurance, W.F. Roads, deforestation, and the mitigating effect of protected areas in the Amazon. Biol. Conserv. 2014, 177, 203–209. [Google Scholar] [CrossRef]
  69. Klarenberg, G.; Muñoz-Carpena, R.; Perz, S.; Baraloto, C.; Marsik, M.; Southworth, J.; Zhu, L. A spatiotemporal natural-human database to evaluate road development impacts in an Amazon trinational frontier. Sci. Data 2019, 6, 1–12. [Google Scholar] [CrossRef] [Green Version]
  70. Müller-Hansen, F.; Heitzig, J.; Donges, J.F.; Cardoso, M.F.; Dalla-Nora, E.L.; Andrade, P.; Kurths, J.; Thonicke, K. Can Intensification of Cattle Ranching Reduce Deforestation in the Amazon? Insights From an Agent-based Social-Ecological Model. Ecol. Econ. 2019, 159, 198–211. [Google Scholar] [CrossRef]
  71. Alix-Garcia, J.; Gibbs, H.K. Forest conservation effects of Brazil’s zero deforestation cattle agreements undermined by leakage. Glob. Environ. Chang. 2017, 47, 201–217. [Google Scholar] [CrossRef]
  72. Bowman, M.S.; Soares-Filho, B.S.; Merry, F.D.; Nepstad, D.C.; Rodrigues, H.; Almeida, O.T. Persistence of cattle ranching in the Brazilian Amazon: A spatial analysis of the rationale for beef production. Land Use Policy 2012, 29, 558–568. [Google Scholar] [CrossRef]
  73. Walker, N.F.; Patel, S.A.; Kalif, K.A.B. From Amazon pasture to the high street: Deforestation and the brazilian cattle product supply chain. Trop. Conserv. Sci. 2013, 6, 446–467. [Google Scholar] [CrossRef] [Green Version]
  74. Morton, D.C.; DeFries, R.S.; Shimabukuro, Y.E.; Anderson, L.O.; Arai, E.; Del Bon Espirito-Santo, F.; Freitas, R.; Morisette, J. Cropland expansion changes deforestation dynamics in the southern Brazilian Amazon. Proc. Natl. Acad. Sci. USA 2006, 103, 14637–14641. [Google Scholar] [CrossRef] [Green Version]
  75. Lathuillière, M.J.; Miranda, E.J.; Bulle, C.; Couto, E.G.; Johnson, M.S. Land occupation and transformation impacts of soybean production in Southern Amazonia, Brazil. J. Clean. Prod. 2017, 149, 680–689. [Google Scholar] [CrossRef]
  76. Richards, P.; Pellegrina, H.; VanWey, L.; Spera, S. Soybean development the impact of a decade of agricultural change on urban and economic growth in Mato Grosso, Brazil. PLoS ONE 2015, 10, 1–19. [Google Scholar] [CrossRef]
  77. Richards, P. What Drives Indirect Land Use Change? How Brazil’s Agriculture Sector Influences Frontier Deforestation. Ann. Assoc. Am. Geogr. 2015, 105, 1026–1040. [Google Scholar] [CrossRef] [Green Version]
  78. Brancalion, P.H.S.; De Almeida, D.R.A.; Vidal, E.; Molin, P.G.; Sontag, V.E.; Souza, S.E.X.F.; Schulze, M.D. Fake legal logging in the brazilian amazon. Sci. Adv. 2018, 4, 1–8. [Google Scholar] [CrossRef] [Green Version]
  79. Hahn, M.B.; Gangnon, R.E.; Barcellos, C.; Asner, G.P.; Patz, J.A. Influence of deforestation, logging, and fire on malaria in the Brazilian Amazon. PLoS ONE 2014, 9. [Google Scholar] [CrossRef] [Green Version]
  80. Pinheiro, T.F.; Escada, M.I.S.; Valeriano, D.M.; Hostert, P.; Gollnow, F.; Müller, H. Forest degradation associated with logging frontier expansion in the Amazon: The BR-163 region in southwestern pará, Brazil. Earth Interact. 2016, 20. [Google Scholar] [CrossRef]
  81. Asner, G.P.; Knapp, D.E.; Broadbent, E.N.; Oliveira, P.J.C.; Keller, M.; Silva, J.N. Ecology: Selective logging in the Brazilian Amazon. Science 2005, 310, 480–482. [Google Scholar] [CrossRef]
  82. Nepstad, D.C.; Veríssimo, A.; Alencar, A.; Nobre, C.; Lima, E.; Lefebvre, P.; Schlesinger, P.; Potter, C.; Moutinho, P.; Mendoza, E.; et al. Large-scale impoverishment of amazonian forests by logging and fire. Nature 1999, 398, 505–508. [Google Scholar] [CrossRef]
  83. Assuncąo, J.; Gandour, C.; Rocha, R. Deforestation slowdown in the Brazilian Amazon: Prices or policies? Environ. Dev. Econ. 2015, 20, 697–722. [Google Scholar] [CrossRef] [Green Version]
  84. de Area Leão Pereira, E.J.; de Santana Ribeiro, L.C.; da Silva Freitas, L.F.; de Barros Pereira, H.B. Brazilian policy and agribusiness damage the Amazon rainforest. Land Use Policy 2020, 92, 104491. [Google Scholar] [CrossRef]
  85. Reydon, B.P.; Fernandes, V.B.; Telles, T.S. Land governance as a precondition for decreasing deforestation in the Brazilian Amazon. Land Use Policy 2020, 94, 104313. [Google Scholar] [CrossRef]
  86. Gibbs, H.K.; Rausch, L.; Munger, J.; Schelly, I.; Morton, D.C.; Noojipady, P.; Soares-Filho, B.; Barreto, P.; Micol, L.; Walker, N.F. Brazil’s Soy Moratorium. Science 2015, 347, 377–378. [Google Scholar] [CrossRef]
  87. Heilmayr, R.; Rausch, L.L.; Munger, J.; Gibbs, H.K. Brazil’s Amazon Soy Moratorium reduced deforestation. Nat. Food 2020, 1, 801–810. [Google Scholar] [CrossRef]
  88. Kastens, J.H.; Brown, J.C.; Coutinho, A.C.; Bishop, C.R.; Esquerdo, J.C.D.M. Soy moratorium impacts on soybean and deforestation dynamics in Mato Grosso, Brazil. PLoS ONE 2017, 12, 1–21. [Google Scholar] [CrossRef]
  89. da Silva Junior, C.A.; Nanni, M.R.; Teodoro, P.E.; Silva, G.F.C.; de Lima, M.G.; Eri, M. Comparison of mapping soybean areas in Brazil through perceptron neural networks and vegetation indices. Afr. J. Agric. Res. 2016, 11, 4413–4424. [Google Scholar] [CrossRef] [Green Version]
  90. Tritsch, I.; Le Tourneau, F.M. Population densities and deforestation in the Brazilian Amazon: New insights on the current human settlement patterns. Appl. Geogr. 2016, 76, 163–172. [Google Scholar] [CrossRef] [Green Version]
  91. Richards, P.; VanWey, L. Where Deforestation Leads to Urbanization: How Resource Extraction Is Leading to Urban Growth in the Brazilian Amazon. Ann. Assoc. Am. Geogr. 2015, 105, 806–823. [Google Scholar] [CrossRef] [Green Version]
  92. Eloy, L. Urbanisation and Resource Management in Riverine Amazônia. Bull. Lat. Am. Res. 2015, 34, 1–2. [Google Scholar] [CrossRef]
  93. Garrett, R.D.; Gardner, T.A.; Fonseca Morello, T.; Marchand, S.; Barlow, J.; Ezzine de Blas, D.; Ferreira, J.; Lees, A.C.; Parry, L. Explaining the persistence of low income and environmentally degrading land uses in the Brazilian Amazon. Ecol. Soc. 2017, 22. [Google Scholar] [CrossRef]
  94. van Solinge, T.B. Deforestation Crimes and Conflicts in the Amazon. Crit. Criminol. 2010, 18, 263–277. [Google Scholar] [CrossRef] [Green Version]
  95. Alston, L.J.; Libecap, G.D.; Mueller, B. Land reform policies, the sources of violent conflict, and implications for deforestation in the Brazilian Amazon. J. Environ. Econ. Manag. 2000, 39, 162–188. [Google Scholar] [CrossRef]
  96. Puppim de Oliveira, J.A. Property rights, land conflicts and deforestation in the Eastern Amazon. For. Policy Econ. 2008, 10, 303–315. [Google Scholar] [CrossRef]
  97. Sauer, S. Soy expansion into the agricultural frontiers of the Brazilian Amazon: The agribusiness economy and its social and environmental conflicts. Land Use Policy 2018, 79, 326–338. [Google Scholar] [CrossRef]
  98. Brazil. Constitution of the Federative Republic of Brazil; STF, Secretaria de Documentação: Brasília, Brasil, 2019; ISBN 9788554223076. [Google Scholar]
  99. Azevedo-Ramos, C.; Moutinho, P. No man’s land in the Brazilian Amazon: Could undesignated public forests slow Amazon deforestation? Land Use Policy 2018, 73, 125–127. [Google Scholar] [CrossRef]
  100. Schielein, J.; Börner, J. Recent transformations of land-use and land-cover dynamics across different deforestation frontiers in the Brazilian Amazon. Land Use Policy 2018, 76, 81–94. [Google Scholar] [CrossRef]
  101. Nunes, S.; Barlow, J.; Gardner, T.; Sales, M.; Monteiro, D.; Souza, C. Uncertainties in assessing the extent and legal compliance status of riparian forests in the eastern Brazilian Amazon. Land Use Policy 2019, 82, 37–47. [Google Scholar] [CrossRef]
  102. Stabile, M.C.C.; Guimarães, A.L.; Silva, D.S.; Ribeiro, V.; Macedo, M.N.; Coe, M.T.; Pinto, E.; Moutinho, P.; Alencar, A. Solving Brazil’s land use puzzle: Increasing production and slowing Amazon deforestation. Land Use Policy 2020, 91, 104362. [Google Scholar] [CrossRef]
  103. Koch, N.; Zu Ermgassen, E.K.H.J.; Wehkamp, J.; Oliveira Filho, F.J.B.; Schwerhoff, G. Agricultural Productivity and Forest Conservation: Evidence from the Brazilian Amazon. Am. J. Agric. Econ. 2019, 101, 919–940. [Google Scholar] [CrossRef] [Green Version]
  104. Ostrom, E. The challenge of common-pool resources. Environment 2008, 50, 8–21. [Google Scholar] [CrossRef]
  105. Ostrom, E. Governing the commons: The evolution of institutions for collective action. Gov. Commons Evol. Inst. Collect. Action 1990, 32. [Google Scholar] [CrossRef]
  106. Ostrom, E. A General Framework for Analyzing Sustainability of Social-Ecological Systems. Science 2009, 325, 419–422. [Google Scholar] [CrossRef]
  107. Futemma, C.; De Castro, F.; Silva-Forsberg, M.C.; Ostrom, E. The emergence and outcomes of collective action: An Institutional and Ecosystem Approach. Soc. Nat. Resour. 2002, 15, 503–522. [Google Scholar] [CrossRef]
  108. Baragwanath, K.; Bayi, E. Collective property rights reduce deforestation in the Brazilian Amazon. Proc. Natl. Acad. Sci. USA 2020, 117, 20495–20502. [Google Scholar] [CrossRef]
  109. Guariguata, M.R.; Cronkleton, P.; Duchelle, A.E.; Zuidema, P.A. Revisiting the ‘cornerstone of Amazonian conservation’: A socioecological assessment of Brazil nut exploitation. Biodivers. Conserv. 2017, 26, 2007–2027. [Google Scholar] [CrossRef]
  110. Lopez, M.C.; Moran, E.F. The legacy of Elinor Ostrom and its relevance to issues of forest conservation. Curr. Opin. Environ. Sustain. 2016, 19, 47–56. [Google Scholar] [CrossRef] [Green Version]
Figure 1. Location map of the study area.
Sustainability 13 02085 g001
Figure 2. Mato Grosso annual deforestation rate (INPE, 2018).
Sustainability 13 02085 g002
Figure 3. Land Management System (SIGEF) processes (INCRA, 2013).
Sustainability 13 02085 g003
Figure 4. Certification by year in public (A) and private (B) properties.
Sustainability 13 02085 g004
Figure 5. The number of certified properties from the public or private lands in the 2013–2018 period.
Sustainability 13 02085 g005
Figure 6. The total area of properties certified from the public or private lands in the 2013–2018 period.
Sustainability 13 02085 g006
Figure 7. Linear regression between properties size [log10 (m2)] and the percentage of the number of properties with forest cover within the 80–100% range (blue points) (R2 = 0.93) and <1% (orange points) (R2 = 0.94). The data are in Table 3.
Sustainability 13 02085 g007
Figure 8. Linear regression between the number of public properties in size range 5.5–6.0 [log10 (m2)] and forest cover percentage (R2 = 0.88).
Sustainability 13 02085 g008
Figure 9. Linear regression between the proportional deforestation index (PDI) average values in 2 years for private properties and the size of the property considering the different ranges of forest cover at the time of certification: 1–20% (R2 = 0.96), 20–40% (R2 = 0.87), 40–60% (R2 = 0.83), 60–80% (R2 = 0.96), and 80–100% (R2 = 0.90). The analysis considered only properties that deforested in the period. The data are in Table 8.
Sustainability 13 02085 g009
Figure 10. Forest cover (%) by size per year after certification in private and public properties. Note: y-axis in logarithmic scale.
Sustainability 13 02085 g010
Table 1. The number of private properties by the year of certification and property’s size [log10 (m2)].
Size
Log10 (m2)
Year of CertificationTotal
201320142015201620172018
<5.021395776176373823
5.0–5.584091633012532651399
5.5–6.096245275476216853013
6.0–6.539881695922117310974807
6.5–7.0658376926177458283784
7.0–7.5475574733933704862326
7.5–8.09126716468111449
>8.5221158121876
total1813594269329283418386316,677
Table 2. The number of private properties by the year of certification and the forest cover percentage in the previous certification year.
Forest %
(Year-1)
Year of CertificationTotal
201320142015201620172018
<1391314849939104812815470
1–20407185076247757993463
20–40234564103895345432355
40–60233433172733433831682
60–80282361952312432701203
80–100285274154724755872504
total1813594269329283418386316,677
Table 3. The number of certified private properties considering the forest cover percentage in the previous certification year and the property’s size.
Size
Log10 (m2)
Percentage of Forest Cover in the Previous Year of CertificationTotal
<1%1–20%20–40%40–60%60–80%80–100%
<5.0674 (81.9%)48 (5.8%)33 (4.0%)17 (2.0%)11 (1.3%)40 (4.8%)823 (100%)
5.0–5.5991 (70.8%)181 (12.9%)91 (6.5%)36 (2.6%)31 (2.2%)69 (4.9%)1399 (100%)
5.5–6.01509 (50.0%)676 (22.4%)347 (11.5%)169 (5.6%)126 (4.1%)188 (6.2%)3015 (100%)
6.0–6.51407 (29.2%)1285 (26.7%)832 (17.5%)434 (9.0%)304 (6.3%)543 (11.3%)4805 (100%)
6.5–7.0689 (18.2%)820 (21.6%)660 (17.4%)519 (13.7%)313 (8.2%)783 (20.7%)3784 (100%)
7.0–7.5183 (7.9%)384 (16.5%)327 (14.0%)403 (17.3%)316 (13.6%)713 (30.6)2326 (100%)
7.5–8.017 (3.8%)63 (14.0%)59 (13.1%)88 (19.6%)85 (18.9%)137 (30.5%)449 (100%)
>8.00 (0.0%)6 (7.9%)6 (7.9%)16 (21.0%)17 (22.4%)31 (40.8%)76 (100%)
total5470 (32.8%)3463 (20.7%)2355 (14.1%)1682 (10.1%)1203 (7.2%)2504 (15.0%)16,677 (100%)
Table 4. The number of public properties by the year of certification and property’s size [log10 (m2)].
Size
Log10 (m2)
Year of CertificationTotal
20142015201620172018
<5.08156020
5.0–5.55350013
5.5–6.04875320884
6.0–6.55332619
6.5–7.04167725
7.0–7.595851239
7.5–8.081097640
8.0–8.56751120
>8.54112210
total539064532341070
Table 5. The number of public properties by the year of certification and the forest cover percentage in the previous certification year.
Forest %
(Year 1)
Year of CertificationTotal
20142015201620172018
<1222851685336
1–2012301789337
20–404126953147
40–60697123109
60–8048160192
80–100516691349
total539064532341070
Table 6. The number of certified public properties considering the percentage of forest in the previous certification year and the property’s size.
Size
Log10 (m2)
Percentage of Forest Cover in the Previous Year of CertificationTotal
<11–2020–4040–6060–8080–100
<518 (90.00%)00002 (10.00%)20 (100.00%)
5–5.511 (84.61%)2 (15.38%)000013 (100.00%)
5.5–6284 (32.12%)294 (33.25%)119 (13.46%)95 (10.74%)78 (8.82%)14 (1.58%)884 (100.00%)
6–6.53 (15.78%)2 (10.52%)2 (10.52%)2 (10.52%)2 (10.52%)8 (42.10%)19 (100.00%)
6.5–79 (36.00%)3 (12.00%)2 (8.00%)1 (4.00%)1 (4.00%)9 (36.00%)25 (100.00%)
7–7.54 (10.25%)11 (28.20%)5 (12.82%)5 (12.82%)2 (5.12%)12 (30.76%)39 (100.00%)
7.5–87 (17.50%)13 (32.50%)9 (22.50%)3 (7.50%)5 (12.50%)3 (7.50%)40 (100.00%)
8–8.507 (35.00%)7 (35.00%)2 (10.00%)3 (15.00%)1 (5.00%)20 (100.00%)
>8.505 (50.00%)3 (30.00%)1 (10.00%)1 (10.00%)010 (100.00%)
total336 (31.40%)337 (31.49%)147 (13.73%)109 (10.18%)92 (8.59%)49 (4.57%)1070 (100.00%)
Table 7. The number of private properties certified with deforestation in 2 years, considering the percentage of forest in the certification and the property’s size.
% ForestSize [Log10 (m2)]Total
<55–5.55.5–66–6.56.5–77–7.57.5–88–8.5
1–20442538222210116
20–40422049463461162
40–600113443252101153
60–800163429233399
80–100131455473484166
total91178220176165289696
Table 8. Proportional deforestation index’s (PDI) average values in 2 years for private properties, considering the forest cover percentage in the certification and the property’s size. The calculation was performed using intervals with values greater than 3 properties (see Table 7).
Forest % in CertificationSize [Log10(m2)]
<55–5.55.5–66–6.56.5–77–7.57.5–88–8.5
1–2093.7775.7247.4739.5223.0315.56
20–4084.45 33.0630.9019.6411.378.17
40–60 40.0625.0216.8116.9712.41
60–80 39.9434.9019.7210.81
80–100 33.3234.5821.1512.0612.266.72
Table 9. The number of public properties certified with deforestation in 2 years, considering the percentage of forest in the certification and the property’s size.
% ForestSize [Log10 (m2)]Total
<55–5.55.5–66–6.56.5–77–7.57.5–88–8.5
1–2000460007459
20–4000350114548
40–6000440011046
60–8000340021138
80–100007000007
total001660141310198
Table 10. Proportional deforestation index’s average values in 2 years for public properties, considering the forest cover percentage in the certification and the property’s size.
Size [Log10 (m2)]
<55–5.55.5–66–6.56.5–77–7.57.5–88–8.5
0–200053.910009.774.54
20–400041.3703.008.388.685.36
40–600052.76002.228.80
60–800047.70002.751.371.82
80–1000060.6100000
Publisher’s Note: MDPI stays neutral with regard to jurisdictional claims in published maps and institutional affiliations.

