Article

National Limits of Sustainability: The Czech Republic’s CO2 Emissions in the Perspective of Planetary Boundaries

Department of Development and Environmental Studies, Faculty of Science, Palacky University, TR 17 listopadu 12, 771 46 Olomouc, Czech Republic
*
Author to whom correspondence should be addressed.
Sustainability 2021, 13(4), 2164; https://doi.org/10.3390/su13042164
Submission received: 23 January 2021 / Accepted: 12 February 2021 / Published: 18 February 2021
(This article belongs to the Special Issue Bioeconomy, Circular Economy and Sustainability)

Abstract

:
Building on the planetary boundaries (PB) concept and recent studies on assessing the PB at the national level, this paper proposes a new method for addressing the growing need to conceptualize the national environmental limits in the global perspective. The global and national limits for the climate change PB are set using the GDP-adjusted model that represents an innovative and fairer CO2 emissions distribution mechanism. It elaborates on the equity principle and distributes the remaining global emission budget to countries on the basis of their past, current, and future population; past emissions; and current state of economic development. The results point to insufficient global efforts to reduce the CO2 emissions to avoid a global temperature rise of more than 2 °C by 2100. When examining the data in accordance with this climate change scenario, we see that some countries have already spent their CO2 budget and most high-income countries will spend their remaining budget by the end of the decade. This is also the case for the Czech Republic, which exceeded the limit for the period from 2017 onwards in 2018. While the result clearly points to the urgency of the decarbonization process, it also shows that some high-income countries, including the Czech Republic, are currently emitting at the expense of other countries. On the policy level, the findings could contribute to the re-evaluation of the GHG reduction plans as well as setting more appropriate and fairer national targets.

1. Introduction

The unprecedented acceleration of anthropogenic activities and human impact on the environment during the 20th and the onset of the 21st centuries have brought the issue of the sustainability of the human civilization into question. The world’s population is expected to increase by 2 billion people in the next 30 years, from 7.7 billion in 2020 to 9.7 billion in 2050, and could peak at nearly 11 billion around 2100 [1]. The pressure on the environment caused by such rapid population growth and economic development is reaching the tipping point already today. With persistent social and economic challenges linked to inequality, the scientific community faces a growing need to conceptualize the environmental limits of human activities and determine the carrying capacity of the earth. Under the emerging concept of bioeconomy [2], there is the discussion of increasing land modification accelerated by human activities [3]. It has been obvious in the last decade that monetization of biodiversity at a landscape scale [4] needs to be extended by using of the principles of a circular economy [5] and that biodiversity conservation needs to incorporate a new concept of planetary boundaries [6].
This concept of planetary boundaries (PB) was first introduced in 2009 by a group of scientists led by Johan Rockström from the Stockholm Resilience Centre and Will Steffen from the Australian National University in order to define “a safe operating space for humanity on a stable planet”. Rockström et al. [7] identified nine processes that regulate the stability and resilience of the earth system (climate change, ocean acidification, stratospheric ozone, biogeochemical nitrogen and phosphorus cycle, global freshwater use, land system change, rate of biodiversity loss, chemical pollution, and atmospheric aerosol loading) and proposed quantification for seven of them. According to the PB framework, the nine biophysical processes have a vital role in maintaining the earth system in a Holocene-like state. Going beyond the limits in one or more of the PB increases the risk of generating large-scale abrupt or irreversible environmental changes [7]. On the basis of the study [8], published in 2015, the authors argue that the global limit is exceeded in four out of the nine PB.
Recently, several attempts to transform the PB concept to the regional and national level have been made. A pioneer study on Sweden by Nykvist et al. [9] found similarities between the PB and national environmental targets and presented indicators to measure national performance in four of them. This study considered both absolute and per capita performance and distinguishes between territorial and footprint (consumption-based) indicators in order to address a set of policy questions. Using an extended PB framework supplemented by social well-being indicators, Cole et al. [10] applied a decision-based methodology for downscaling the PB and creating a national “barometer” to South Africa. Fang et al. [11] assessed the PB in 28 countries but lacked consistency in the types of data used. A case study of Switzerland by Dao et al. [12] deals with the preceding findings and proposes several types of consumption-based indicators while considering the historical responsibility of the footprints. A similar method addressing the historical responsibility of the footprint has been recently applied to a larger list of countries by Hickel [13].
Several other studies focused instead on regional or subregional assessment. Authors of study [14] used the equal per capita allocation of the PB and the consumption-based quantification of the environmental impacts but did not address the historical responsibility. Dearing et al. [15] applied an integrative boundary approach including the biophysical and social dimensions to two low-income communities in China. Other studies addressed only selected PB, e.g., study [16] focused on the nitrogen boundary in Ethiopia and Finland.
A first attempt to develop a complex operationalization of the PB and its transformation into national targets was made by Häyhäa at al. [17]. Their study used a three-stage approach to sequentially translate the biophysical, socioeconomic, and ethical dimensions of the PB. For each of the dimensions, a set of analytical and integration techniques was proposed to consider the interlinkages between them. The analytical and integration tools do, however, only serve as examples rather than a systemic methodology for setting national goals and priorities.
The main differentiating factor in the case studies translating the PB concept to the national level is the use of territorial (production-based) and footprint (consumption-based) indicators [18]. The territorial perspective considers the environmental impact of the production of goods and services generated in a country for both national and foreign consumers. On the other hand, the footprint perspective focuses on the environmental impact of consumption and therefore considers both national and foreign production for the national consumers [19]. Footprints, or consumption-based environmental indicators, can be computed by adjusting the production-based indicators for trade, or by using an input–output analysis, life cycle assessment, or a combination of both [20].
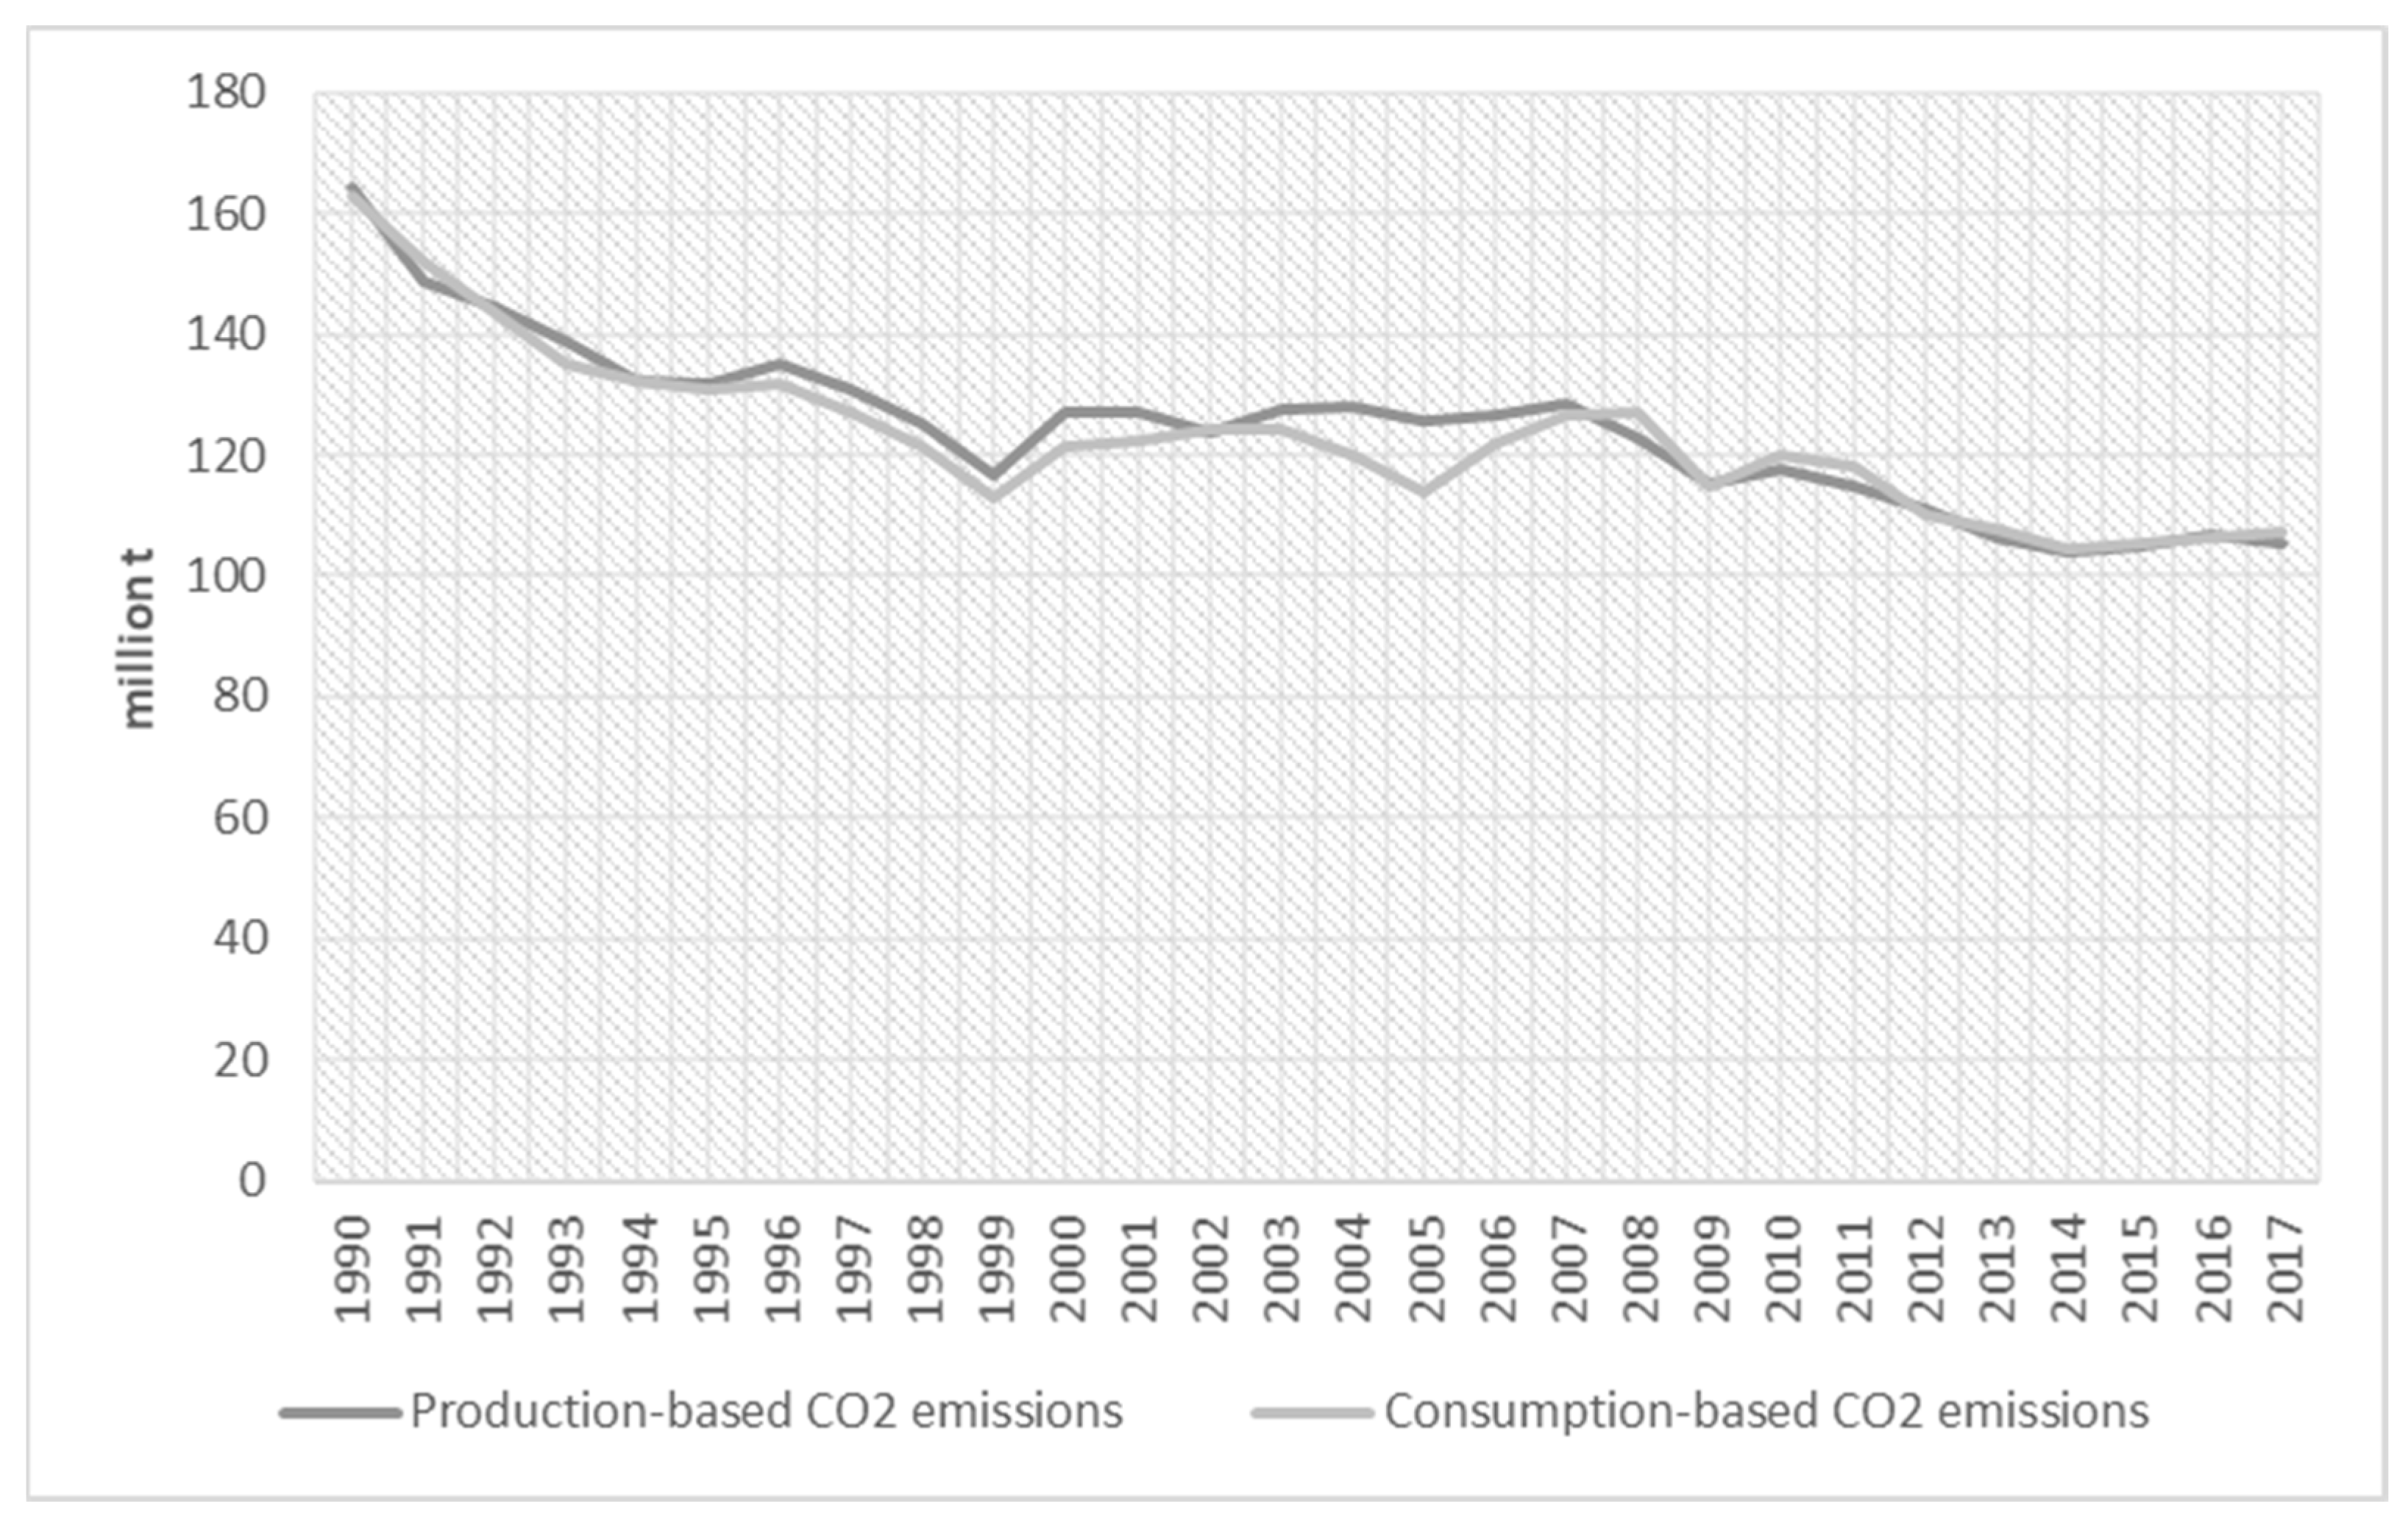
While current studies tend to favor the consumption-based approach, only territorial data are often produced and reported at the national level. Some authors [21,22] argue that the use of consumption-based indicators is not necessary in certain cases due to the structure of the economy allowing a focus on production. This approach is suitable for the areas where the territorial data do not differ significantly from the consumption data, e.g., CO2 emissions in the case of the Czech Republic under climate change [23]. Building on the conclusions of study [24], both numerator (current values) and denominator (limit value) should be either territorial or footprint indicators.
Some of the above-mentioned studies [12,13] applied a historical perspective and assessed budgets over time to address the equity issue between the past, current, and future population. Such perspective expands the simple “equal share per capita” approach [14,25], which considers the population size and growth of selected countries. It enables one to explore the possibility of incorporating the GDP per capita variable into the model to expand the equity principle even further [26,27].
Even though the economic development is theoretically not necessarily associated with higher emissions, there are not many advanced economies in the world that show a genuine carbon decoupling of the economic growth. Less developed countries should therefore have a right to emit relatively more if they should exercise their right to develop in the future. Such perspective builds upon the Greenhouse Development Rights framework, which proposed a “level of welfare below which people are not expected to share the costs of the climate transition”. [28] Thus, by adding the GDP per capita into the model, the remaining global emissions are redistributed by the current state of economic development, and lower-income countries receive a higher share of the emission budget. In other words, the countries in which historical emissions have not contributed to adequate economic growth would have a higher budget than countries that have already achieved a certain level of economic development. Such an approach also expects the advanced economies to decarbonize at a faster pace [29].
Although not directly, the PB concept influenced the global sustainable development agenda, and all nine PB processes are addressed in a certain way in the UN Sustainable Development Goals (SDGs) adopted in 2015 [30]. Each of the PB are reflected at the goal level (6, 12, 13, 14, and 15) as well as in specific targets. As the SDGs implementation responsibility lies primarily on the national governments, the relevance of the PB for national policies are clearly in place. Due to them being internationally agreed upon, the SDGs are, moreover, a useful reference to leverage the global PB onto the national level. A short policy brief on the relationship between the PB and the 2030 Agenda, in terms of setting targets at the national level, has been prepared by the Stockholm Environmental Institute [31].
The SDG indicators are a robust global monitoring framework with implications for the national sustainable development monitoring processes [32]. The UN monitoring set currently consists of 231 indicators, which are supplemented with other relevant data in regional (e.g., regular assessments carried by the EU, the Organisation for Economic Co-operation and Development, or international think-tanks) and national assessments. Due to the large-scale datasets and the data gaps and inconsistencies in the indicators being used, the SDG assessments are often not comparable and lead to ambiguous results [33]. Furthermore, the complexity of the SDGs and the integrated approach required for their effective implementation pose additional policy and governance challenges [34].
From a practical perspective, developing a consistent methodology for defining the national “safe operating space” on the basis of the PB framework could be a useful component in the national SDG target and priority setting. However, not many studies on linking the SDGs with the PB on the national or regional level have been performed. From the theoretical perspective, work is still to be done to establish a consistent approach enabling the selection of appropriate indicators addressing both equity between countries and their specific challenges and needs [35].
This article assesses the national environmental limit related to the climate change PB from the global perspective. It identifies the determining factors for the national indicator selection on the basis of the structure of the economy and historical performance. Furthermore, it elaborates on the equity principle for distributing the global emission budget. The resulting national CO2 budget is linked to the Czech national environmental policies to assess the pathway the country is taking in terms of limiting its harmful and potentially irreversible impact on the environment.

2. Materials and Methods

The climate change global limit set by Steffen et al. [8] remains the same as in the paper where the concept of PB was introduced in 2009 [7]. It is set to an atmospheric CO2 concentration of 350 parts per million (ppm) and an increase in the top-of-atmosphere radiative forcing of +1.0 W m2 relative to the preindustrial level. This limit corresponds to the target of 1 °C temperature increase. Nevertheless, the 1 °C target is unlikely to be achieved as the atmospheric CO2 concentration has already reached 410.5 ppm in 2019 [36] and the limit has therefore already been exceeded. Hansen et al. [37] evaluated the pathway to return to the 350-ppm level by 2100, however, the scenario resulting in the 1 °C temperature increase has been gradually ruled out as improbable, i.e., 0–5% chances according to the Intergovernmental Panel on Climate Change (IPCC) [38]. According to the study [39], global warming is likely to reach 1.5 °C between 2030 and 2052 if it continues to increase at the current rate. Keeping the global temperature increase below 2 °C by the end of the century corresponds with the current global climate policies and is aligned with the Paris Agreement target [40]. Thus, the target of a less than 2 °C increase by the year 2100 was selected as a reference point in this paper, although such a limit does not entirely fulfill the “safe operating space” definition of the PB.
Atmospheric CO2 concentration is a global indicator that is suitable for assessing global PB, but it is not appropriate to calculate the national budget because it cannot be attributed to individual countries. The indicator of yearly CO2 emissions was therefore used in this paper. The selection of this indicator was based on the literature review [41] and data availability.
The global cumulative emissions since 1870 have been estimated at 515 GtC by 2011. To limit the warming caused by the anthropogenic emissions to less than 2 °C since the period of 1861–1880 with a probability of >66%, we must maintain the emissions between 0 and 1000 GtC. The upper value is reduced to 790 GtC when accounting for non-CO2 forcing as in RCP 2.6 [38,42]. The maximum cumulative emissions from all anthropogenic sources and the maximum non-CO2 forcing emissions based on different levels of confidence are summarized in Table 1. The authors of this paper considered a higher probability of staying below the 2 °C temperature increase (>66%) and the warming effects of increases in non-CO2 greenhouse gases (GHG).
The remaining global emission budget was computed by subtracting the global cumulative anthropogenic emissions produced between 1870 and 2011 from the maximum emissions, allowing the temperature increase to stay below 2 °C. The limit date for spending the budget was set as 2100 due to its coherence with the current global climate policies, particularly the Paris Agreement. Furthermore, the year 2100 was also used as a reference in multiple IPCC scenarios. The resulting value was 275 GtC, corresponding to 1009 GtCO2, which could be considered as a budget over time for the period of 2012–2100. The global budget for 2017 onwards was computed by deducting global CO2 emissions for the period of 2012–2016. All variables used for the calculation are summarized in Table 2.
F E w = M a x C O 2 P E 1870 2011 P E 2012 2016
To calculate the national limit, the global remaining carbon dioxide budget over time from 1990 was firstly computed by adding the global budget from 2017 onwards to the global past CO2 emissions between 1990 and 2016. Secondly, the Czech share of the global budget was deduced using the share of the Czech population in the world population in 1990. Thirdly, the Czech CO2 emissions from the period of 1990–2016 are subtracted in order to compute the maximum future emissions from 2017 onwards. Finally, the model was adjusted by the GDP per capita.
The GDP-based redistribution of the national emission budgets over time was applied to a dataset of 176 countries. Countries without available data were excluded from the model. The ratio between the national GDP per capita and world average GDP per capita was used as the determining factor in the analysis. All variables used for the calculation are summarized in Table 3.
F E C Z = [ P O P C Z 1990 P O P W 1990 ( F E w + P E W ) P E C Z ] G D P W G D P C Z / S W F E W

3. Results

The global maximum future emissions from 2017 onwards corresponded to 825 GtCO2 in total or 9.9 GtCO2 per year until 2100. The global per capita yearly limit considering the cumulative global population from 2017 until 2100 was 1 tCO2. Consequently, considering the size of the global population in 2017, the global budget for 2017 was equal to 7.6 GtCO2. The value was smaller than the average yearly limit due to the expected world population growth in the future.
The remaining global CO2 budget from 1990 onwards was 1648 GtCO2. The Czech population represented 0.19% of the global population in 1990. On the basis of this proportion, we calculated that the Czech share of the overall global budget from 1990 onwards was equal to 3.2 GtCO2. By subtracting Czech past emissions between 1990 and 2016, we came to the budget of 281 MtCO2 from 2017 onwards. Using the year 2100 as a reference deadline for the exhaustion of the budget, we calculated the emissions limit to be 3.39 MtCO2 in average per year or 3.41 MtCO2 in 2017. By adding the country’s economic development on the basis of the GDP per capita into the model, we found that the resulted national limit decreased to 48.7 MtCO2 from 2017 onwards. For the following 83 years, the maximum future emissions were thus found to be 0.6 MtCO2 per year on average. The limit did not change when considering the Czech population in 2017, as the population is expected to be relatively stagnant in the future.
The comparisons between the global limit and the volume of CO2 emitted in 2017 and the national limit and the volume of CO2 emitted in 2017 are shown in Figure 1 and Figure 2.
The Czech per capita average yearly limit considering the current and future population and GDP per capita was 0.06 tCO2. The per capita limit remained approximately the same for 2017. If the current economic development was to be excluded from the model, the average annual per capita budget and the 2017 per capita budget for the Czech Republic would be 0.32 tCO2.

4. Discussion

This paper builds upon the findings of numerous preceding studies on transferring the planetary boundaries into national limits [43]. It applies the adjusted methodology for assessing the national PB on a case study of the Czech Republic. Besides the differences in the selected scenarios for assessment and the used data described in the Materials and Methods section, there are two main adjustments that can be compared to the previous studies on the topic. Firstly, a different indicator was selected to reflect the specific characteristics of the country examined. Secondly, the model for setting the national limits was complemented by the additional variable of the GDP per capita to achieve a fairer distribution of the global budget and to elaborate on the equity principle.
The data on global cumulative emissions since the chosen reference year of 1870 estimated by the IPCC were also used in some other authors’ assessments [44]. For this reason, the value of the remaining global emission budget expressed in gigatons of carbon for the period of 2011 onwards was the same as the value used in this paper. However, the authors of this paper used the confidence interval of 66% to stay below the 2 °C temperature increase and considered the warming effects of increases in non-CO2 greenhouse gases in the next steps of the assessment and therefore based the calculation on a different climate change scenario. For this reason, the resulting global CO2 budget over time from 1990 onwards was lower than in other studies on this subject [45].
As noted in the Materials and Methods section, this scenario does not entirely fulfill the “safe operating space” definition of the original study on planetary boundaries, but given the already exceeded limit for temperature rise to 1.5 °C, it is viewed as being more realistic.
The indicators used for the assessment of the national limits also differ across the studies cited in the Introduction section of this paper. Deriving from the atmospheric CO2 concentration referred to by the authors of the original PB concept, the production-based CO2 emissions including land cover changes were selected as an appropriate indicator to assess the national limits of the Czech Republic. Although several studies argue for adjusting the domestic emissions by trade and using the consumption-based footprints as seen in the Figure 3, the production- and consumption-based CO2 emissions did not significantly differ in the Czech Republic [46]. Furthermore, some of the recent studies suggest that this is the case for most countries and that the consumption-based CO2 emissions are a relevant indicator only in countries with high energy efficiency and high import rates [47].
The calculation of the global and national climate change limits could be expanded further in future studies by considering other GHG emissions beyond CO2 or converting the carbon gigatons to the CO2 equivalent using the global warming potential. However, the CO2 emissions have a sufficient explanatory power due to their proximity to the original PB indicator of atmospheric CO2 concentration. Furthermore, the CO2 emissions in the Czech Republic accounted for 83% of the national GHG emissions, which is a higher value than the global average share of approximately 74% [48].
Setting the national limits of sustainability poses several challenges related to the equal share of environmental impact among countries and individuals in the past, present, and future. The extended “equal share per capita” approach [49] considers historical emissions from 1990 and distributes the remaining emission budget on the basis of the country’s population size each year. If this it is applied to the production-based CO2 emissions of all countries, 25 countries (i.e., Liberia, Zambia, Papua New Guinea, Belize, Bolivia, Mongolia, Guyana, Paraguay, Turkmenistan, Suriname, Botswana, Equatorial Guinea, Trinidad and Tobago, Oman, Israel, Saudi Arabia, Bahrain, Canada, Australia, United States, Brunei, UAE, Qatar, Singapore, Luxembourg) out of the 176 included in the dataset had already exceeded their remaining emission budget in 2017. This is a major disadvantage of this method since the list includes not only high-income but also low-income countries that have limited opportunities to catch up with their economic development. As the low-income countries do not have sufficient means to make a speedy low-carbon transition, their future populations, in fact, do not receive the equal share of the remaining emission budget. By adding the GDP per capita variable into the model, the debt persists but decreases significantly for countries with lower-than-average per capita GDP. As the GDP-adjusted model redistributes the same global budget on the basis of the relative economic performance, countries with larger population and lower GDP per capita obtain a higher CO2 budget. The authors of this paper argue that this approach is more aligned with the definition of sustainable development, which grants the same opportunities for development to the current and future populations [50].
Figure 4 summarizes the resulting national CO2 limits in 2017 on the basis of different distribution methods in relation to the volume of emissions produced in the given year:
(1)
Model allocating the equal share of CO2 emissions per capita, adjusted for past emissions (since 1990) and GDP per capita;
(2)
Model allocating the equal share of CO2 emissions per capita, adjusted for past emissions (since 1990);
(3)
Model allocating the equal share of CO2 emissions per capita.
Although economic growth is gradually decoupling from the CO2 emissions in the Czech Republic, this is not the case for all countries and, additionally, the national GHG emissions per capita remain among the highest in the European Union. In 2018, the per capita GHG emissions accounted for an 8.7 tCO2eq. average in the EU and a 12.2 tCO2eq. average in the Czech Republic [51]. The CO2 intensity of the national GDP reached 455 g per EUR in 2018 compared to the EU-28 average of 199 g per EUR [52]. The GDP per capita is, therefore, an important factor in the analysis despite such a perspective, granting a lower CO2 budget to advanced economies.
The global CO2 emission budget for 2017, set as 7.6 GtCO2, was exceeded by 400%, as a volume of 37.1 GtCO2 was emitted. The 2017 budget for the Czech Republic was exceeded more than 150 times, as the limit was set at 0.6 MtCO2 and the actual emissions reached a volume of 90.9 MtCO2. The performance on both the global and national level can clearly be interpreted as unsafe, and the emissions reduction as insufficient, in order to achieve the target of a global temperature rise of less than 2 °C. The remaining budget of 48.7 MtCO2 until the year 2100 would, in the case of the Czech Republic, last only for several months and would have already been spent in 2018. Hence, there is no variability left with regards to how the Czech Republic could spend its budget or plan its carbon reduction. The results indicate the need for an urgent decarbonization effort and strengthened international cooperation that would at least partially compensate for the growing CO2 debt.
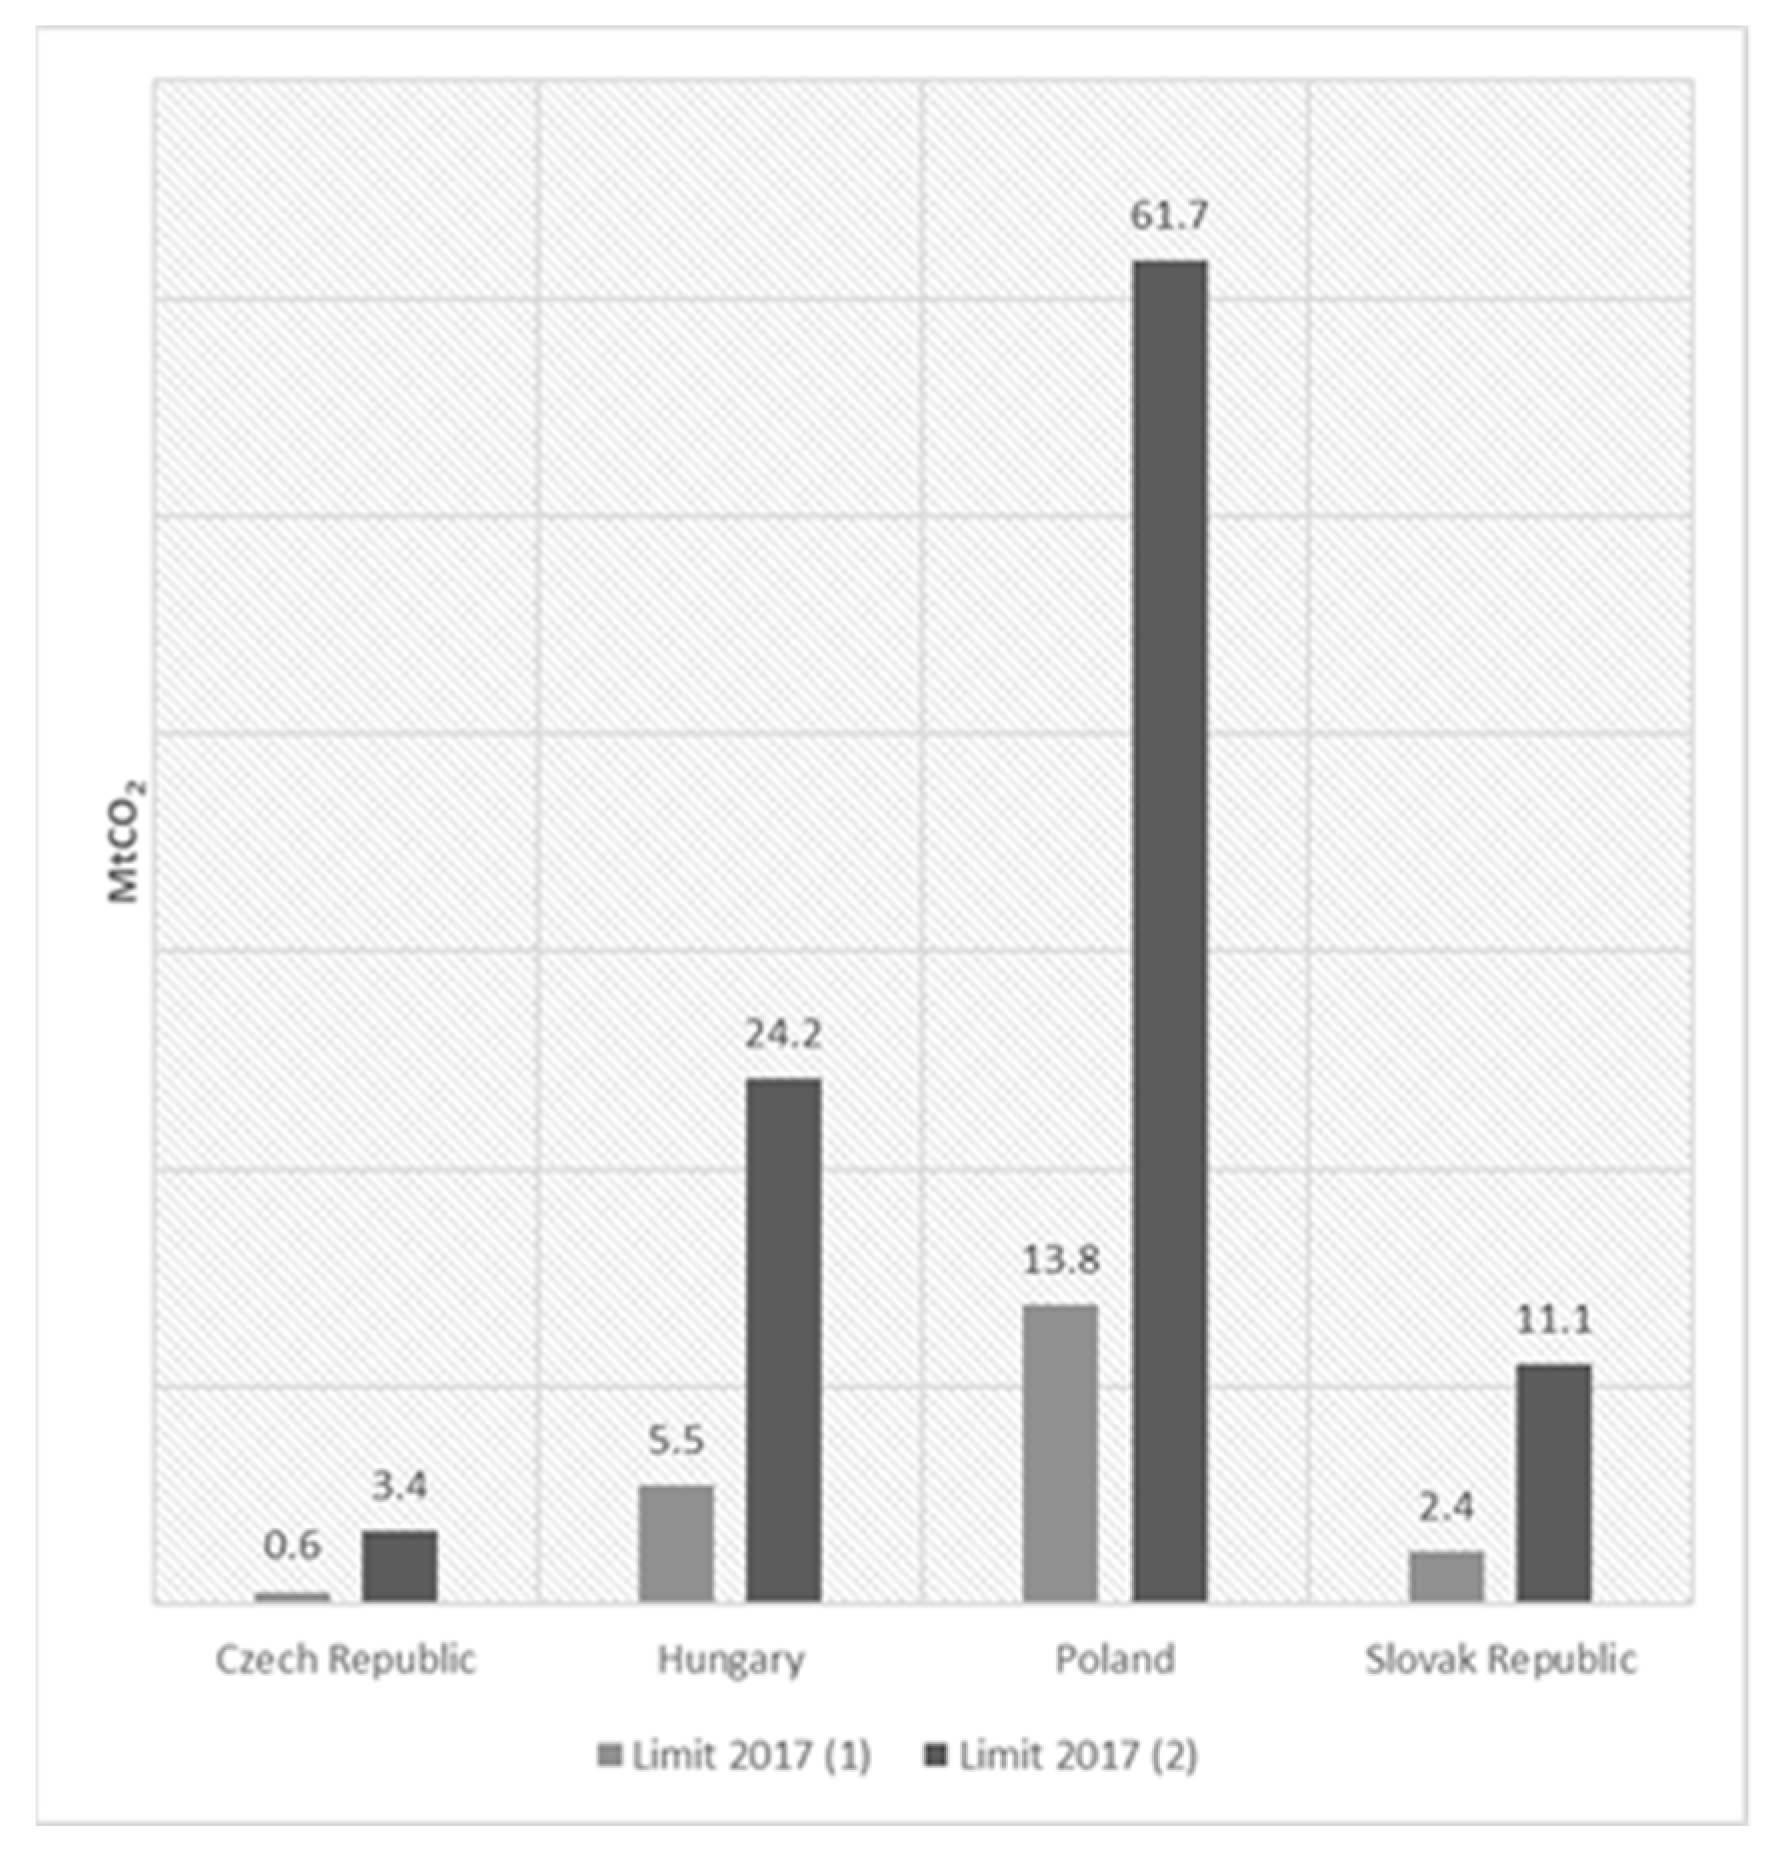
The 2017 limit for the Czech Republic is the lowest in the Visegrad Group. This is caused by the higher GDP per capita and the higher volume of emissions in the past. While all four countries are clearly overshooting their limits, the Czech Republic exceeded the limit more than 150 times in 2017. Poland’s CO2 emissions were 20 times above the limit, Slovakia’s 11 times, and Hungary’s 8 times. The results are visualized in Figure 5. The resulting budgets based on the model considering the equal share per capita adjusted for past emissions and GDP (1) were compared with budgets based on the model considering only the equal share per capita adjusted for past emissions (2), as shown in Figure 6.
National climate change policy priorities are set by the Climate Protection Policy of the Czech Republic, which was adopted in 2017. The document’s primary targets are GHG reduction in the amount 32 MtCO2eq. until 2020 and 44 MtCO2eq. until 2030 compared to 2005. Other indicative targets are related to 70 MtCO2eq. of emitted GHG in 2040 and 39 MtCO2eq. in 2050 [53]. The target values converted to MtCO2 and deducted from the reference year of 2005 are summarized in Table 4.
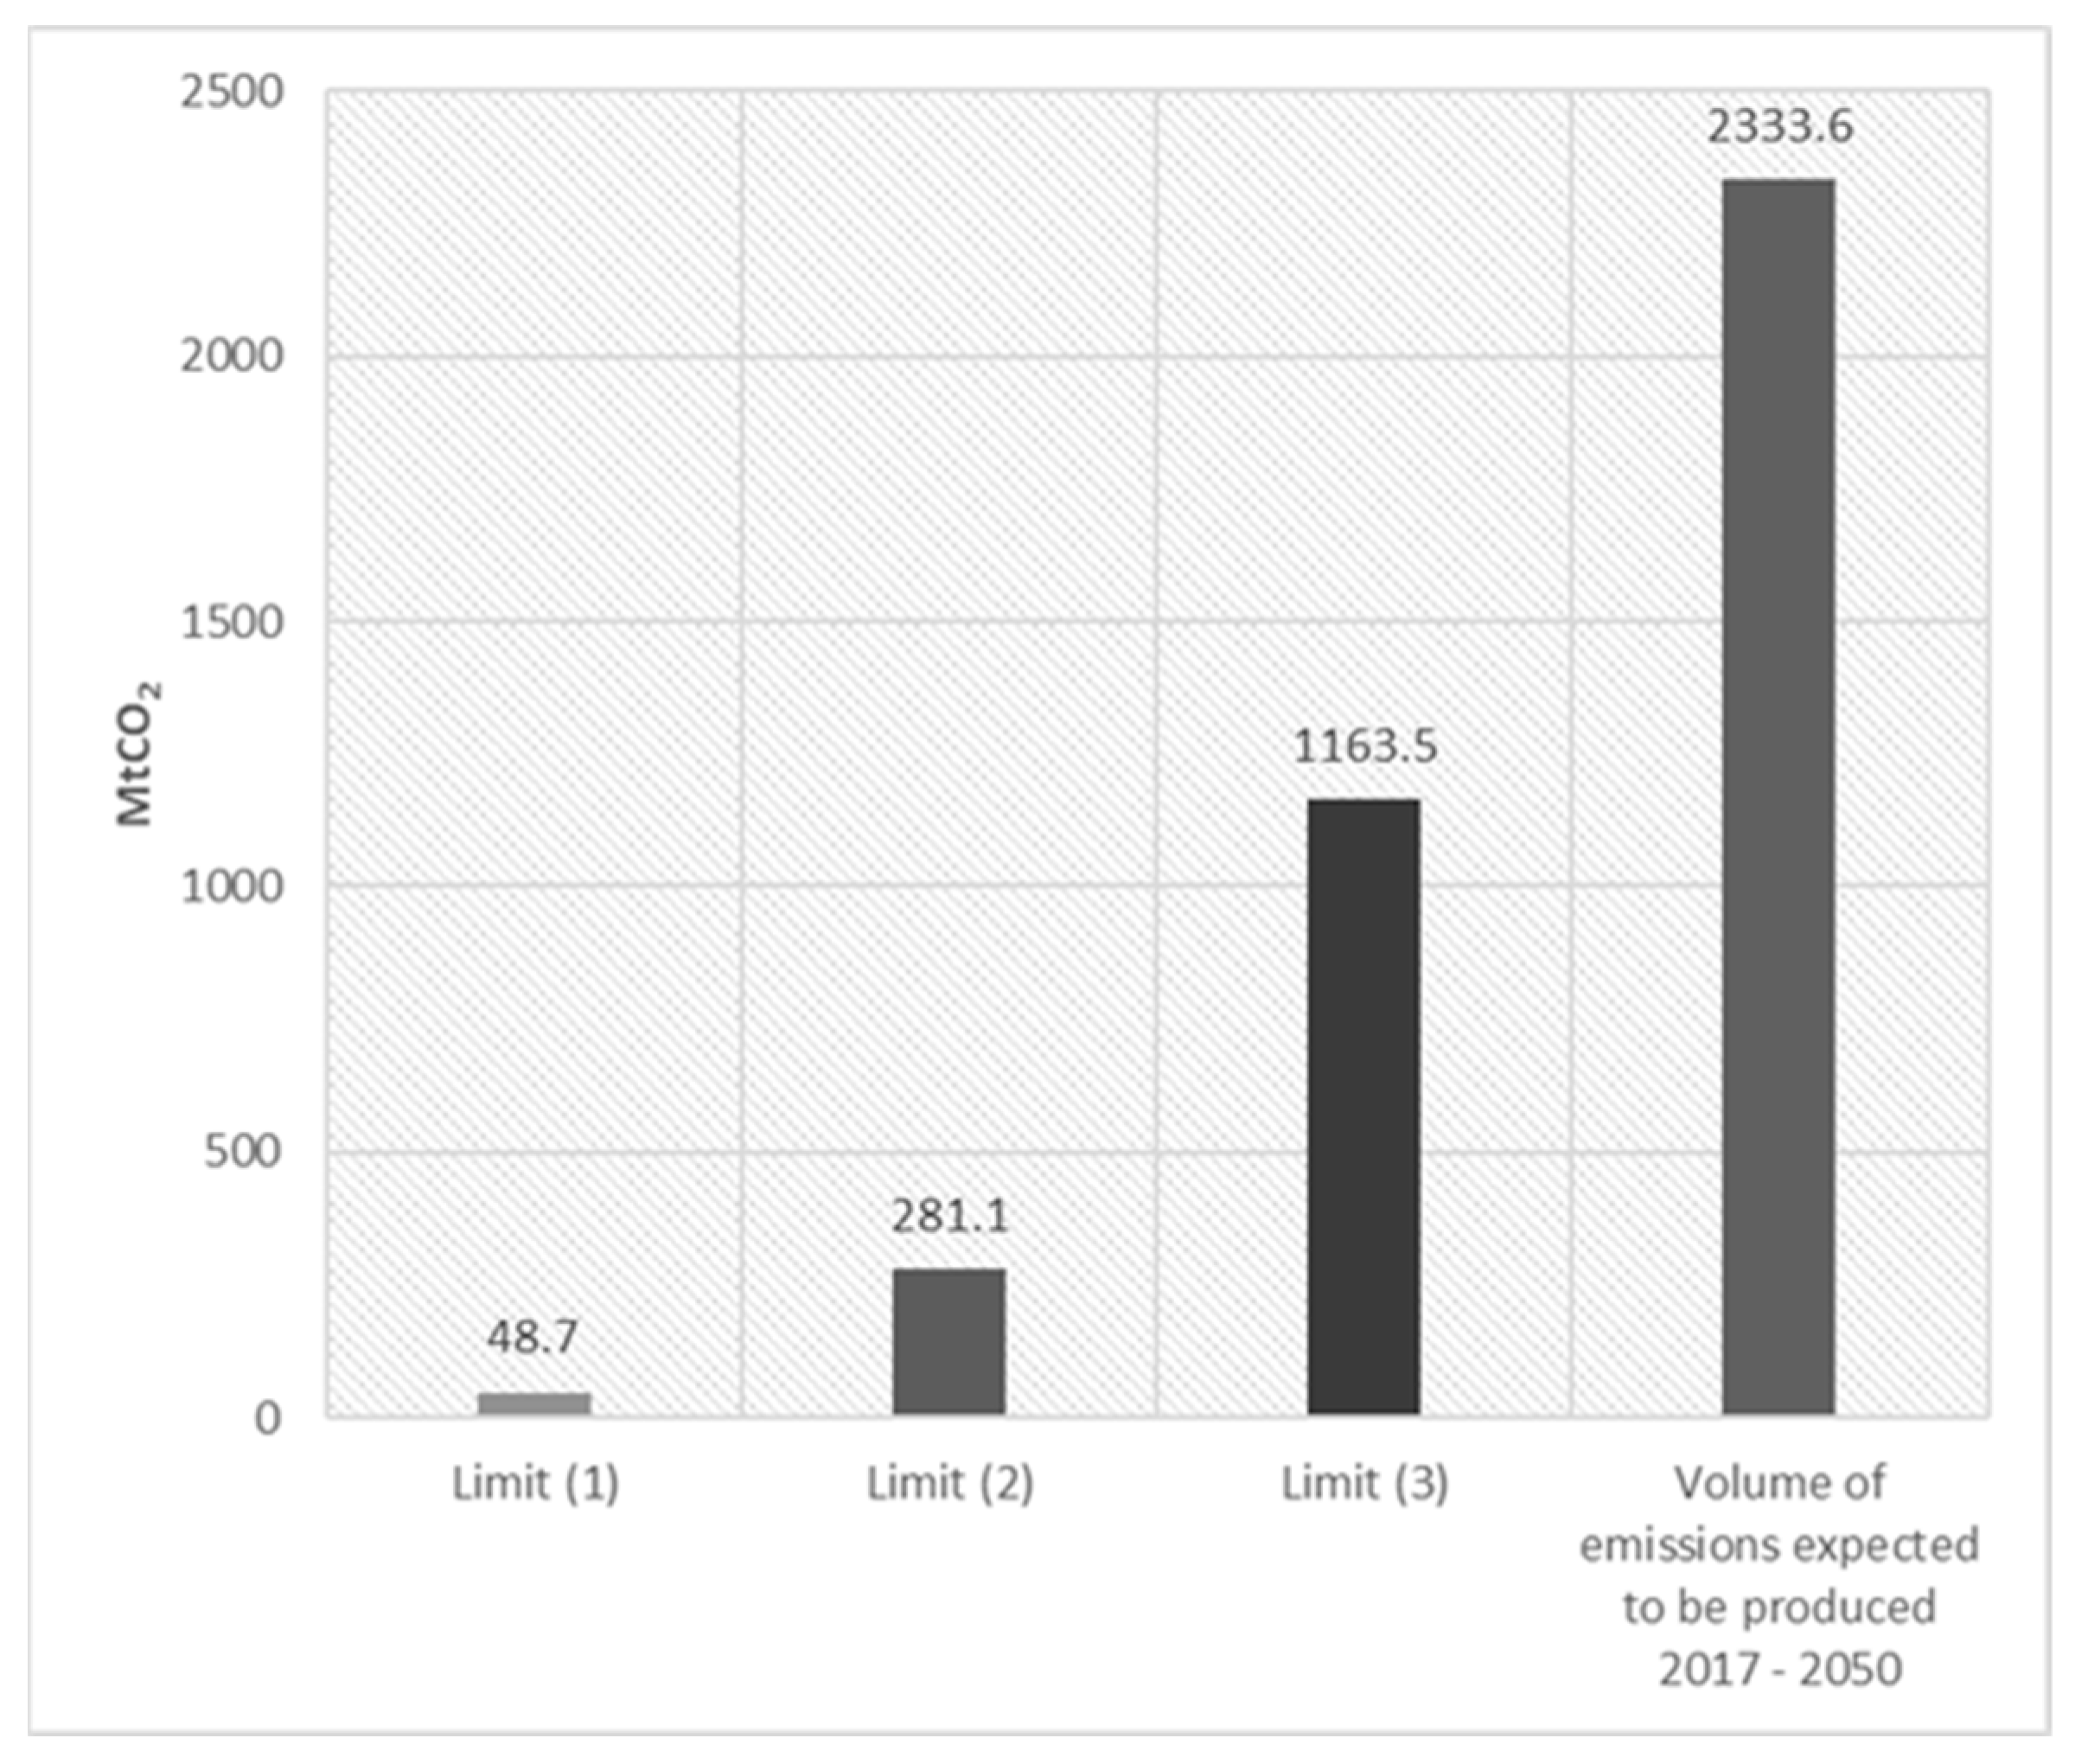
Values for all years between 2017 and 2050 were interpolated to estimate the overall volume of the CO2 emissions that will be produced in that period. The resulting volume of national CO2 emissions meeting all national reduction targets was 2334 MtCO2. The sum dramatically exceeds the national budget in terms of all three distribution methods described above. Furthermore, the carbon neutrality is expected to be achieved in 2051 under all models’ scenarios, with zero CO2 left to be emitted in the period from 2051 until 2100. However, current national climate change policies do not contain a concrete target year for achieving carbon neutrality.
As visualized in Figure 7, even if the national CO2 reduction targets are met, the limit allocated to the Czech Republic in terms of
(1)
the equal share of CO2 emissions per capita model, adjusted for past emissions (since 1990) and GDP per capita, will be exceeded more than 46 times in 2050;
(2)
the equal share of CO2 emissions per capita model, adjusted for past emissions (since 1990), will be exceeded more than eight times in 2050;
(3)
the equal share of CO2 emissions per capita model will be exceeded more than twice in 2050.
At the global level, the climate change PB is covered mainly by the global Sustainable Development Goal 13 “Take urgent action to combat climate change and its impacts”. The indicator of total GHG emissions per year is used to measure the implementation progress. Setting a quantitative target value of this indicator is the responsibility of individual countries. It is therefore difficult to assure the appropriate and fair national reduction targets on the global scale without a clear emissions distribution method. This method will be aligned with the climate change scenario of a temperature increase of not more than 2 °C by the year 2100. The concept of planetary boundaries and the methodology used in this paper could therefore be seen as a helpful guiding principle for setting such targets.
The limitations of the calculation could be clustered into three categories. Firstly, as explained in the Discussion section of this article, the results could be sensitive to the initial assumptions and selection of entry data (e.g., considered climate change scenario, selected reference years, and confidence intervals). The range of sensitivity to the input data should be a subject of further research. Secondly, the data gaps need to be further explored and addressed in order to increase the applicability of the methodology to all countries. This is particularly related to the use of consumption-based indicators in countries with higher external environmental impact. Thirdly, there are several uncertainties around the emissions trends when the emission budget is stretched to the year of 2100. For instance, the released GHG from the permafrost thaw and wetlands could influence the remaining global budgets and therefore also the remaining national emissions [54]. Some countries may also achieve carbon neutrality by 2050 and would not use their budget in the second half of the 21st century. Such factors could also be added to the model under various future scenarios to improve its foresight.
In the most recent official planetary boundaries concept update [55], the authors assessed the climate change PB on the basis of the atmospheric CO2 concentration and energy imbalance at top-of-atmosphere. The atmospheric CO2 concentration value of 398.5 parts per million in 2015 has already exceeded the boundary of 350 ppm. Such a result fell into the zone of uncertainty between 350 and 450 ppm. By 2019, the value further increased and reached 410.5 ppm and thus it still represents an increasing risk. The PB biosphere integrity, biochemical flows, and land system change were already overshot in 2015 [56].
Further research is needed to address national limits for all planetary boundaries [57]. The distribution method based on the expanded equal share per capita model considering past environmental impact and current economic development presented in this paper is an appropriate methodology for such an assessment.
The global and national limits for the climate change planetary boundary are summarized in Table 5. The global limit determines the global remaining CO2 budget for the period from 2017 to 2100 using the climate change scenario that would ensure a global temperature increase of less than 2 °C by the end of the century. The limit for 2017, considering the world population in the given year, was set as 7.8 GtCO2. The limit was exceeded by 400%, as the volume of 37.1 GtCO2 was emitted in 2017. If the global emissions remain stagnant in the following years, the budget allocated for the period lasting from 2017 to 2100 would be exhausted after approximately 22 years instead of the 83 years remaining until 2100. The global budget would, therefore, be spent in 2039. In terms of the PB concept, the global CO2 production would be outside of the earth’s “safe operating space” after this year.
The emissions distribution model used in this paper allocated 48.7 MtCO2 of the remaining global budget to the Czech Republic. This value was based on the extended “equal share per capita” principle, as the calculation took the past, present, and future Czech population into account. Furthermore, the responsibility for past emissions since 1990 was considered in the model, and the CO2 volume emitted from 1990 until 2016 was subtracted from the overall Czech budget from 1990 onwards. The resulting value was adjusted by the relative national GDP per capita to redistribute the remaining emissions on the basis of the current state of economic development. By doing so, the national budget from 2017 onwards decreased from 281 MtCO2 to 49 MtCO2.
In 2017, the Czech Republic exceeded its budget for that year by more than 150 times that which was allocated in the GDP-adjusted model. The national budget from 2017 onwards had already been spent in 2018. The estimated sum of CO2 emissions from 2017 until 2050, in terms of the national CO2 reduction plan, was 2334 MtCO2. The sum dramatically exceeded the national budget in terms of all three described distribution methods. If the national emissions reduction plan is complied with, the budget over time allocated in the GDP-adjusted model would be exceeded by more than 46 times.

5. Conclusions

Considering the GDP provides a more complete understanding when assessing the planetary boundaries for any nation. Elaborating on the equity principle and distributing the remaining global emission budget in terms of the GDP-adjusted approach allows for a formulaic allocation based on past, current, and future population; past emissions; and the current state of economic development. The results indicate the need for an urgent global effort to reduce the CO2 emissions to ensure the global temperature does not rise above 2 °C. Twenty-five countries have already spent their CO2 budget in 2017, and most high-income countries will spend their remaining budget by 2030. This is also the case for the Czech Republic, as the country, in 2018, already exceeded the limit for the period from 2017 onwards. While this result clearly points to the urgency of the decarbonization process, it also shows that some high-income countries, including the Czech Republic, are currently emitting at the expense of other countries.
The authors of this paper argue that the methodology provides a valuable guidance for the national CO2 reduction target-setting and for updating the climate change policies. Setting appropriate quantitative targets is particularly important to support the global climate and sustainable development efforts outlined in the 2030 Agenda and its Sustainable Development Goals. By fairer distribution of the global emission budget regarding the low-income countries, synergies with other than climate-related SDGs (e.g., poverty, equality, etc.) could be strengthened and the definition of sustainable development in terms of the “equal right to development for current and future populations” is being met. Although further research is needed in terms of the applicability of the model to other planetary boundaries, this paper is an important building block in the process of developing a complex global-to-national PB translation methodology.

Author Contributions

Conceptualization, A.P. and I.M.; methodology, A.P.; analysis, A.P.; writing—original draft preparation, A.P.; review and editing, I.M.; supervision, I.M.; correspondence, I.M. All authors have read and agreed to the published version of the manuscript.

Funding

This research received no external funding.

Institutional Review Board Statement

Not applicable.

Informed Consent Statement

Not applicable.

Data Availability Statement

Data sharing not applicable.

Conflicts of Interest

The authors declare no conflict of interest.

References

  1. United Nations, Department of Economic and Social Affairs, Population Division. World Population Prospects 2019: Highlights, 2019, ST/ESA/SER.A/423. Available online: https://population.un.org/wpp/Publications/Files/WPP2019_Highlights.pdf (accessed on 14 September 2020).
  2. Wozniak, E.; Tyczewska, A.; Twardowski, T. Bioeconomy development factors in the European Union and Poland. New Biotechnol. 2021, 60, 2–8. [Google Scholar] [CrossRef]
  3. Fialova, J.; Brezina, D.; Zizlavska, N.; Michal, J.; Machar, I. Assessment of Visitor Preferences and Attendance to Singletrails in the Moravian Karst for the Sustainable Development Proposals. Sustainability 2019, 11, 3560. [Google Scholar] [CrossRef] [Green Version]
  4. Pechanec, V.; Machar, I.; Sterbova, L.; Prokopova, M.; Kilianova, H.; Chobot, K.; Cudlin, P. Monetary Valuation of Natural Forest Habitats in Protected Areas. Forests 2017, 8, 427. [Google Scholar] [CrossRef] [Green Version]
  5. Stegmanna, P.; Londob, M.; Jungingerc, M. The circular bioeconomy: Its elements and role in European bioeconomy clusters. Resour. Conserv. Recycl. 2020, 6, 100029. [Google Scholar] [CrossRef]
  6. Sillman, J.; Uusitalo, V.; Tapanen, T.; Salonen, A.; Soukka, R.; Kahiluoto, H. Contribution of honeybees towards the net environmental benefits of food. Sci. Total Environ. 2021, 756, 143880. [Google Scholar] [CrossRef] [PubMed]
  7. Rockström, J.; Steffen, W.; Noone, K.; Persson, Å.; Chapin, F.S.; Lambin, E.F.; Lenton, T.M.; Scheffer, M.; Folke, C.; Schellnhuber, H.J.; et al. A safe operating space for humanity. Nature 2009, 461, 472–475. [Google Scholar] [CrossRef] [PubMed]
  8. Steffen, W.; Richardson, K.; Rockström, J.; Cornell, S.E.; Fetzer, I.; Bennett, E.M.; Biggs, R.; Carpenter, S.R.; de Vries, W.; de Wit, C.A.; et al. Planetary boundaries: Guiding human development on a changing planet. Science 2015, 347, 1259855. [Google Scholar] [CrossRef] [PubMed] [Green Version]
  9. Nykvist, B.; Persson, Å.; Moberg, F.; Persson, L.; Cornell, S.; Rockström, J. National Environmental Performance on Planetary Boundaries: A Study for the Swedish Environmental Protection Agency, 2013. Report 6576, Naturvårdsverket. p. 122. ISBN 978-91-620-6576-8.. Available online: http://www.naturvardsverket.se/Om-Naturvardsverket/Publikationer/ISBN/6500/978-91-620-6576-8/ (accessed on 23 September 2020).
  10. Cole, M.; Bailey, R.; New, M. Tracking sustainable development with a national barometer for South Africa using a downscaled “safe and just space” framework. Proc. Natl. Acad. Sci. USA 2014, 111, E4399–E4408. [Google Scholar] [CrossRef] [Green Version]
  11. Fang, K.; Heijungs, R.; Duan, Z.; De Snoo, G. The environmental sustainability of nations: Benchmarking the carbon, water and land footprints against allocated planetary boundaries. Sustainability 2015, 7, 11285–11305. [Google Scholar] [CrossRef] [Green Version]
  12. Dao, H.; Friot, D.; Peduzzi, P.; Chatenoux, B.; De Bono, A.; Schwarzer, S. Environmental Limits and Swiss Footprints Based on Planetary Boundaries; UNEP/GRID-Geneva & University of Geneva: Geneva, Switzerland, 2018; Available online: https://archive-ouverte.unige.ch/unige:74873 (accessed on 25 September 2020).
  13. Hickel, J. Quantifying national responsibility for climate breakdown: An equality-based attribution approach for carbon dioxide emissions in excess of the planetary boundary. Lancet Planet Health 2020, 4, e399–e404. [Google Scholar] [CrossRef]
  14. Hoff, H.; Nykvist, B.; Carson, M. Living Well, within the Limits of Our Planet? Measuring Europe’s Growing External Footprint. SEI Working Paper 2014–05, Stockholm Environment Institute, 2014. Available online: https://www.sei.org/publications/living-well-within-the-limits-of-our-planet-measuring-europes-growing-external-footprint/ (accessed on 25 September 2020).
  15. Dearing, J.A.; Wang, R.; Zhang, K.; Dyke, J.G.; Haberl, H.; Hossain, M.S.; Langdon, P.G.; Lenton, T.M.; Raworth, K.; Brown, S.; et al. Safe and just operating spaces for regional social-ecological systems. Glob. Environ. Change 2014, 28, 227–238. [Google Scholar] [CrossRef] [Green Version]
  16. Kahiluoto, H.; Kuisma, M.; Kuokkanen, A.; Mikkilä, M.; Linnanen, L. Local and social facets of planetary boundaries: Right to nutrients. Environ. Res. Lett. 2015, 10, 104013. [Google Scholar] [CrossRef]
  17. Häyhä, T.; Lucas, P.; van Vuuren, D.; Cornell, S.E.; Hoff, H. From Planetary Boundaries to national fair shares of the global safe operating space — How can the scales be bridged? Glob. Environ. Change 2016, 40, 60–72. [Google Scholar] [CrossRef] [Green Version]
  18. Clift, R.; Sim, S.; King, H.; Chenoweth, J.L.; Christie, I.; Clavreul, J.; Mueller, C.; Posthuma, L.; Boulay, A.-M.; Chaplin-Kramer, R.; et al. The challenges of applying planetary boundaries as a basis for strategic decision-making in companies with global supply chains. Sustainability 2017, 9, 279. [Google Scholar] [CrossRef] [Green Version]
  19. Ryberg, M.W.; Bjerre, T.K.; Nielsen, P.H.; Hauschild, M. Absolute environmental sustainability assessment of a Danish utility company relative to the Planetary Boundaries. J. Ind. Ecol. 2020. [Google Scholar] [CrossRef]
  20. Bjorn, A.; Sim, S.; King, H.; Patouillard, L.; Margni, M.; Hauschild, M.; Ryberg, M. Life cycle assessment applying planetary and regional boundaries to the process level: A model case study. Int. J. Life Cycle Assess. 2020, 25, 2241–2254. [Google Scholar] [CrossRef]
  21. Roos, S.; Zamani, B.; Sandin, G.; Petrs, G.M.; Svanstrom, M. A life cycle assessment (LCA) – based approach to guiding an industry sector towards sustainability: The case of the Swedish apparel sector. J. Clean. Prod. 2016, 133, 691–700. [Google Scholar] [CrossRef]
  22. Van Vuuren, V.P.; Lucas, P.L.; Hayha, T.; Cornell, S.E.; Stafford-smith, M. horses for courses: Analytical tools to explore planetary boundaries. Earth Syst. Dyn. 2016, 7, 267–279. [Google Scholar] [CrossRef] [Green Version]
  23. Machar, I.; Vozenilek, V.; Kirchner, K.; Vlckova, V.; Bucek, A. Biogeographic model of climate conditions for vegetation zones in Czechia. Geografie 2017, 122, 64–82. [Google Scholar] [CrossRef] [Green Version]
  24. Fang, K.; Heijungs, R.; De Snoo, G.R. Understanding the complementary linkages between environmental footprints and planetary boundaries in a footprint-boundary environmental sustainability assessment framework. Ecol. Econ. 2015, 114, 218–226. [Google Scholar] [CrossRef]
  25. Kim, R.; Kotze, L. Planetary boundaries at the intersection of Earth system law, science and governance: A state-of-the-art review. Rev. Eur. Comp. Int. Environ. Law 2020, 1–13. [Google Scholar] [CrossRef]
  26. Butz, C.; Liechti, J.; Bodin, J.; Cornell, S.E. Towards defining an environmental investment universe within planetary boundaries. Sustain. Sci. 2018, 13, 1031–1044. [Google Scholar] [CrossRef] [PubMed] [Green Version]
  27. Ehrenstein, M.; Calvo-Serrano, R.; Galan-Martin, A.; Pozo, C.; Zurano-Cervello, P.; Guillen-Gosalbez, G. Operating within Planetary Boundaries without compromising well-being? A Data Envelopment Analysis approach. J. Clean. Prod. 2020, 270, 121833. [Google Scholar] [CrossRef]
  28. Baer, P.; Athanasiou, T.; Kartha, S. The Greenhouse Development Rights Framework: The Right to Development in a Climate Constrained World; Heinrich Boll Foundation, Christian Aid, EcoEquity and the Stockholm Environment Institute: Berlin, Germany, 2008. [Google Scholar]
  29. Ryberg, M.W.; Richardson, K.; Hauschild, M.Z. Development of a life-cycle impact assessment methodology linked to the planetary boundaries framework. Ecol. Indic. 2018, 88, 250–262. [Google Scholar] [CrossRef] [Green Version]
  30. Oprsal, Z.; Harmacek, J.; Pavlik, P.; Machar, I. What Factors can Influence the Expansion of Protected Areas around the World in the Context of International Environmental and Development Goals? Probl. Ekorozw. 2018, 13, 145–157. [Google Scholar]
  31. Hoff, H.; Alva, L.I. How the Planetary Boundaries Framework can Support National Implementation of the 2030 Agenda; Stockholm Environment Institute: Stockholm, Sweden, 2017; Available online: https://mediamanager.sei.org/documents/Publications/SEI-2017-PB-Hoff-HowthePlanetary.pdf (accessed on 16 February 2021).
  32. Lucas, P.; Wilting, H. Using Planetary Boundaries to Support National Implementation of Environment-Related Sustainable Development Goals. PBI; Netherlands Environmental Assessment Agency: Hague, The Netherlands; Available online: https://www.researchgate.net/publication/328654952_Using_planetary_boundaries_to_support_national_implementation_of_environment-related_Sustainable_Development_Goals (accessed on 16 February 2021).
  33. Janoušková, S.; Hák, T.; Moldan, B. Global SDGs Assessments: Helping or Confusing Indicators? Sustainability 2018, 10, 1540. [Google Scholar] [CrossRef] [Green Version]
  34. Lafortune, G.; Fuller, G.; Schmidt-Traub, G.; Kroll, C. How Is Progress towards the Sustainable Development Goals Measured? Comparing Four Approaches for the EU. Sustainability 2020, 12, 7675. [Google Scholar] [CrossRef]
  35. Bowen, K.J.; Cradock-Henry, N.A.; Koch FPatterson, J.; Häyhä, T.; Vogt, J.; Barbi, F. Implementing the “Sustainable Development Goals”: Towards addressing three key governance challenges—collective action, trade-offs, and accountability. Current Opin. Environ. Sustain. 2017, 26–27, 90–96. [Google Scholar] [CrossRef]
  36. World Meteorological Organization. WMO Greenhouse Gas Bulletin (GHG Bulletin) - No. 16: The State of Greenhouse Gases in the Atmosphere Based on Global Observations through 2019. Available online: https://library.wmo.int/index.php?lvl=notice_display&id=21795#.X_tgwzSg82w (accessed on 23 November 2020).
  37. Hansen, J.; Kharecha, P.; Sato, M.; Masson-Delmotte, V.; Ackerman, F.; Beerling, D.J.; Hearty, P.J.; Hoegh-Guldberg, O.; Hsu, S.-L.; Parmesan, C.; et al. Assessing “Dangerous Climate Change”: Required Reduction of Carbon Emissions to Protect Young People, Future Generations and Nature. PloS ONE 2013, 8, e81648. [Google Scholar] [CrossRef] [Green Version]
  38. IPCC. Climate Change 2013: The Physical Science Basis; IPCC: Cambridge, 17 May 2013. [Google Scholar]
  39. IPCC. Summary for Policymakers. Global Warming of 1.5 °C; Masson-Delmotte, V.P., Zhai, H.-O., Pörtner, D., Roberts, J., Skea, P.R., Shukla, A., Pirani, W., Moufouma-Okia, C., Péan, R., Pidcock, S., et al., Eds.; World Meteorological Organization: Geneva, Switzerland, 2018; Available online: https://www.ipcc.ch/sr15/ (accessed on 16 February 2021).
  40. Jacob, V.A. The Implementation of the Paris Agreement on Climate Change. Transnatl. Environ. Law 2020, 9, 621–625. [Google Scholar] [CrossRef]
  41. Ryberg, M.W.; Andersen, M.M.; Owsianiak, M.; Hauschild, M.Z. Downscaling the planetary boundaries in absolute environmental sustainability assessments - A review. J. Clean. Prod. 2020, 276, 123287. [Google Scholar] [CrossRef]
  42. Machar, I.; Vlčková, V.; Šálek, L.; Pechanec, V.; Nowak, A.; Nowak, S.; Plášek, V.; Švajda, J.; Opršal, Z.; Topacoglu, O. Environmental Modelling of Forest Vegetation Zones as a Support Tool for Sustainable Management of Central European Spruce Forests. J. Landsc. Ecol. 2018, 11, 45–63. [Google Scholar] [CrossRef] [Green Version]
  43. Chandrakumar, C.; McLaren, S.J.; Jayamaha, N.P.; Ramilan, T. Absolute sustainability-based life-cycle assessment (ASLCA): A benchmarking approach to operate agri-foods systems within the 2 °C global carbon budget. J. Ind. Ecol. 2019, 23, 906–917. [Google Scholar] [CrossRef]
  44. Dao, H.; Peduzzi, P.; Friot, D. National environmental limits and footprints based on the Planetary Boundaries framework: The case of Switzerland. Glob. Environ. Change 2018, 52, 49–57. [Google Scholar] [CrossRef] [Green Version]
  45. O´Neil, D.W.; Fanning, A.L.; Lamb, W.F.; Steinberger, J.K. A good life for all within planetary boundaries. Nat. Sustain. 2018, 1, 88–95. [Google Scholar] [CrossRef] [Green Version]
  46. Global Carbon Project. Supplemental Data of Global Carbon Budget 2019 (Version 1.0) [Data Set]. Available online: https://doi.org/10.18160/gcp-2019 (accessed on 20 December 2020).
  47. Franzen, A.; Mader, S. Consumption-based versus production-based accounting of CO2 emissions: Is there evidence for carbon leakage? Environ. Sci. Policy 2018, 84, 34–40. [Google Scholar] [CrossRef] [Green Version]
  48. Olivier, J.G.J.; Vignati, E. Fossil CO2 and GHG Emissions of All World Countries - 2019 Report, EUR 29849 EN; Publications Office of the European Union: Luxembourg, 2019; pp. 1–96. ISBN 978-92-76-11100-9. [Google Scholar] [CrossRef]
  49. Fanning, A.L.; O’Neill, D.W. Tracking resource use relative to planetary boundaries in a steady-state framework: A case study of Canada and Spain. Ecol. Indic. 2016, 69, 836–849. [Google Scholar] [CrossRef]
  50. UN General Assembly, Transforming our world: The 2030 Agenda for Sustainable Development, 21 October 2015, A/RES/70/1. Available online: https://www.un.org/ga/search/view_doc.asp?symbol=A/RES/70/1&Lang=E (accessed on 20 December 2020).
  51. Environment Agency. Greenhouse Gas Emissions. 2020 [Data Set]. Available online: https://ec.europa.eu/eurostat/tgm/refreshTableAction.do?tab=table&plugin=1&pcode=sdg_13_10&language=en (accessed on 3 November 2020).
  52. Eurostat. Air Emissions Intensities by NACE Rev. 2 Activity. 2020 [Data Set]. Available online: https://ec.europa.eu/eurostat/databrowser/view/env_ac_aeint_r2/default/table?lang=en (accessed on 5 November 2020).
  53. Ministry of Environment of the Czech Republic. Politika Ochrany Klimatu. 2017. Available online: https://www.mzp.cz/C1257458002F0DC7/cz/politika_ochrany_klimatu_2017/$FILE/OEOK-POK-20170329.pdf (accessed on 23 November 2020).
  54. Knoblauch, C.; Beer, C.; Liebner, S.; Grigoriev, M.N.; Pfeiffer, E.M. Methane production as key to the greenhouse gas budget of thawing permafrost. Nat. Clim. Change 2018, 8, 309–312. [Google Scholar] [CrossRef] [Green Version]
  55. Petrescu, A.M.R.; Lohila, A.; Tuovinen, J.P. The uncertain climate footprint of wetlands under human pressure. Proc. Natl. Acad. Sci. USA 2015, 112, 4594–4599. [Google Scholar] [CrossRef] [Green Version]
  56. Bjorn, A.; Sim, S.; King, H.; Keys, P.; Wang-Erlandsson, L.; Cornell, S.E.; Margni, M.; Bulle, C. Challenges and opportunities towards improved application of the planetary boundary for land-system change in the life cycle assessment of product. Sci. Total Environ. 2019, 696, 133964. [Google Scholar] [CrossRef]
  57. Zelenakova, M.; Labant, S.; Zvijakova, L.; Weiss, E.; Cepelova, H.; Weiss, R.; Fialova, J.; Mind’as, J. Methodology for environmental assessment of proposed activity using risk analysis. Environ. Assess. Impact Rev. 2020, 80, 106333. [Google Scholar] [CrossRef]
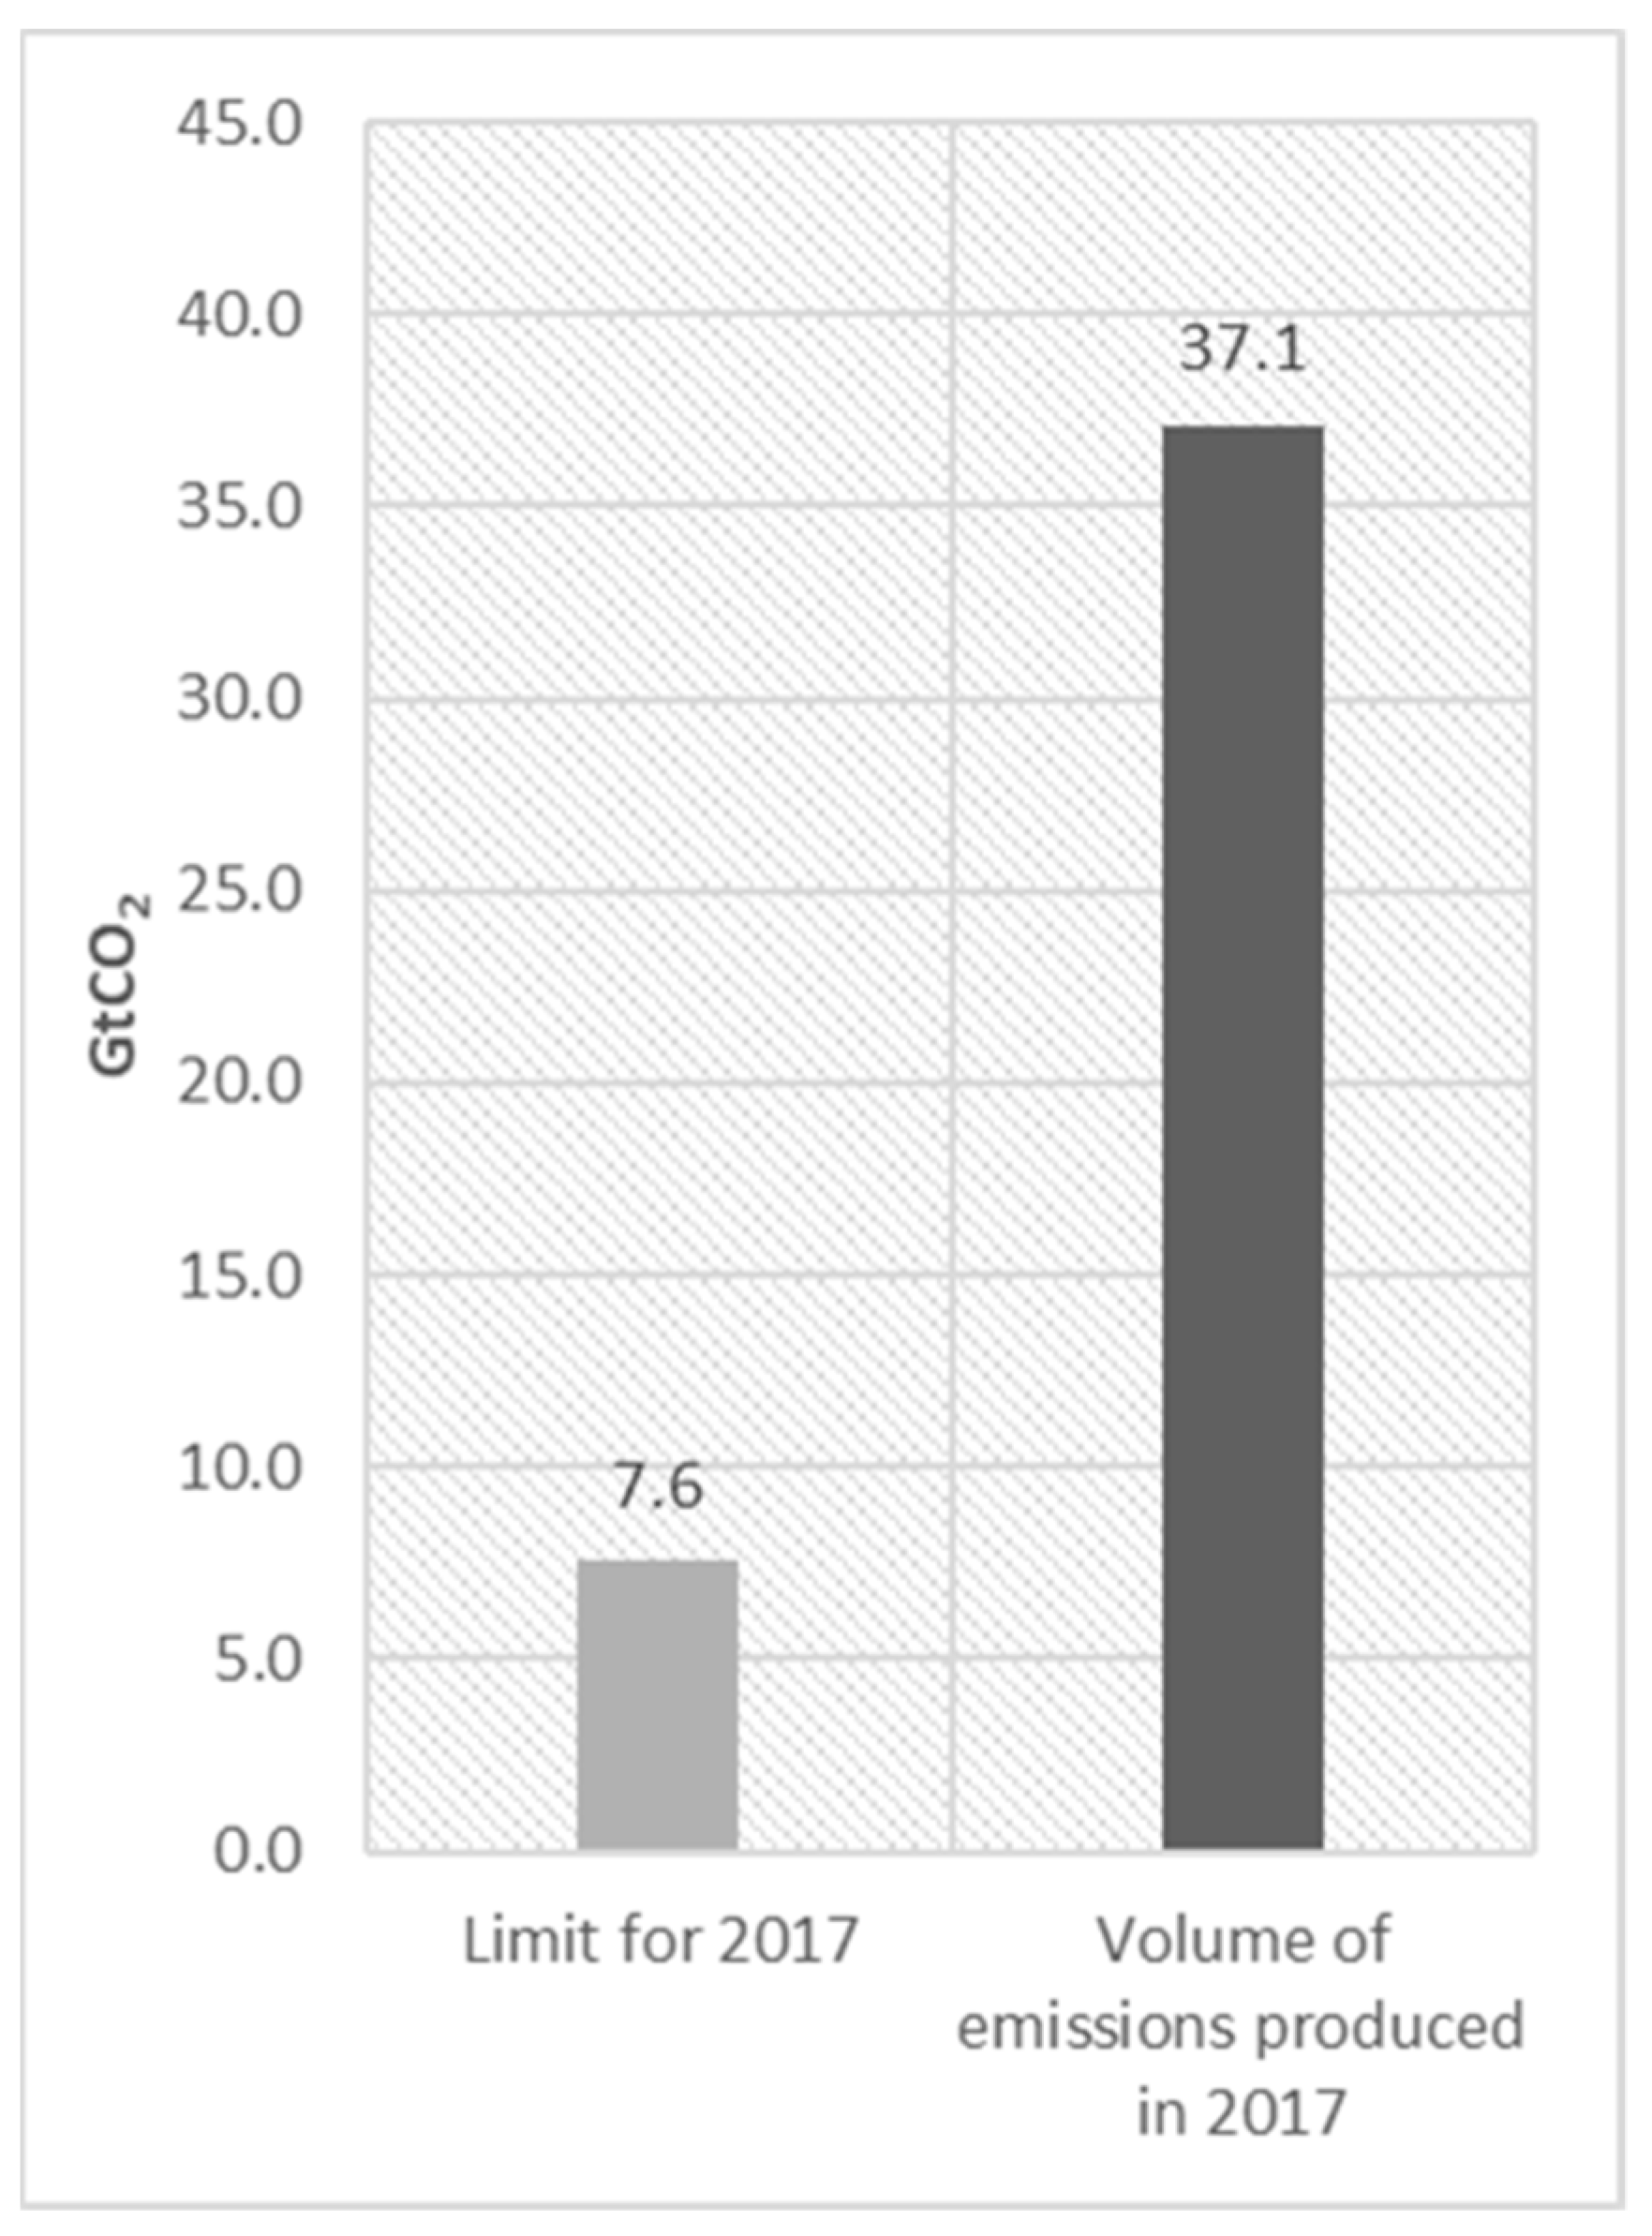
Figure 1. Global CO2 emission limit in 2017 in relation to the volume of global CO2 emissions produced in 2017.
Sustainability 13 02164 g001
Figure 2. National CO2 emission limit in 2017 in relation to the volume of CO2 emissions produced in the Czech Republic in 2017.
Sustainability 13 02164 g002
Figure 3. Production and consumption-based CO2 emissions, Czech Republic (note: The table shows data on CO2 emissions from fossil fuels and cement production; land cover is not included).
Sustainability 13 02164 g003
Figure 4. National CO2 limit for 2017 in terms of different distribution methods and volume of emissions produced in 2017.
Sustainability 13 02164 g004
Figure 5. Emission limits and volumes of CO2 emissions produced in 2017 in Visegrad countries.
Sustainability 13 02164 g005
Figure 6. Emission limits in Visegrad countries based on the model considering (1) the equal share per capita adjusted for past emissions and GDP; (2) equal share per capita adjusted for past emissions.
Sustainability 13 02164 g006
Figure 7. National CO2 limit from 2017 onwards in terms of various distribution methods and expected volume of national CO2 emissions from 2017 until 2050 with regard to the national climate change policy.
Sustainability 13 02164 g007
Table 1. Maximum volume of emissions since 1861-1880 required to limit the warming to less than 2 °C according to the different levels of confidence [38].
Level of ConfidenceMaximum Cumulative EmissionsMaximum Cumulative Emissions Accounting for Non-CO2 Forcing
>33%1570 GtC (5760 GtCO2)900 GtC (3300 GtCO2)
>50%1210 GtC (4440 GtCO2)820 GtC (3010 GtCO2)
>66%1000 GtC (3670 GtCO2)790 GtC (2900 GtCO2)
Table 2. Variables used for calculation of the global budget over time from 2017 onwards.
VariableDescription
F E w Maximum global future CO2 emissions from 2017 onwards
M a x C O 2 Maximum cumulative global emissions accounting for non-CO2 forcing with >66% probability to stay below 2 °C
P E 1870 2011 Past global CO2 emissions from 1870 until 2011
P E 2012 2016 Past global CO2 emissions from 2012 until 2016
Table 3. Variables used for calculation of the national budget over time from 2017 onwards.
VariableDescription
F E C Z Maximum future CO2 emissions from 2017 onwards in the Czech Republic
P O P C Z 1990 Czech population in 1990
P O P W 1990 World population in 1990
F E w Maximum global CO2 emissions from 2017 onwards
P E W World past emissions from 1990 until 2016
P E C Z Past production-based CO2 emissions from 1990 until 2016 in the Czech Republic
G D P W 2017 world average GDP per capita in PPP (constant 2017 international $)
G D P C Z 2017 Czech GDP per capita in PPP (constant 2017 international $)
S W Sum of all countries’ GDP-adjusted FE
Table 4. National CO2 reduction targets.
20052020203020402050Year
1461141027039MtCO2eq.
11892835732MtCO2
Source: Ministry of the Environment of the Czech Republic and own calculation; note: The values in MtCO2 should be regarded as indicative as they were calculated using the share of CO2 in the overall greenhouse gases (GHG) structure in 2005 as a point of reference.
Table 5. Global and national CO2 limits.
GlobalNational (Czech Republic)
Budget 2017–2100825 GtCO248.7 MtCO2
Budget per year9.9 GtCO20.6 MtCO2
Limit 20177.6 GtCO20.6 MtCO2
Per capita yearly1 tCO20.06 tCO2
Publisher’s Note: MDPI stays neutral with regard to jurisdictional claims in published maps and institutional affiliations.